1. Introduction
Due to the proliferation of Internet of Things (IoT) devices and the advent of several applications that require low-latency and real-time access, such as self-directed vehicles [
1], economic exchange [
2], collecting data either passively or actively with the help of a mobile phone [
3], using a free mobile app, communities having the ability to broadcast live sporting events [
4], etc., the demand for high-data-rate mobile traffic has been steadily rising. The Fourth Generation (4G) of broadband cellular networks [
5,
6] is no longer able to fulfill our modern bandwidth and latency requirements (i.e., 5 ms latency) in the IoT [
5,
6,
7]. Contemporary WAN protocols such as Frame Relay, X.25, and TCP/IP use packet-switching technology. They have long transmission, processing, queuing, and propagation times. The technology underlying 4G was developed to accommodate these protocols. Additionally, because of the extremely high energy consumption [
8] of the 4G design, battery consumption and environmental issues have not been entirely addressed.
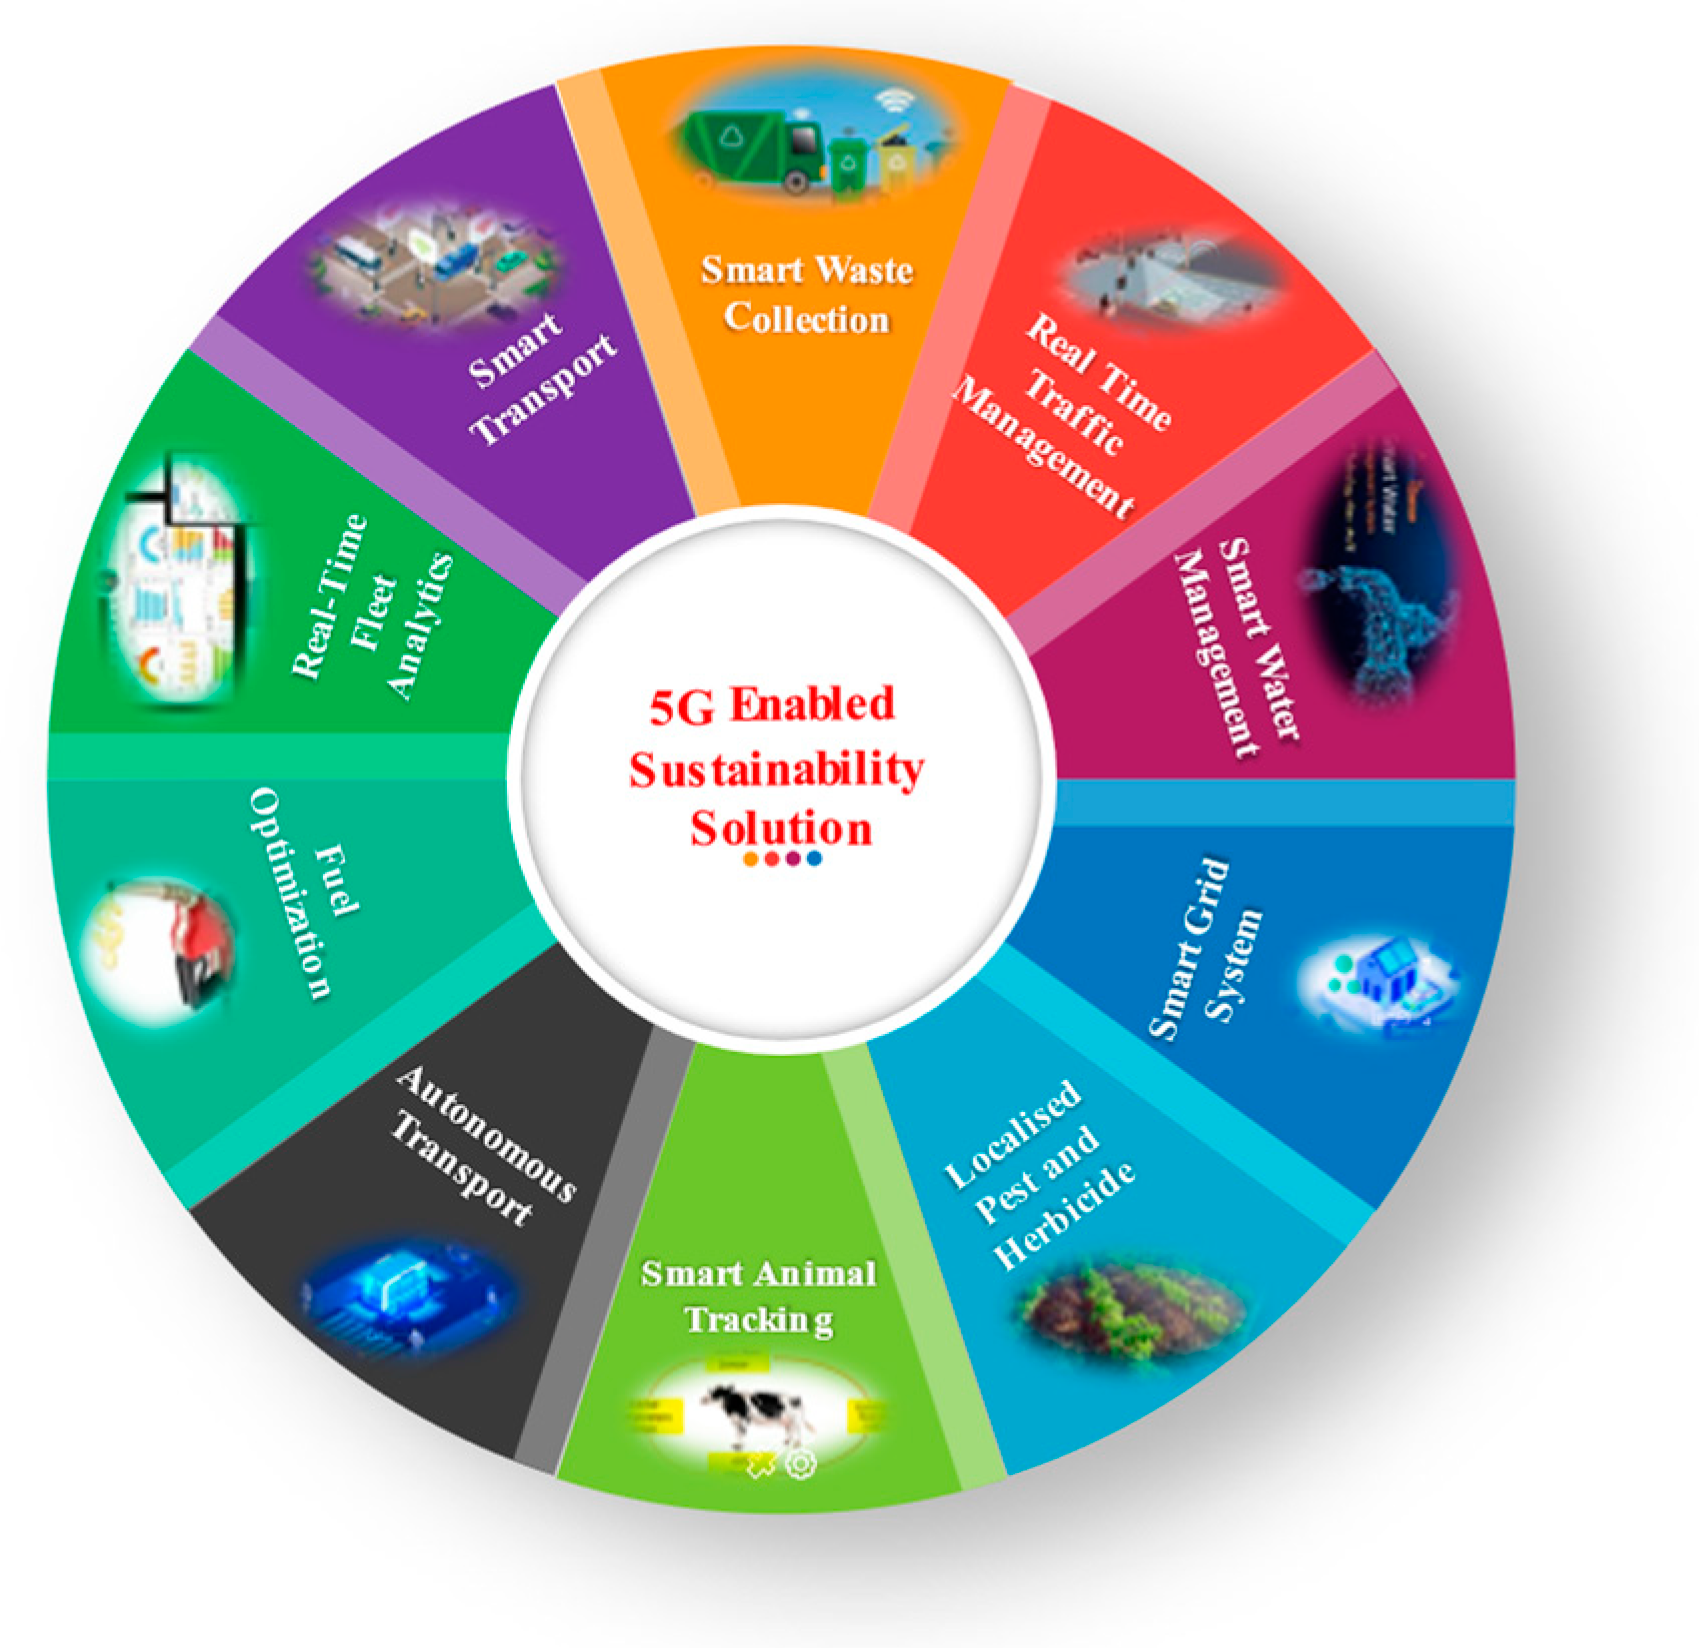
Figure 1 shows the numerous applications of 5G wireless networks for sustainability.
Fifth-generation (5G) wireless networks were suggested to overcome these restrictions and meet these needs in a variety of situations, including ultra-high traffic density, connection reliability, and low-latency mobility [
9]. Unlike earlier generations, 5G cellular networks can benefit from virtual or cloud-based radio access networks (RANs) [
10]. It supports massive IoT devices that are continually connected and require very little power. With a wide range of frequencies, up to GHz, 5G can meet the enormous traffic demand and offer quick access, deliver high data rates, extend coverage, and integrate network infrastructure into all mobile communication systems’ hardware [
11,
12]. Cutting-edge antenna technologies are driving the adoption of mmWave carrier frequencies. When compared to microwave, mmWave offers many unlicensed spectra that enable improved cell-edge coverage, large bandwidth (BW), reduced transmission interference from nearby cells, and, most critically, frequency reuse over a short distance. Cognitive radio techniques will be incorporated by 5G to provide the best delivery option in a dynamic radio environment. Many more IoT devices can be supported at substantially higher data rates thanks to hybrid beamforming and massive multiple inputs and multiple outputs (MIMO). Low latency is achieved with network scalability and adaptability. However, its transformation into the realm of 5G networks is a costly and complex endeavor. It requires thorough planning and preparation. Both the subscriber radio access network and the data transmission network need to be updated. Since the change will take place within the subscriber network, it is essential to create strategies that make network resource updates transparent for users and affordable for mobile operators. Rethinking network planning tactics, which was shown to be an NP-hard problem, is crucial for achieving the best placement of the radio access networks because 5G comes with a huge installation price and an exponential increase in the consumption of mobile data services. The proposed new spectrum bands range from sub-
GHz-frequency mid bands or Frequency Range 1 (FR1) to high-frequency bands in the mmWave range (24–100 GHz) or Frequency Range 2 (FR2), according to the 5G New Radio (NR) standards. While adopting the mmWave bands for 5G results in better bandwidth, it also has limited coverage that can only be surpassed by a significant network densification that involves widely dispersed remote radio units (RRUs) throughout the area of interest.
There is no doubt that this results in greater installation and maintenance costs. The use of sub- GHz RRUs, on the other hand, results in greater network coverage and, as a result, reduced costs, but this comes with a restriction on network bandwidth because sub- GHz bands operate with a constrained bandwidth. The two main categories of cell deployment designs are solo and heterogeneous systems. When discussing 5G, “former” means a network deployment with only mmWave small cells, while “latter” refers to deploying mmWave small cells on existing macro-relay networks using hierarchical or mixed cell architectures. The mmWave small cells could significantly boost the system capacity because of their much wider bandwidth, beamforming and MIMO capabilities, and shorter access link distances.
In this article, we will be discussing a network design that involves the use of urban macro-cell (UMa) RRUs, also referred to as MRRUs, in the sub- GHz spectrum. These antennas are deployed in areas that are not covered by mmWave urban micro-cell (UMi) RRUs, also known as mRRUs, which provide high data rates within short distances. UMa antennas, on the other hand, offer extended coverage over longer distances. Therefore, to meet the coverage and bandwidth requirements, the MRRUs and mRRUs must be properly positioned. The suggested architecture examines the trade-off between (a) widespread MRRUs deployment, which improves quality of service (QoS) and lowers installation costs, and (b) sparse mRRUs deployment, which improves QoS but increases implementation costs. Our study aims to establish a hybrid technique that satisfies user traffic requirements and coverage constraints during the planning process. The technique will determine the minimal number and best locations of necessary MRRUs and mRRUs to be placed in a region of interest. We then take the following actions to accomplish this:
Parameters and user need identification: For a certain geographic area, we first identify the proper system parameters and user needs. The latter can be divided into numerous subareas with various user densities and distributions. We rely on the 3GPP standard and employ Frequency Range 1 (FR1), or 6 GHz, and Frequency Range 2 (FR2), or 28 GHz, to design for MRRUs and mRRUs [
13].
Initial MRRU and mRRU counts: Preliminary coverage and cell capacity dimensioning stages are carried out once the relevant system parameters have been defined to determine the starting number of MRRUs and mRRUs that can each provide the requisite QoS.
Downlink and Uplink data rates: The MRRUs and mRRUs will then work together to establish their ideal placements to achieve the requisite coverage and downlink (DL) and uplink (UL) data rates.
Eliminating redundant MRRUs and mRRUs: Finally, a method that iteratively removes unnecessary MRRUs and mRRUs while maintaining the required level of coverage and providing a data rate for each subarea is intended.
2. Materials and Methods
In the context of earlier generations, the network design problem has been thoroughly studied [
6,
14,
15]. For instance, the authors advocated using probabilistic techniques to move the position of eNodeB nodes while considering the construction of LTE cells [
16]. To find the best site for the base station (BS), the authors suggested a greedy BS deployment algorithm [
17]. To reduce the impact of cell edge effects, the deployment is based on core areas. The authors looked at the placement of various user distributions in the target area after selecting the parameters used for input and the number of base stations in the LTE network [
16]. The short wavelength of the mm waves limits the range. Therefore, in theory, a significant number of mRRUs must be installed in a cellular network. Most of the research work already conducted [
18,
19,
20] dealt with mRRU solo planning. For example, the energy efficiency potential of 5G mobile networks is analyzed, and an analytical model for 5G cloud planning and sizing RAN is reported in [
21]. Other studies take a different angle on the planning and deployment of the 5G network. Masoudi et al. suggested a method for figuring out where base stations should be placed to maximize the coverage of various 5G frequencies in urban settings [
22]. A unique open-source techno-economic assessment tool for 5G deployment in macro-cellular scenarios was proposed [
23] to reduce costs through infrastructure sharing [
24]. In Ref. [
16], the authors discuss capacity and coverage planning and analyze coverage and capacity adaptation techniques to improve 4G LTE networks for the upcoming deployment of 5G in non-autonomous scenarios. The authors of [
25] suggest that, in 5G networks, edge device deployment should be optimized while cost and energy usage are kept to a minimum. Edward et al. present a comprehensive technical and economic analysis based on different architecture scenarios to reduce the cost of 5G deployment [
26]. However, the report does not address coverage, capacity, or quality of service. Using only mmWave transmissions, the authors of [
27] developed a standalone 5G architecture. Recent research [
28] looked at how the MNO could plan its 5G network to maximize profitability with the least amount of deployment overhead. The authors of [
29] studied the deployment of ultra-dense 5G networks and developed a genetic algorithm with non-dominated sorting to address the cell scheduling problem. In order to accommodate user traffic demand during the ultra-dense deployment phase in the mmWave band, the authors of [
30] advocated increasing sectorization and the number of antennas. Tseng et al. [
31,
32] investigated the installation of an ultra-dense network with various BSs running at frequencies ranging from GHz to GHz. However, the positioning of BSs during the cell planning process in a real-world scenario, as well as the customers’ data rate requirements and cell coverage restrictions, were not considered.
For instance, IoT sensors on the factory floor use the high band for optimum performance, whereas 5G communications that can travel dozens of miles will use the low band. These bands are used to ensure that 5G signals not only travel farther but also pass through objects like glass, sheet metal, and concrete [
33].
The ability to entirely control your own 5G network is one of the main advantages that is frequently overlooked. Organizations that reclaim control of their cellular resources can modify those resources to fulfill specified service-level agreements (SLAs), uptime needs, and business goals when they own their spectrum license, infrastructure, and devices. With 5G, transmission speeds will improve along with network capacity and latency.
2.1. 5G Fronthaul Network Architecture, Connectivity, and Intelligence Splits
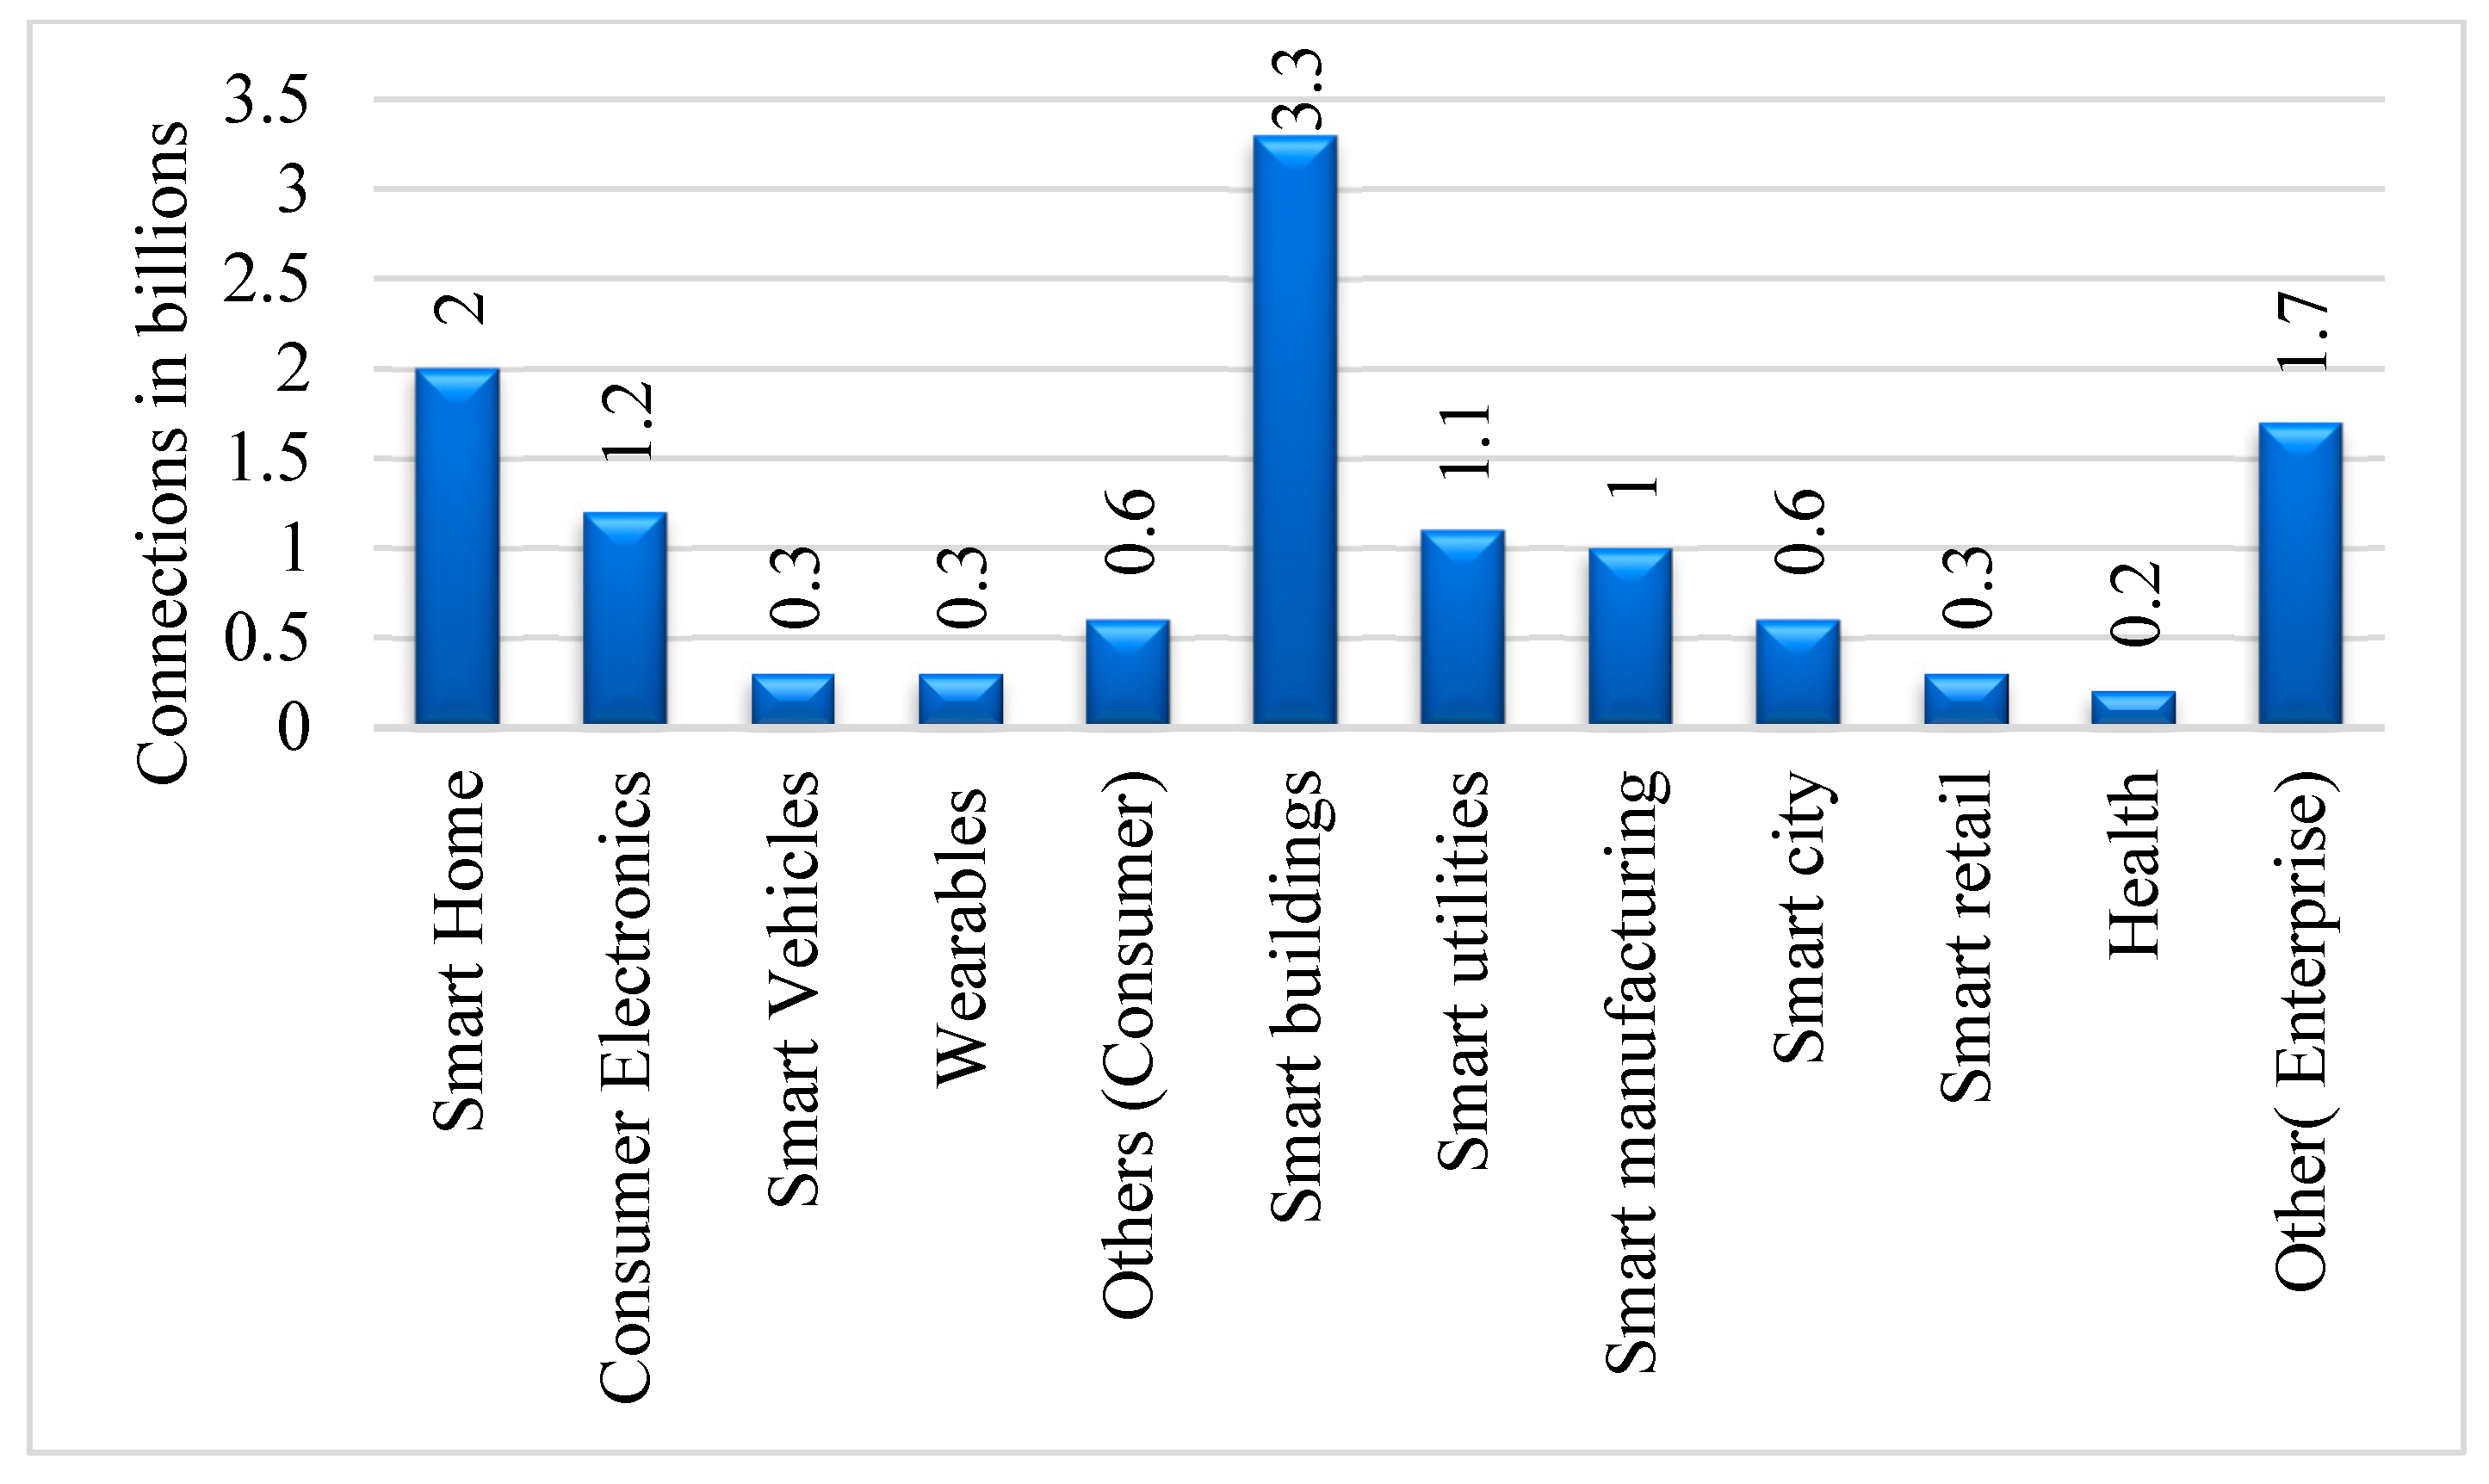
IoT connections are predicted to increase from 12 billion in 2019 to 24.6 billion by 2025 [
34]. Most of these 12.6 billion new connections are expected to come from smart homes and smart buildings, with 3.3 billion and 2 billion new connections, respectively. In addition, it is anticipated that, between 2016 and 2021, the amount of mobile data traffic worldwide will increase sevenfold, at a CAGR of 47%, to a total of 49 exabytes per month [
35]. Video streaming will account for most of this traffic as emerging use cases such as virtual reality machine-to-machine and augmented reality interaction emerge. Current 4G networks cannot easily handle sudden surges in traffic.
Figure 2 shows that the number of IoT connections will grow from 12 billion in 2019 to approximately 25 billion in 2025.
An increase in wireless traffic capacity of about 1000 times is what 5G networks aim to achieve [
36]. This new capability will enable significant improvements in self-driving cars, smart grids, efficient disaster response, and other fields. In addition to having more capacity than 4G, 5G networks have 100 times higher data throughput, less than 1 millisecond latency, less energy usage, and more dependable connectivity [
37]. Wireless networks will advance to meet the demands of 5G, growing in speed, intelligence, and complexity. Three key strategies are being used by wireless operators and telco equipment makers to become ready for the higher needs of 5G.
While older IoT devices operate at frequencies below 6 GHz, data transfer at frequencies up to 300 GHz uses centimeter-wave (cm-wave) and millimeter-wave (mm-wave) technologies [
38]. To aid in boosting network density, construct small-cell networks that offer faster speeds and a larger range of devices. A single antenna can better serve a larger range of clients and use cases by using beamforming and multiple-input multiple-output (MIMO) antennas with tens or hundreds of elements each [
39].
The devices and use cases that 5G networks will support will be diverse in terms of vertical, horizontal, and architectural diversity. However, as networks become less centralized and more complex, the need for fronthaul networks has increased and will continue to increase.
2.2. Functional Split in 5G Networks
The earlier RAN architectures of 2G, 3G, and 4G were based on monolithic building blocks with little interaction between logical nodes. Since the beginning of research on new radio stations (NR), it has been argued that dividing the gNB (NR logical node) into CU and DU provides flexibility [
40]. Scalable and affordable network implementation can be achieved through flexible hardware and software implementations, but only if hardware and software components from different vendors are combined, adapted, and interoperable. A split architecture between centralized and decentralized entities is needed to accommodate the different use cases and QoS that games, voice, and video must support [
41]. These QoS aspects have variable delay tolerances depending on transport, different deployment scenarios (e.g., rural or urban), and different transmission schemes (fiber, etc.). It also tunes performance characteristics, load management, and performance optimization in real time [
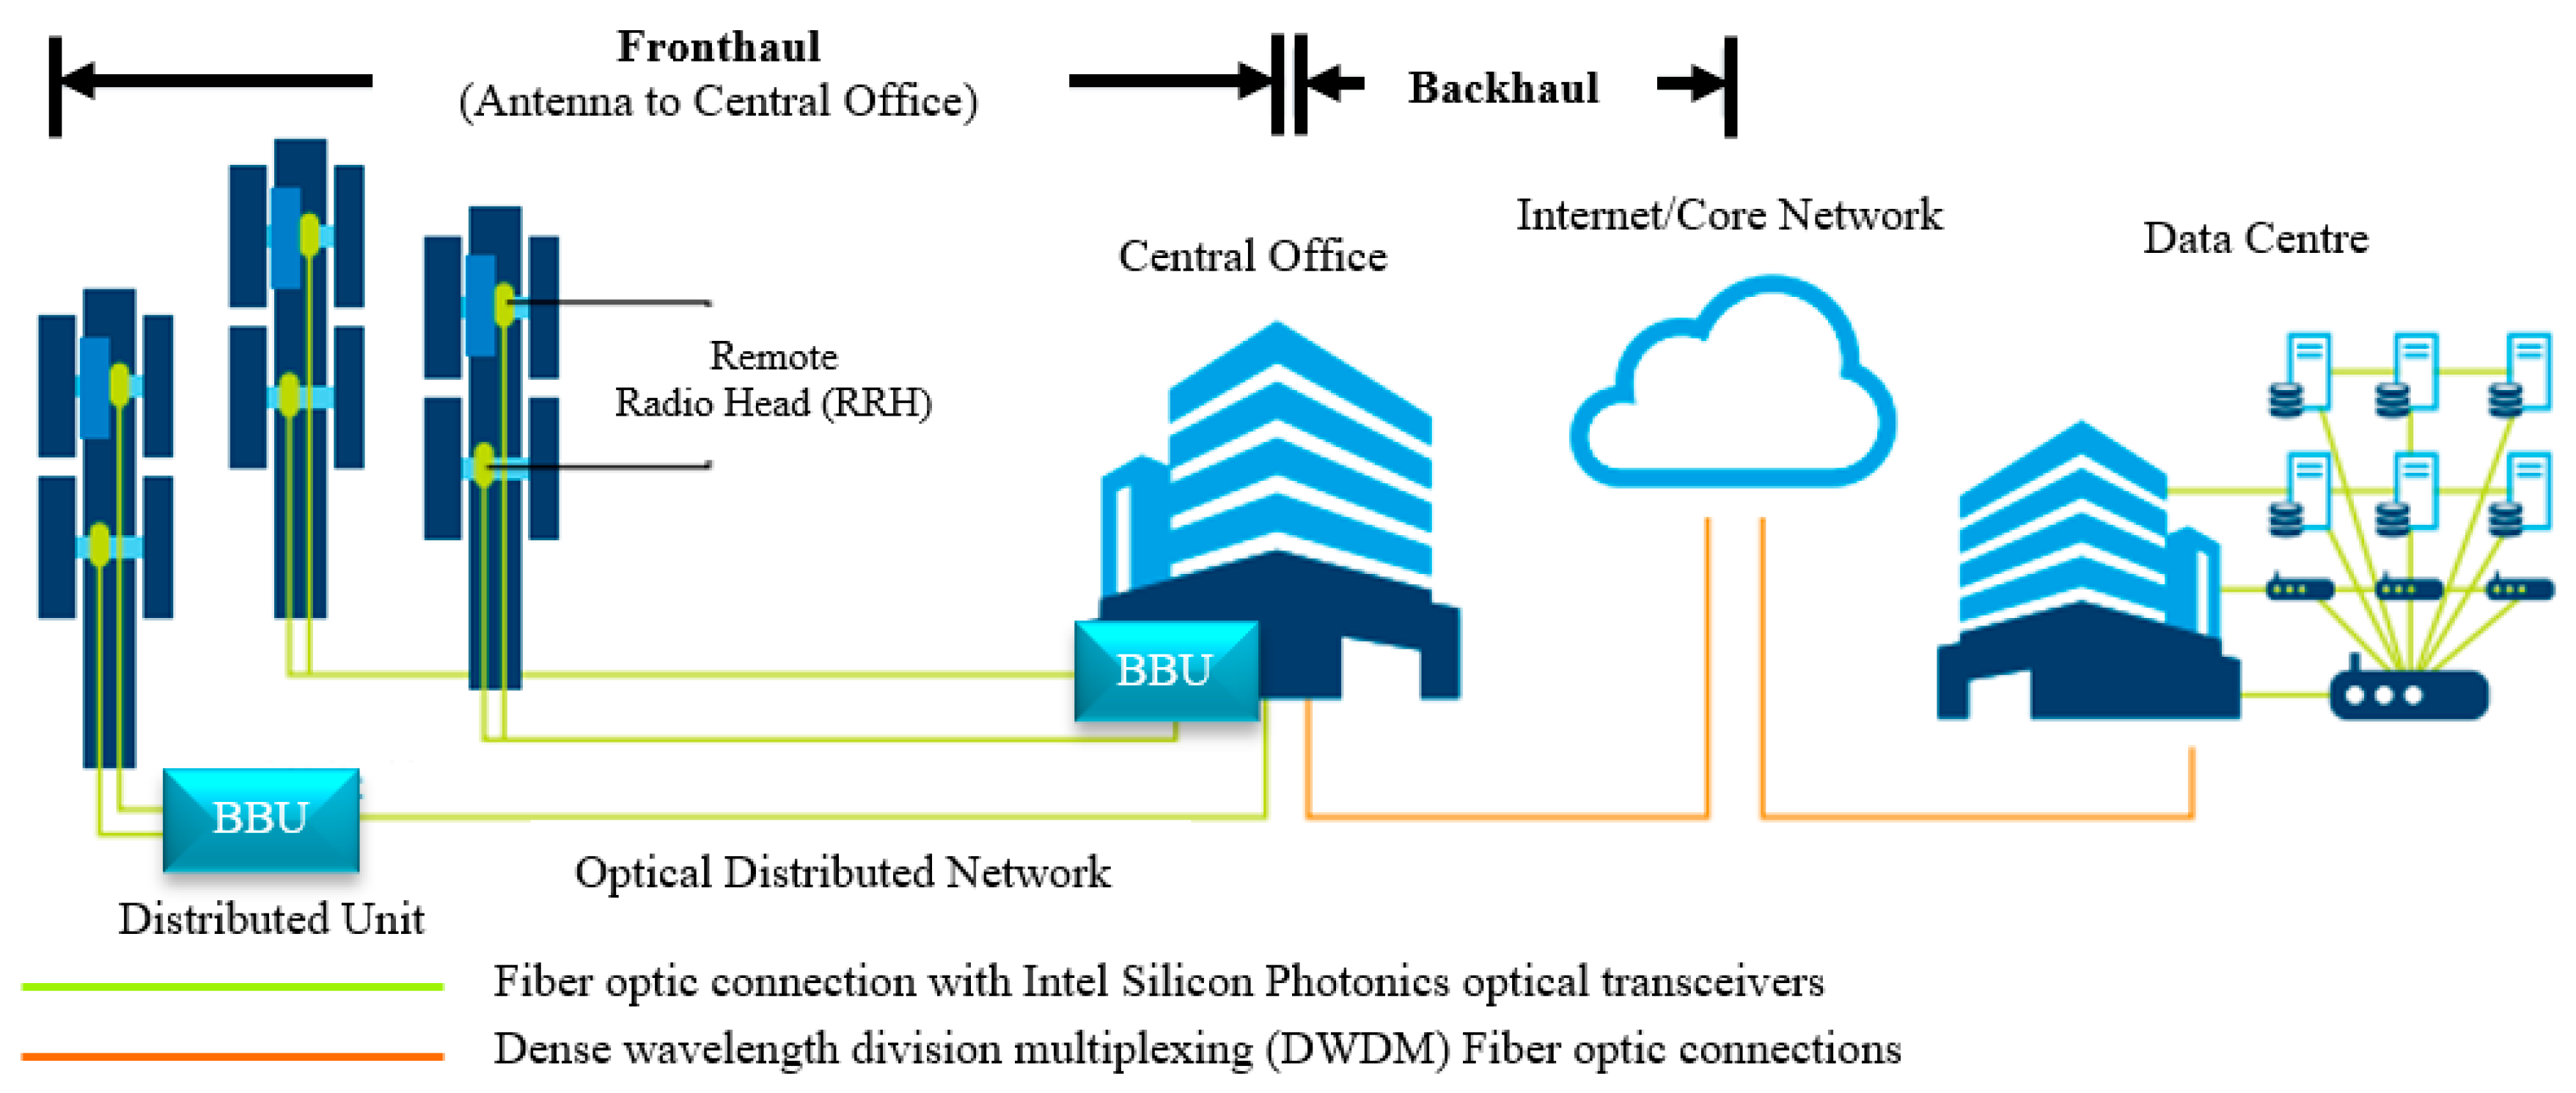
42]. The fronthaul refers to the connection from the cell site antenna to the central office where the baseband unit is housed, with the option for distributed units (DUs) with added intelligence processing closer to the antenna is shown in
Figure 3.
The dynamic architecture of Parallel Wireless enables mobile operators to use various 3GPP-compatible splits depending on the architecture and infrastructure availability. While higher splits are preferred for rural deployment, lower splits will be the best option for crowded metropolitan areas. Lower-level splits must use almost perfect fronthauls (FHs), but higher-level splits can use less-than-ideal FHs [
43]. By utilizing various software implementations, Parallel Wireless’ dynamic approach will allow mobile operators to select any RAN splits based on the same hardware and network components. If network conditions change, these splits will also be upgradeable via software. Depending on FH availability and system architecture, different protocol layers will sit in various components. For mobile operators, this strategy will significantly lower their entire total cost of ownership (TCO). The decision about how to divide NR functions in the architecture is influenced by several radio network deployment scenarios, constraints, and desired supported use case variables. A variety of transport networks range from perfect to suboptimal in terms of performance [
44].
Mobile operators want the freedom to select various splits based on identical hardware, which is a standard product that currently exists and is readily available from commercial sources, as well as network components by employing various software implementations. Depending on fronthaul availability and deployment scenarios, different protocol layers will reside in different components. For mobile operators, this strategy will result in lower TCO and operational costs. In densely populated metropolitan regions, higher functional splits are preferable for capacity use cases, whereas lower functional divides will be the best choices for coverage use cases. Therefore, while less-than-ideal fronthaul is used for smaller functional splits, fronthaul performance is more crucial for higher functional splits.
Due to the increasing scale of 5G, a more effective interface is needed between the BBU and the RRH. This is a critical factor when industry groups are considering new network architectures [
38]. The fundamental question is how much processing power should be allocated to the BBU versus RRH. The use case determines the answer.
To provide the required speed, latency, and throughput, a network design can be customized to specific use cases and needs using configurable splits. Option 7 (xRAN 7-2x) also reduces the impact of changes to 3GPP specifications on the RRH, which is another advantage.
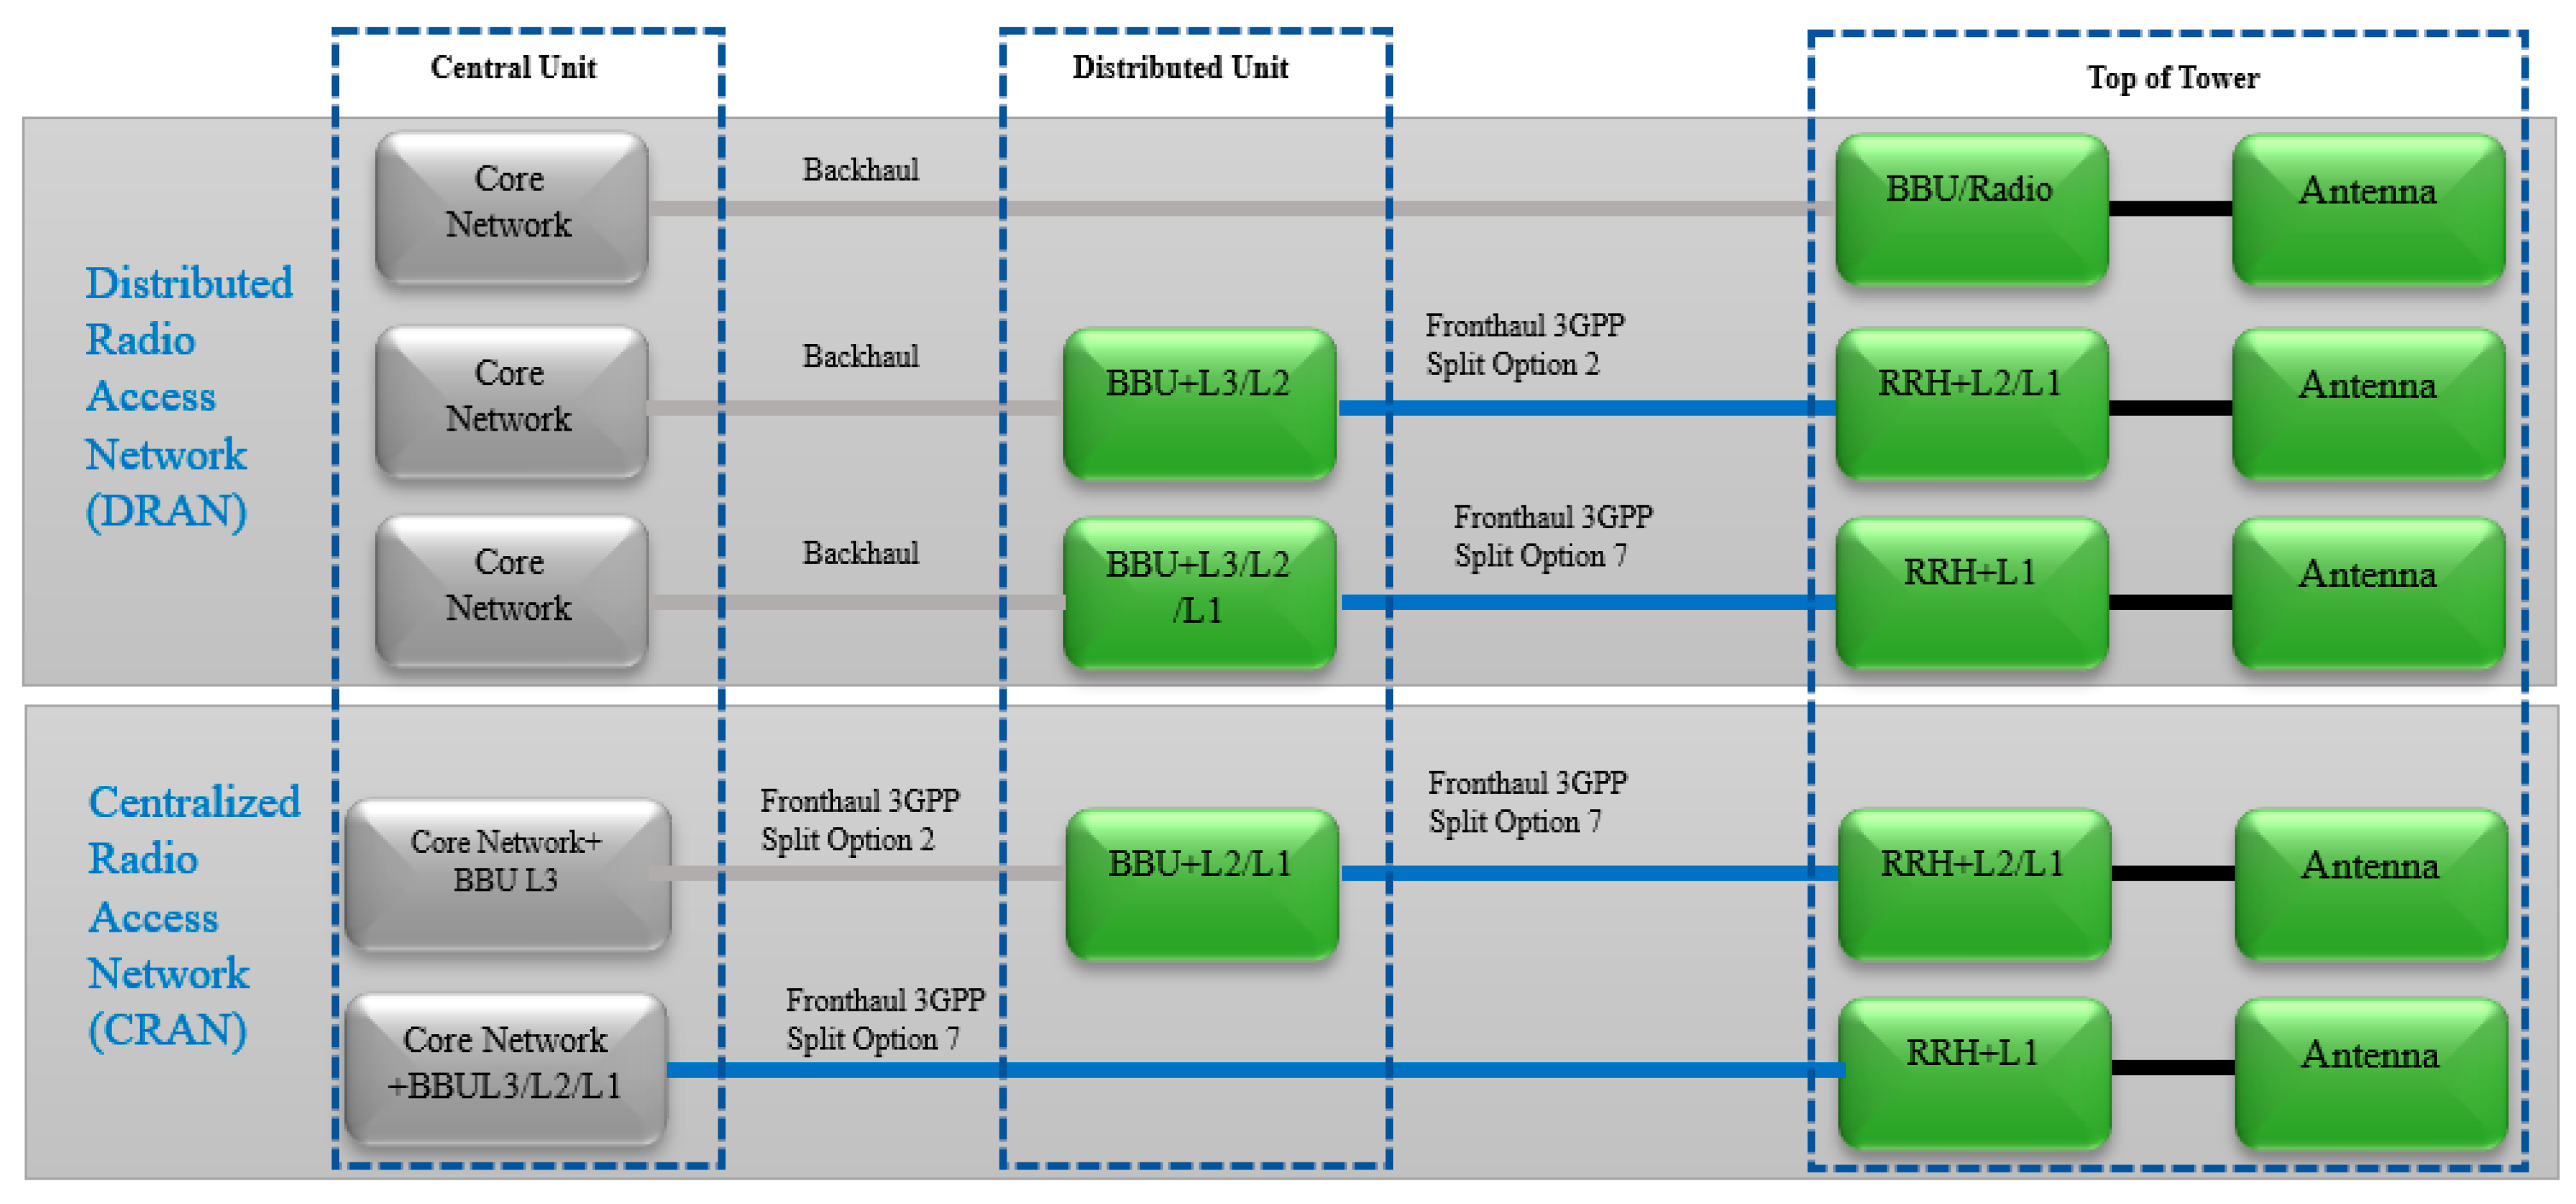
The topologies in
Figure 4 illustrate examples of centralized radio access networks (CRAN) with partially centralized RAN and fully centralized vRAN, as well as distributed radio access networks (DRAN) with the BBU either fully integrated in the tower or at a distribution site at or near the building. These architectures are band-independent and can operate in numerous bands from
GHz to mmWave.
A 4 × 4 antenna array with three sectors using a single carrier would need “around” a fronthaul capacity of about 34 Gbit/s with an option 7 split, while an 8 × 8 array would need about 67 Gbps, assuming a bandwidth of 100 MHz and a subcarrier 60 KHz. Further, 100G Silicon Photonics CWDM4 QSFP28 extended currently offers up to 100 of bandwidth, which is the perfect choice for the fronthaul network. The capacity required for the option two split fronthaul is significantly lower, so a lower capacity optical link is required. The split option used in this link is 7 (xRAN). With Intel Silicon photonics optical transceivers, the split option 7 DU to RRH connection of this design performs admirably. The extended-temperature or commercial-temperature variants of these transceivers can be used, depending on the implementation.
The use basis specimens earlier provided and reviewed in
Table 1 have demonstrated that the fronthaul rate requirements for 5G will be severe, even after considering some greater efficiency over CPRI. Silicon Photonics incorporates silicon’s light-emitting capability at the wafer level in the market’s only hybrid laser design. This approach eliminates the need for optical alignment and results in a production technique that makes use of high-volume silicon fabrication capabilities. This method offers significant scale, economic, and performance advantages. Additionally, Silicon Photonics optical transceivers enable software-defined infrastructure and network function virtualization, support several industry standards, and result in flexible network architecture and simple network maintenance [
45].
3. 5G Base Coverage Network Layout
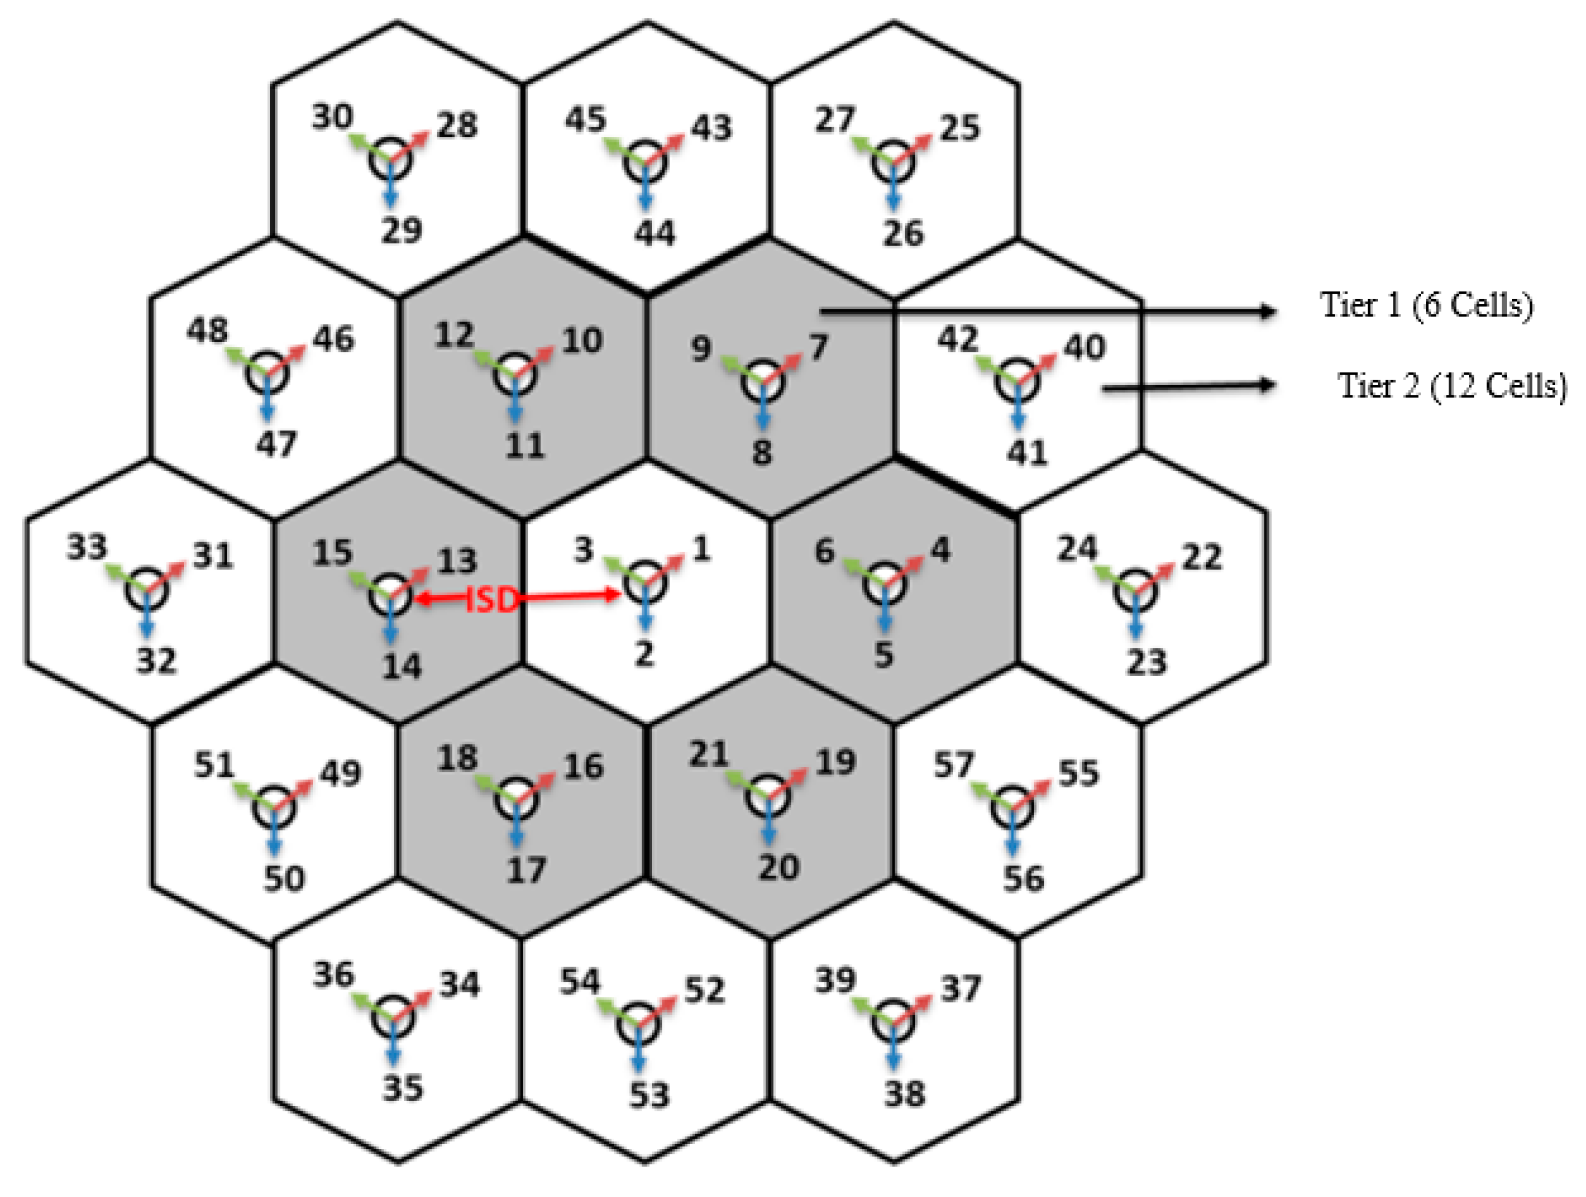
Base coverage urban, micro-cell, and rural/high-speed scenarios do not specifically take topographical data into account. On a regular grid, base stations are organized in a hexagonal arrangement. At Samabula Campus of Fiji National University, a straightforward hexagonal design shown in
Figure 5 is considered. This includes three cells per site, together with definitions of the fundamental geometry of the antenna. There will be a wraparound simulation with 19 sites and three cells per site. All users are distributed equally across the system. The channel bandwidth required in a link direction that is employed in the simulation is defined when the traditional frequency reuse method is considered.
Consider the urban macro-cell scenario column in
Table 2 for full buffer services as an example. The simulation bandwidths for FDD-based systems are 10 +
MHz, and they are
MHz for TDD-based systems. The spectrum produced by an FDD proposal with a frequency reuse ratio of 3 is 3 × 10 =
MHz for each link, or
MHz considering both up and downlink.
3.1. Best Suitable 5G Antenna Design for Fiji Geographical Terrain
In the deployment scenarios with the hexagonal grid layout (i.e., urban macro-cell, urban micro-cell, rural macro-cell, and suburban macro-cell), the antenna characteristics for base station (BS) and user terminal (UT) antennas, such as antenna pattern, gain, side-lobe level, orientation, etc., are described in this subsection and must be used for evaluation. Since the features do not meet any requirements, they should only be used for evaluation. The horizontal antenna pattern for each BS sector is as follows:
Figure 5.
The 5G network layout consists of 19 sites, each with three sectors, arranged in a hexagonal layout [
47].
Figure 5.
The 5G network layout consists of 19 sites, each with three sectors, arranged in a hexagonal layout [
47].
here,
is the 3 dB beamwidth (equivalent to
) and
is the maximum attenuation,
is the relative antenna gain (dB) in the direction,
, and
represents the minimal function.
In simulations that need height, a similar antenna arrangement will be applied. The antenna pattern in this instance will be provided by
represents the relative antenna gain (dB) in the elevation direction, . If nothing else is specified, it can be presumed that , is for the elevation 3 dB value. The tilt angle should be provided by telecommunication deployment engineer for each deployment scenario is denoted by the symbol .
This formula is used to calculate the combined antenna pattern at angles from the cardinal axes:
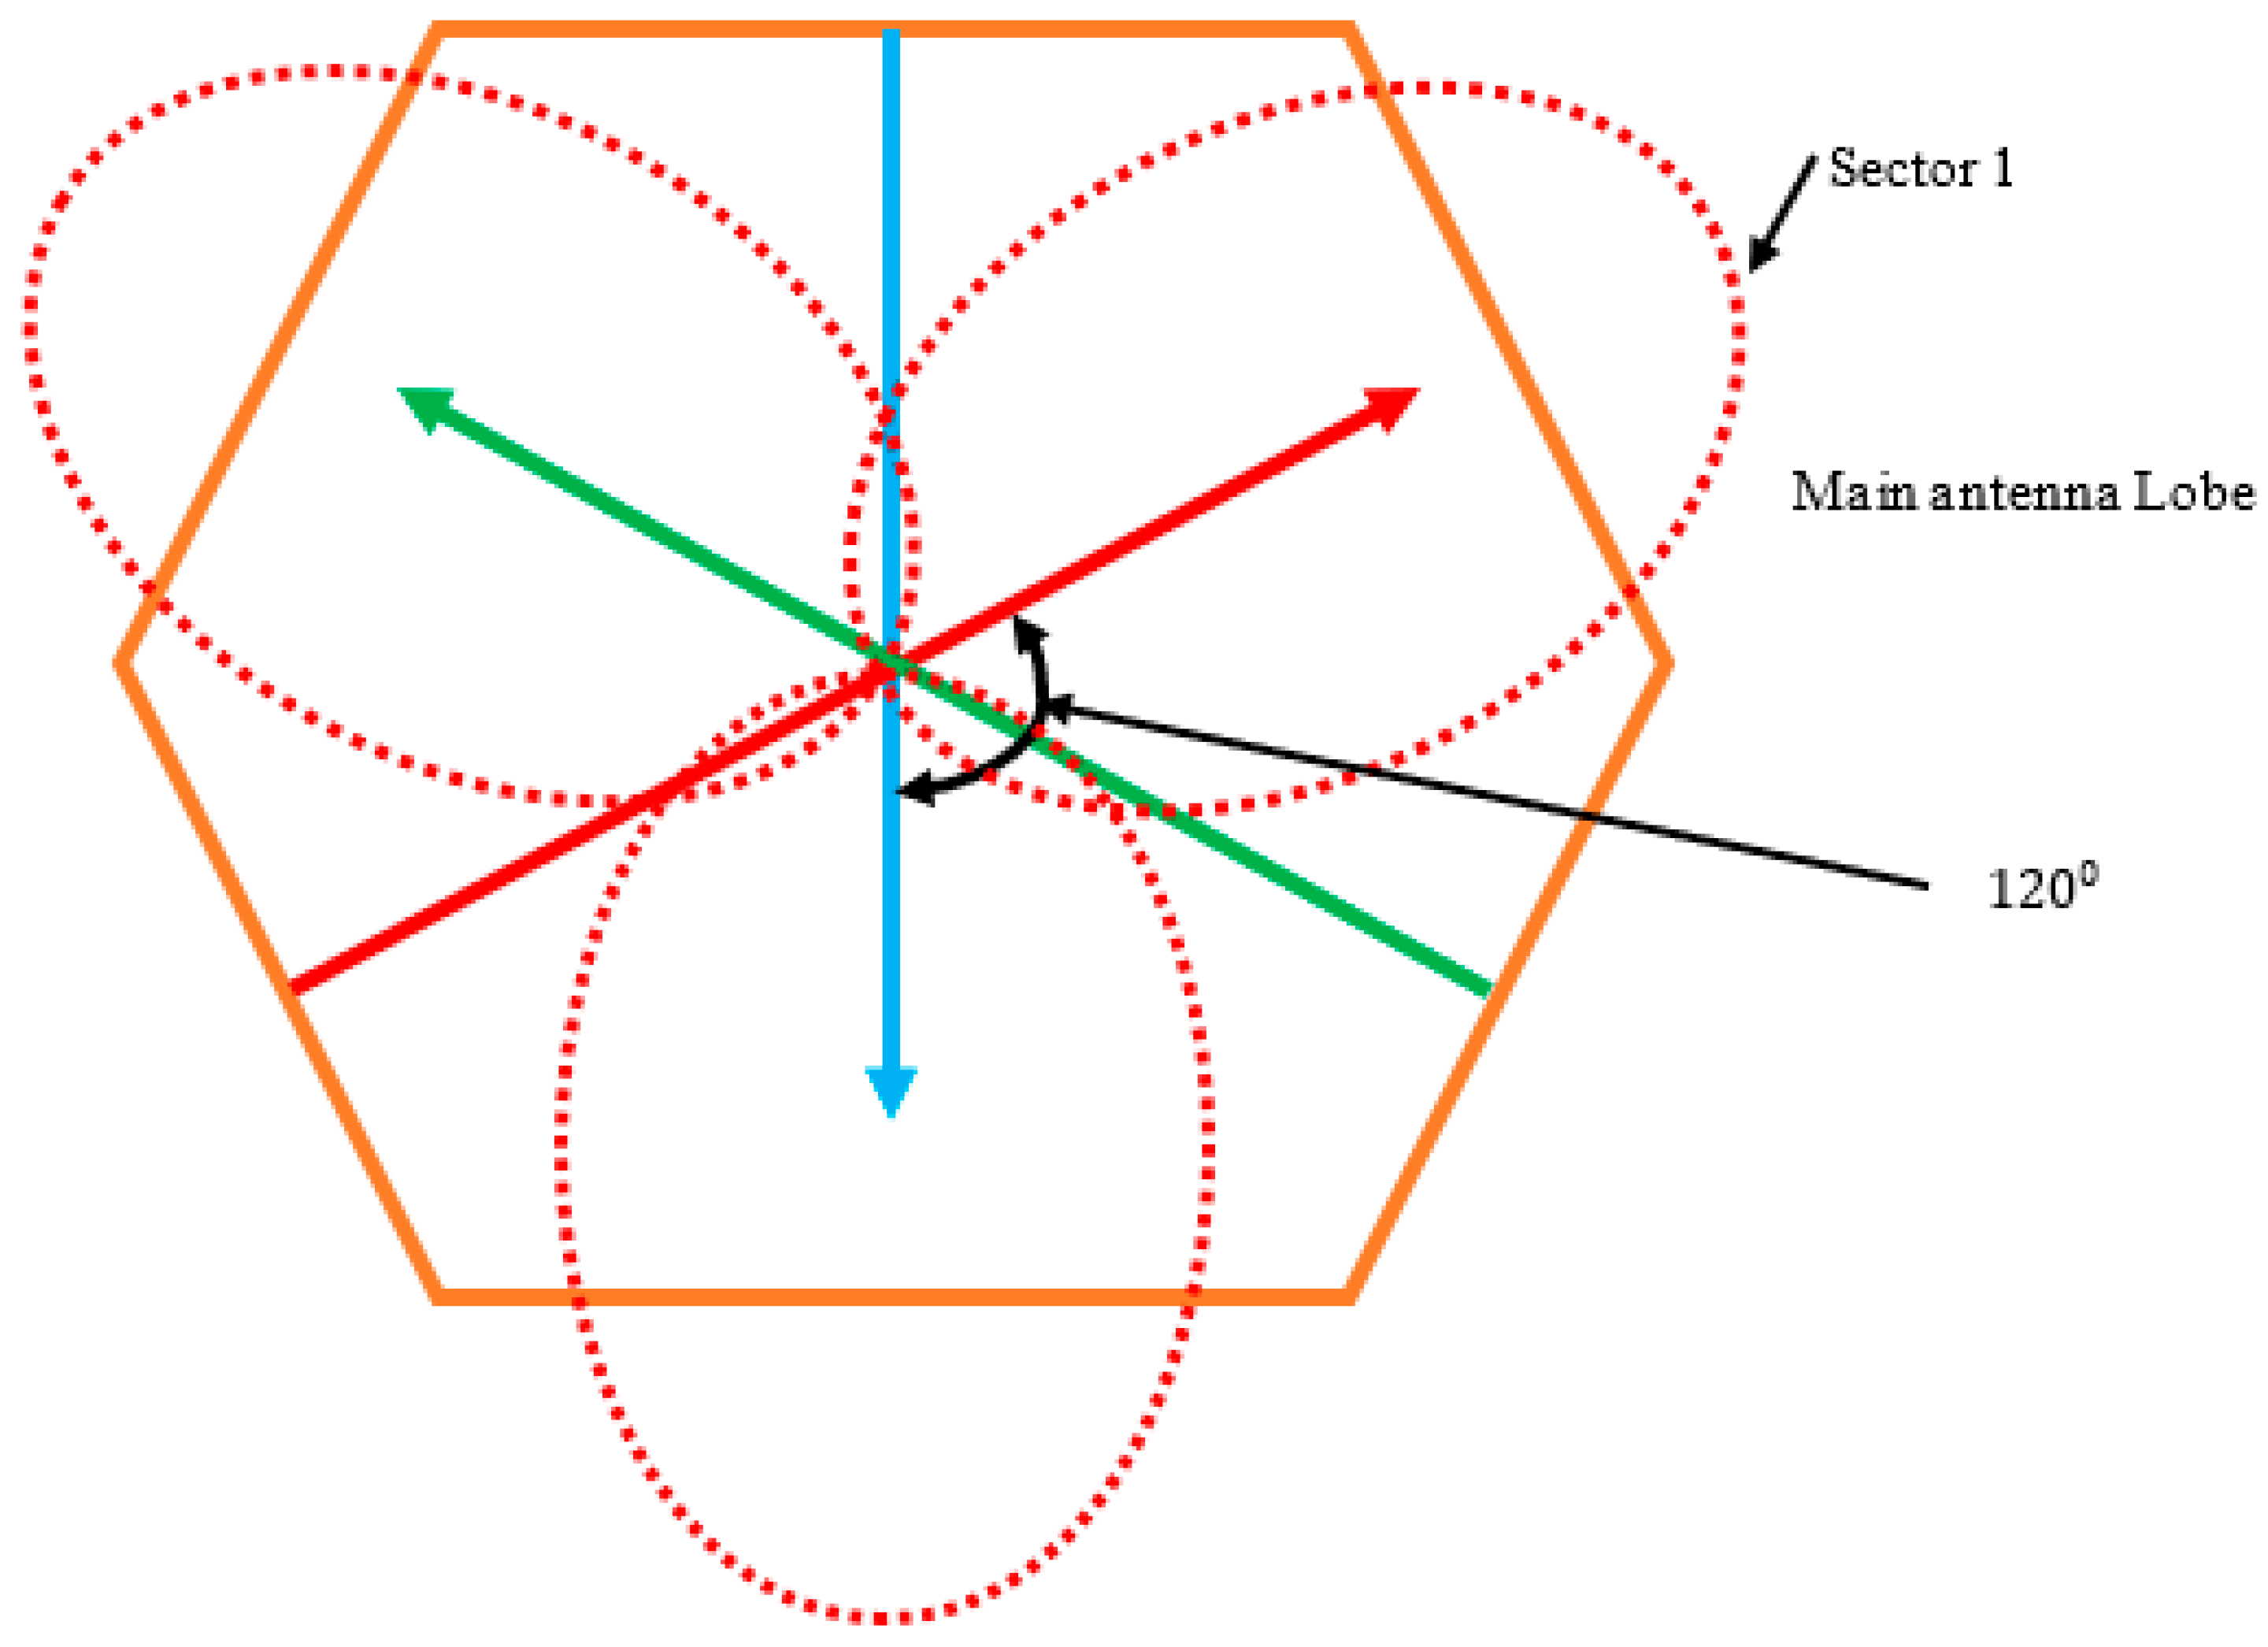
The antenna bearing is the angle in degrees between the center of the primary antenna lobe and a line pointing directly east. Each clockwise rotation increases the bearing angle.
Figure 6 shows the hexagonal cell and its three sectors, as well as the antenna bearing direction recommended for the simulations. The directions of the centers of the main antenna lobes in each sector point to the corresponding hexagonal side.
In the delay or angle domains, we compare the cluster to a propagation path that is distributed over space. Antenna arrays at both connection ends, propagation paths, and MIMO channel elements can be used in all circumstances, including indoor, urban, and rural ones in Oceania’s geographical terrain.
The
MIMO channel’s time-variant impulse response matrix is given by
where
represents time,
represents delay,
represents number of paths, and
represents path index. The channel matrix of dual polarization is
for cluster
and the antenna array response matrices
and
for the transmitter
and receiver
, respectively. The channel response matrix of dual polarization channel matrix is as follows:
The channel for cluster
n from
antenna element
s to
element
u is written as follows:
here,
The patterns of the fields for the vertical and horizontal polarizations of antenna elements are represented as and .
The complex gains of ray vertical-to-vertical and horizontal-to-vertical polarizations are represented as and
The carrier frequency’s wavelength is represented as
The unit vector for angle of departure is represented as
The unit vector for angle of arrival is represented as
The and respective elemental location vectors represented as and .
The ray’s doppler frequency components represented as .
All the small-scale parameters described above are time-variant, or functions of , when the radio channel is modeled as dynamic.
3.2. Antenna Array Design for 5G Transmission
Many new 5G-capable items operating in sub-GHz and mmWave bands are entering the market as the 5G rollout advances and researchers continue to propose 6G. Small stations/repeaters and handheld devices with 5G front ends use phased arrays as high-gain antenna systems to deliver great data throughput without reducing range at higher frequencies [
31]. The ITU-R report’s definition of base station antenna parameters for
GHz operating frequency is used in this paper [
48]. Path diversity, also known as MIMO, is provided by the antenna array, and it grows as the size of the array does [
49,
50,
51]. Due to their large losses, mmWave frequencies have never been thought to be viable for mobile device communication. GHz wireless antennas are not viable for long-distance communication in mobile devices because air attenuates signals more than at lower frequencies, necessitating the operation of transmitters at substantially higher power to compensate. The radiation emitted from a collection of antennas can be focused using beamforming techniques despite the attenuation of mmWave frequencies [
49,
52].
The phased array also allows for electronically adjusting each element’s phase, which can be utilized to redirect the radio beam away from directional interferences. This study demonstrates how using a larger size array for each transmitter at a cell site can also enhance the 5G network SINR.
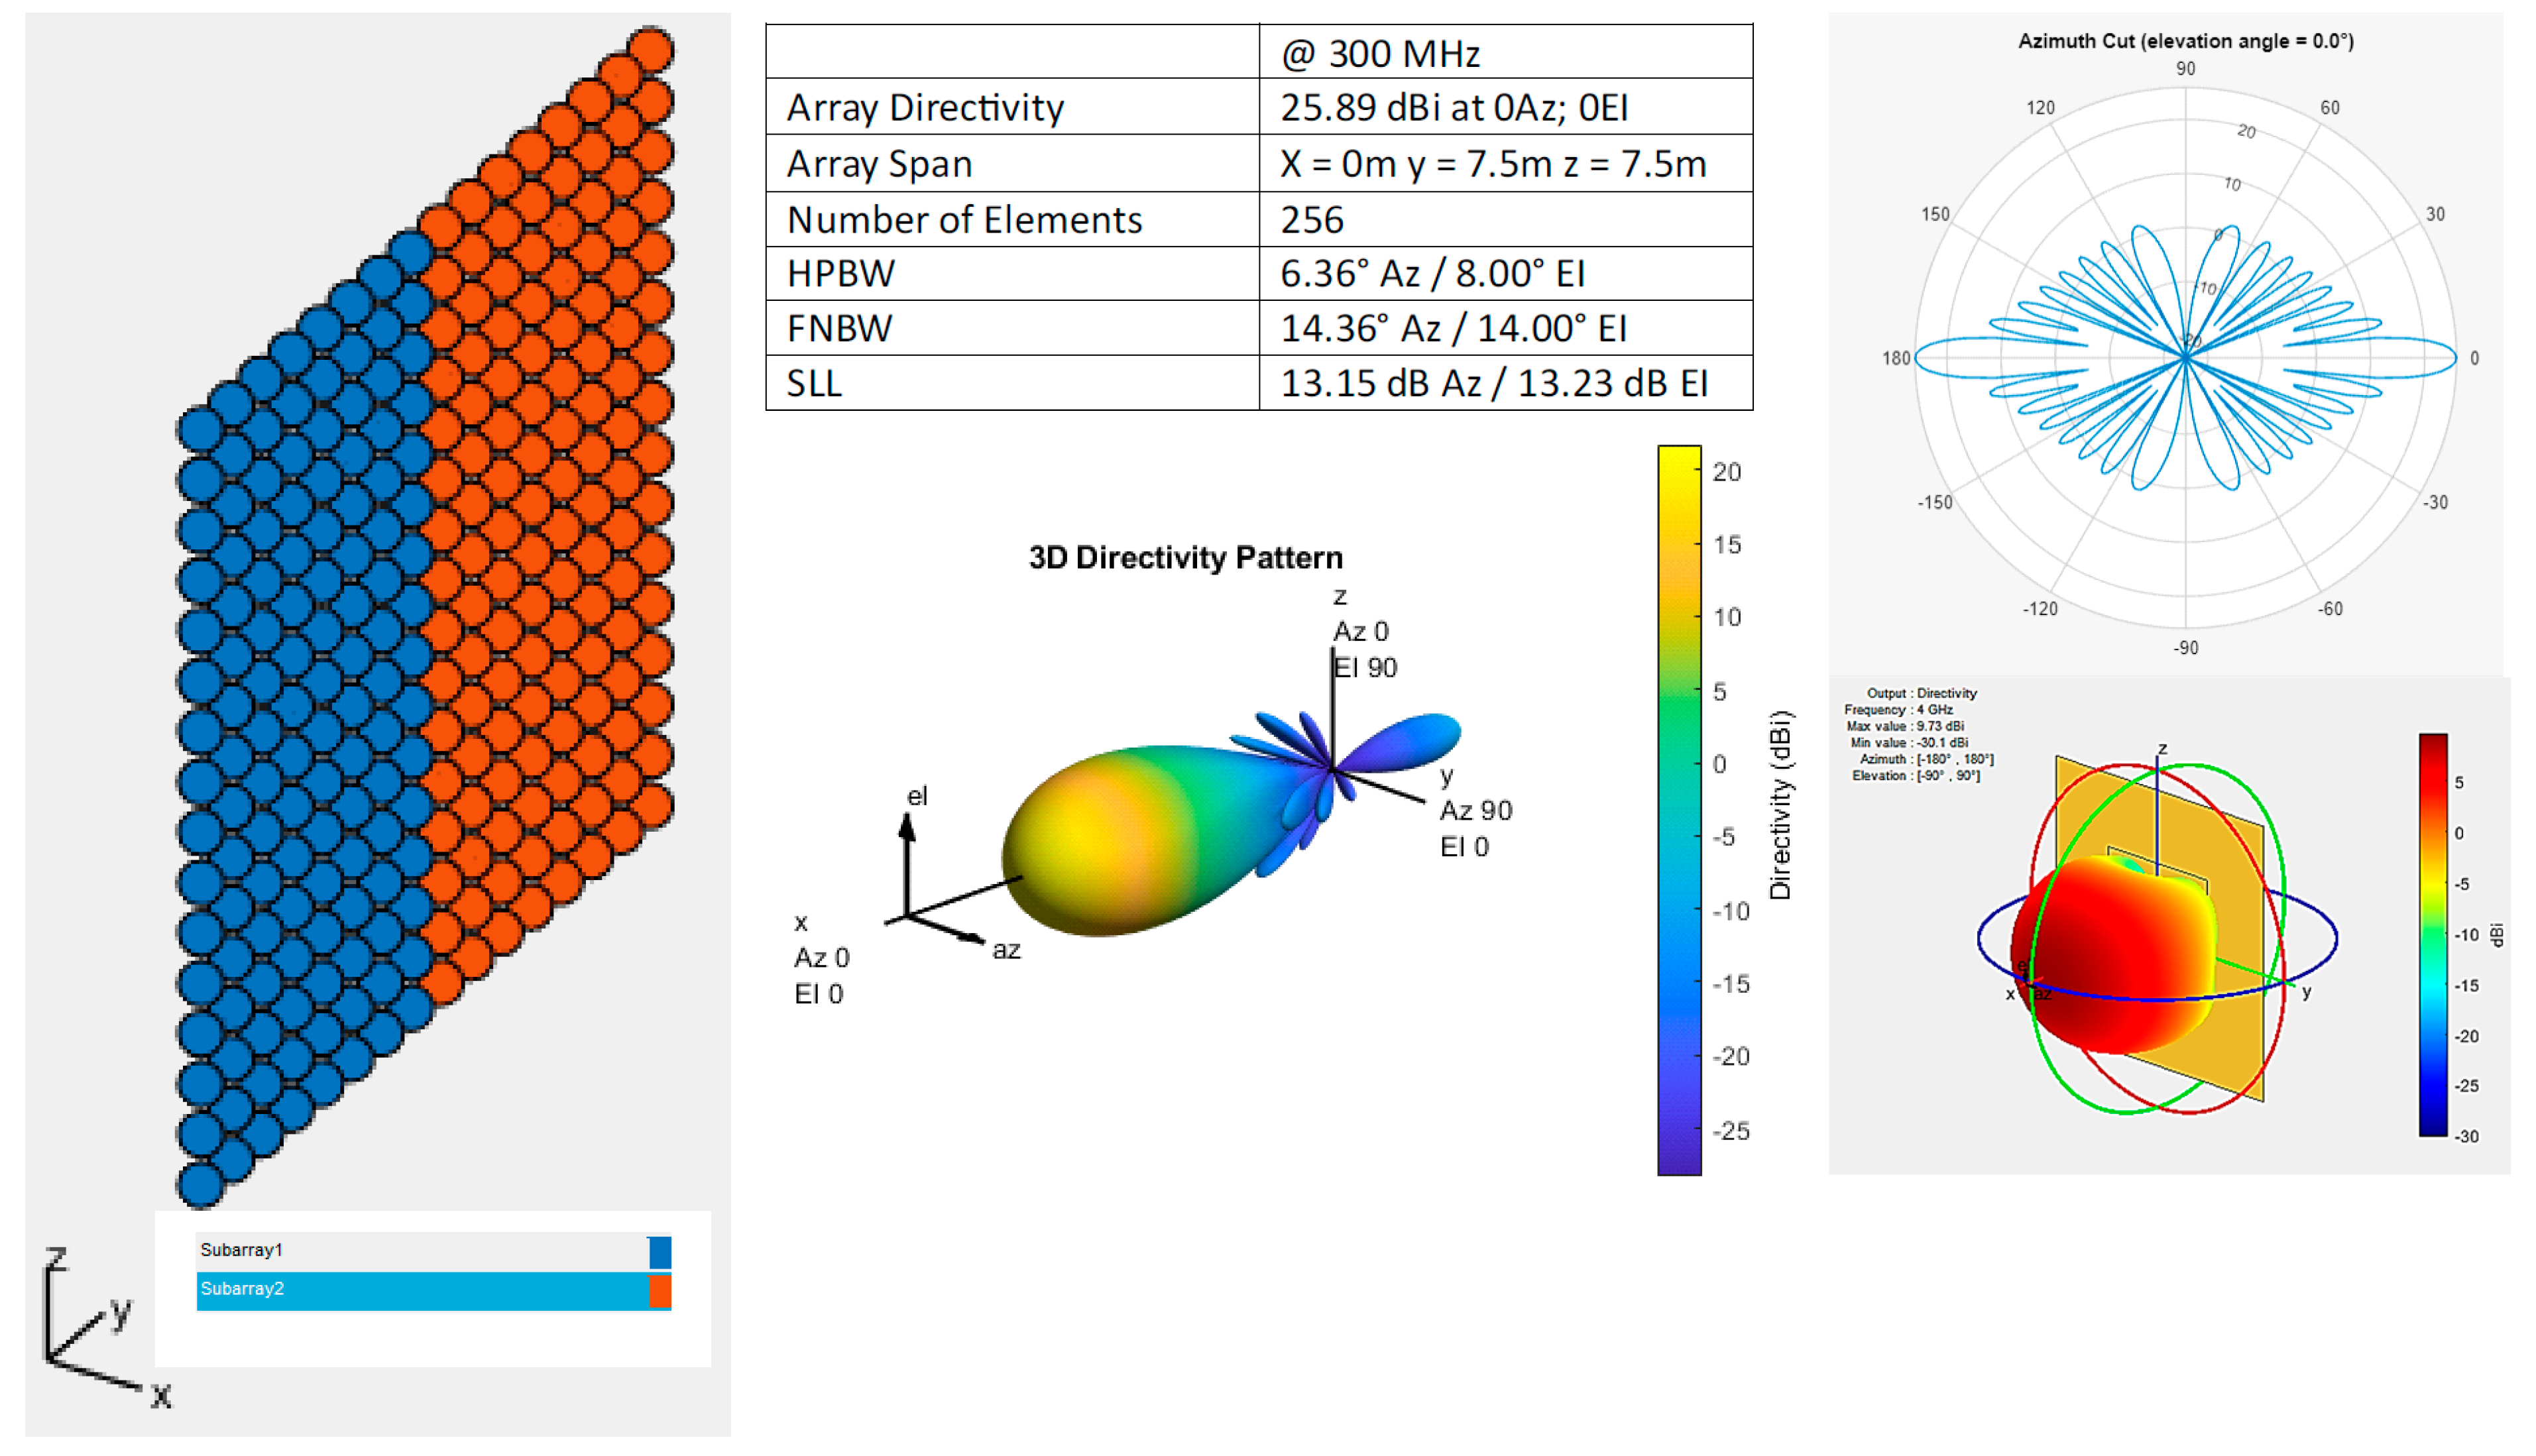
Figure 7 displays the 3D, azimuth, and elevation patterns for a 16-by-16 uniform rectangular array with a
GHz operating frequency. Antenna design and simulations are carried out using several MATLAB toolboxes, such as the Antenna Toolbox.
3.3. 5G Hybrid Beamforming for Massive MIMO
Combining characteristics of analog and digital beamforming in RF communication channels is known as hybrid beamforming. Further, 5G mmWave networks frequently use hybrid beamforming techniques. By adding phase shifters to each element of the array, the direction of the beam in RF communications with an array of RF antennas can be controlled. Analog beamforming is the term used to describe the application of these phase changes using analog electronics. These analog phase changers had a certain carrier frequency in mind when they were created. If the carrier frequency deviates from the desired frequency, beam squinting happens. The primary beam lobe shifts in angle as a result of beam squinting. This is a challenge for applications requiring high bandwidth, such as mmWave networks [
53].
This problem is solved by digital beamforming. Now, the baseband domain may dynamically calculate the ideal weights (phase shifts). Because of this, each antenna must have its own baseband RF processing channel. As a result, the system now costs more and uses more energy. The potential to significantly enhance channel capacity is another benefit of digital beamforming. Spatial multiplexing can be utilized to send out several signals in various beam directions if the beams are small enough. However, this optimization issue is difficult and intricate. The challenges of digital beamforming can be overcome by hybrid beamforming. This will limit the amount of RF chain components and the optimization challenge by incorporating analog beamforming. The capacity of fully digital beamformers cannot be reached by a hybrid beamforming system due to this restriction; however, it has been demonstrated that the performance difference is rather modest when channel characteristics are considered [
54].
To achieve maximum control and flexibility in beamforming, it is important to have independent weighting control for each antenna array element in an active array design. However, this approach requires a dedicated transmit/receive module for each element, which can be challenging to implement in massive MIMO communication systems due to cost, space, and power limitations. In such cases, it may not be feasible to have high-performance power amplifiers for every channel as it may exceed the allocated design budget. The MIMO channel model is generic and can be applied to all scenarios, including indoor, urban, and rural environments. The
MIMO channel’s time-variant impulse response matrix is provided [
55].
here,
t represents time,
represents delay,
represents number of paths, and
represents the path index.
The matrix composition includes
and
for
and
antenna responses, respectively, and
for the dual-polarized propagation channel response of cluster
.
Establishing the relationship between the elements of
antenna and
antenna,
s, u and for cluster
n as follows:
here,
and are the field patterns for the antenna element, showing the vertical and horizontal polarizations, respectively.
and complex gains of vertical-to-vertical and horizontal-to-vertical polarizations of ray , respectively.
The angles of departure. The angle of arrival, carrier frequency wavelength, and Doppler frequency component of ray are represented by , , and , , respectively.
The location vectors for elements and are represented by and , respectively. If the radio channel changes over time, the small-scale parameters also vary with time.
Modern technology known as massive MIMO beamforming produces 5G signals that dramatically increase network capacity. The technique significantly boosts throughput per user and peak data rate, enabling connections to operate at up to 10 Gbps. Large antenna arrays at base stations allow for the support of a huge number of concurrent users. The technology also improves spectral efficiency and the signal-to-interference-plus-noise ratio (SINR). By transmitting tailored signal streams to specific users rather than broadcasting a signal, inter-cell interference is also decreased. Massive MIMO beamforming enables operators to improve their networks and services in the future by supporting both 4G and 5G networks.
3.4. Path Loss Components of the 5G System and Link Budgets
Path loss models describe the signal attenuation between a transmit and receive antenna as a function of propagation distance and other factors. Some models use many terrain profile characteristics to estimate signal attenuation, while others only take carrier frequency and distance into account. Other crucial factors include antenna height.
It is common practice to forecast propagation conditions and choose the best sites for cellular base stations using topographical topography data. A basic propagation model, like Egli’s model, is used to calculate path loss in a crude coverage calculation without considering the topography or terrain features in great detail. Such coverage graphs often display circular cell arrangements if no interference is present and omni-directional antennas are used. However, the actual cell arrangements greatly diverge from the idealized hexagonal or circular arrangement.
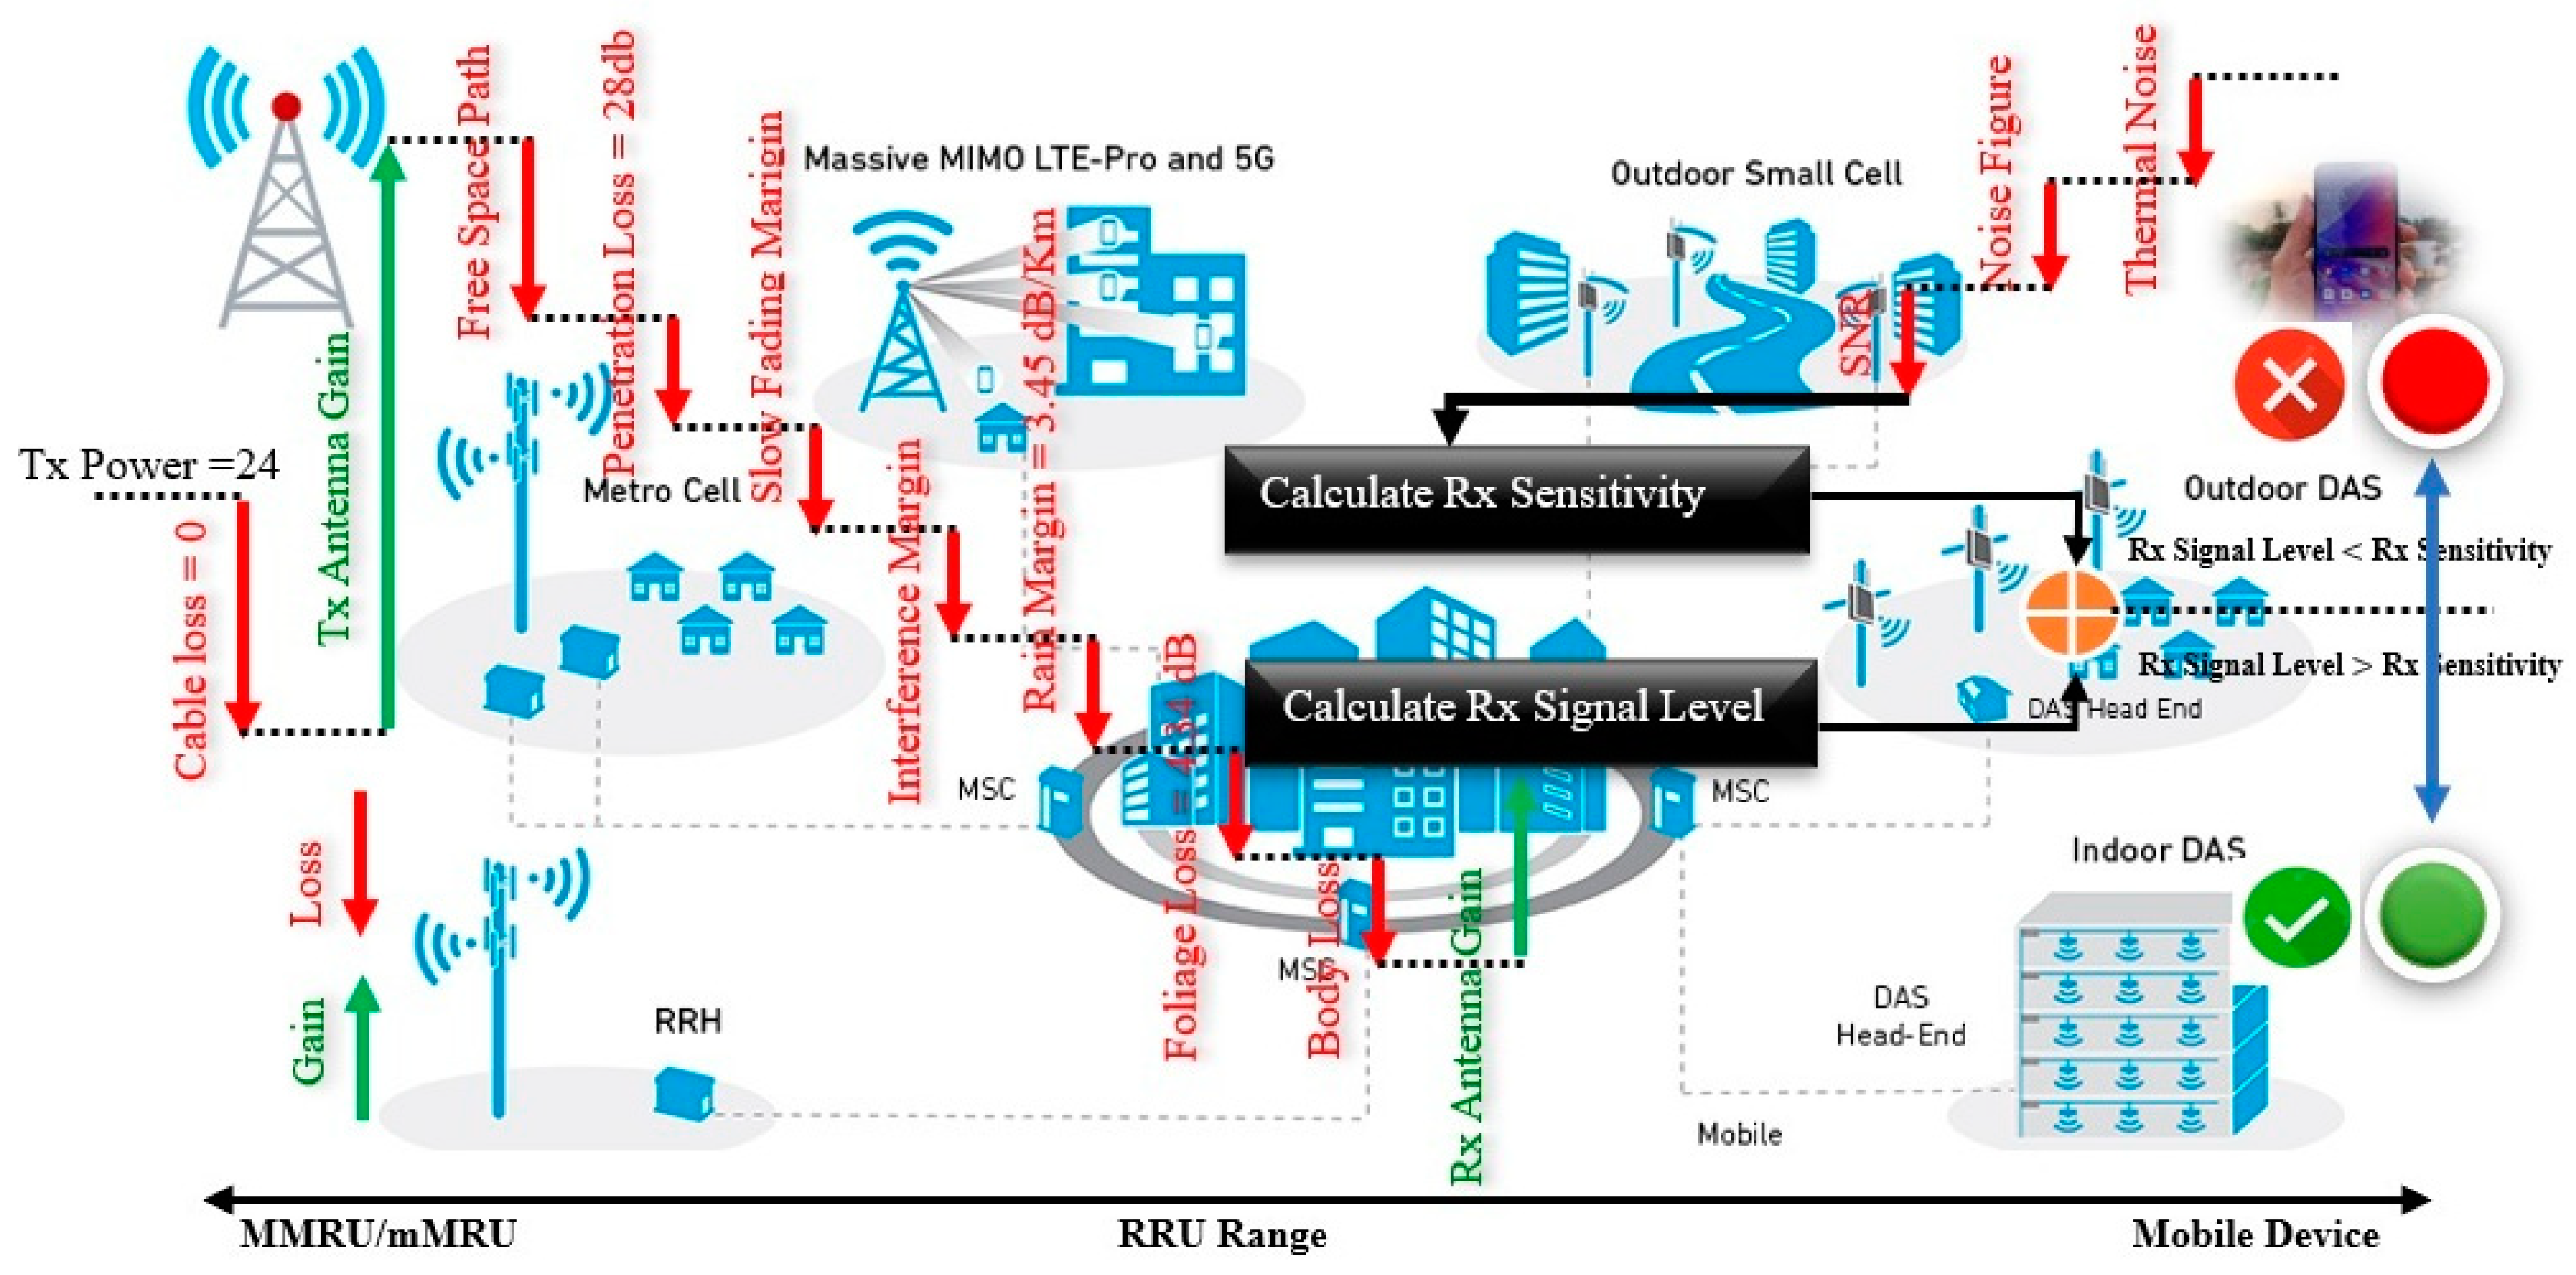
Path loss is calculated during actual cell panning using the antenna data and terrain parameters. The strength of the received signals and the levels of interference define the range of each base station. Given all these propagation factors, mathematical techniques have been devised to calculate the likelihood of a signal outage. The link budget is more of a last-resort solution. The 5G communication step-by-step link budget analysis graphical presentation is shown in
Figure 8.
Received Signal Level at 5G receiver (dBm) = gNodeB transmit power (dBm) − 10*log10(subcarrier quantity) + gNodeB antenna gain (dBi) − gNodeB cable loss (dB) − Path loss (dB) − penetration loss (dB)− foliage loss (dB) − body block loss (dB) − interference margin (dB) − rain/ice margin (dB) − slow fadingmargin (dB) − body block loss (dB) + UE antenna gain (dB) − Thermal noise power (dBm) − UE noise figure (dB) − demodulation threshold SINR (dB).
We employ a propagation model that is appropriate for 5G to determine the path loss (i.e., 3D propagation models, which provide us with nearly correct route loss and genuine user-received signal strength). We may obtain the distance, or, more precisely, the cell radius, of gNB using the formula. These aid in calculating the gNB footprint when site planning is taking place.
where distance and frequency represented by
. As the SINR value is directly related to the amount of throughput we want to achieve at the cell edge, the reception sensitivity is mostly determined by the capacity needs (throughput). To comprehend and obtain cell edge values, it is crucial to define and calculate the cell radius.
Based on measurement results from references as well as findings from the literature, path loss models for the various propagation situations have been created. The models can be used for various antenna heights and frequencies between 2 and GHz. The MHz to GHz frequency range can be used to apply the rural path loss formula and the Phased Array System Toolbox.
In
Table 3, the path loss models have been compiled and each scenario’s standard deviation for the shadow fading distribution, which is log-normal, is provided.
3.5. Simulations of SINR and 5G Network Coverage
In wireless communication systems, SINR is a critical statistic that assesses the strength of a received signal in the face of noise and interference. Understanding SINR and how it affects wireless communication networks’ performance is crucial for both network operators and users as these networks continue to grow and change. SINR is a metric used to express how strong a desired signal is in comparison to the total of unwanted signals and background noise. It is computed by dividing the target signal’s power by the total power of all interfering signals plus noise. It is represented in decibels (dB).
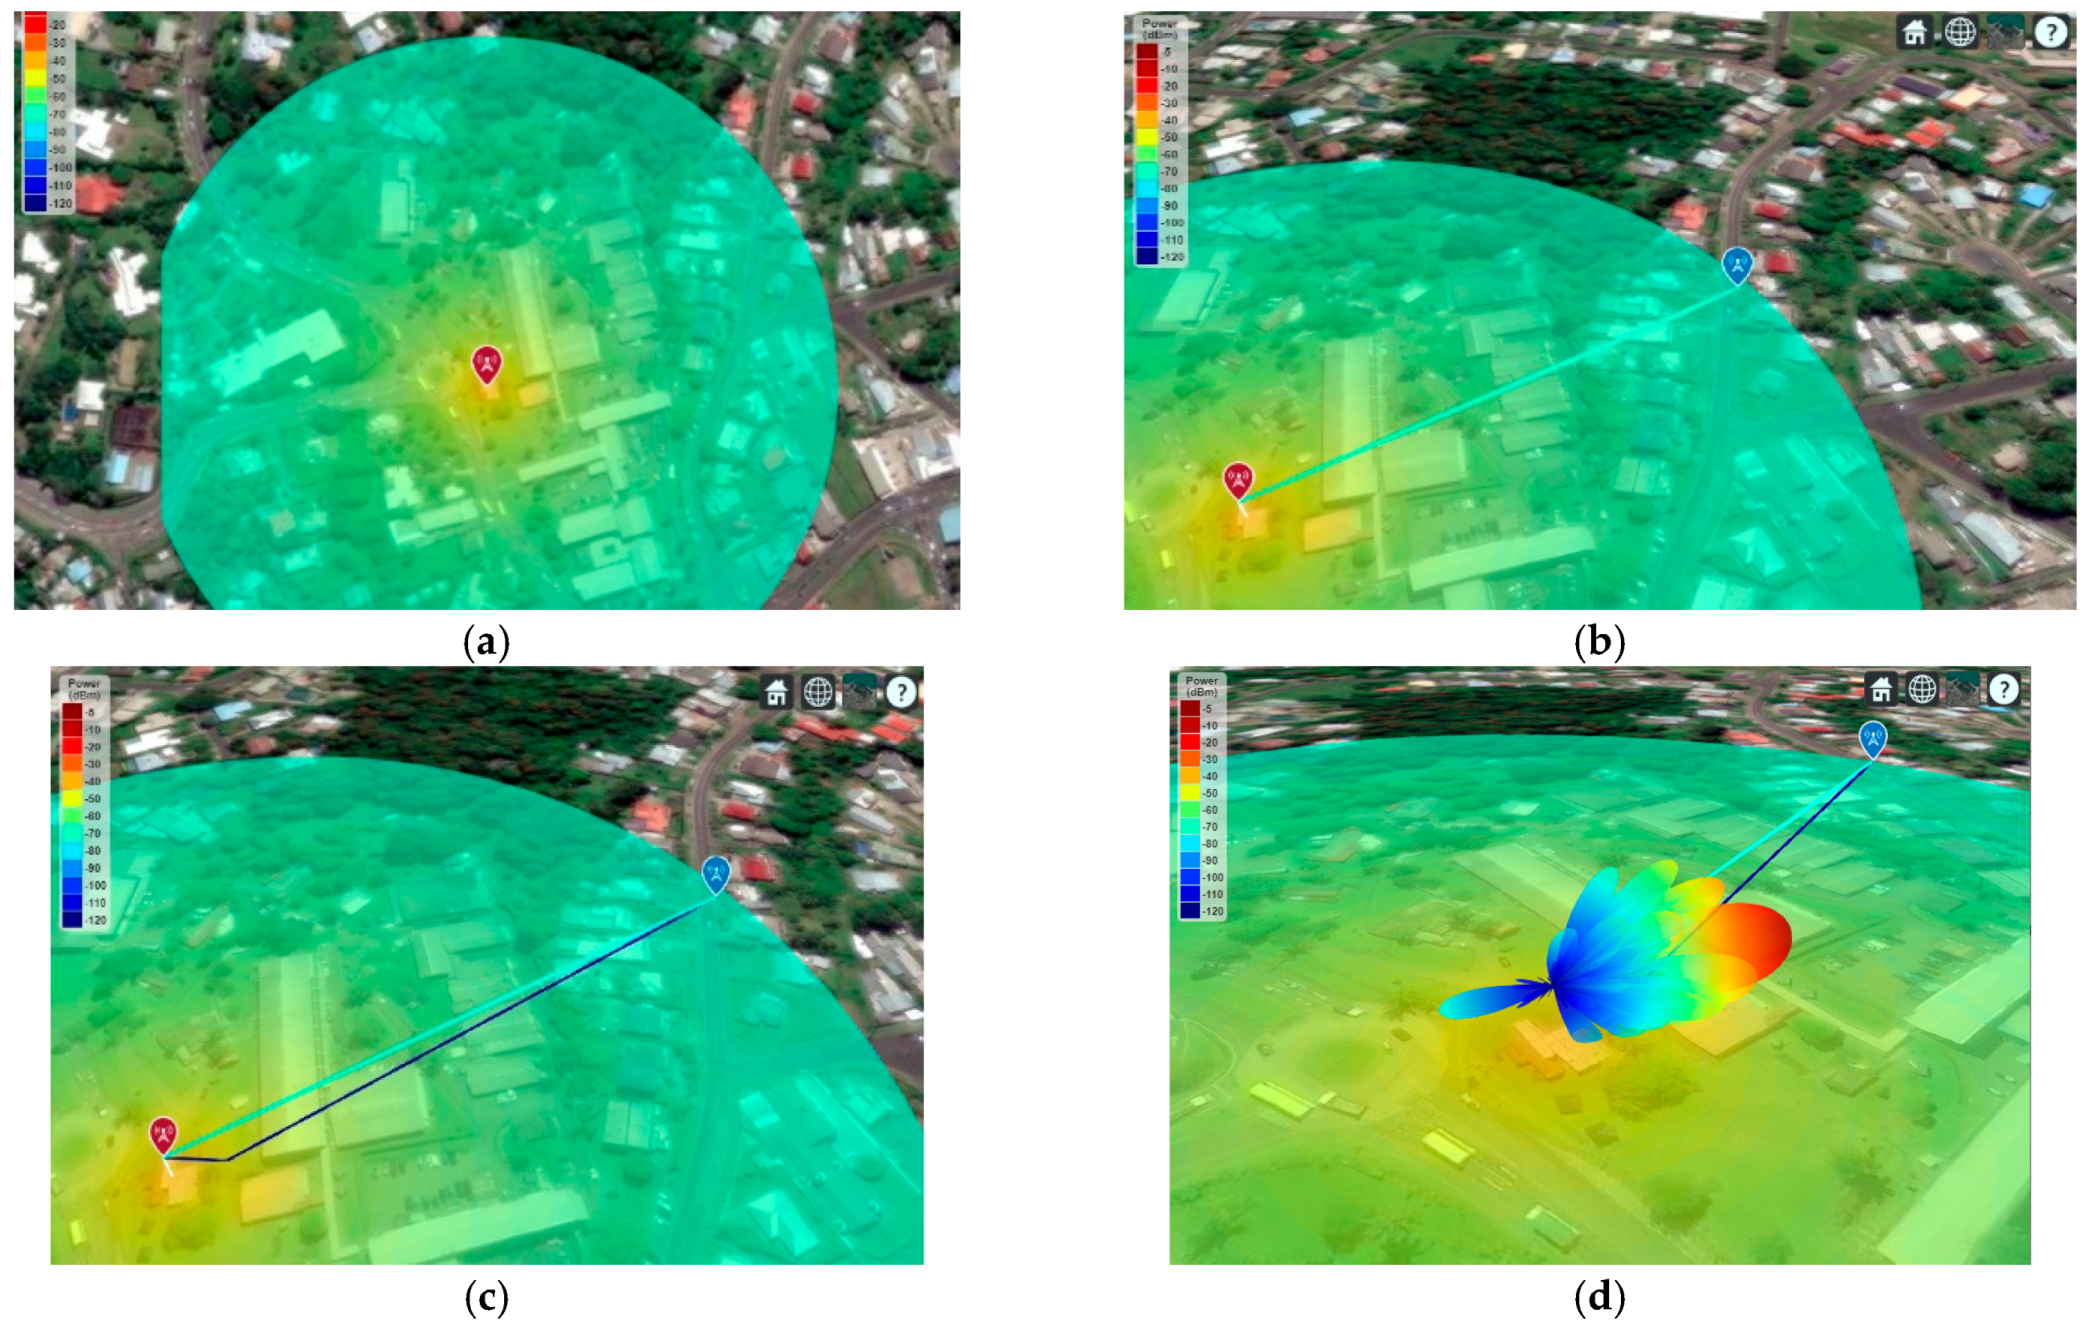
Better signal quality is indicated by a higher SINR value, which in turn results in higher data rates, more network capacity, and enhanced user experience. Multiple signals are delivered simultaneously across the airwaves in wireless communication systems, frequently using the same frequency ranges. These signals may conflict with one another, lowering the signal quality that is received. Background noise from various sources, such as technological devices and natural occurrences, can also have an impact on the signal quality. To provide a thorough assessment of the signal quality in a wireless communication system, SINR considers both interference and noise. The reduction in power density (attenuation) of the wireless transmission’s wave as it propagates (travels) across a medium over a distance is known as path loss (attenuation of the signal route). It is a crucial component in the design and planning of a wireless network and plays a crucial role in determining the link budget. When planning outdoor long-range links, the path loss owing to free space loss is likely to be the most crucial consideration because it causes a 4× reduction in signal intensity for every 2× increase in distance between devices. Free space loss is based only on the LoS (line of sight) passage through free space air and does not take into account things like the gain of the antennas used at the transmitter and receiver or any loss related to hardware flaws. Path loss components of the 5G system and link budget analysis using the ray tracing method to examine communication routes and coverage areas in urban areas are shown in
Figure 9.
The deployment region for the simulation of real-world 5G network coverage in this part, along with RF signal tracing, is Fiji National University’s latitude −18.126152 and longitude 178.438928 at the CEST Samabula Campus in Fiji.
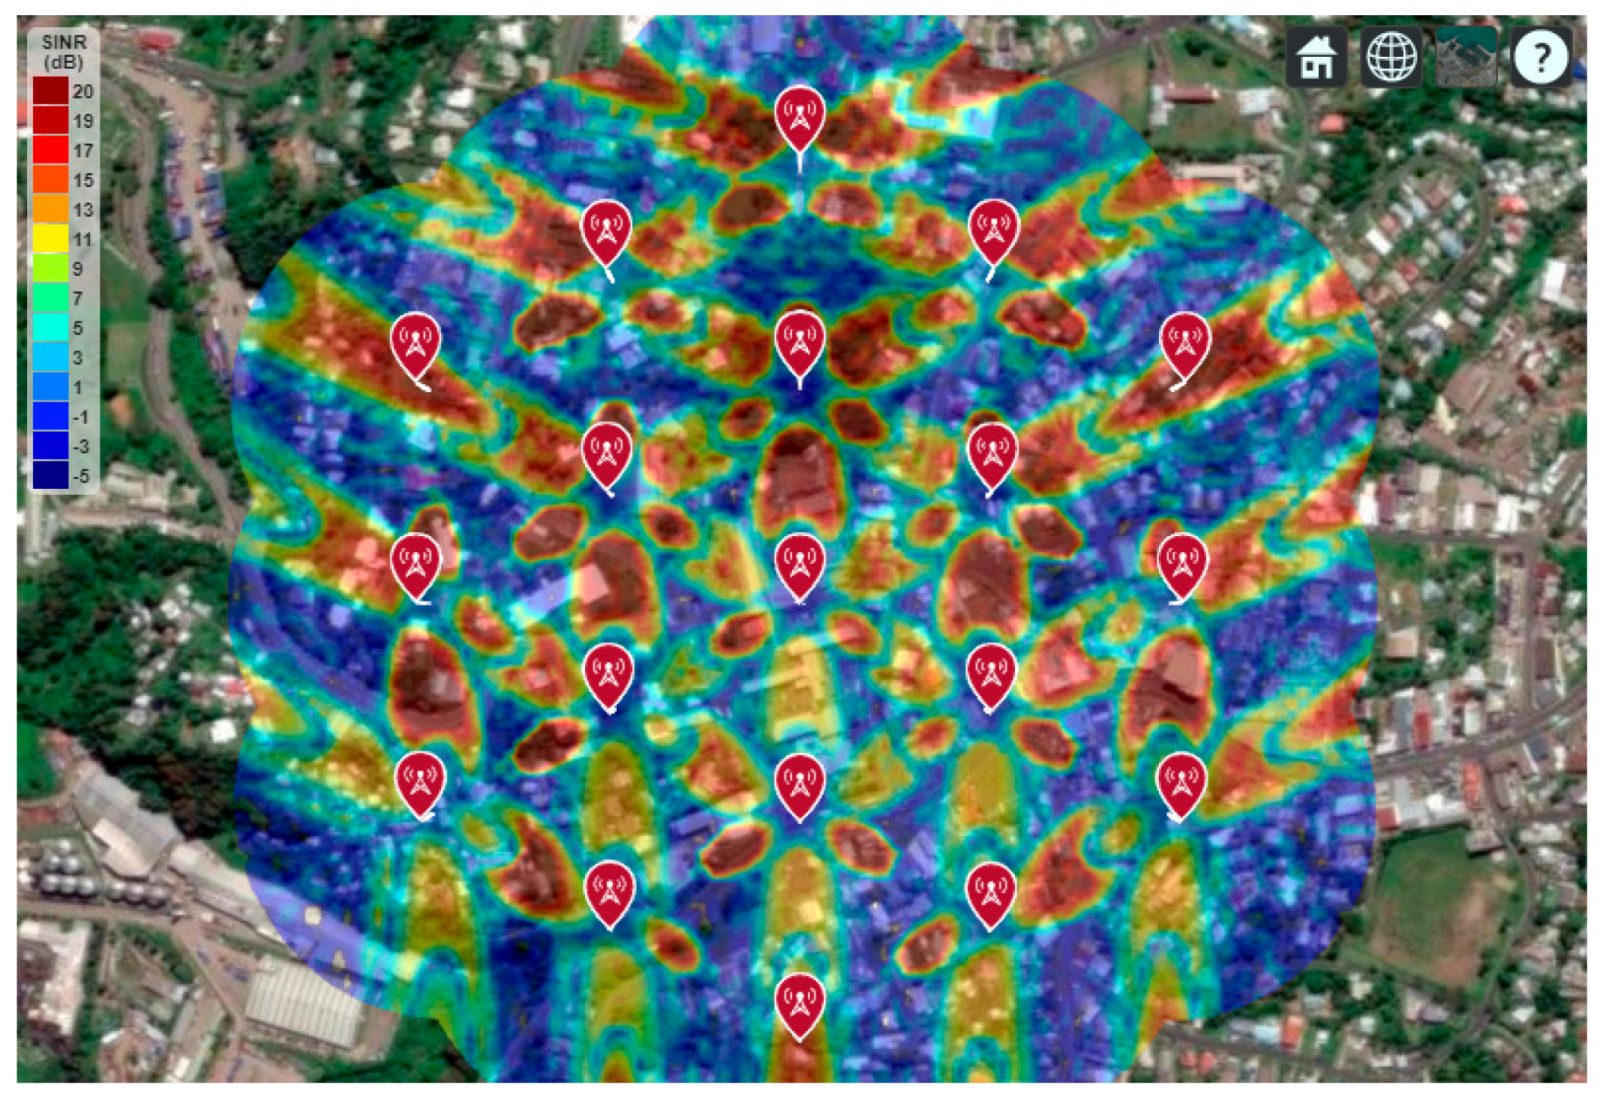
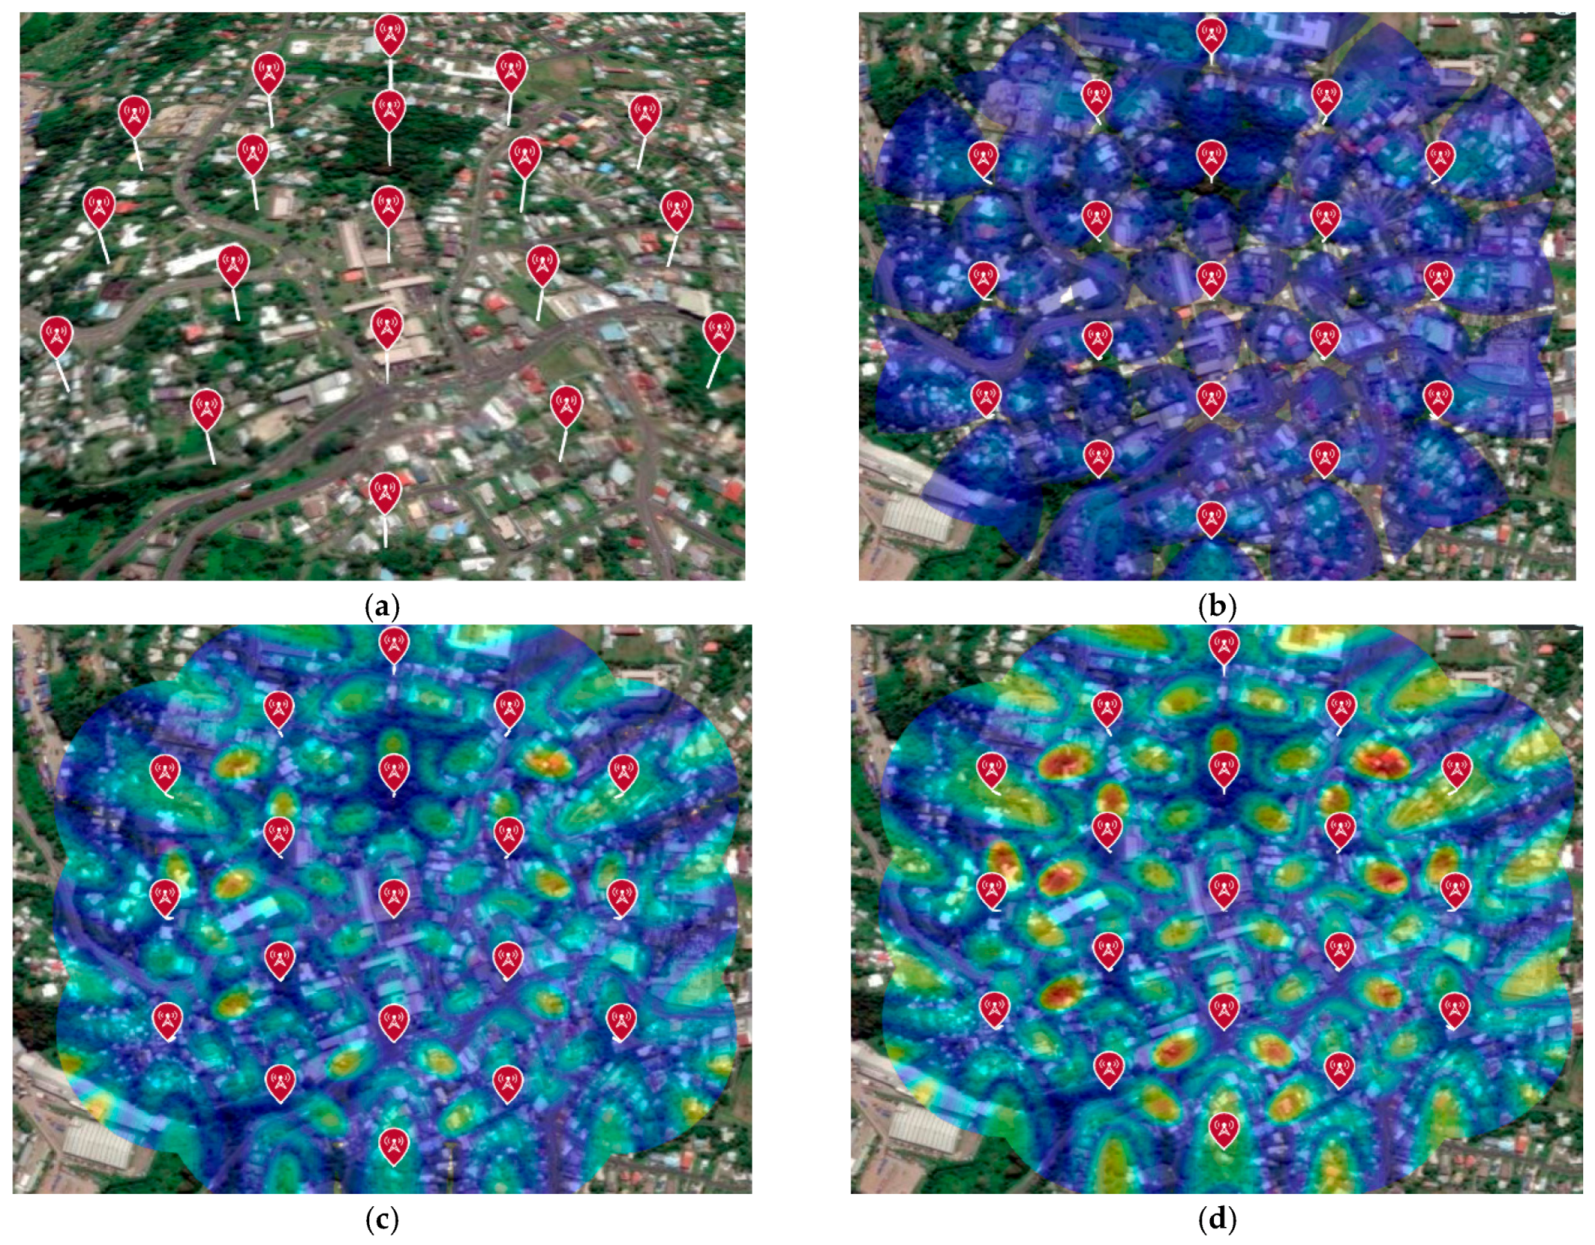
Figure 10 uses a Google map to illustrate the simulated network coverage and the SINR. The suggestions made by IMT2020 for the planning and simulation of the 5G network’s coverage are followed in this study [
55]. Each simulation parameter and simulation outcome are shown in
Table 4.
Figure 10 shows the SINR for a group of 19 cell sites with 5G network coverage with three sectors each and one antenna element at Fiji National University’s Samabula Campus. The SINR is a quantity used in information theory and telecommunication engineering to provide theoretical upper constraints on channel capacity (or the rate of information transfer) in wireless communication systems like networks. Like the SNR, which is frequently employed in wired communications systems, the SINR is defined as the power of an interest signal divided by the sum of all interference signals plus some background noise. The signal-to-interference ratio (SIR) replaces the SINR if the power of the noise term is zero. The signal-to-noise ratio (SNR), which is employed less frequently when creating mathematical models of wireless networks like cellular networks, is reduced to zero interference, on the other hand. The best RF coverage is achieved, as shown in
Figure 11, by adding a 16-by-16 array antenna for each transmitter. The deployment locations at Samabula Campus of Fiji National University currently fulfill the minimum criterion of 19 dB SINR or above for the 5G network. Since the array gain (or directivity) climbs as the array’s element count rises, the peak SINR rises as expected.
The precise SINR values that can be achieved in a 5G network can change based on several variables, including the signal’s strength, its distance from the base station, the interference in the area, and the network’s setup. However, for optimum performance, an SINR value above a particular cutoff is preferred.
3.6. Enhancing 5G Wireless Communication’s SNR and Channel Capacity Using Antenna Arrays
A wireless communication system’s objective is to provide the most users with the highest data rate feasible while adhering to limitations like the radiation power limit and operating budget. Signal-to-noise ratio (SNR) improvement is crucial for increasing data rates. Reusing resources is essential for providing services to more people. Numerous techniques have been used over the past few decades to increase SNR and reuse time, frequency, and coding space resources [
57]. This illustration demonstrates how using antenna arrays can increase a wireless link’s SNR and capacity.
Currently, antenna arrays are part of the standard configuration for 5G wireless communication networks. The notion of massive MIMO, which, as the name suggests, involves the deployment of MIMO technology on a much larger scale for higher network coverage and capacity, is introduced by 5G New Radio, taking it to the next level. To boost transmission gain and spectral efficiency, massive MIMO employs numerous additional broadcast and receive antennas. There must be simultaneous downlink traffic generation from several UEs to achieve massive MIMO capacity gain. The actual gain that massive MIMO provides is affected by several factors [
58]. Massive MIMO applications do not have a set minimum number of antennas needed; however, most experts agree that a system needs more than eight broadcast and eight receive antennas. Additional systems with tens or even hundreds of antennas are possible; thus, the number can be significantly higher. It is possible for the system to reuse its geographic data to provide more coverage. For the sake of this example, let us assume that the system is placed at
GHz, a band that is currently being considered for the 5G network.
3.7. 5G Radio Channel Signal Analysis at Suva City
The shape of the building’s wall or other structural elements has an impact on the electromagnetic waves that are propagating nearby or inside of it, making their propagation difficult. This results in a region where a strong enough electric field can be created and a portion where this is not possible. It is important to take wireless communication seriously in this situation. The distribution of the electric field strength around the building must first be understood to tackle this issue. Three different types of building materials, bricks, prefabricated housing, and passive structures that are employed in building engineering have a greater impact on electromagnetic wave propagation [
59].
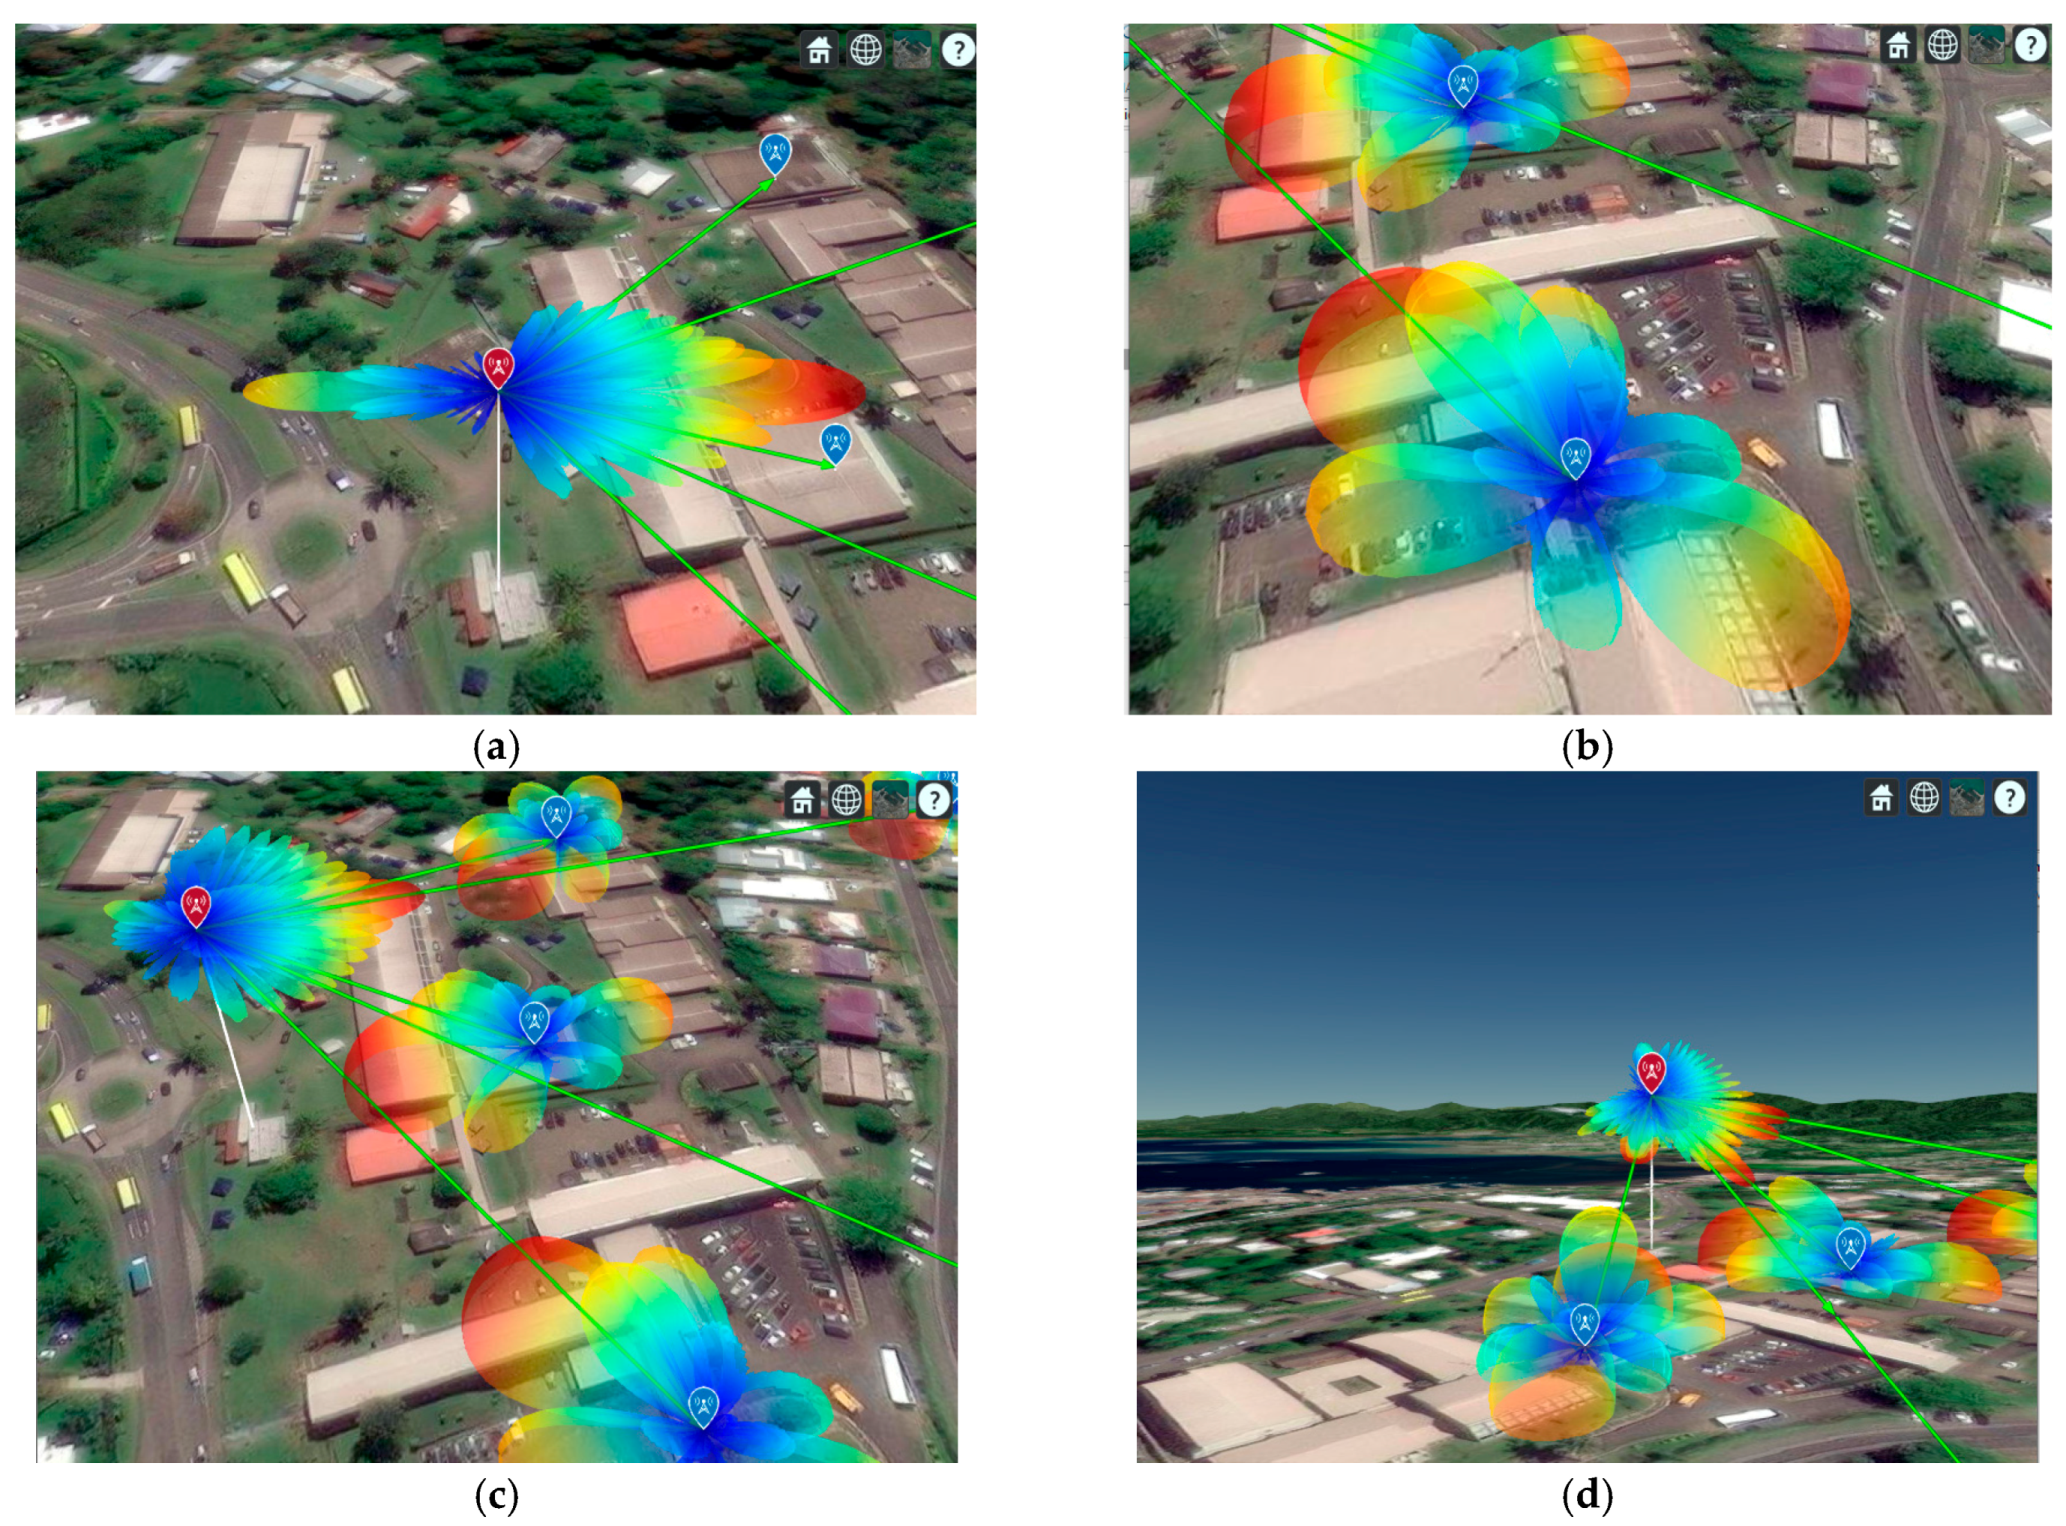
To investigate 5G transmission modes, including the various MIMO concepts, radio channel predictions in the time, frequency, and spatial domains are needed [
60]. Using the MIMO antenna arrays on the Tx and Rx sides, beamforming, spatial multiplexing, or a mix of the two technologies will be carried out. The contribution of each ray to the field strength, as well as the times and angles at which they depart Tx and arrive at Rx, must all be considered. MATLAB 2023a, which has a broad frequency range of up to GHz or even higher, provides the simulation result for this radio channel.
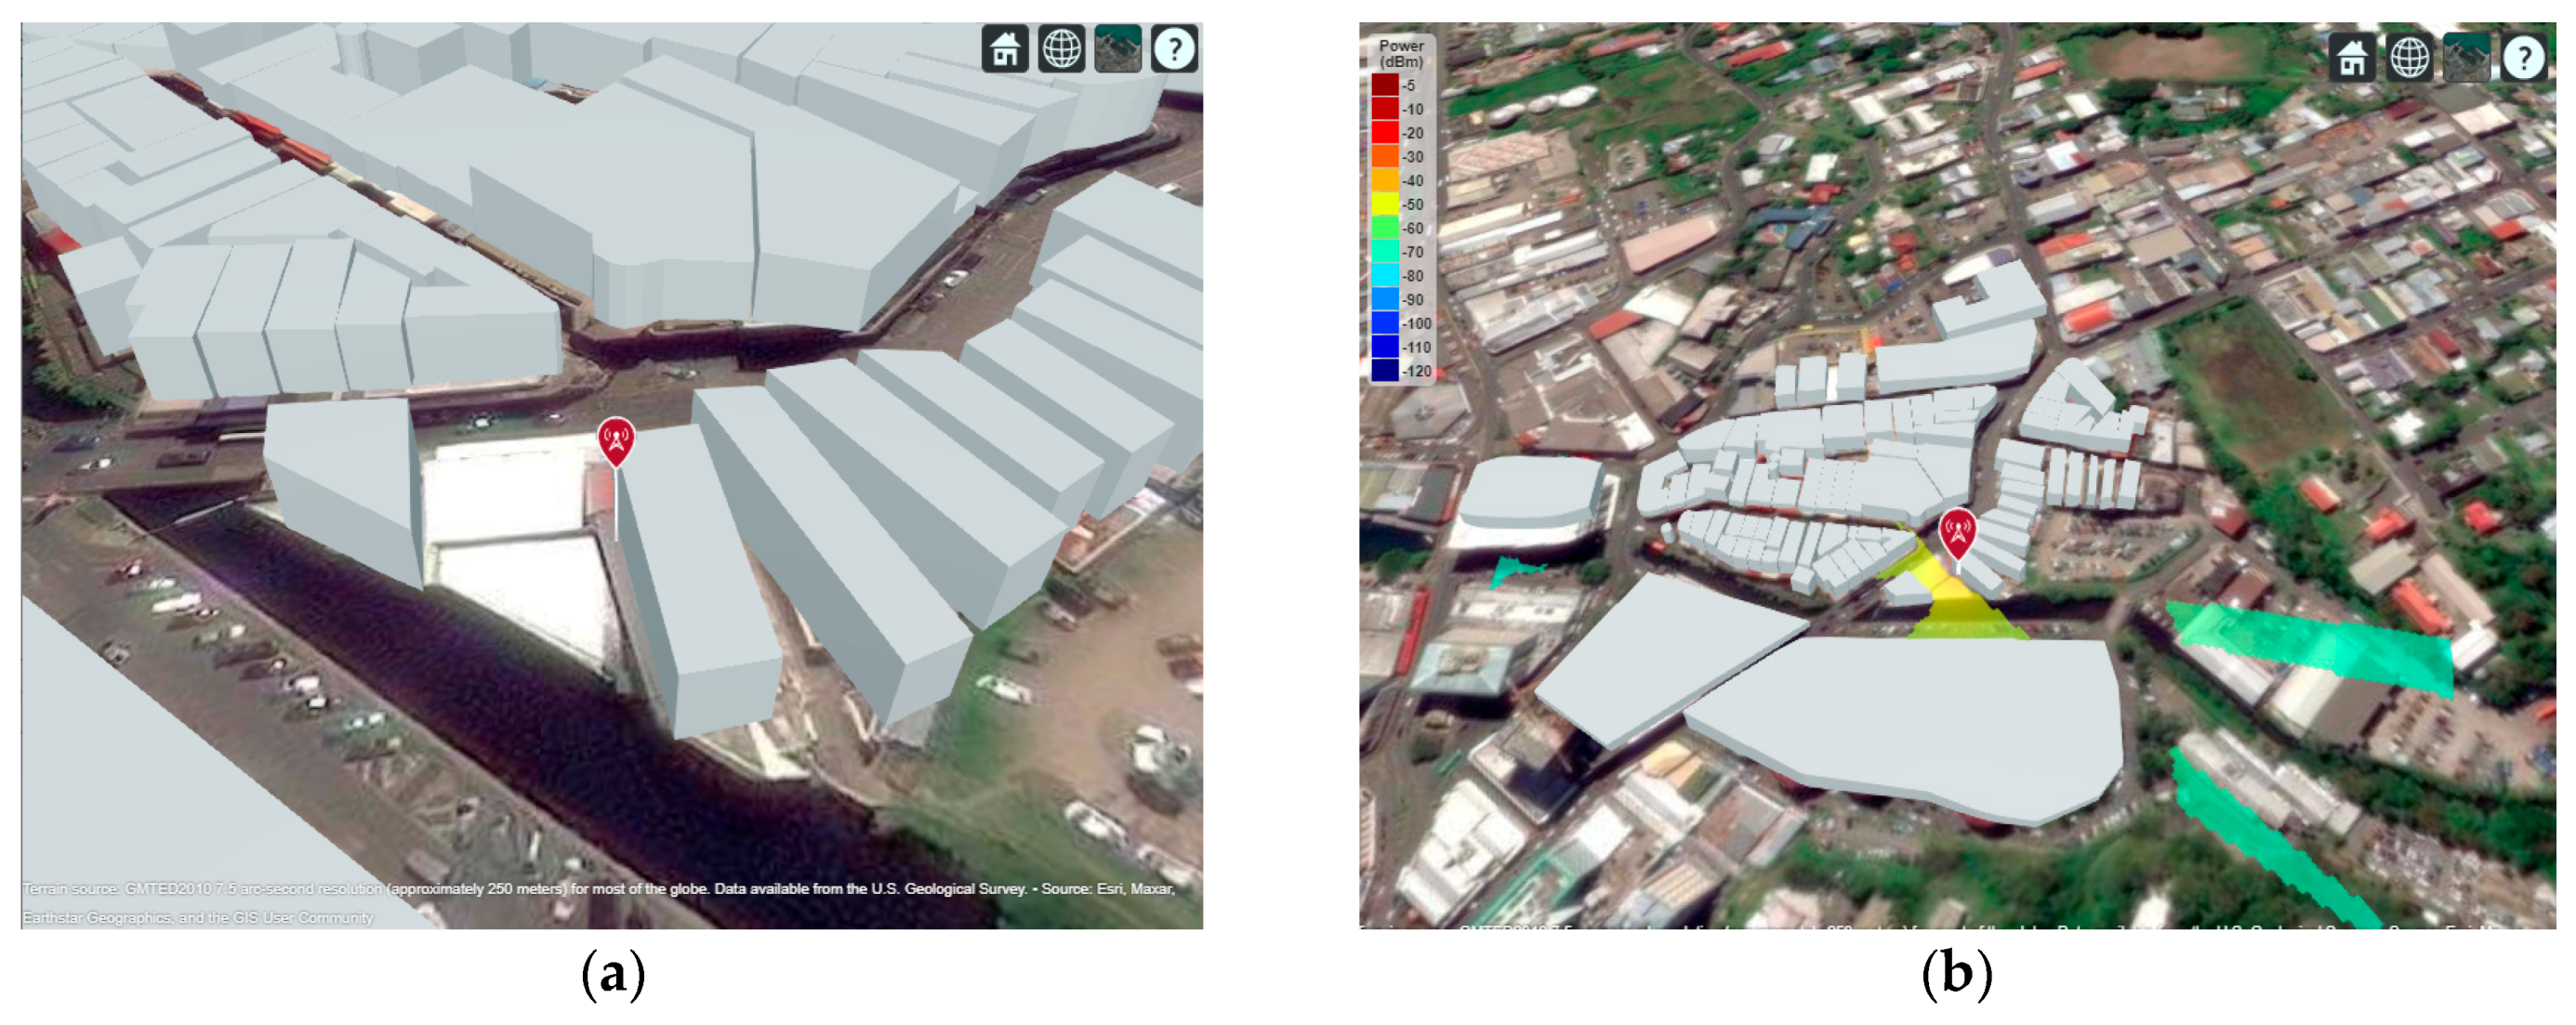
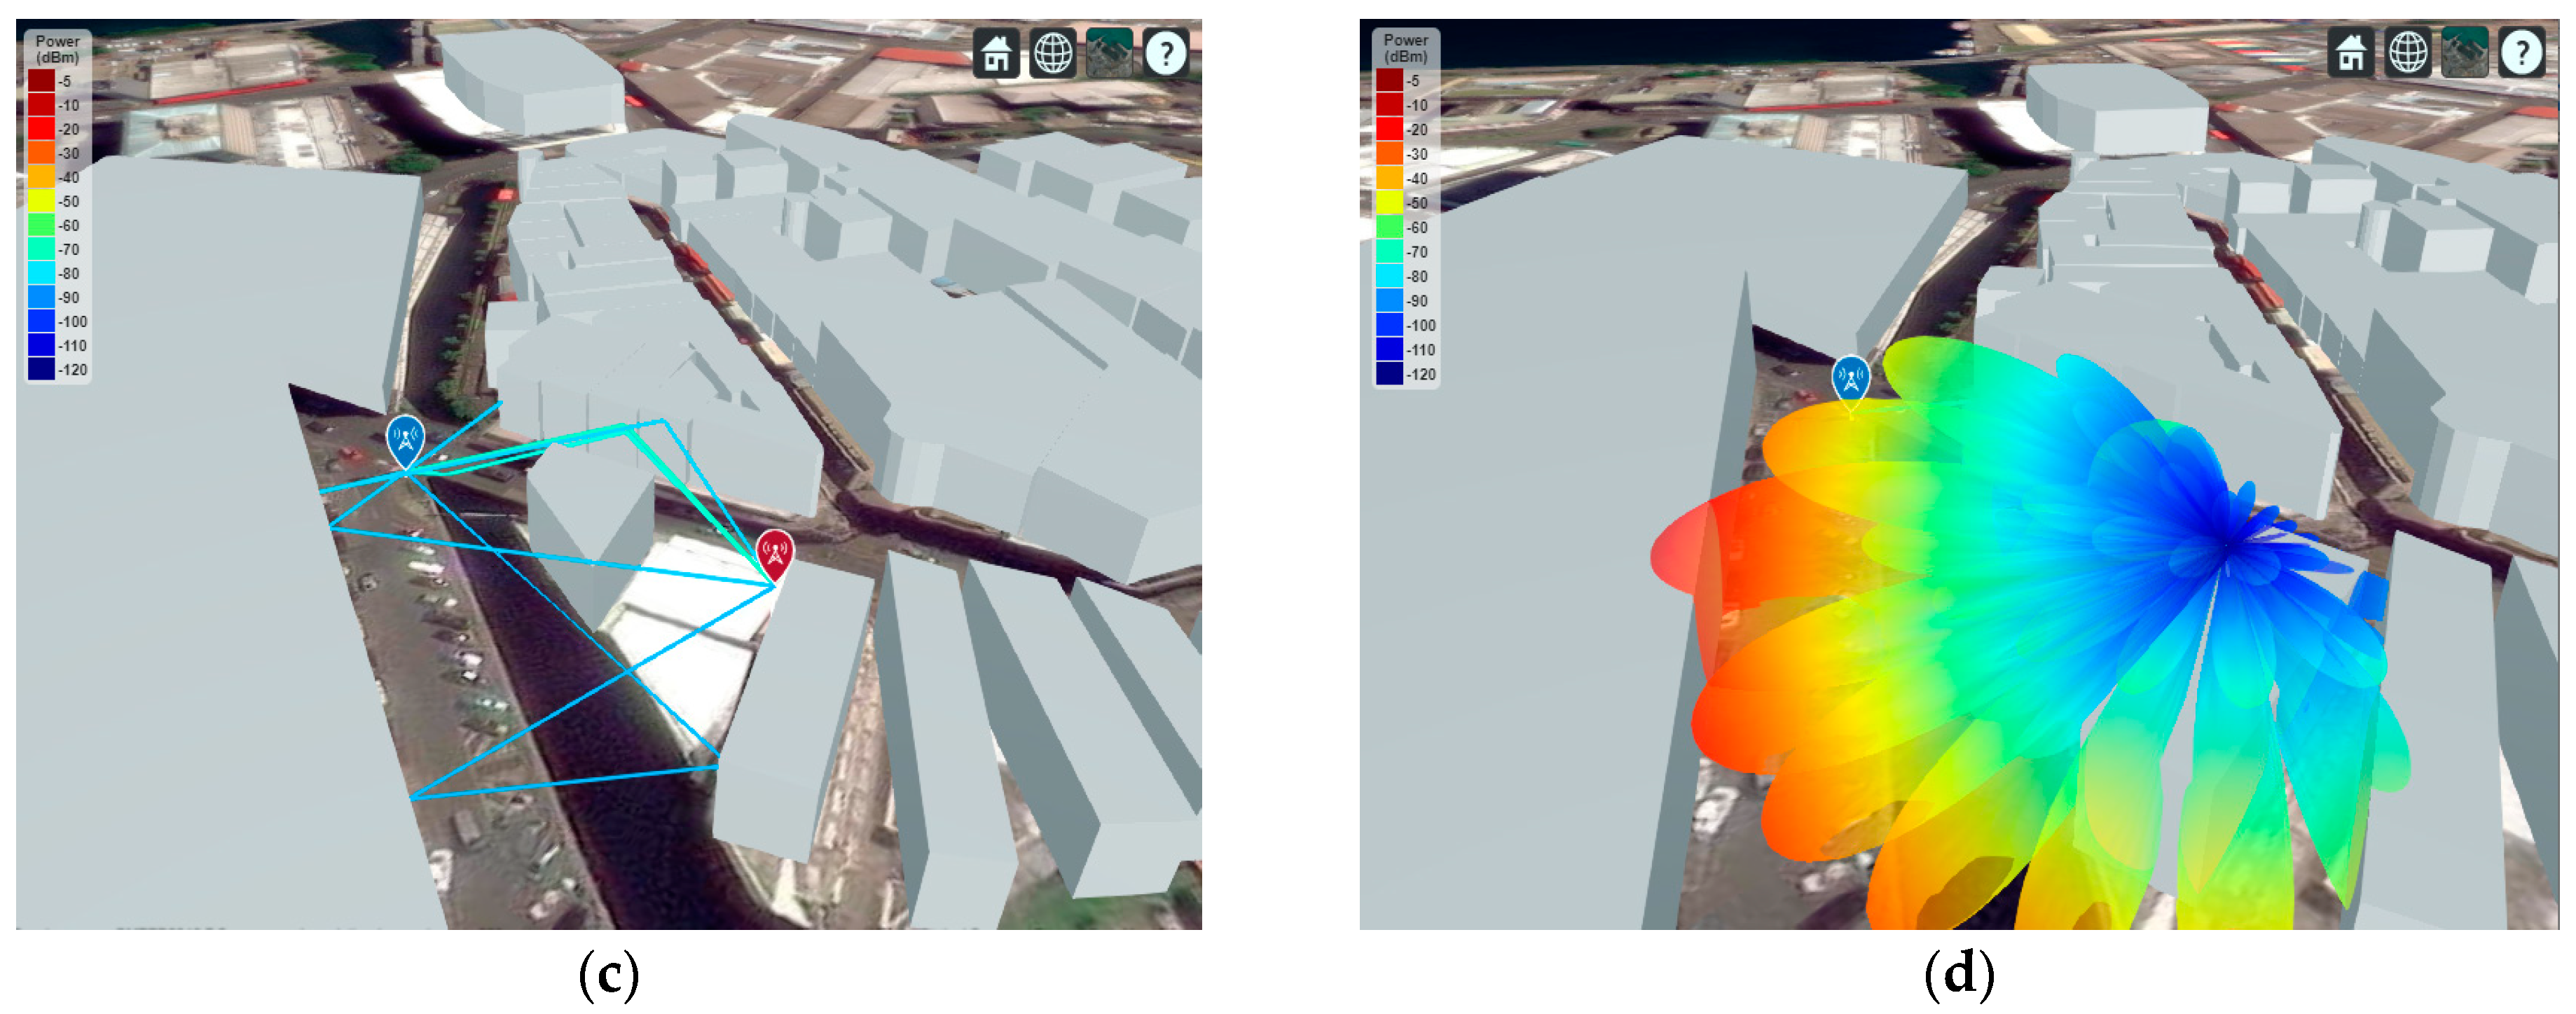
Figure 12 shows the location of the 5G radio channel signal strength analysis at the LOS base station of the
GHz band at Fiji National University, Samabula Campus, Suva City. The map displays which base station is more effective at reaching each covered area based on the receiver’s location. The delay spread and angle spreads on the Tx and Rx sides have both been studied to evaluate 5G beamforming techniques.
Beamforming, which enables the transmission of various signals to many mobile devices while utilizing the same frequency and time resources, uses massive MIMO antennas [
61]. The outcome is a decrease in interference from other users and a boost in SNIR and Rx power levels for the dedicated user. Higher frequencies produce a large increase in path loss due to the characteristics of radiated waves. A 5G NR device operating at
GHz has a far-field distance of 42 m and a path loss of 73 dB, whereas the far-field region of a 4G LTE 15 cm device operating at
GHz begins at 30 m and has a path loss of 28 dB.
Figure 13 shows an investigation of a non-line-of-sight (NLOS) 5G urban link for Suva City (latitude, −18.138916, longitude 178.426959, antenna height 10 m, transmitter power 5 watts, transmitter frequency
GHz) using the shooting and bouncing rays tracing method with varying amounts of reflections, diffractions, and launched rays. The outcomes of the wave propagation analysis and radio coverage for Suva City’s small-cell 5G transmitter are presented in
Table 5 [
62].
The most users possible with the quickest data rates are supported by 5G wireless communication systems, which are designed to adhere to radiated power restrictions and operating budgets. The signal-to-noise ratio (SNR) can be raised to boost data rates. Additional consumers can be served by reusing channel resources. A variety of methods that can be applied in various temporal, frequency, and coding situations have been employed to increase the SNR.
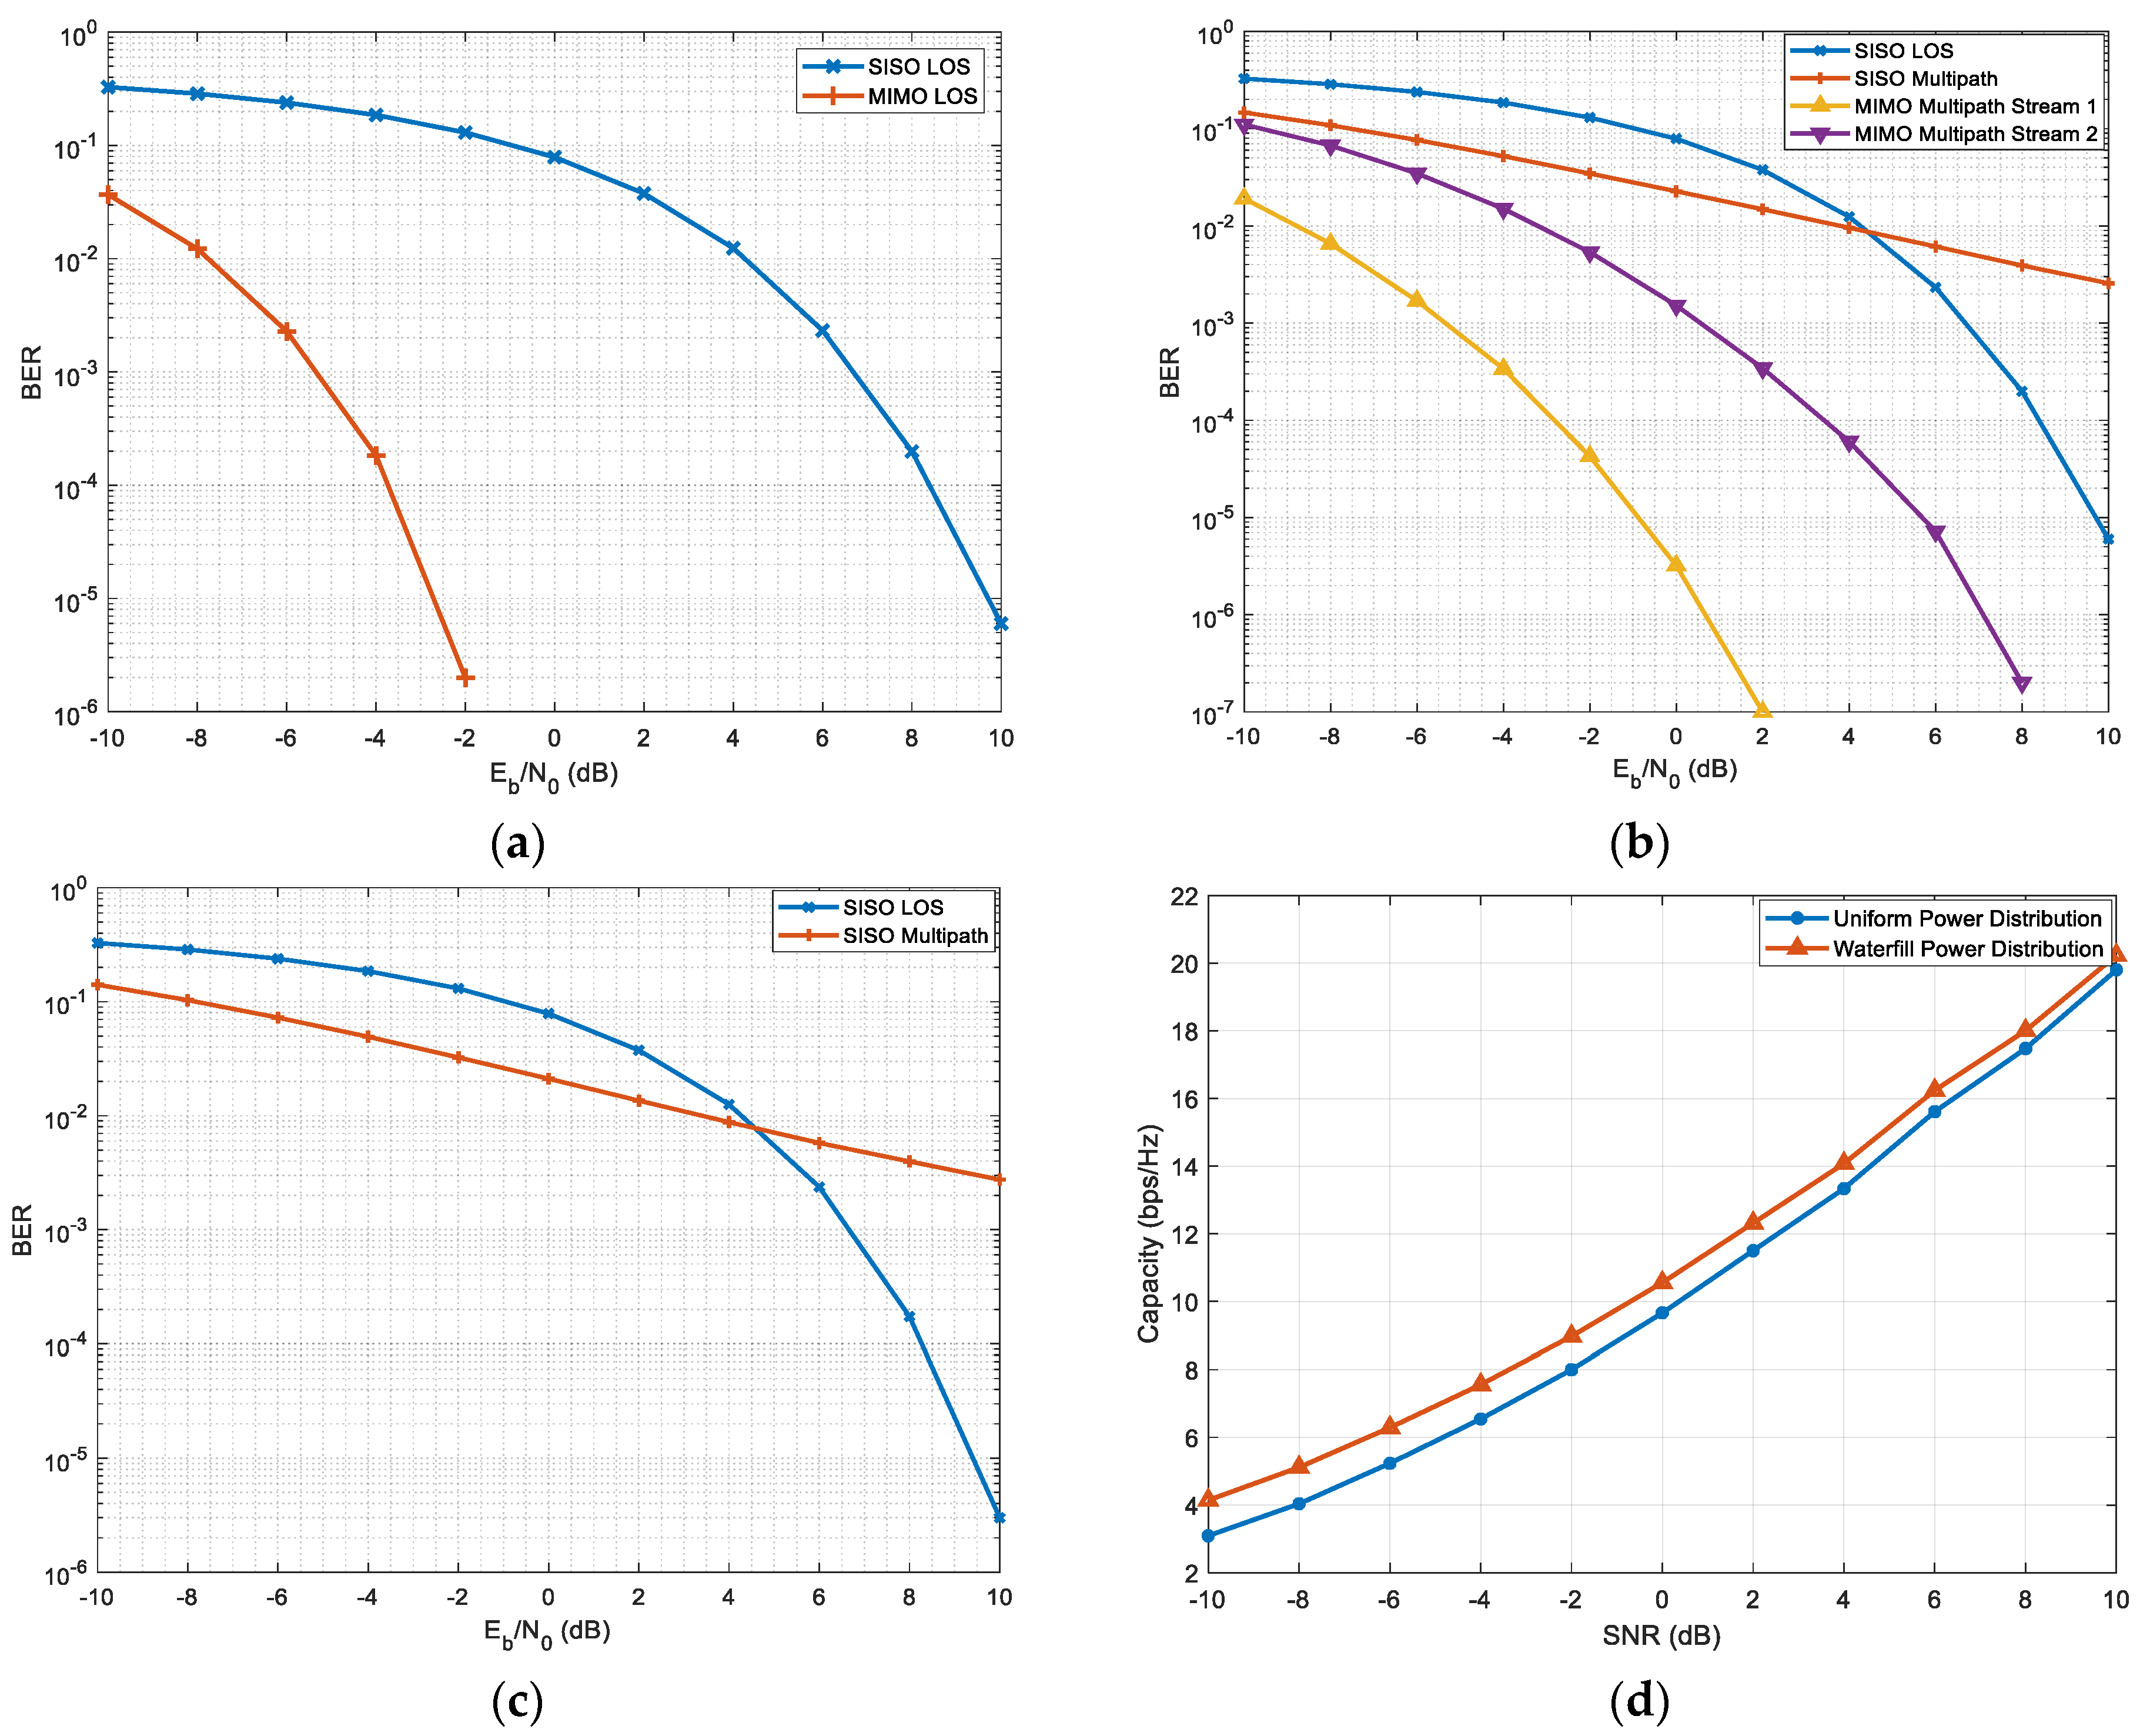
Propagation along a line of sight (LOS) is the fundamental component of a wireless channel. This style of waterway can be found in many rural areas. Antenna arrays in this situation can increase the bit error rate (BER) of the communication channel by increasing the SNR at the receiver.
Figure 14 displays the bit error rate (BER) for binary phase shift keying (BPSK)-modulated single-input-single-output (SISO), multiple-input-single-output (MISO), single-input-multiple-output (SIMO), and MIMO communication systems. When compared to an SISO LOS channel, the energy-per-bit to noise power spectral density ratio
of the BER increases more slowly due to fading brought on by multipath propagation. In order to simulate the BER curve for a fading channel, it is necessary for the channel to vary over time. Let us assume that there are 1000 frames, each consisting of 10,000 bits. The baseline SISO multipath channel BER curve can then be constructed as shown in
Figure 14c [
63].
Spatial multiplexing splits the channel matrix into several modes so that the data stream can be recovered separately from the received signal. This is conducted by separating the transmit array elements from the received signal. Precoding the data stream before transmission and merging it after reception achieves this. By simply receiving a scaled version of the transmit array element, each receive array element behaves like a few orthogonal subchannels within the main channel. Since the dominant transmit and receive directions correspond to the first subchannel, there is no loss in diversity benefit.
In the future, data for the first two subchannels will also be able to be transmitted over additional subchannels. Even if the second stream uses a subchannel that is less dominant and does not produce as much gain as the first stream, the overall information throughput is boosted. Sending data in an MIMO system makes the most sense when power is distributed equally among transmit units. The capacity of the channel can be further enhanced, though, if it is known at the transmitter. In this case, the transmitter can decide to restrict transmission to subchannels that, when filled to the specified SNR, can transmit [
60]. The result confirms that the water fill algorithm provides a larger system capacity than the uniform power distribution. The difference becomes less pronounced as the system-level SNR rises.
The advantage of the array starts with an increase in SNR in the LOS channel. To maximize control and flexibility with beamforming in an active array architecture, it is ideal to have separate weighting control over each antenna array component [
64]. To complete this, each element needs its own transmit/receive module. This type of architecture is difficult to implement for array sizes that are typical of massive MIMO communication systems due to limitations on cost, space, and power. As a result, it is possible to consider the single scatterer scenario or the LOS channel example as a particular instance of precoding. When there is just one path available between the transmit and receive arrays, precoding turns into a beamforming technique.
Array processing can enhance the quality of an MIMO wireless communication system. Depending on the characteristics of the channel, the arrays can be utilized to either raise the SNR by array gain, diversity gain, or increase the capacity through spatial multiplexing.
3.8. Challenges for 5G Network Implementation in Oceania
The next major step in the industrial revolution is the deployment of 5G, which must be completed correctly. High data speeds, low latency, and other promises made by the 5G network can help communication service providers (CSPs) and businesses boost their revenue significantly because of the superior 5G services. Swift deployment of 5G for end users is the objective of telecom carriers. However, CSPs face several obstacles in the fast adoption of 5G technology [
65].
After 5G technology adoption is carried out on a large scale, brand-new use cases will emerge. High-frequency bands will become more in demand as a result. The CSPs are compelled to create a compelling economic use case since spectrum is a crucial resource due to its cost and availability. The telecom operators must decide on the frequency bands and modify their 5G network and features accordingly because these spectra must be obtained from governments at auction. As a result, providing top-notch 5G services with a constrained spectrum may result in greater operational costs.
First and foremost, CSPs need to have a well-defined plan for implementing 5G network slicing and other arrangements. Second, after settling on a strategy, how they approach deployment will determine how the deployment process turns out. To finally target specific 5G use cases, CSPs will create their deployment model and approach based on the spectrum networks they have purchased. The widespread use of mm-Wave frequencies and 5G small-cell towers, which call for a new deployment strategy and compliance with regulations, are further obstacles to the installation of 5G networks.
Additionally, 5G transmits and receives data across several frequencies. For ultra-low-latency connections over short distances and dependable long-distance communication, numerous bands are essential. To ensure that data are transmitted along the most effective route, 5G uses high, medium, and low bands [
66].
For instance, IoT sensors on the factory floor will use the high band for optimum performance, while 5G signals that can travel dozens of miles will use the low band. By using these bands, 5G signals may not only travel farther distances but also pass through materials like glass, sheet metal, and concrete.
In theory, 5G coverage should be superior to 4G coverage in LOS scenarios due to 5G beamforming, and near- and far-field SINR should be comparable to or better than 4G. According to the measured statistics, the Reference Signal Receiving Power (RSRP) of the 5G network is better than the RSRP of the 4G network in most of the sample scenarios under the same circumstances. The measured SINR value is consistent with the expected theoretical analysis and can demonstrate the advantages of 5G beamforming. Moreover, in the case of light blockage, 5G should match LOS better than 4G; in the case of heavy siege, both 4G and 5G networks will suffer from significant attenuation, and 5G penetration and coverage will be lower than that of 4G networks [
67].
3.9. Potential Health Hazards Linked with 5G Technology
Mobile phone technology’s usage of electromagnetic radiation has sparked worries about potential health dangers, such as a higher risk of developing some malignancies. The World Health Organization (WHO) claimed in 2014 that there was no evidence connecting mobile phone use to harmful health impacts [
68]. However, all radio frequency radiation, including mobile signals, was categorized as potentially carcinogenic by the WHO and the International Agency for Research on Cancer (IARC) [
69].
Concerns about the safety of radiofrequency radiation were raised after it was found that male rats exposed to high amounts of it developed a malignant tumor in the heart, according to a toxicology study released by the US Department of Health in 2018 [
70]. In the study, rodents were subjected to radiation from mobile phones for two years, nine hours a day, beginning before birth. However, no correlations to cancer were discovered in the tested female rats or mice. The research also revealed that radiation-exposed rodents outlived their control counterparts.
The WHO and the Food and Drug Administration (FDA) both regard 5G as safe. Collins further claims that “all wireless communications use nonionizing electromagnetic radiation to transmit energy and information through space without the need for wires”. According to him, 5G’s electromagnetic waves “have a greater frequency, allowing it to transmit more information”. It also enters the body less deeply and with a shorter wavelength than energy with a lower frequency [
71].
The UK government states that, while a very small increase in overall exposure to radio waves is possible when 5G is added to the existing network, the overall exposure is expected to remain low. The frequency range of the current 5G signals is substantially lower than what the International Commission on Non-Ionizing Radiation Protection deems to be harmful and falls within the non-ionizing band of the electromagnetic spectrum [
72].
3.10. Resilient Communication Is Made Possible for the Linked Intelligent Edge by 5G
The number of connected smart devices keeps growing and diversifying as 5G drives the creation of the connected intelligent edge and speeds up the cloud economy [
73]. The attack surface of end-to-end systems grows even as that expansion propels digital transformation across a wide range of businesses.
We therefore require a flexible and reliable platform that can deliver security and privacy at scale across numerous deployments and use cases. One such platform is 5G with a connected intelligent edge [
74]. While 5G currently satisfies the high standards of today, we anticipate that 5G advanced will introduce new levels of data safety for a rising number of connected devices and services throughout the course of this decade [
75].
The initial 5G concept included support for a strong and secure system in addition to a wide range of devices, services, and deployment scenarios [
76]. A wide range of security improvements were added with 5G, building on the established LTE security framework and implementation expertise. The user-plane integrity protection upgraded and flexible authentication procedures, slice-specific authentication and authorization, and service-based interface security were among the key features. All of these sought to provide a system architecture with an end-to-end security strategy.
These features also provide a flexible framework that enables the protection of various deployments outside of mobile broadband, such as sidelink, vehicle-to-everything (V2X), multi-access edge computing, mobile broadcast, private networks, IoT, and more [
77]. Furthermore, these features were designed in alignment with functional enhancements developed for various verticals.
The 5G network is built to adhere to zero-trust cybersecurity principles [
78]. The foundation of a zero-trust security model is the idea that no user or network function can be relied upon. Every time someone attempts to access system resources, whether they are located inside or outside of the network, verification is required. By implementing strong authentication and granular permission, this approach shifts the emphasis away from network perimeter security and toward limiting access by internal and external users and software components. Instead of emphasizing network segment security, it focuses on securing resources, including data, computer resources, applications, and services.
With fine-grained service authentication and authorization, the core network’s service-based architecture (SBA), introduced with 5G, enables zero-trust security.
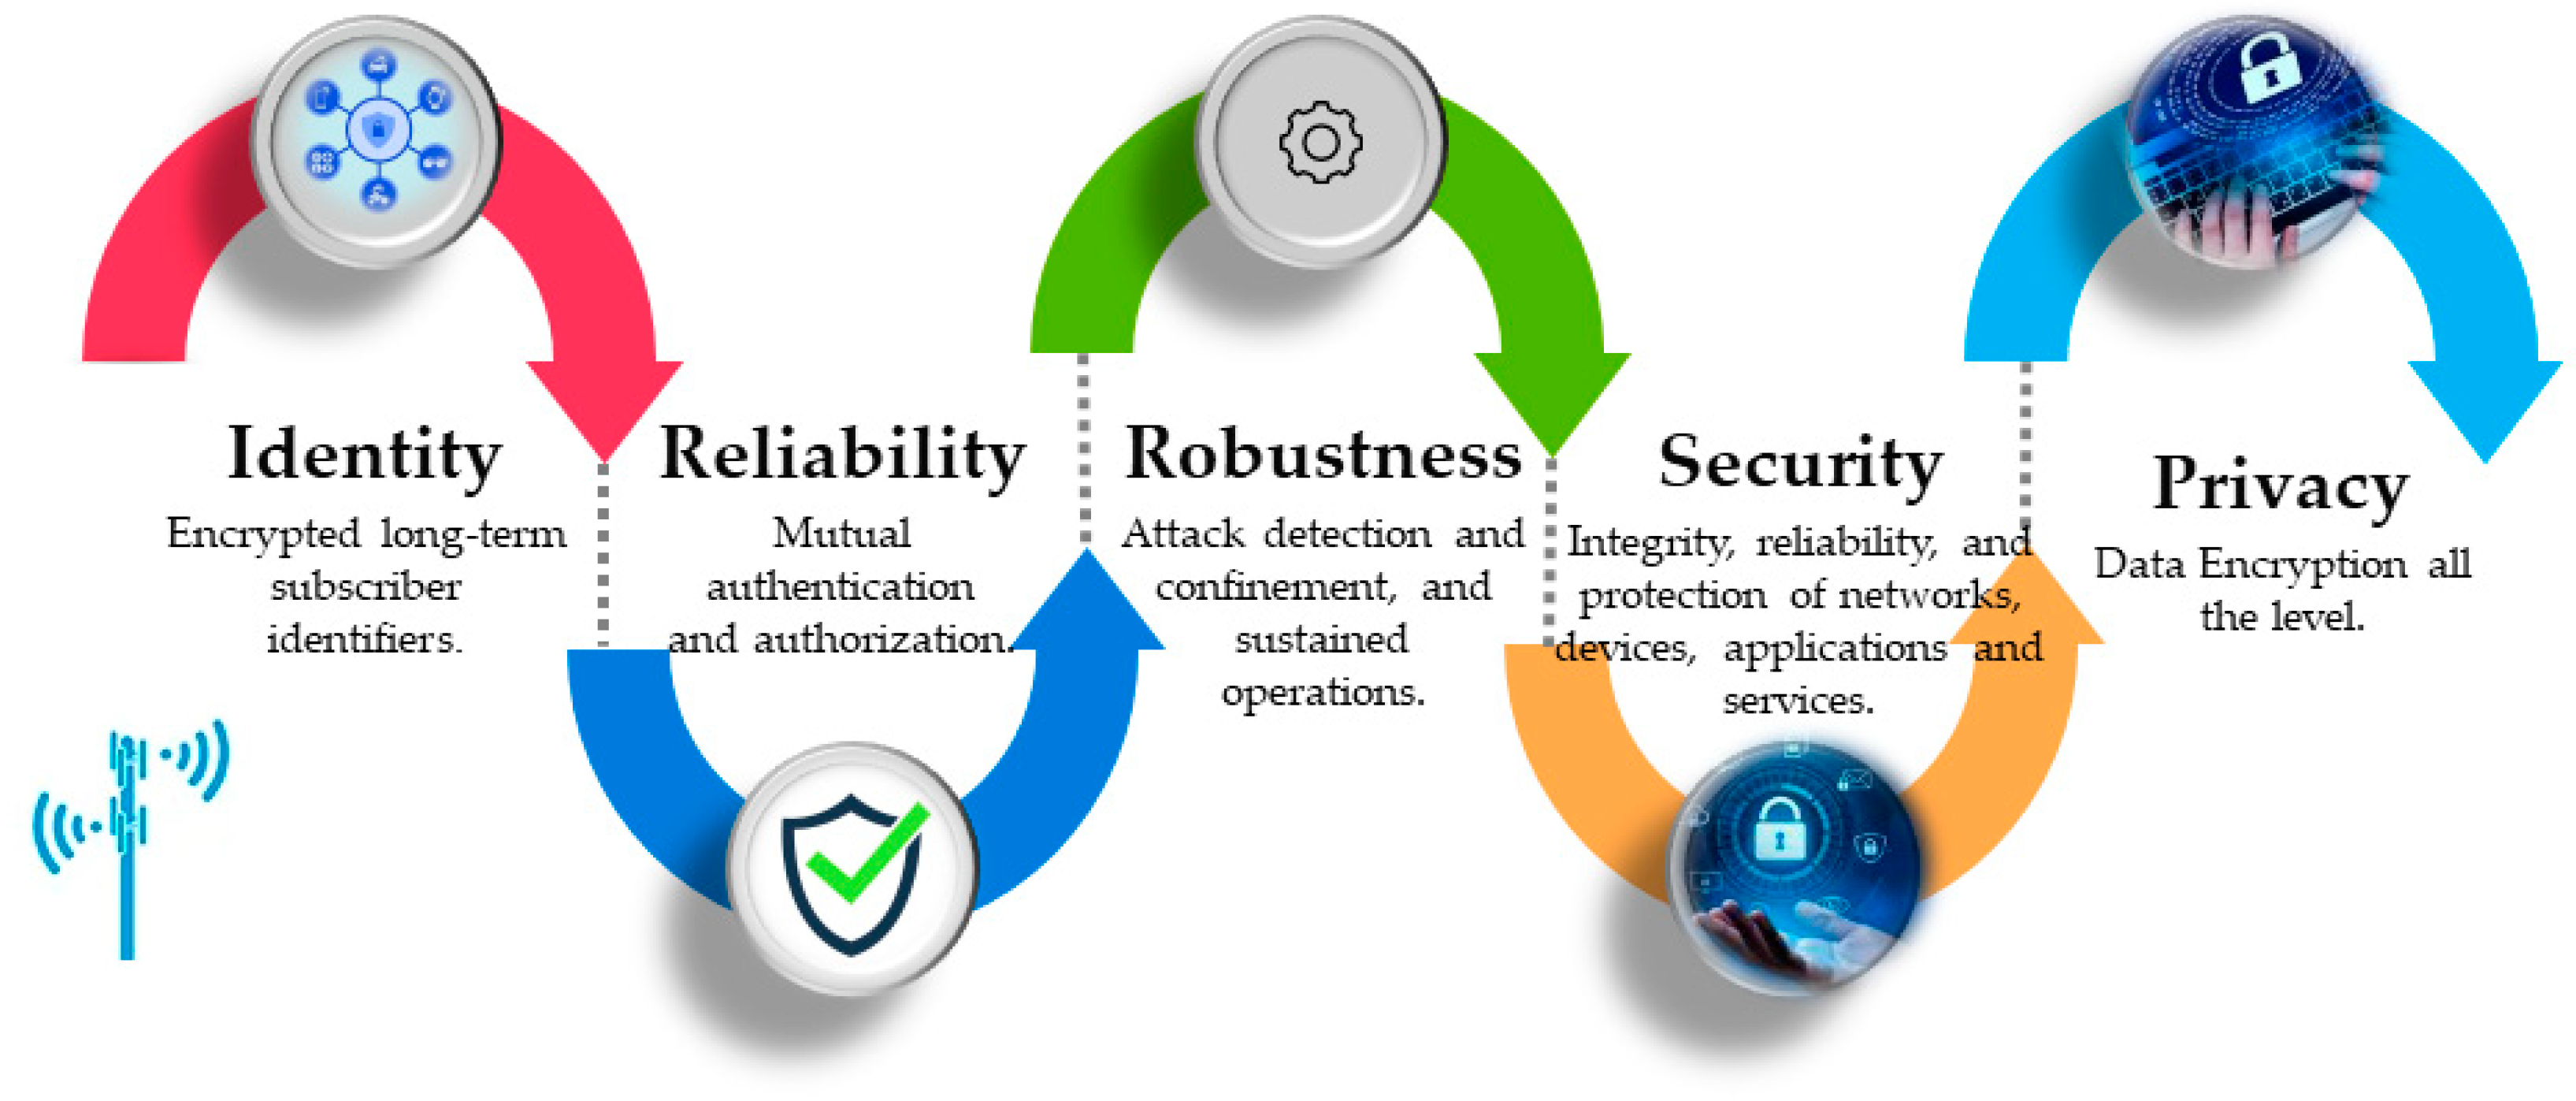
Figure 15 shows 5G communication’s long-term resiliency. Additional end-to-end security features include
Mutual identification and approval;
Integrity verification and encryption in the user and signaling planes;
Encryption using the Subscription Permanent Identifier (SUPI);
Internet Protocol Security (IPSec)-encrypted radio communications with the core network;
Interconnection for secure roaming using a Security Edge Protection Proxy (SEPP).
It will be necessary to disaggregate and distribute cloud computing throughout the connected intelligent edge, closer to the user, to effectively handle the rising demand for data and 5G services. Likewise, projects like the open RAN (O-RAN) have changed the topologies of mobile network designs to include disaggregation and virtualization for scalability, efficiency, and performance [
79]. From a security standpoint, the disaggregated RAN architecture outlined in O-RAN offers numerous advantages, including increased security agility, adaptability, and resiliency. Cellular system security will be strengthened in several ways, including interface and software security and the adoption of zero-trust security, thanks to the transparency offered by O-RAN, among other qualities.
A 5G system that is resilient is consistently available, dependable, operates as expected, and bounces back rapidly from attacks or disruptions. A resilient 5G system’s technical capabilities combine security, privacy protection, robustness, availability, and reliability. These key characteristics are already present in today’s telecom networks and are expanded even more by new tools and skills.
Existing crucial societal functions are being increasingly shifted online and are starting to rely on telecom networks. New use cases are being realized at the same time as new capabilities are emerging. Due to this, traditional telecom networks are becoming the main innovation platform for business and society. Mission- and business-critical use cases have increased the demand on the 5G system.
To protect against the constantly changing risk and threat landscape in the various stages of the supply chain and operations, networks must be used to realize the Internet of Senses, connected intelligent machines, digitalized and programmable physical world, and connected sustainable world. It is even more important that security controls and assurance procedures are seamlessly integrated for AI-based security and trust management on the operations side.
The foundation for supporting the most demanding societal, mission, and business-critical use cases is a secure, resilient, and privacy-preserving network platform with demonstrated performance in challenging environments in a verifiable manner. All product lifecycle phases, including network development, deployment, and operation, must have built-in security automation and assurance capabilities. It is feasible to react in real time to known and undiscovered threats thanks to improved security and critical service assurance procedures, AI-based security, and trust management.
The intelligent network platform offers varying degrees of security, privacy, dependability, availability, and resilience depending on the use cases. On the path from 5G to 6G, various building components have been found to realize these properties.
5. Conclusions
To attain critical performance attributes like up to 10 Gbps data speed, 99.99% availability, and 99.99% reliability, 5G networks running in higher frequency bands must have 100% network coverage. However, inaccurate coverage estimates can adversely affect network performance in two ways: (i) coverage underestimation would result in overlap among neighboring cells, resulting in inter-cell interference; (ii) coverage overestimation may lead to poor reception at cell edges. Therefore, an essential task is the accurate estimation and planning of RF coverage. That is covered in this study, along with high-level implementation and accurate estimation of the tilting angles of the antennas. It covers RF link budget analysis, network layout design with cell aggregation, propagation modeling, and transmission site design with integrated phased array MIMO antennas. Wave propagation, 5G urban link analysis, and radio coverage of small-cell 5G transmitters are also included in the study using the shooting and bouncing ray tracing technique with different amounts of reflections, diffractions, and launched rays. The improvement regarding SNR and capacity using 5G antenna arrays was examined. The research indicates that deploying the suggested 5G coverage in Fiji’s vast but sparsely inhabited regions would cost more money. The conventional telecommunications infrastructure that is currently in use is more lucrative for the less populated areas of Oceania and Fiji.
This paper also discusses the practical deployment obstacles that must be solved for a quicker rollout of the 5G network, including the cost of spectrum, precise cell site planning, the acquisition of thousands of new cell site sites, 5G mobile devices, and backhaul. However, a few elements, such as spectrum licensing costs, site building costs, electrical grid tariffs, staff salaries, depreciation, etc., were not considered in this work. Future extensions of this study might involve considering these elements.


