1. Introduction
5G NR systems are already appearing on the market providing broadband connectivity in both microwave (μWave) and millimeter wave (mmWave) bands. The critical distinguishing feature of 5G is that its services are not limited to enhanced mobile broadband (eMBB) but cover a wide range of use-cases and applications in various deployments including the Industrial Internet of Things (IIoT) [
1]. In these deployments mmWave promises to bring a lot of opportunities due to the abundance of bandwidth available at the air interface and extreme directionality of communications [
2].
In industrial scenarios, 5G NR promises new applications, such as the joint remote control of mobile robots, wireless time synchronization, positioning, augmented reality services for personnel, and telepresence-based maintenance operations [
3]. Examples of such applications include the systems that control the moving elements of manufacturing equipment and commonly generate low-rate traffic but require ultra-reliable low-latency service (URLLC), and video-guided machinery or mobile robots that require enhanced mobile broadband (eMBB) service [
4]. The strict latency requirements of URLLC applications may require utilization of device-to-device (D2D) communications in industrial deployments [
5]. In this operational regime, to avoid excessive interference in highly dense deployments of sensory equipment, the latter naturally requires directional transmissions at the user equipment (UE) side, which is available in mmWave band. This mode allows UEs to operate in D2D mode with coordination of transmissions from the BS or even without it [
5]. This also allows the number of UEs in the deployment to be increased without drastically increasing the overall interference level [
6].
In general, blockage of the propagation paths in an industrial environment is a generally more complex modeling task as compared to capturing human body blockage. The rationale is that factory spaces can contain many large metal racks, robots, and moving devices. In mmWave, most of the signal power is delivered to the receiver through the LoS path. The presence of multiple adjacent blockers interferes with the LoS between two UEs that are operating directly either by the BS or the UE. Therefore, it is extremely important to pay attention to the characteristics of blocking in such specific conditions: (i) the predominant material utilized for construction, such as concrete and the material used for equipment in industrial installations, such as different type of metals; (ii) careful spatial planning of UEs to avoid LoS blockage.
In industrial environments, there are a large number of factors that have a strong influence on the propagation of a mmWave signal, with blockage having a strong impact on the communications in mmWave band. Depending on the communications scenario, blockage may occur between two UEs that communicate directly (e.g., performing synchronization or other time-critical tasks), or between UE to BS communications. Blockage leads to serious consequences only at high frequencies, in the mmWave range. At the same time, such frequencies are preferable for UEs, since they allow to significantly reduce the size of the antennas, leading to miniaturization, and also resulting in a much lower interference level which is critical for both considered scenarios.
A blockage phenomenon in the industrial environment is drastically different from the human blockage [
7,
8] or building blockage scenarios [
9,
10,
11] that have been studied in detail recently. First of all, machines performing actions on the factory floor are inherently mobile, performing periodic movements such as those executed by mechanical arms [
12,
13]. As opposed to purely stochastic mobility such as that inherent for humans in open spaces, this type of periodic mobility is more complicated to deal with using the stochastic geometry that is conventionally utilized to characterize blockage probability [
14]. Secondly, the industrial deployments are not fully stochastic, while the ones conventionally utilized in human body blockage models are. Instead, industrial machines are deployed on the grids and associated with production lines [
15]. Dealing with semi-regular deployments is usually more complicated as compared to purely random ones, governed by, e.g., the Poisson point process [
10].
In this paper, we develop the blockage model for complex IIoT deployments with machines performing periodic actions. To this aim, we combine the tools of photogrammetry and stochastic geometry on random lattice grids. The former is utilized to build the so-called transparency map of mechanical equipment utilized at the factory floor while the latter is further applied to build and solve the deployment scenarios of interest suitable for different types of industries by using standard methods of stochastic geometry techniques.
Our main contributions are:
a composite model for blockage probability in industrial deployments of mmWave 5G technology based on photogrammetry and stochastic geometry;
numerical results characterizing blockage probability in light and heavy industry environments as a function of machine deployment density and link distance;
observations that: (i) direct UE-UE communications are feasible in sparse deployments or at small communications distances; (ii) base station (BS) height is a critical parameter affecting LoS blockage in UE-BS communications mode; (iii) to maximize BS-UE blockage probability one needs to deploy UEs at the highest possible height that typically coincides with machine heights.
The rest of the paper is organized as follows. The related work is provided in
Section 2. We present our system model in
Section 3. In
Section 4 we develop the blockage model by an individual machine. Further, in
Section 5, we derive the blockage probability in industrial deployments. Numerical results are provided and discussed in
Section 6. Conclusions are drawn in the last section.
2. Related Work
The blockage phenomenon in industrial deployments has recently attracted significant attention from the research community. Specifically, the authors in [
16] utilized computer simulations to obtain the line-of-sight (LoS) blockage probability in the factory environment with a size of 120 m × 50 m × 11 m, as stipulated by 3GPP TR 38.824 [
17]. The walls of the factory are made of concrete, and the space of the hall is equipped with various types of machines, robots, piles of metal objects, cranes, and other obstacles that are modeled as blockers. Dense deployment of BS according to TR 38.901 [
18] is assumed, implying that
of the factory’s floor is covered with metal blockers and the transmitters are placed above the blocking units. The blockers have a size of 3 × 3 m with a variable height in the range of 2–7 m.
Specifically, in [
16], two homogeneous network schemes with 12 and 6 BSs are investigated. BSs are installed on the ceiling at a height of 11 m. The minimum distance between the transmitters is 28.28 m for the case of 6 BSs and 20 m for 12 BSs. Three operational bands have been considered, 3.5 GHz, 28 GHz and 60 GHz. The same downlink transmission power has been used for all BS without power control functionality.
By utilizing computer simulations, the authors compared the results of simple LoS blockage and ray-tracing based LoS blockage. In the former case, a user’s equipment is assumed to be in an outage when LoS is blocked while in the detailed ray-traced model, outage is explicitly modeled based on the received power. The obtained simulation results show that the simplified LoS-based blockage model may produce pessimistic results in terms of the fraction of time in outage conditions.
In [
19], extensive measurements of mmWave channels have been carried out in industrial environments by using both specialized measuring equipment at 60 GHz. In [
19], the measurements have been carried out at the ALBA synchrotron, which is an elementary particle accelerator in Barcelona. This facility was chosen because of its diverse characteristics that resemble various industrial environments. The authors utilized IEEE 802.11ad WiGig access point (AP) operating in mmWave 60 GHz band. The following methodology has been utilized. AP mounted at a certain place has been utilized to measure signal quality indicator (SQI), packet error rate (PER), blockage, and throughput with UE located in several places. To generate traffic perf tool has been utilized [
20]. The results of the study demonstrate that blockage has a principal impact on the achieved UE rate. Furthermore, reflectors play a fundamental role in IIoT deployments. Authors even suggest that highly irregular characteristics of industrial scenarios is not a challenge for mmWave communications, but rather are an advantage in most cases.
In [
21], the authors address the challenge of efficient content distribution in typical industrial automation scenarios, offering the use of moving industrial machines as caching assistants. Specifically, mobile content is cached on intermediate nodes to reduce the volume of transmitted traffic and avoid duplicate downloads of popular data. This approach has been shown to reduce the response time in case of outages of UEs, improve spectral efficiency, and reduce energy consumption. To characterize blockage probability, the authors suggested utilizing photogrammetry to construct a transparency map of the deployment as UE moves around. However, the proposed methodology was purely simulation-based, providing no convenient way to assess blockage probability. Note that in our study we utilize photogrammetry differently to construct a transparency map of specific industrial machines.
To the best of the authors’ knowledge, the study in [
5] is the only one where analytical blockage model for industrial deployments has been proposed. Specifically, they utilized the integral geometry approach to assess whether a LoS path crosses at least one industrial machine. Although the blockage probability is provided in an analytical form, it features the binomial coefficients of high order, making the calculations cumbersome. Additionally, completely stochastic deployment of machines on the factory floor has been assumed, which contradicts conventional semi-regular deployment conditions [
15].
The abovementioned review illustrates that blockage of propagation paths in IIoT deployments is a critical question affecting the performance of UEs. It is also a challenging task due to complex deployment conditions characterized by the semi-regular deployment of production lines on the factory floor, presence of metallic components in the environment, and also the periodic movement of machines. Furthermore, there is a clear lack of mathematical models allowing to build reliable performance evaluation scenarios. In this paper, we fill this void by proposing a simple model that captures these inherent properties of industrial deployments.
3. System Model
In this section, we introduce our system model. We start with the deployment model, then introduce models of individual machines for light and heavy industry. Finally, we sketch the proposed methodology.
3.1. Deployment Model
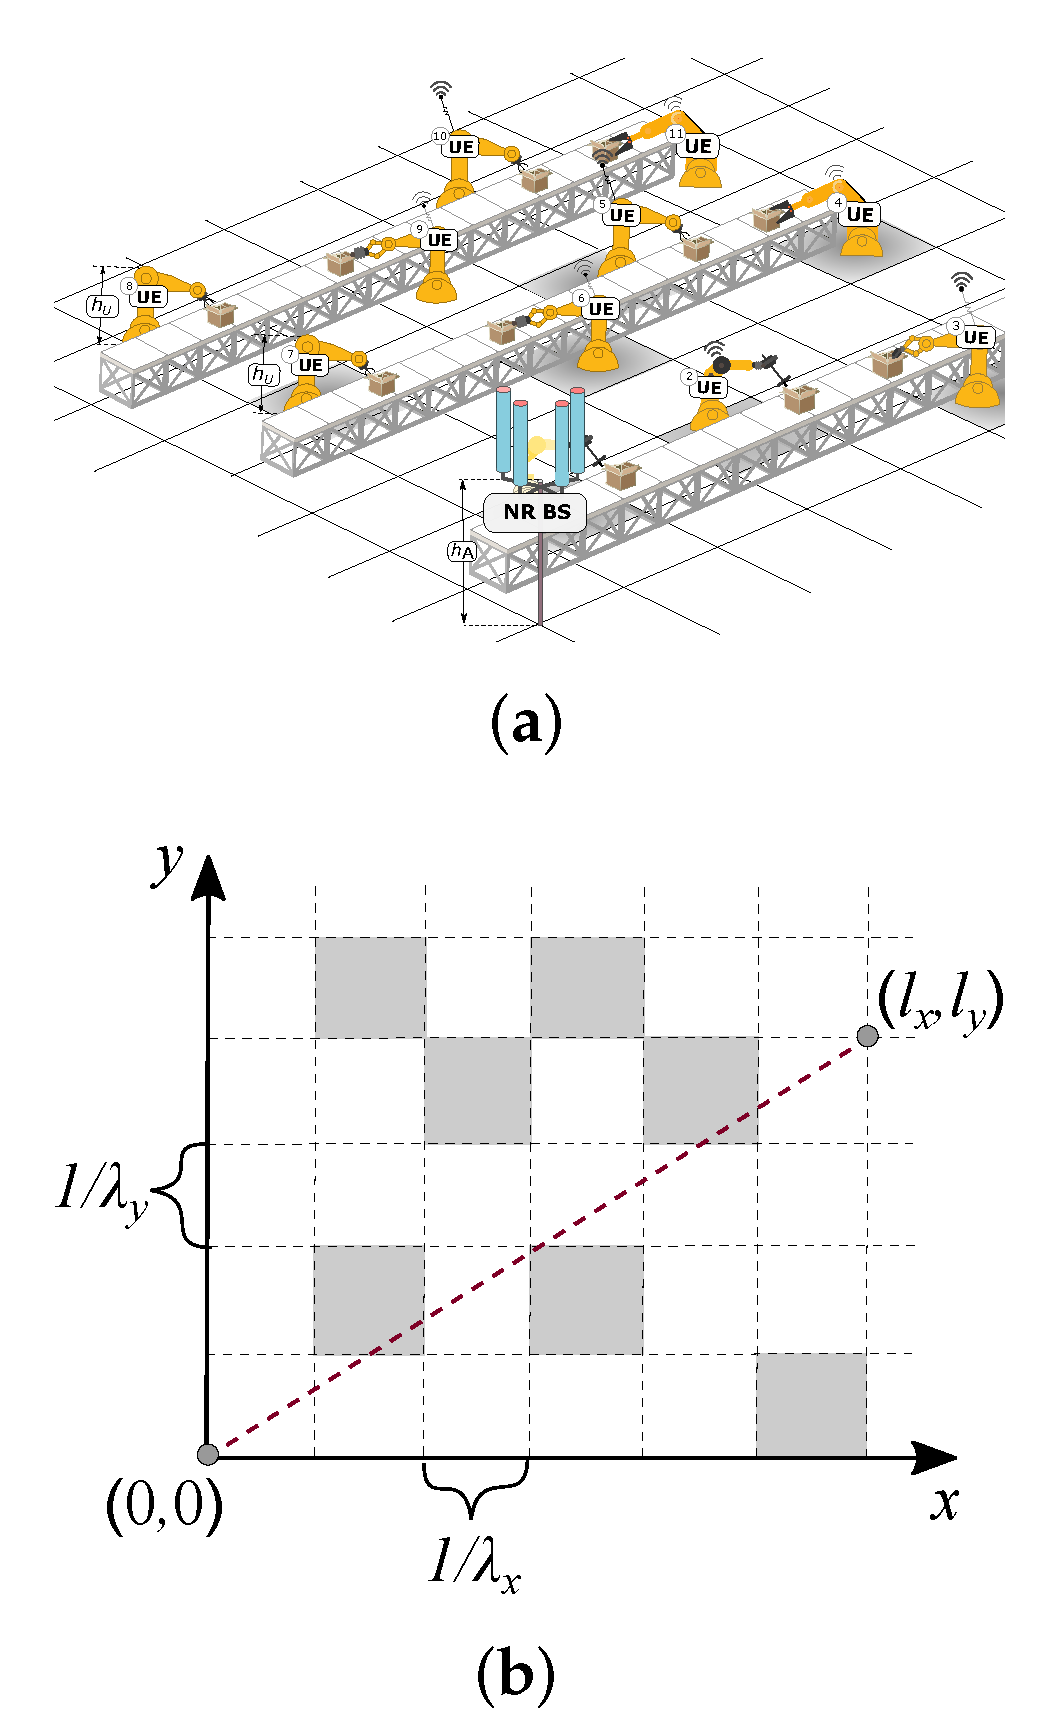
We consider a mmWave 5G NR deployment model in an industrial environment, such as an automated factory with multiple production lines, as illustrated in
Figure 1. Here, various industrial robotized machines are installed along the production lines (conveyors) performing some actions while producing goods. During the production process these machines are expected to require communications between each other to exchange the current state information leading to D2D communications scenario. On top of this, remote monitoring of the production process via cameras installed at machines may further require UE to BS connectivity. These are two communications scenarios we address in what follows.
The considered factory deployment scenario is illustrated in
Figure 1a. We assume that machines are located on the factory floor according to Manhattan Poisson Line process (MPLP) [
22,
23]. The process is defined by two homogeneous Poisson processes along
x- and
y-axes with intensities
and
, accordingly, where the mean inter-line distances,
and
, correspond to the width and length of industrial machines. Each point is associated with a line parallel to coordinate axes as shown in
Figure 1b. The rationale for choosing this process is that it includes stochastic factors related to random locations of production lines in different factories but still maintains a certain degree of regularity related to constant distances between machines on adjacent lines reflecting basics of industrial deployments [
15].
The resulting MPLP process organizes a stochastic lattice grid. To capture industrial deployments with different densities of equipment, we assume that the probability that a lattice cell contains an autonomous machine is
. Thus, as one may observe, the overall number of machines in any limited area follows a binomial distribution. Without the loss of generality, BS or UE is assumed to be located at the height
in the bottom-left corner of the grid. The UE under analysis is located on the factory floor at
and
distance as measured from the bottom-left corner, see
Figure 1b. This UE is assumed to be installed at height
. Note that when the first UE is a machine itself, we consider D2D communications,
, otherwise, the height of BS is assumed to be higher than that of UE, i.e.,
.
3.2. Models of Individual Machines
For individual machines, we utilize 3D high-precision animated models freely available in the BlenderKit database [
24]. To assess LoS blockage probability in different mmWave 5G deployment conditions, we differentiate between models inherent for light and heavy industries. The size of machines—width
, length
, and height
—are dictated by the model and provided as a part of the model’s description. For heavy industry, the following models have been selected:
Universal Robot Ur5e with two-finger grip RG2 [
25]. A lightweight, very flexible, and compatible industrial robot arm allows to automate repetitive and dangerous tasks with a load capacity of up to 50 kg. This robot is ideal for optimizing small collaborative processes such as collection, placement, and testing. Thanks to a working radius of up to 0.85 m, it ensures accessibility of everything within reach. The RG2 flexible gripper can be used for parts of a wide variety of sizes and shapes;
Kuka Quantec robot with pallet gripper [
26]. A heavy-weight robot equipped with a pallet gripper. It has a load capacity of up to 240 kg and a range of up to 3.2 m. It is specially designed for complex pallet stacking tasks, its power and dynamic characteristics are suitable for trouble-free stacking of several pallets to a large height. It is also possible to use in conditions of low temperatures up to −30 degrees. Due to its versatility, the robot is suitable for use in almost all industries from the medical sector to the automotive industry and foundry.
For the light industry, the following have been chosen:
Two-handed robot KUKA Iiwa 14 [
27]. A special robot with a double lever with an additional central vertical axis and two parallel grips. Each arm has a load capacity of up to 14 kg and a range of up to 0.9 m. It is excellent for coating, machining and polishing, palletizing, assembling, moving and other operations with materials;
KUKA Iiwa 14 robot with linear block and two-finger grip [
27]. A lightweight robot with a load capacity of up to 14 kg and a linear block, which is used as an additional axis, significantly expands the working space of the robot, in this case, up to 3.8 m. Up to four robots can be used on one control unit. This model is suitable for delicate assembly work.
Note that all the considered autonomous machines perform periodic movements of their mobile parts. The intensity of these movements depends on the particular use case. We also assume that movements of different machines appear to be de-synchronized for an external observer, i.e., communications technology. Note that this does not necessarily mean that these machines do not perform a certain procedure aligned in time. Synchronized movements can also be taken into account by redesigning the model as discussed below. When deriving the generic model below we will also consider two cases of machines’ heights, : (i) is a random variable with probability density function (pdf), , and cumulative distribution function ; and (ii) is constant and given by the machine model’s dimension.
3.3. The Proposed Methodology
The overall proposed methodology for LoS blockage analysis consists of two stages. At the first one, photogrammetry is utilized to build the so-called “transparency map” of the autonomous machines listed in the previous section. This map provides the probability of having an unobstructed LoS path “through” a certain geometric location of the autonomous machine. The snapshots taken at different yaw (normal axis) and pitch (transverse axis) angles are then superimposed to produce the final transparency map of a machine providing a probabilistic assessment of blockage for different geometric locations of LoS passing through a machine. Depending on the required accuracy, the LoS blockage probability can be further averaged over different angles to produce an averaged blockage probability. Alternatively, one may utilize the produced transparency maps without averaging. In this case, the LoS probability will depend on the geometric coordinates of the LoS path crossing a machine.
Once the first stage is completed, an MPLP process with a certain composition of autonomous machines and site occupancy probability fitting a scenario of interest is defined. This process is then analyzed by utilizing conventional tools of stochastic geometry to produce the sought LoS blockage probability with a UE located at coordinates . To produce the final average blockage probability we will integrate it over different locations of UE in the environment.
4. Individual Machine LoS Blockage Probability
In this section, we formulate the individual machine blockage probability by utilizing photogrammetric approach.
To assess the blockage probability of an individual machine we will utilize photogrammetric approach. At the glance, the procedure consists in observing the animated model over the full period of action at different yaw and pitch angles and creating the associated static transparency maps. A transparency map consists of 0 s and 1 s, where 1 represents the blocked LoS while 0 corresponds to the non-blocked conditions. Blocked and non-blocked conditions are distinguished based on the background color serving as a template. A timestamp , where T is the fill action period of a model, and yaw and pitch angles and fully define a blockage probability of an individual machine in time and space. Note that in the case of D2D communications, the only pitch angle is sufficient. The rest of the procedure is performed by utilizing binary transparency maps. Specifically, to obtain an average transparency map, we average individual maps based on the timestamps and angles.
To perform this, step we utilize a free and multi-functional 3D modeling program—Blender Modeller [
28]. This tool allows the creation and animation of 3D models of realistic industrial environments, namely, perfectly implemented animation of solids, several built-in visualization tools with various renderers, a large selection of tools for 3D modeling, a wide selection of textures, and shader sets. The transformation of illustrations into matrices was performed in the Matlab/Simulink software environment using the MATLAB language.
The step-by-step methodology is as follows:
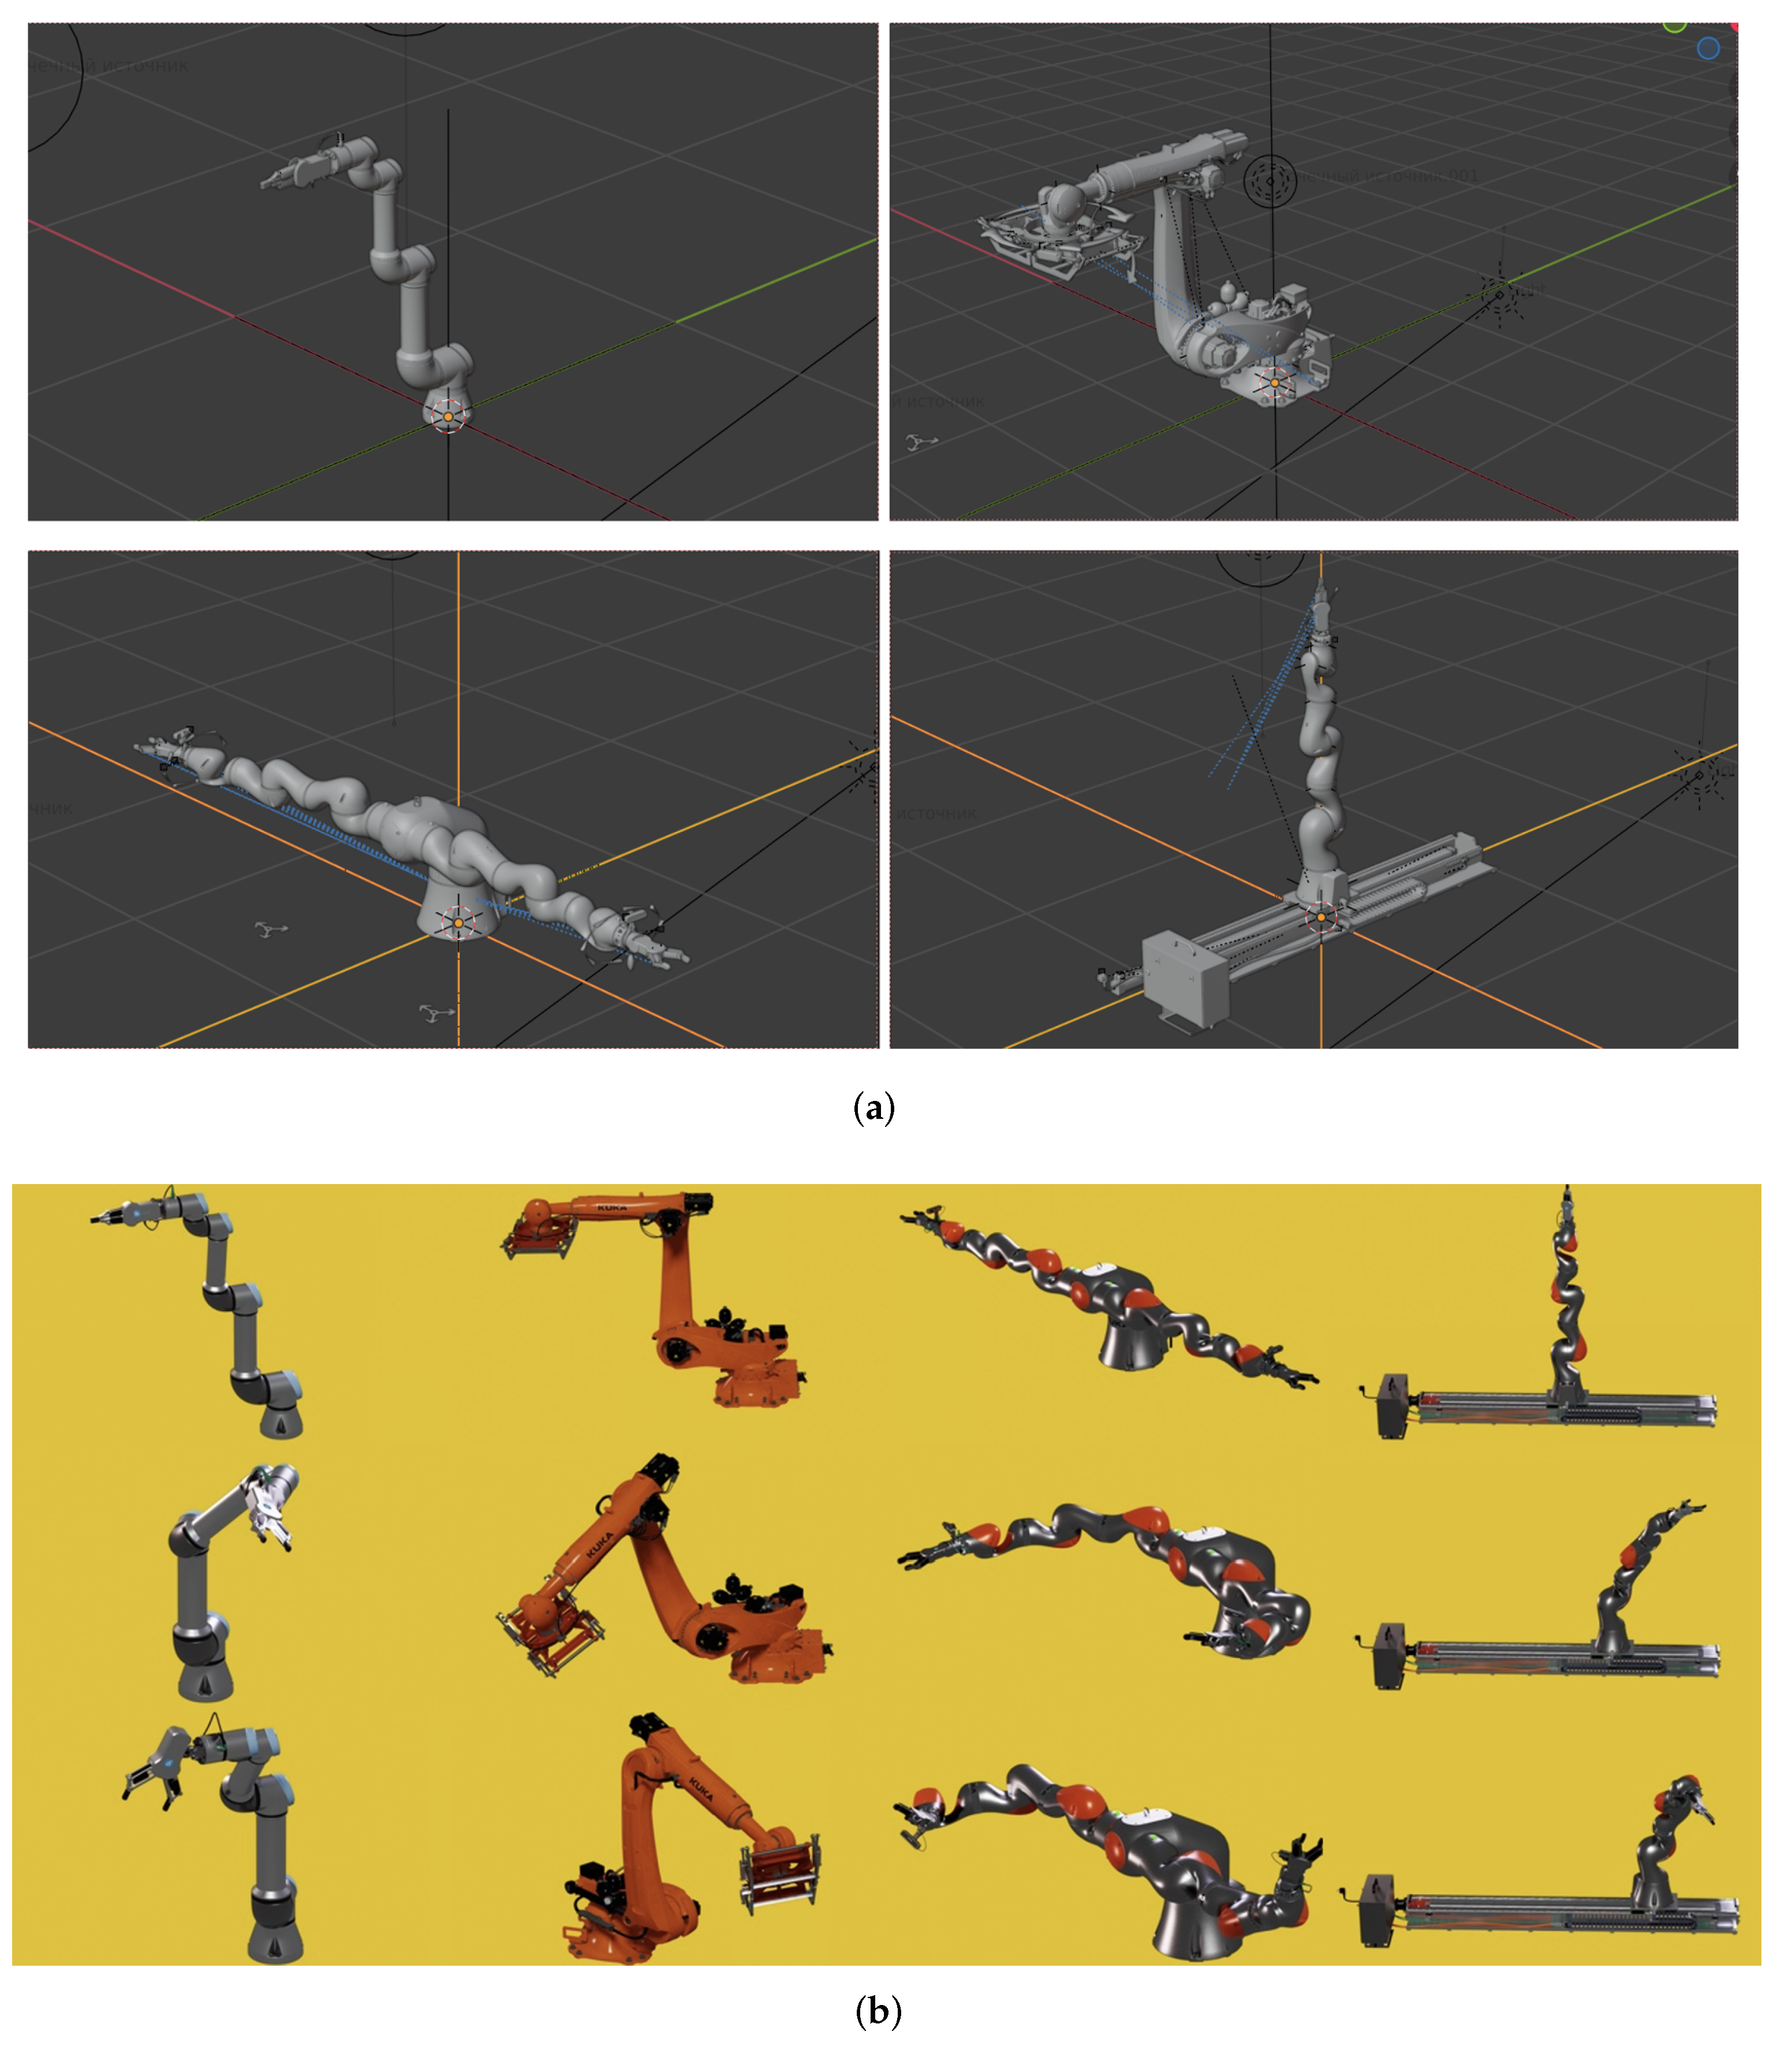
Setting up the scene. By utilizing Blender, we place the model at the starting point of the coordinate system. Next, we install the camera at the selected height that depends on the heights of UE/BS and the analyzed UE and fix the middle frame to the center of our object. Then, we rotate the camera 360 degrees around the model. We select the correct focal length to fully capture the dynamics of the object in each picture. As a result, a minimum bounding rectangle can be calculated for each device, considering the viewing angle, see
Figure 2a.
Tracing the objects. For each model, we run a dynamic animation lasting the full operational period of a machine with a well-distinguishable background, and take pictures with a frequency of 60 frames per second. Thus, we obtain
N static illustrations. See an example in
Figure 2b.
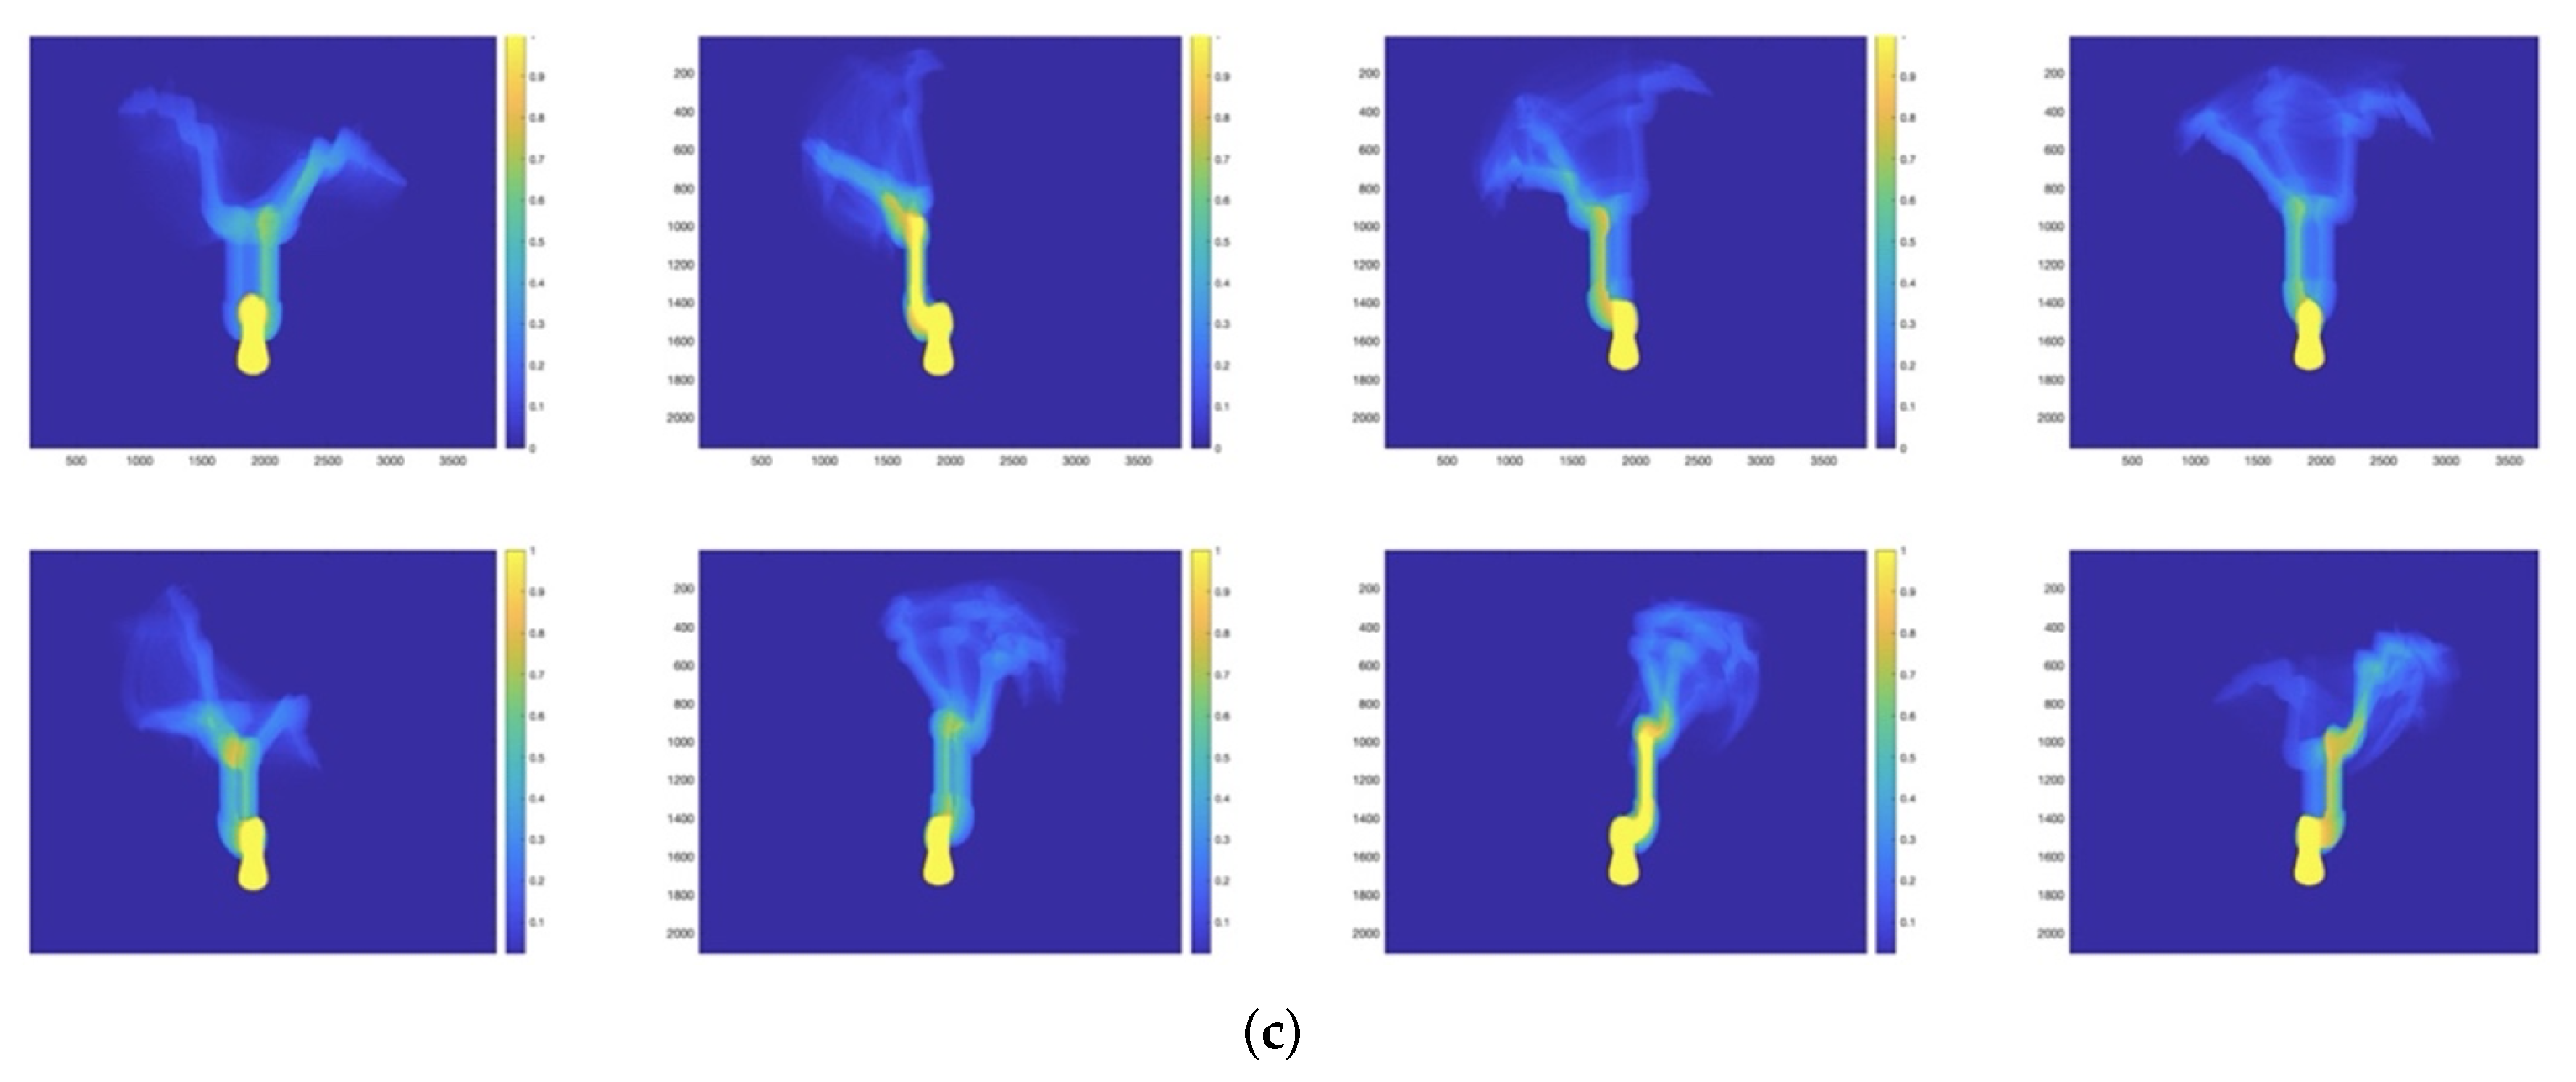
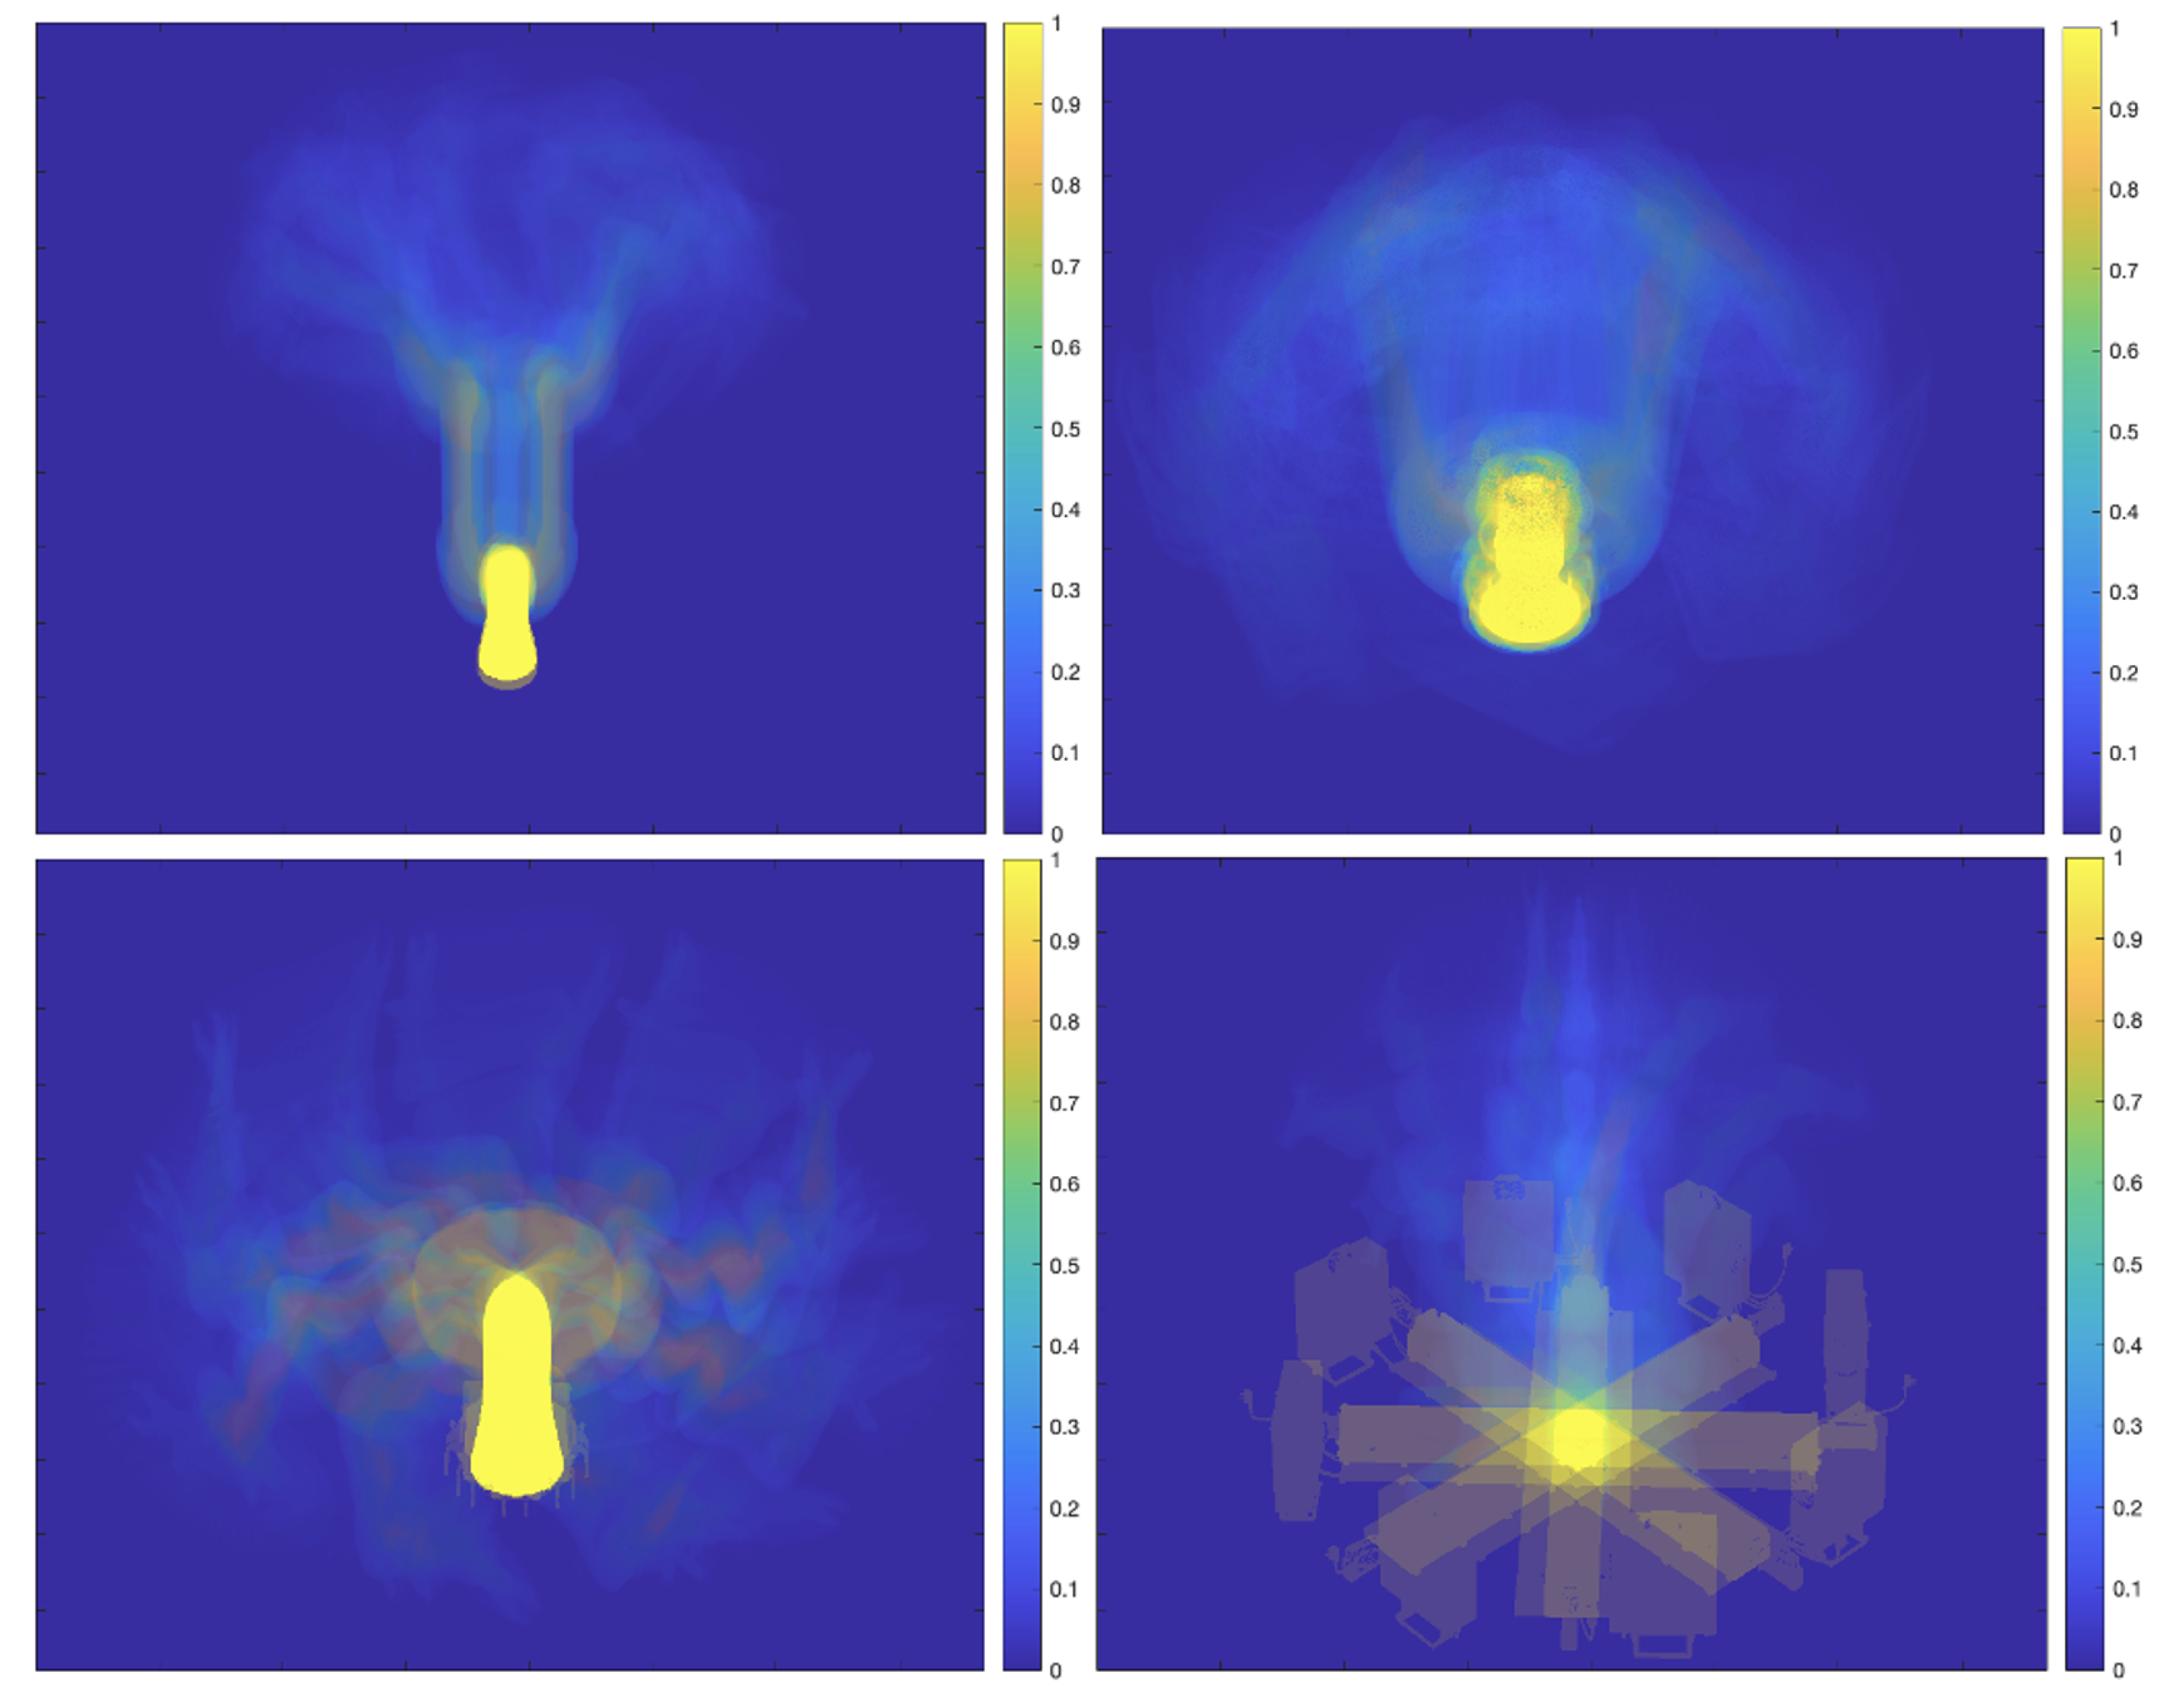
Characterizing LoS paths. By utilizing Matlab, we calculate the static blockage probability for a given space-time coordinate
. For each image and each pixel, we get the color value. If the color is equal to the background value, then we write the value 0 for this image to the pixel matrix, i.e., there is unobstructed LoS path. Otherwise, we write the value 1, i.e., there is no LoS path through an object in this direction. At the output, we obtain
N binary matrices consisting of 0 and 1. Then, for each pixel, we calculate the sum of ones and divide by the number of images to obtain the average blockage probability. The stage is shown in
Figure 2c.
Averaged blockage probability. We repeat this procedure for
M “typical” angles of view per model in 45 degree increments. Having superimposed the results of different angles of view on each other, i.e., having found the average in the angles of view, we obtain the LoS blockage value by one industrial device, see
Figure 3.
5. Blockage in Industrial Deployments
In this section, we determine the LoS blockage probability in industrial deployments. We first outline the proposed approach and then proceed to address the case of BS-to-UE and UE-to-UE communications separately.
5.1. The Proposed Approach
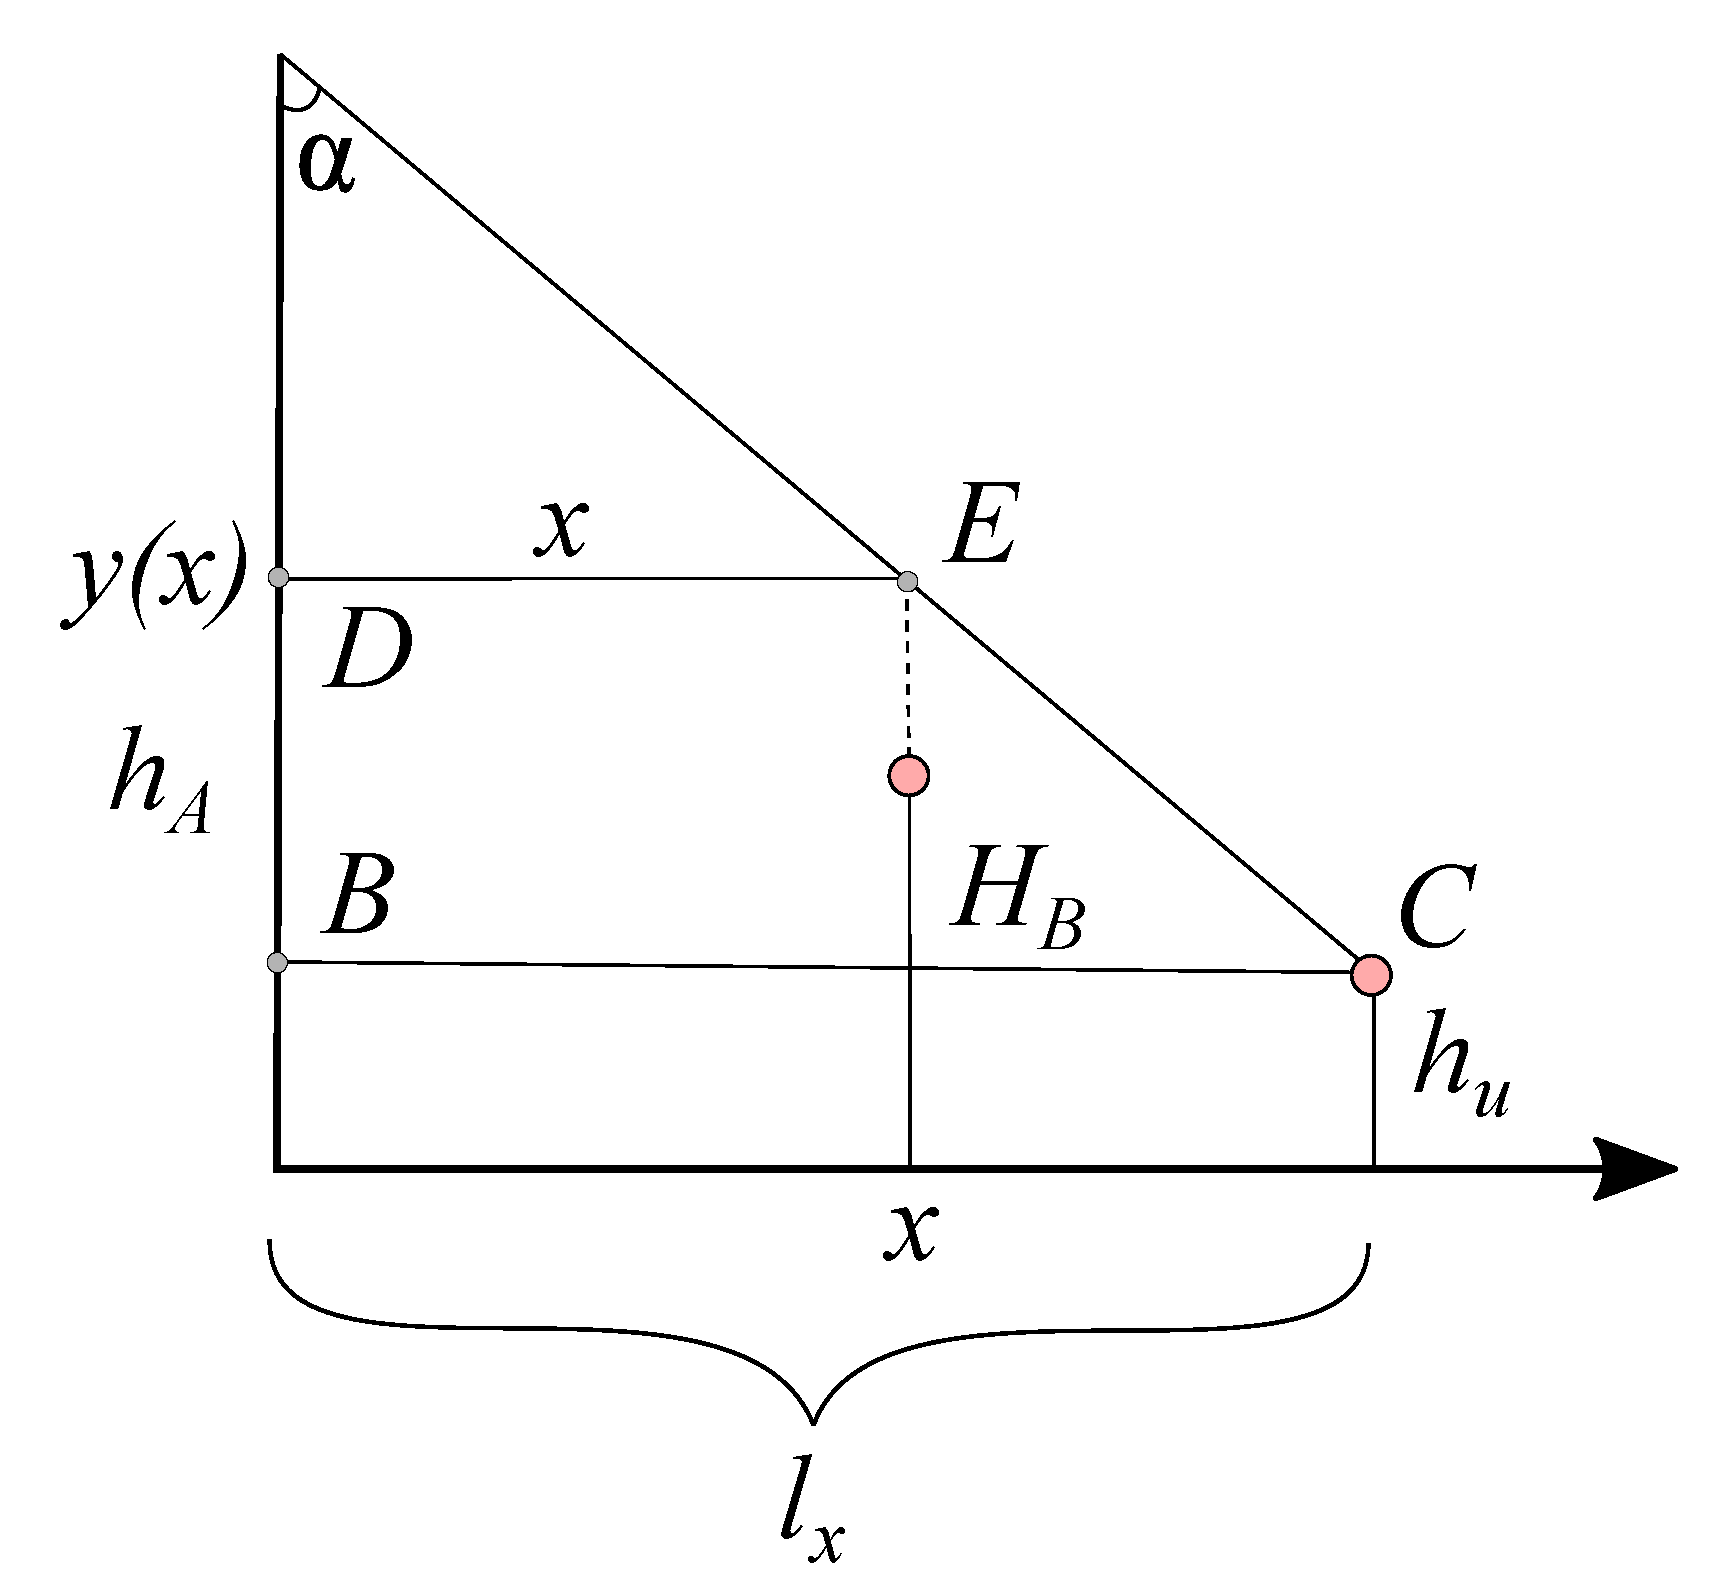
Consider the LoS probability
as depicted in
Figure 4. To estimate it, we need to first determine the probability that the LoS path does not intersect any machine higher than the LoS path at the point of intersection. Second, we need to count the number of intersections of the LoS path with the contact sides by determining the probability that the machine side at the 2D distance of
x is lower than the LoS height at this distance. Since the LoS path can intersect each line perpendicular to the
x- or
y-axis only once, the number of intersections of the projection with the contact sides is equal to the number of points on the
x- or
y-axis corresponding to these lines.
By taking into account the features of the LoS probability, we note that in order to meet its requirements, all contact sides crossing the LoS trajectory must be lower than the height of the LoS at the point of their intersection. Therefore, to calculate the density of points that block the LoS path, we need to take into account (i) the probability that the machine will be higher than the LoS path and (ii) probability that a LoS path crossing the blocker is in fact blocking it, . Note that the former condition results in a non-homogeneous PPP over the considered axes while the latter adds a constant filtering term, estimated at the previous stage. Further, we can find the probability that there are no sides blocking the LoS path by calculating the void probability of the resulting non-homogeneous PPP. In what follows, we start considering the case of D2D communications and then present the case of LoS blockage between BS and UE.
5.2. UE to UE Communications
We start with the simple case of UE to UE communications, where the height of the UEs, , is always lower than the machine height, . In these conditions, the LoS path might be occluded by any machine it intersects with.
Consider projection of the LoS path to the
x- and
y-axes. Observe that number of cells it crosses equals the sum of the number of lines over both axes contained within LoS path projection. Thus, we can consider the occlusion of the LoS path independently over the
x- and
y-axes. Further, observe that in D2D case
, the occlusion of the LoS path is independent of the height of machines and LoS height. Since the cell contains a machine with probability
while each machine occludes LoS path with probability
, where
is the transparency of a machine estimated in
Section 4, the task is thus to determine the intensity of machines over the
x- and
y-axes occluding the LoS path.
The abovementioned task can be efficiently solved by utilizing thinning of the Poisson process over individual axes [
29]. Indeed, the actual intensity of lines over
x-axis resulting in LoS path occlusion is simply given by thinning the initial intensity with a factor of
. Thus, The blockage probability induced by lines over
x- and
y-axes are given by void probabilities of the Poisson processes
By recalling that line processes over
x- and
y-axes are independent of each other, the resulting LoS blockage probability takes the following form
5.3. BS to UE Communications
Consider first the case of BS to UE communications, where the height of the former, , is such that . We first consider the case of random machine height.
5.3.1. Random Machines’ Height
Similarly to the UE to UE communications, we can consider the occlusion of the LoS path created by lines over
x- and
y-axes independently. However we now need to take into account whether a machine is high enough to potentially block the LoS path. To this aim, consider
Figure 4 illustrating the side view of the LoS path as seen from the
x-axis perspective. We are interested in determining the height of the LoS path at coordinate
x of this axis,
. By utilizing geometrical arguments we see that
leading to the following LoS height equation
Similarly, for the
y-axis, we obtain
At certain
x- and
y-coordinates, the probabilities that the LoS path can be occluded by a machine coincide with the probabilities that the machine height is higher than the LoS path and are given by
where
is CDF of machine height.
The mean intensity of lines over
x- and
y-axes inducing machines capable of occluding the LoS paths are given by
Recall that the thinning procedure for Poisson processes also holds when the thinning probability is varying. By applying it and also utilizing the independence property of MPLP, we arrive at the final result for the blockage probability in the following form
5.3.2. Constant Machines’ Height
A special case of interest is when the height of industrial machines is the constant and the same. In this case, for a given heights of BS, UE, and machines as well as for coordinates of UE, there are such coordinates at LoS projections at axes,
and
, that the machines’ height starts to be higher than the LoS height. These coordinates can be found by solving (
4) and (
5) with respect to
. We have,
Now, the intensity of lines over
x- and
y-axes inducing machines that may potentially block the LoS path can be found as the ratio of segments, where the machines’ height is always higher than the LoS path to the overall lengths of projections on axes, i.e.,
that need to be further substituted to (
8).
5.4. Averaged Blockage Probability
In realistic deployments, the number of UEs can be large. In such cases, we might be interested in the average blockage probability between BS and a randomly chosen UE in the coverage area or between two randomly chosen UEs. These results can be obtained by assuming a certain random distance between communicating entities. For BS-to-UE communications, uniform distribution of UEs in the coverage area of BS is often assumed. By considering a square factory compartment with side
R, for BS to UE communications, this average blockage probability is immediately given by
6. Numerical Results
In this section, we elaborate on our numerical results. We start assessing the accuracy of the model. Then, we proceed analyzing the qualitative response of the blockage probability to system variables. Finally, we will consider specific deployments related to light and heavy industry with industrial machines analyzed in
Section 4.
6.1. Accuracy Assessment
Unfortunately, at the moment of writing the authors do not have access to the operational deployment of mmWave NR technology in an industrial environment. As a result, we cannot benchmark the model against real data. However, understanding the importance of benchmarking, we offer the following simulation-based solution. Recall that our model is characterized by a two-staged decomposed structure, where we first utilize photogrammetry to derive the transparency probabilities and then apply the tools of stochastic geometry to derive the blockage probability. Here, the first part is already a simulation model itself that can only be tested using realistic industrial machines. However, the second part—stochastic geometry assessment—can indeed be tested to ensure that we do not allow for technical errors in the analysis.
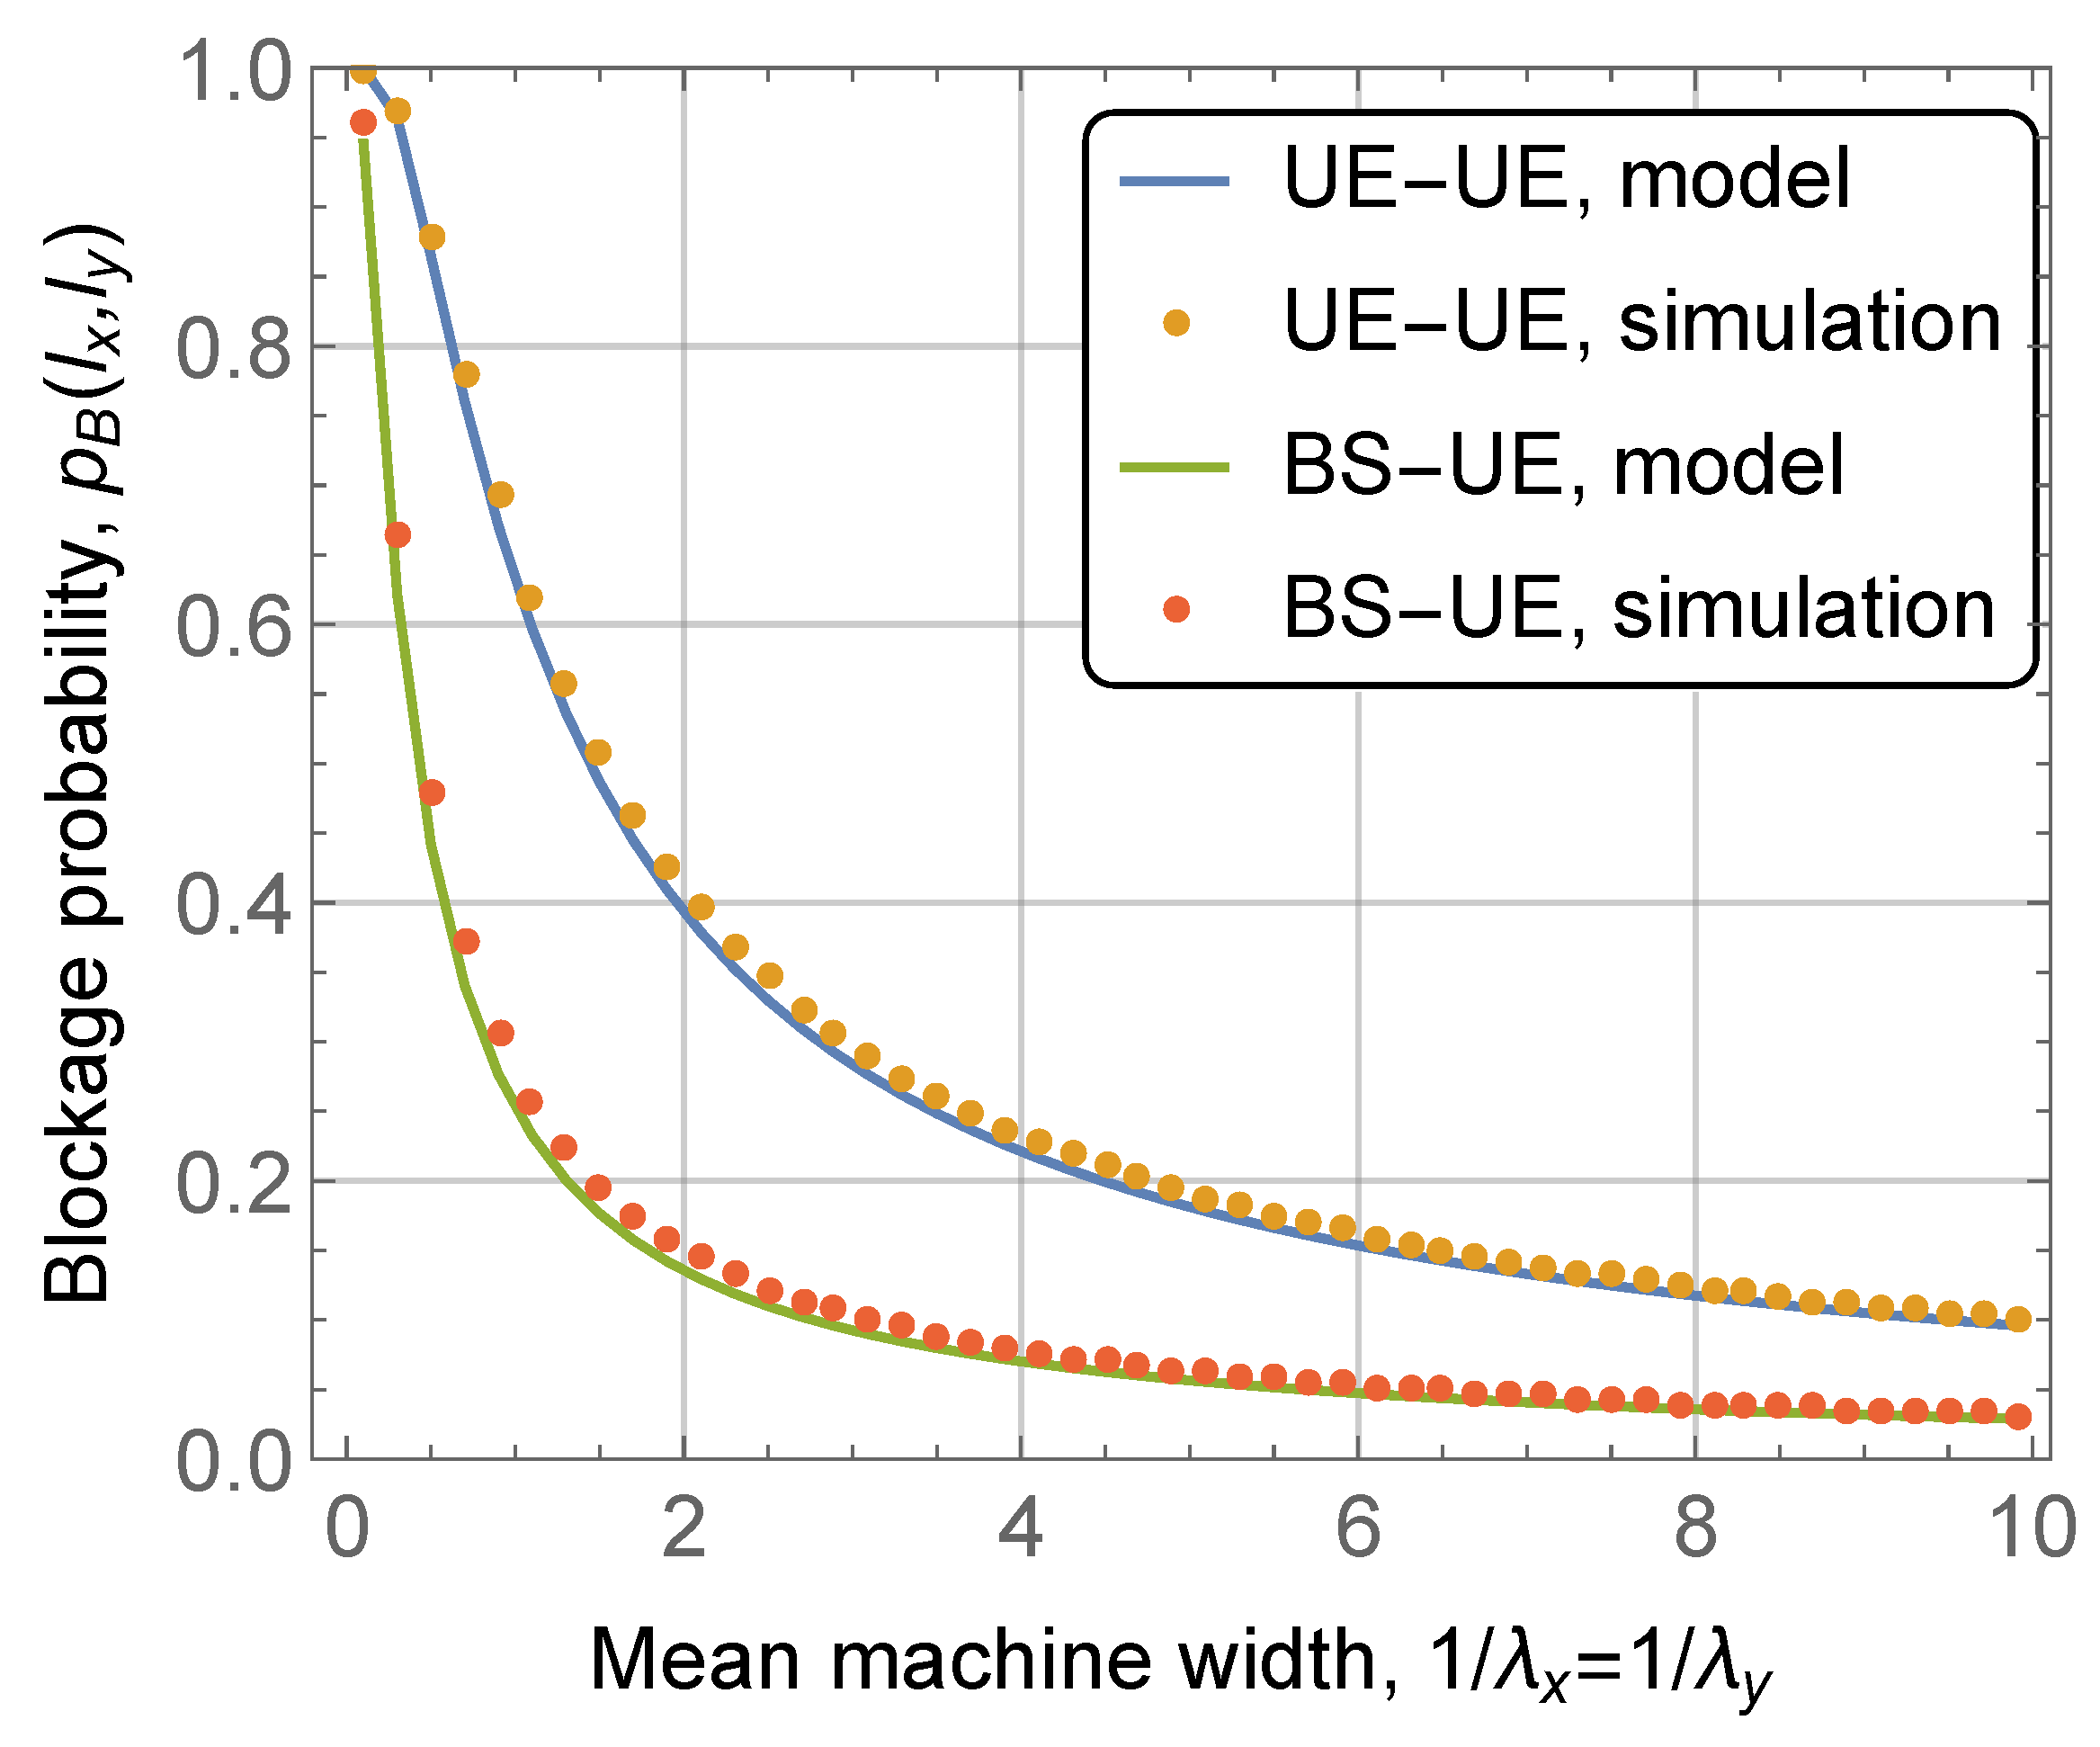
To this aim, we utilized Matlab to create a geometry-based simulation model to assess accuracy of the proposed stochastic geometry analysis. The results are shown in
Figure 5 as a function of mean machine width for UE-UE and BS-UE with blockers random heights communications scenarios. The rest of the parameters are: site occupation probability
, and transparency probability
, UE coordinates
,
m,
m. As one may observe, the developed model allows to precisely capture geometry of the considered scenario returning coinciding LoS blockage probabilities. Similar observations are made for other input parameters.
6.2. UE to UE Communications Scenario
We start with the simplest considered scenario of UE to UE communications. Recall that in this scenario, all the machines crossing the LoS path may potentially block it as the height of both UEs is equal and less than the constant height of machines.
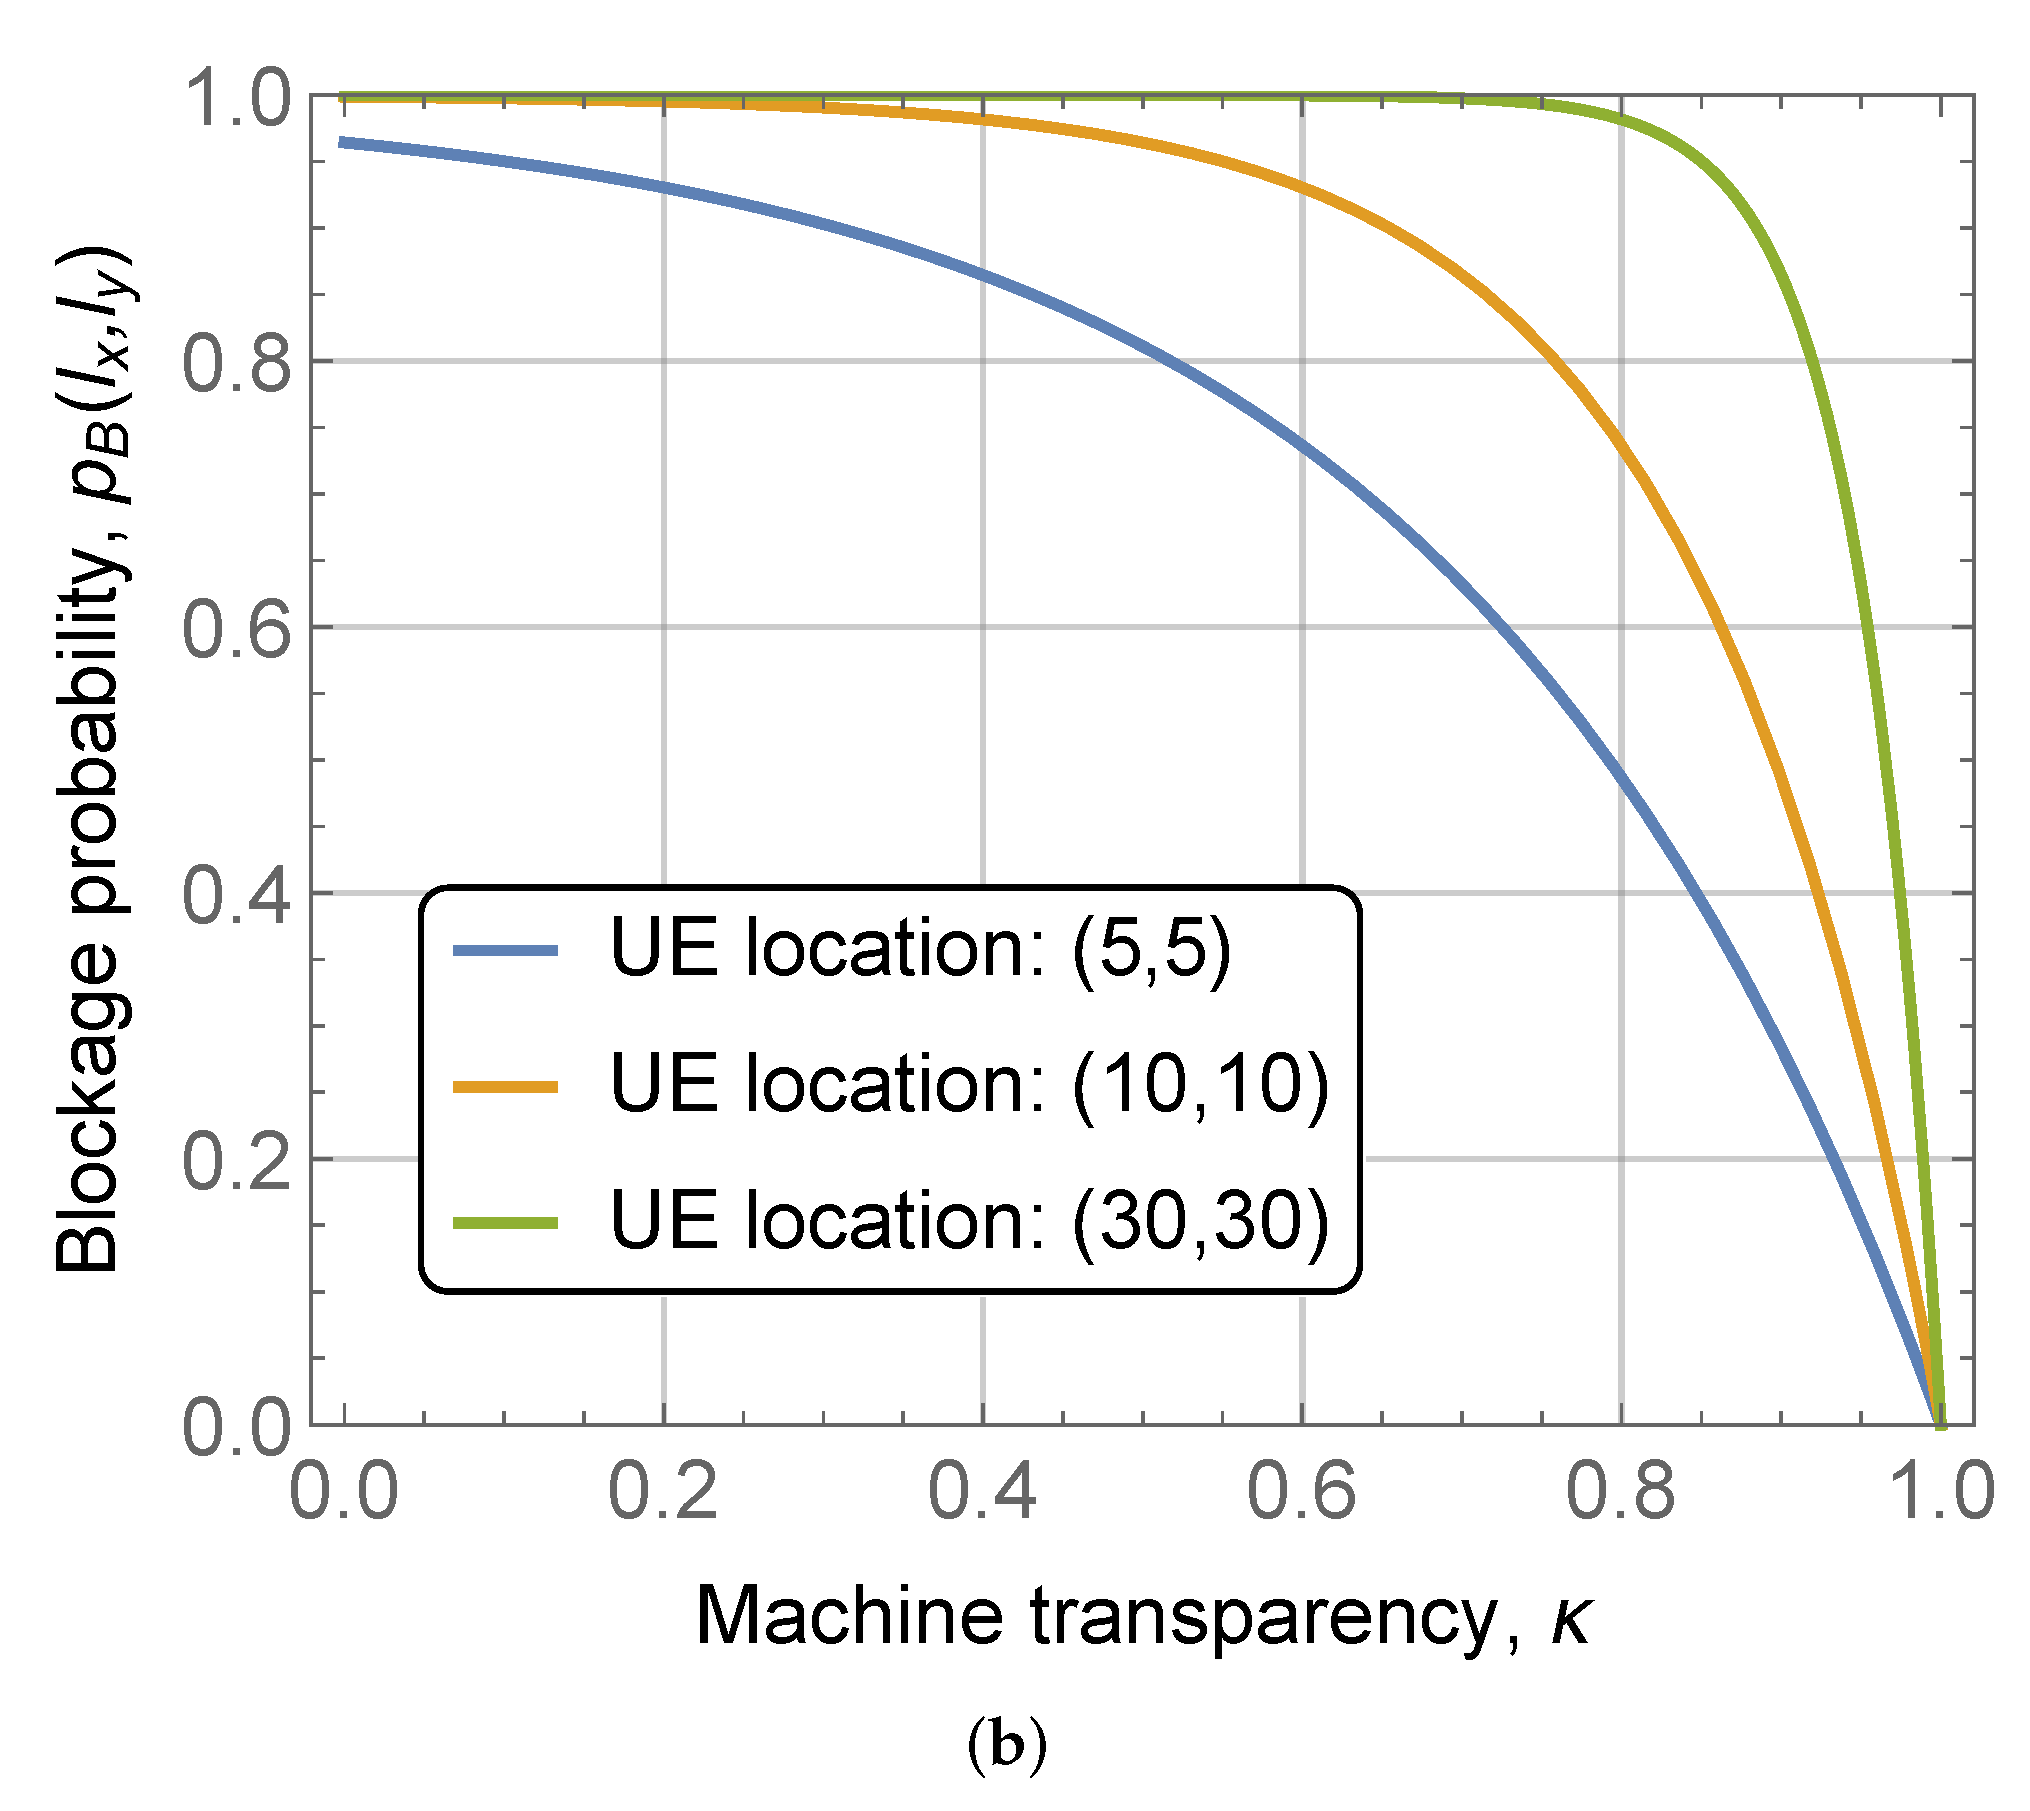
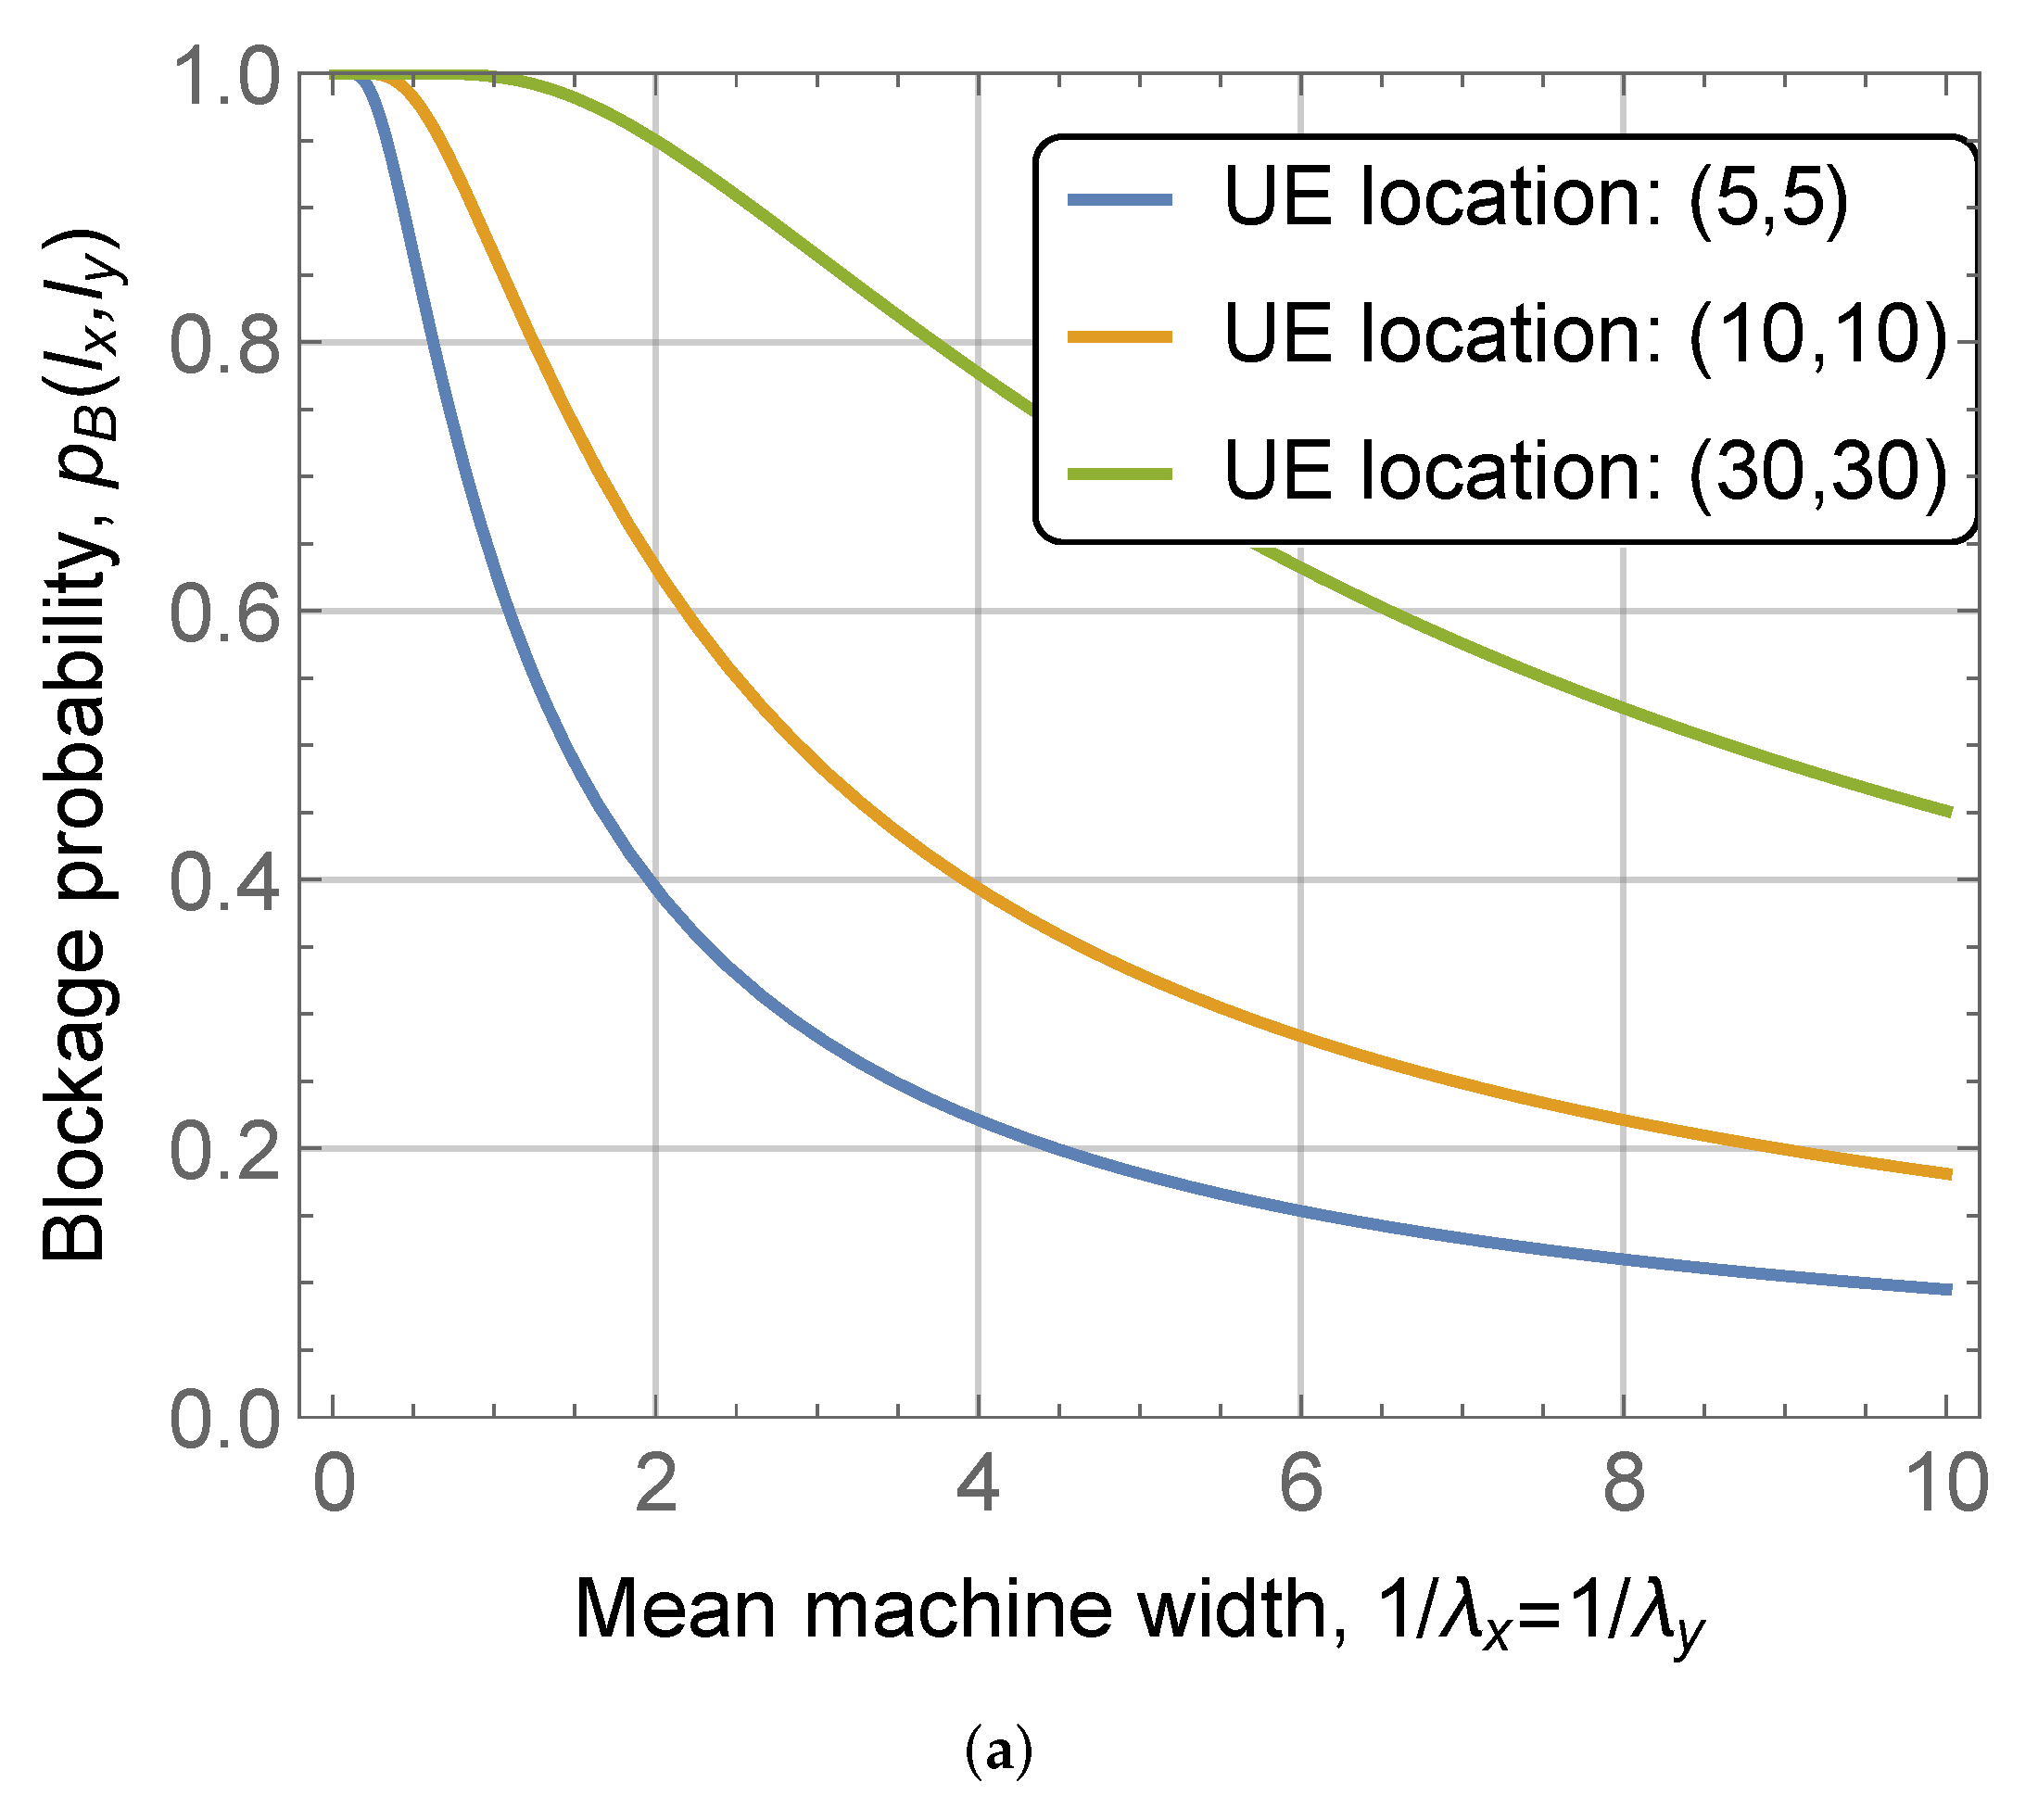
Figure 6 illustrates the impact of the machine dimensions (i.e., width and length),
and the transparency probability
on the blockage probability
, for different values of the UE coordinates. Note that
in
Figure 6a while
m in
Figure 6b while the site occupancy probability is set to
in both illustrations.
Analyzing the presented results, we observe the expected trends. First of all, the blockage probability decreases with the size of the machine as the LoS path can intersect fewer number of machines. Secondly, the transparency probability of a machine drastically affects the LoS blockage for given UE coordinates and machine dimensions. However, for medium-to-large separation distances between UEs, ∼14 m and ∼42 m corresponding to UE location and respectively, the value of the blockage probability is greater than even for . This implies that direct UE-UE communications can be feasible at rather small inter-UE distances or in less dense machine deployments.
6.3. BS to UE Communications Scenario
The utilization of UE-to-BS communications can efficiently solve the problem of high direct UE-UE blockage probability. Here, the additional critical parameters that define the blockage probability are machine height,
, UE height,
, and BS height
. We start exploring their effects in
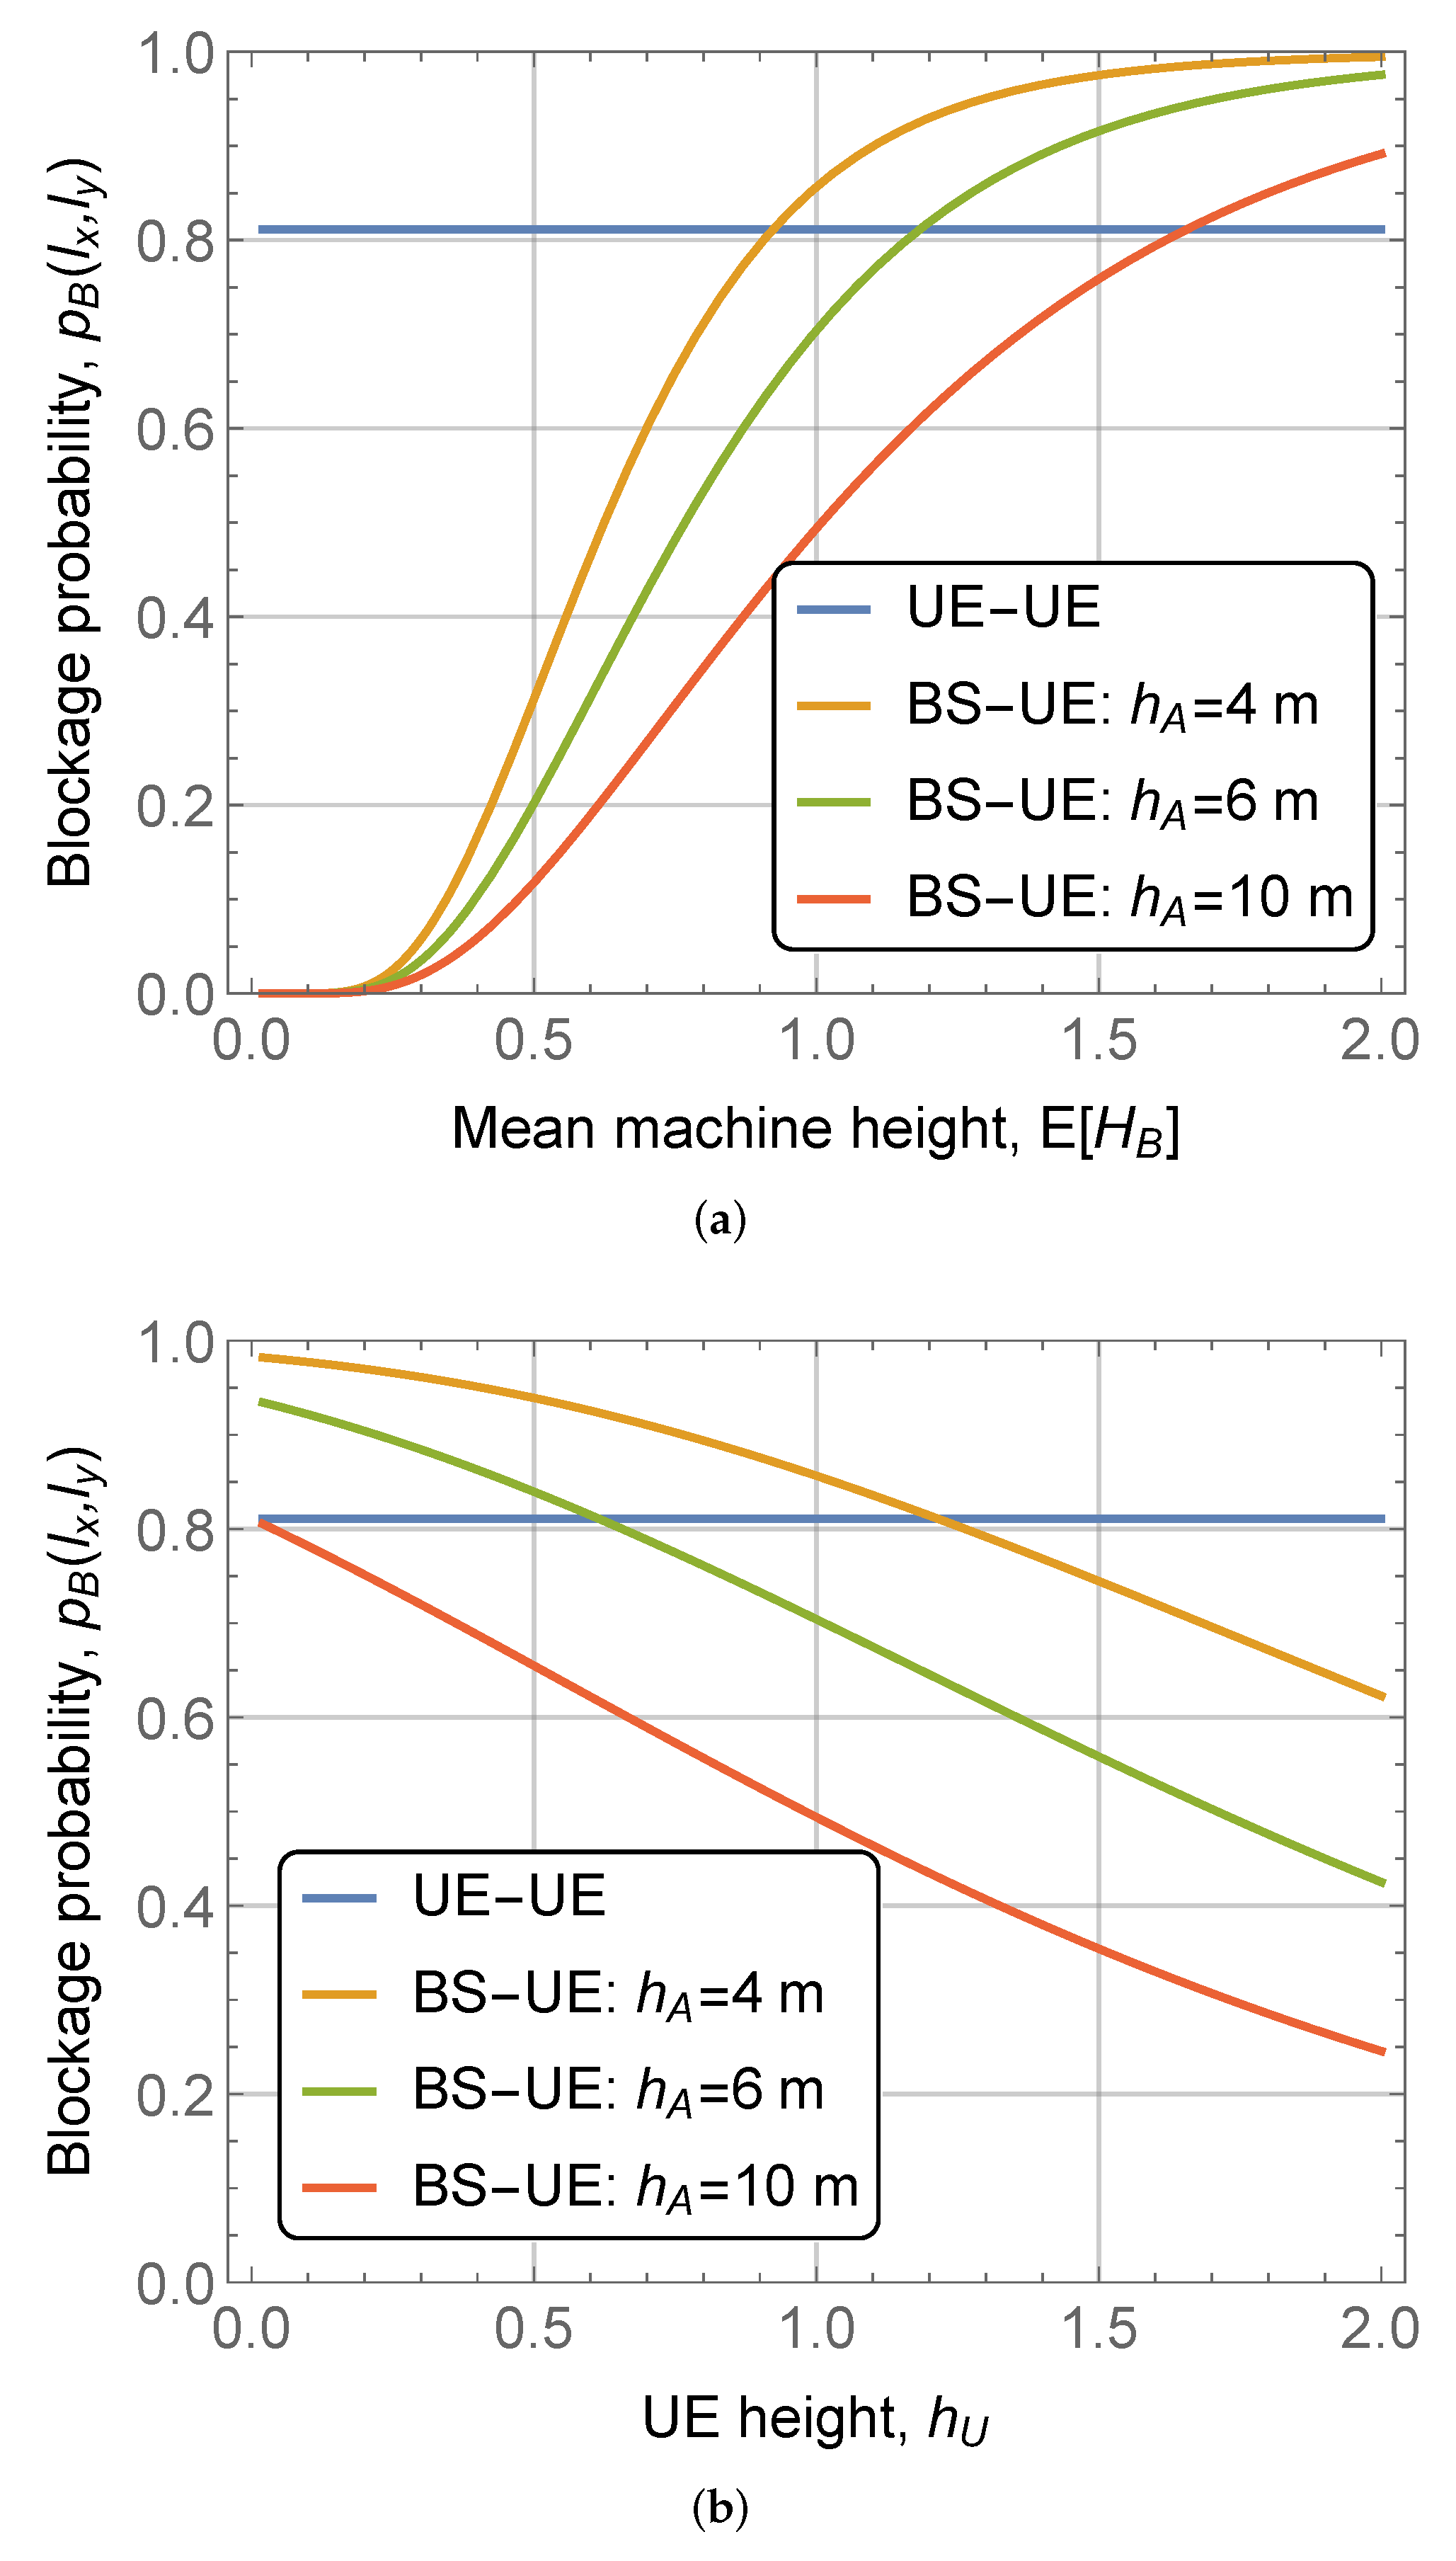
Figure 7, where the blockage probability
is shown as a function of exponentially distributed machine height
and constant UE height
for different BS heights. Note that in
Figure 7a, UE height is 1 m, while in
Figure 7b the mean machine height is also 1 m. The rest of the parameters are: site occupation probability
, machine width and length 3 m, and transparency probability
, UE coordinates
.
By analyzing the presented results, we observe that increasing the BS height allows the blockage probability to be drastically improved. Specifically, even having a BS height of 10 m allows the blockage probability to be decreased from approximately
corresponding to the UE-to-UE case to just
, see
Figure 7a. Another important takeaway is that randomness in machine heights may even make the situation worse as compared to direct UE-UE communications. In both,
Figure 7a,b we observe that even for BS height of 4 m the LoS blockage probability is slightly higher than that of indirect UE-UE communications,
vs.
. Finally, by comparing the results for different UE height and mean machine height, we see that the former produces more impact on the blockage probability. This implies that in practical deployments, all efforts need to be made to install communications modules at higher possible locations at machines.
In
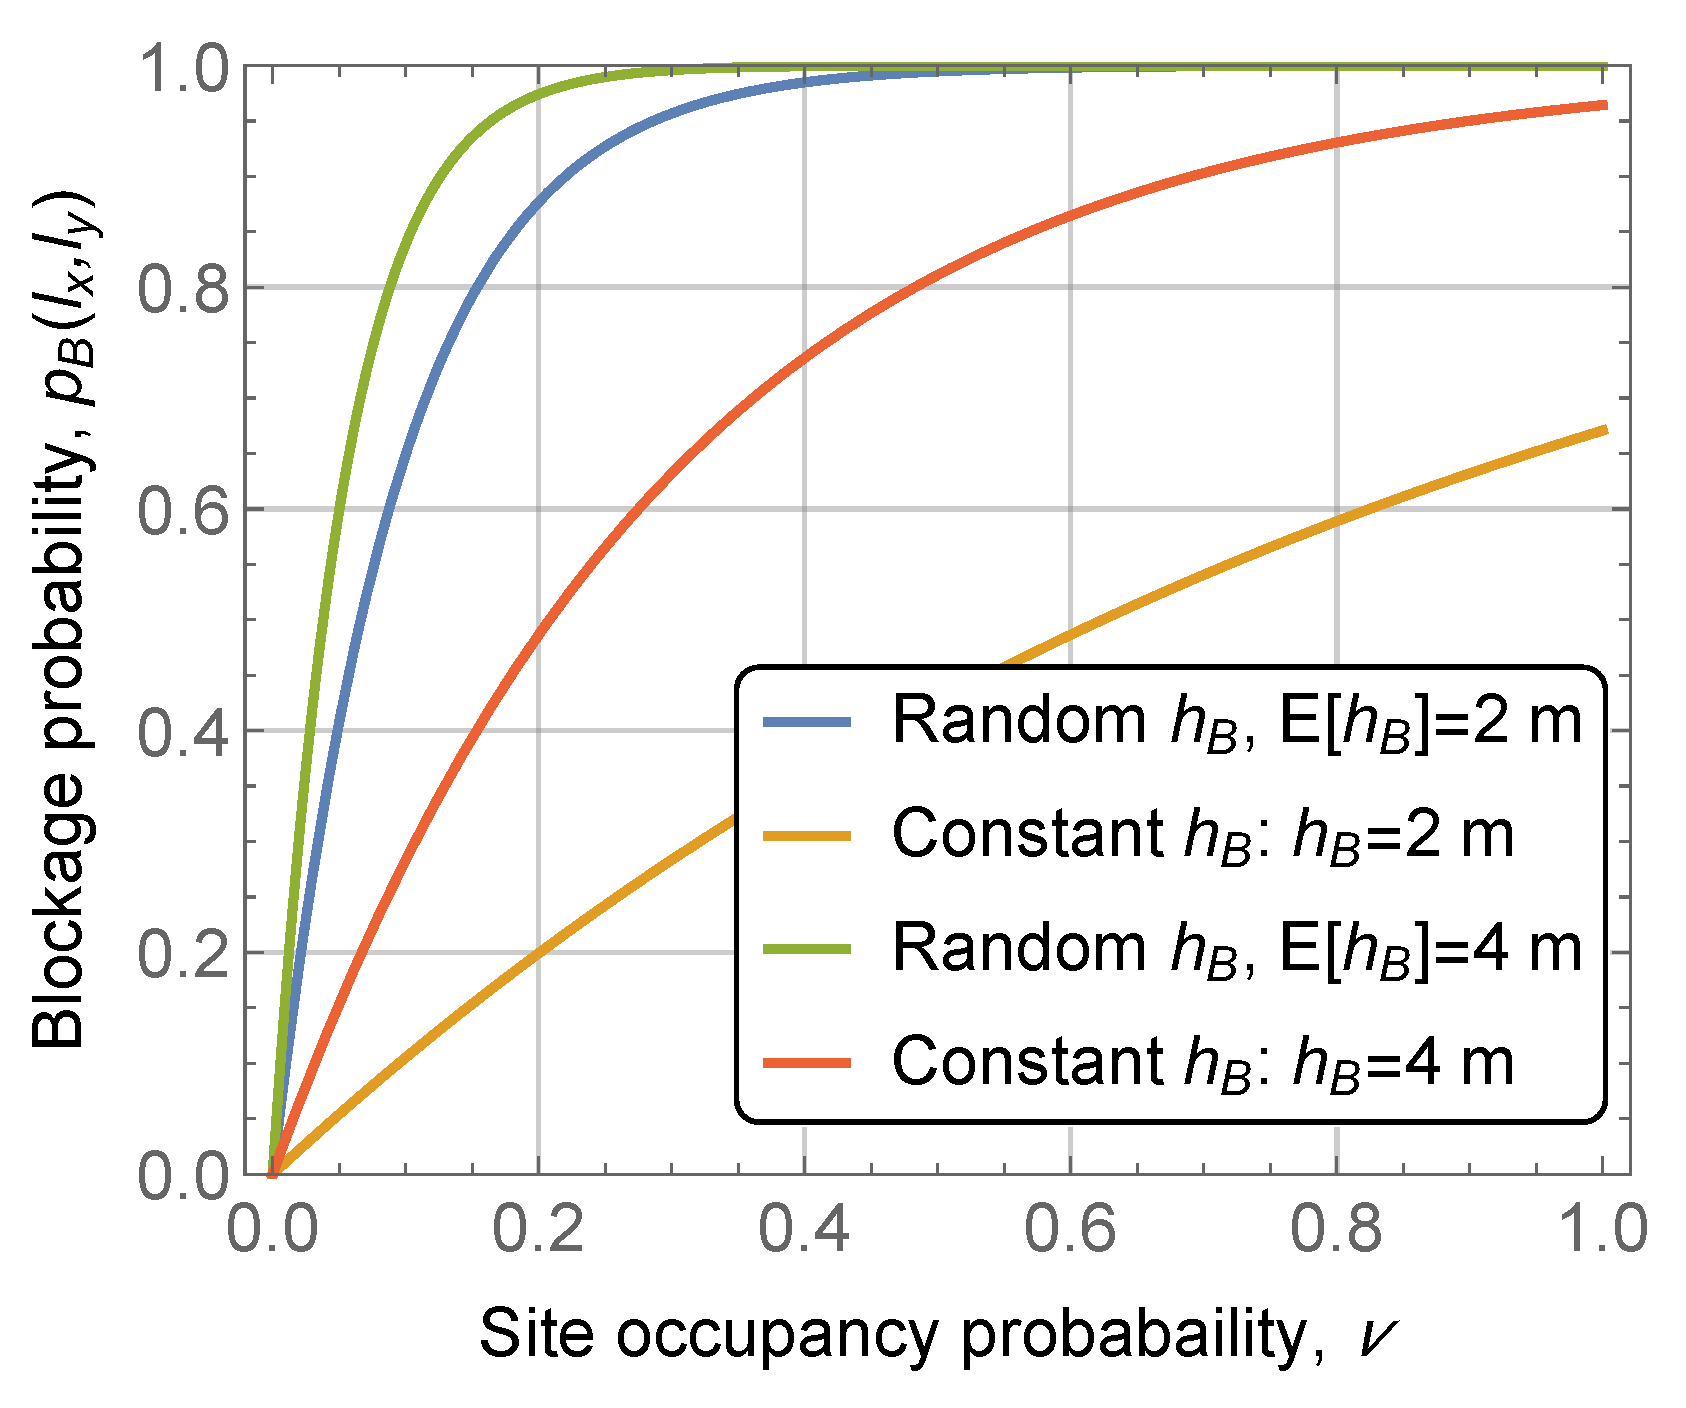
Figure 7 we observed that the randomness of the machines’ height produces substantial impact on blockage probability. To quantify this impact,
Figure 8 compares the blockage probabilities for constant and random machines height with coinciding means as a function of the cite occupancy probability,
. The rest of the parameters are the same as in
Figure 7. Here, we observe that the difference may indeed be drastic, reaching
(for
m and
). However, this difference diminishes as the height of blockers increases. Nevertheless, whenever possible, an attempt needs to be made to ensure that the height of the deployed machines is constant.
Finally, in this section, we present the average blockage probability for a square compartment, calculated according to (
11). Recall that the average blockage probability is a typical measure utilized for dimensioning of wireless access networks, where a geometrical location of the session is expected to be random instead of fixed [
30]. Using this metric, one may further utilize the proposed model in capacity planning and dimensioning of such industrial systems.
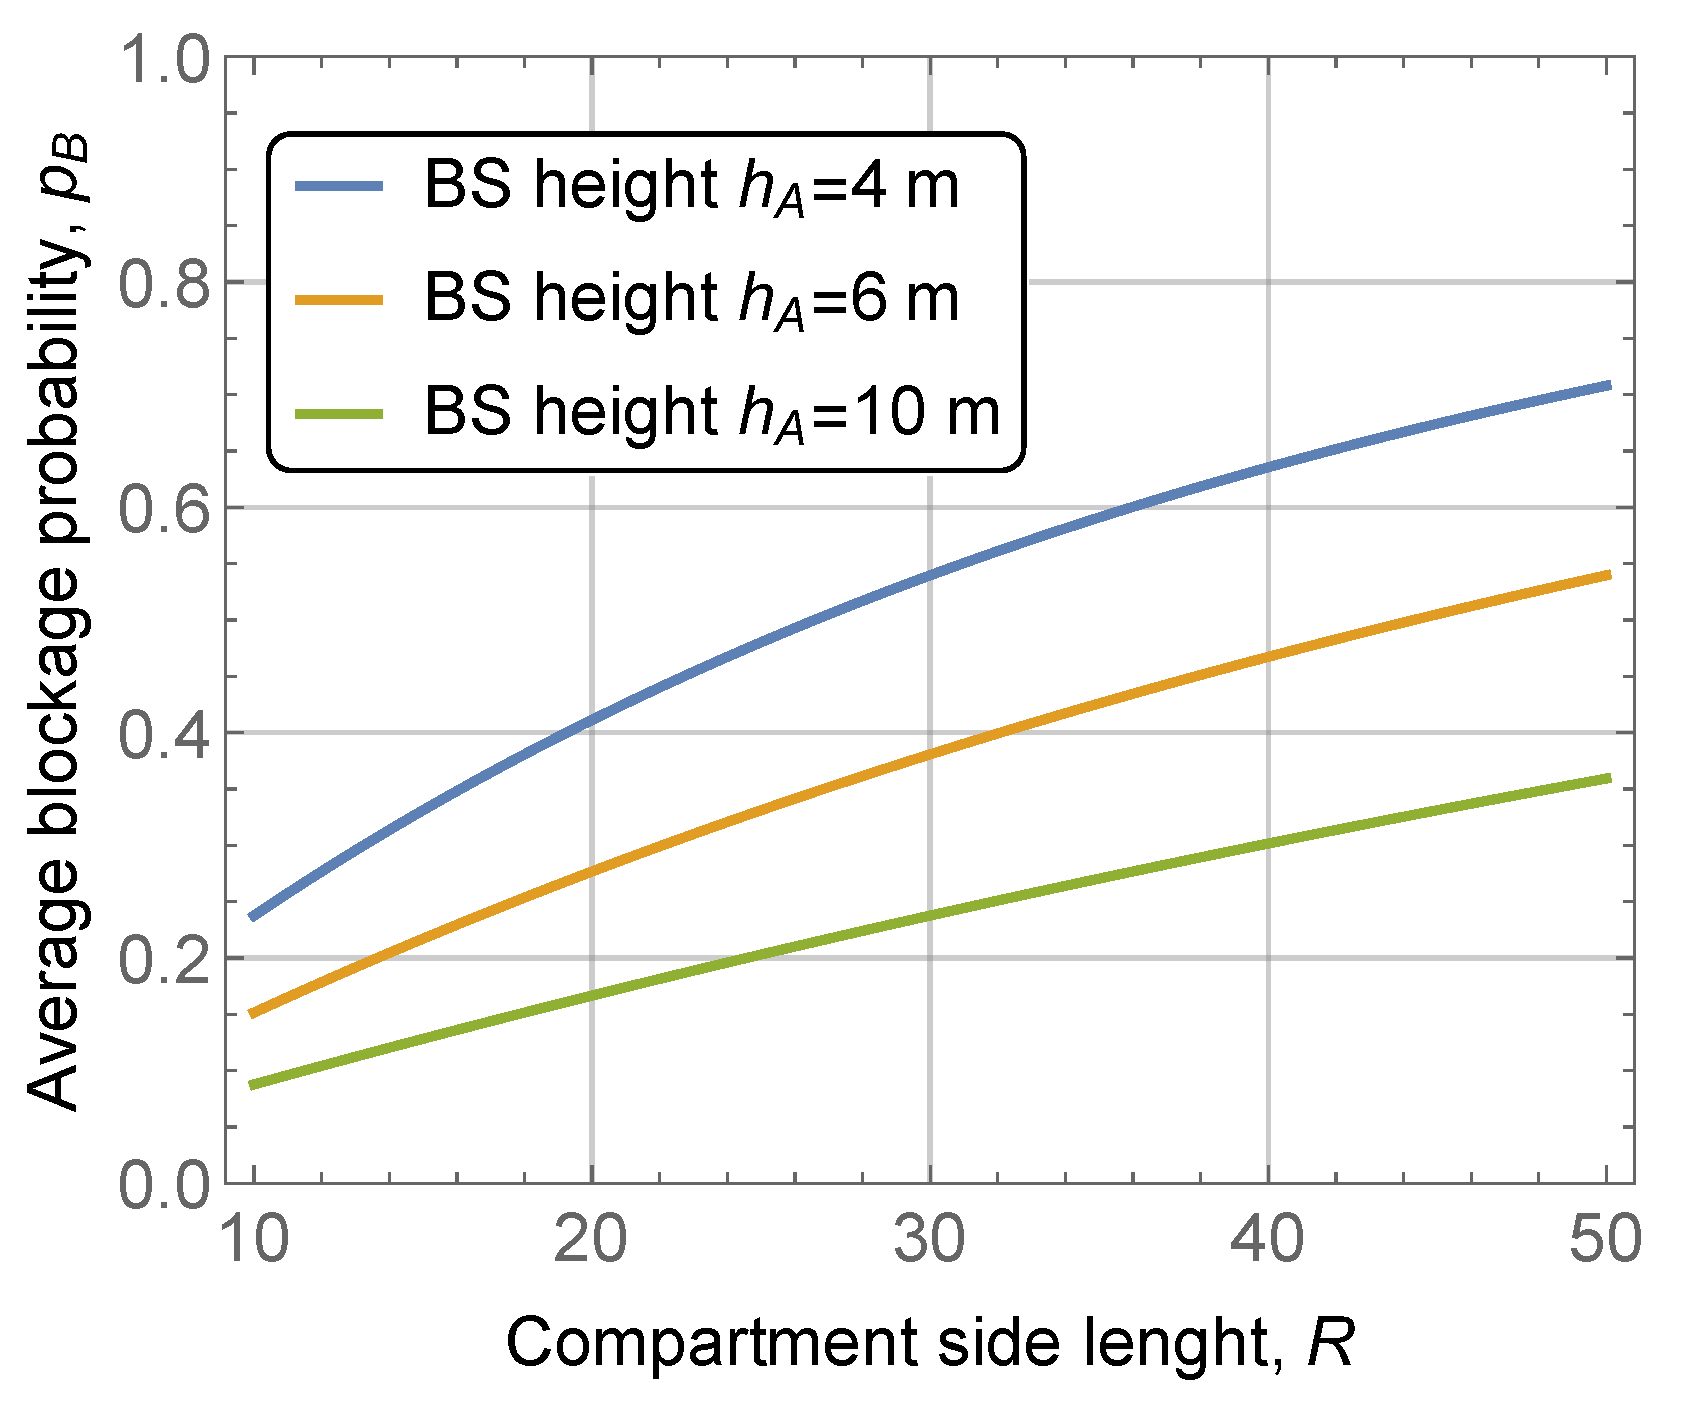
Figure 9 shows the average blockage probability for UE randomly and uniformly distributed in a square factory compartment with side
R as a function of
R and for multiple BS heights. The rest of the parameters are: site occupancy probability
, mean width and length of the machine of
m, transparency probability
,
m, UE height
m, and constant machine height of
m. The presented results show the expected behavior—the average blockage probability increases with the factory side length
R. For the chosen parameters, the increase is rather mild for all considered BS heights and the probability never reaches
even for BS height
m and
m. This implies that BS-to-UE communications, even in the rather dense considered deployment, is actually feasible.
6.4. Realistic Deployments
We now proceed to assess realistic deployments for light and heavy industries with machines introduced in
Section 3. To this aim,
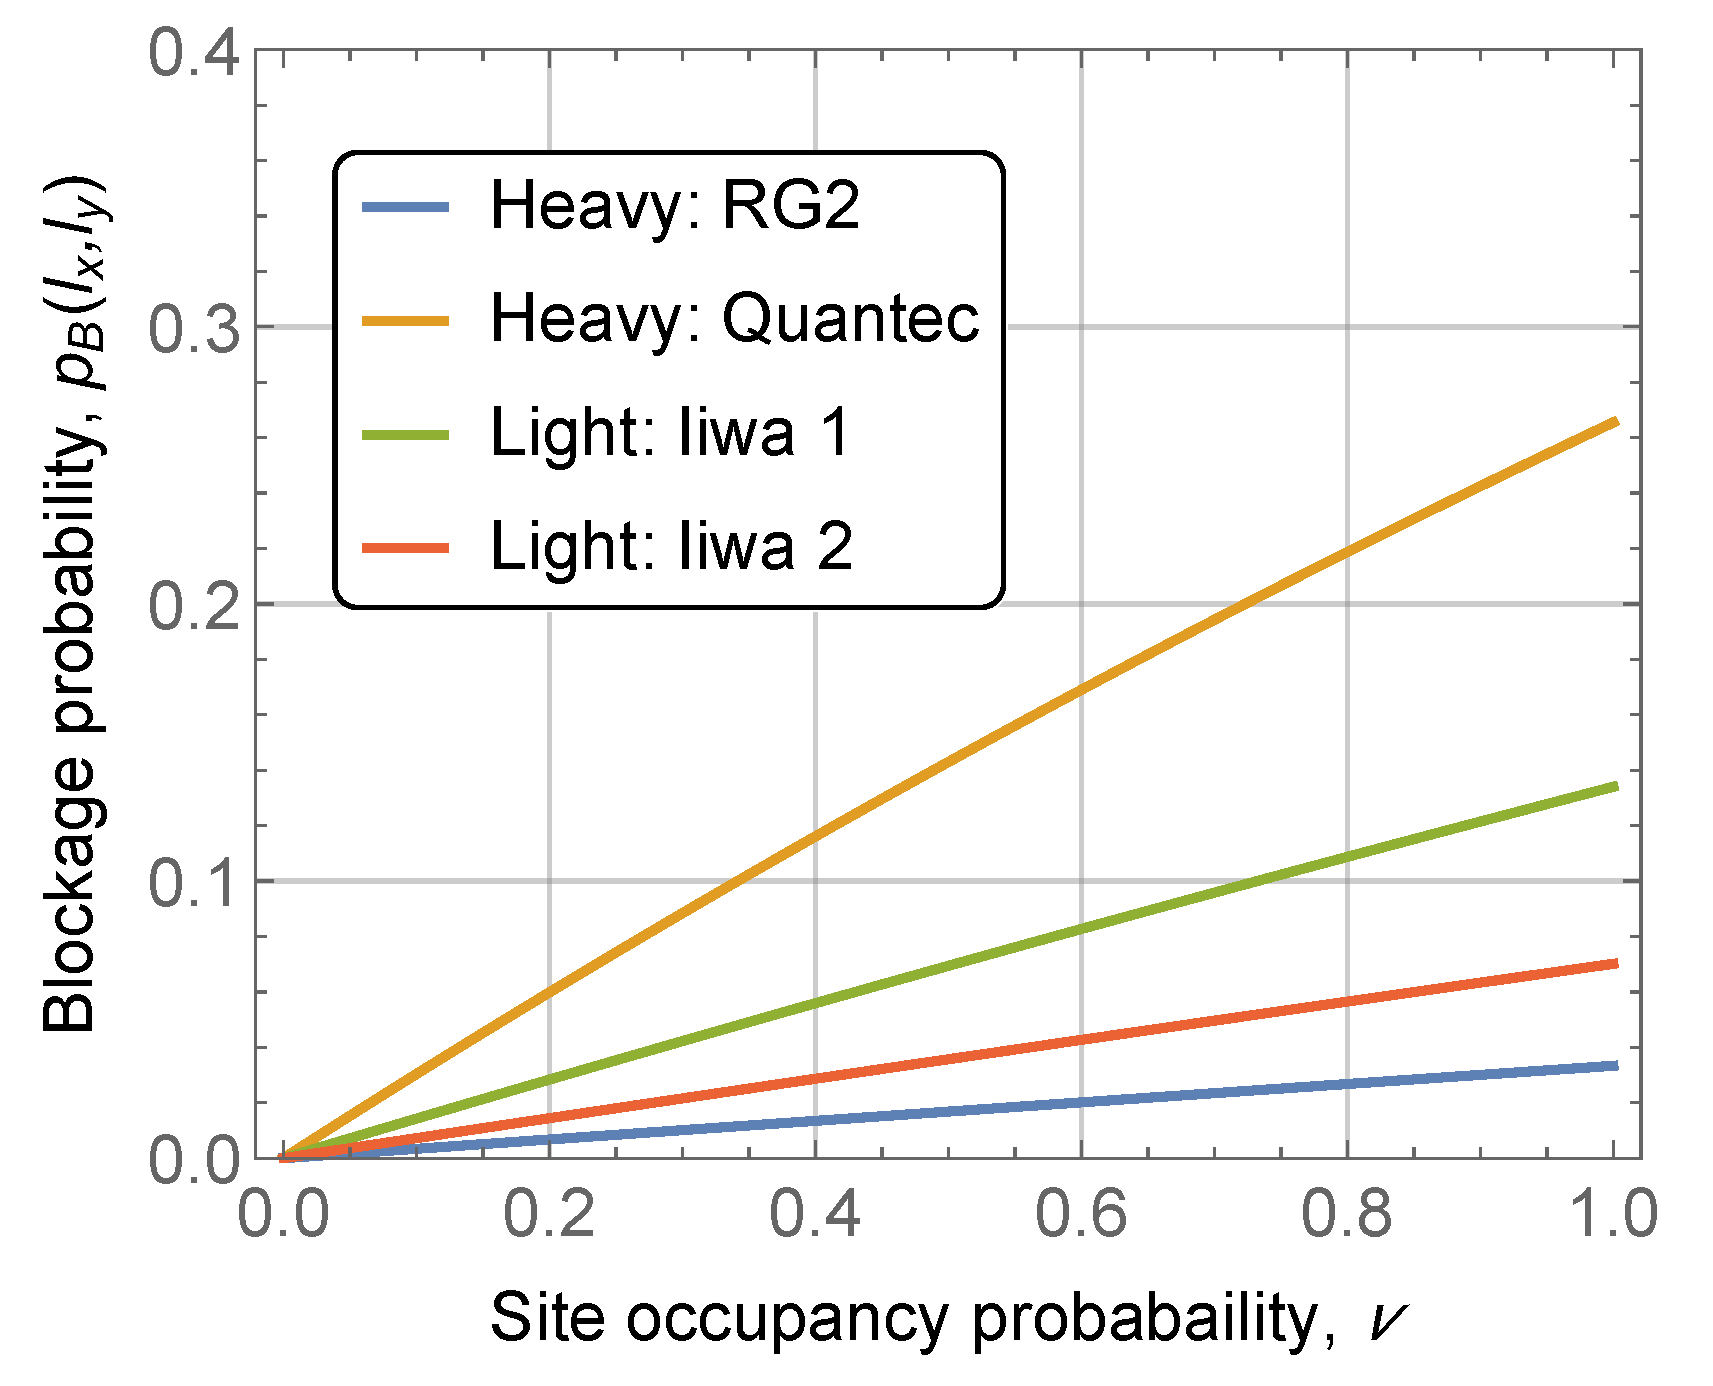
Table 1 summarizes the machines’ dimensions (width
and length
) and transparencies,
. One critical observation is that the transparency of the chosen machines is quite high. The rationale is that their operational range is rather large, especially for RG2 and Iiwa 2 machines, while the structure is slim. Note that other machines may have significantly different transparency values.
The blockage probability as a function of site occupancy probability is shown in
Figure 10 for UE location of
m, BS height of
m, UE height of 1 m. Analyzing the presented results, one may observe that for such high transparency probabilities, the blockage probability is mainly determined by machine size as this parameter affects denseness of machine deployment. Nevertheless, for all types of machines, the blockage probability is very low, implying that communications are feasible at almost all times.
7. Conclusions
In this paper, motivated by the usage of 5G private NR systems in industrial deployments, we proposed a methodology to evaluate the LoS blockage probability for UE-UE and BS-UE communications scenarios. The proposed methodology is based on the use of photogrammetry to obtain transparency probability of individual machines and stochastic geometry to determine the blockage probability in specific deployments characterized by a certain density of industrial machines. This methodology can be utilized in system-level mathematical or simulation-based performance assessment and of mmWave 5G NR deployments in the industrial environment.
We also investigated in detail the blockage probability as a function of industrial deployments. Specifically, we have shown that direct UE-UE communications are feasible in sparse machine deployments (less than 0.1 machine/m2) or at small communications distances (less than 5–10 m). Otherwise, BS-UE communications need to be utilized. In this case, BS height is a critical parameter affecting LoS blockage probability. Specifically, by improving the BS height from 4 m to 10 m allows the the blockage probability to be decreased by 20–30% depending on other system parameters. Furthermore, UE height produces more impact on the blockage probability as compared to machine height. In real deployments, one needs to ensure that the height of communications modules at UEs is maximized. Finally, random machine heights affect blockage probability more heavily, by 10–20% more, as compared to constant heights.
We specifically note that the model proposed in our study accounts for LoS blockage probability only. In practice, the received signal strength dictates whether communication is feasible or not. We envision that the proposed model can be utilized together with other radio part model specific for a given technology such as modulation and coding schemes [
31], propagation models [
32], antenna models [
33,
34], etc., to produce the received signal strength at BS or UE. An overview of these models can be found in [
35].
Author Contributions
Conceptualization, V.B., E.M. (Ekaterina Markova) and K.S.; methodology, E.M. (Evgeni Mokrov); software, A.K. and D.I.; validation, E.M. (Ekaterina Markova), E.M. (Evgeni Mokrov), V.B. and K.S.; formal analysis, V.B.; investigation, E.M. (Evgeni Mokrov) and V.B.; resources, A.K.; data curation, D.I.; writing—original draft preparation, E.M. (Evgeni Mokrov), V.B., Y.G. and K.S.; writing—review and editing, D.I.; visualization, A.K.; supervision, K.S.; project administration, V.B., Y.G. and K.S.; funding acquisition, K.S. All authors have read and agreed to the published version of the manuscript.
Funding
Section 3,
Section 4 and
Section 5 were written by Evgeni Mokrov under the support of the Russian Science Foundation, project no. 22-29-00222. This paper has been supported by the RUDN University Strategic Academic Leadership Program (recipients Vyacheslav Begishev,
Section 1,
Section 2 and
Section 6).
Institutional Review Board Statement
Not applicable.
Informed Consent Statement
Not applicable.
Data Availability Statement
Not applicable.
Conflicts of Interest
The authors declare no conflict of interest.
References
- Sasiain, J.; Sanz, A.; Astorga, J.; Jacob, E. Towards flexible integration of 5G and IIoT technologies in industry 4.0: A practical use case. Appl. Sci. 2020, 10, 7670. [Google Scholar] [CrossRef]
- Zafeiropoulos, A.; Fotopoulou, E.; Peuster, M.; Schneider, S.; Gouvas, P.; Behnke, D.; Müller, M.; Bök, P.B.; Trakadas, P.; Karkazis, P.; et al. Benchmarking and Profiling 5G Verticals’ Applications: An Industrial IoT Use Case. In Proceedings of the 2020 6th IEEE Conference on Network Softwarization (NetSoft), Ghent, Belgium, 29 June–3 July 2020; pp. 310–318. [Google Scholar]
- Gangakhedkar, S.; Cao, H.; Ali, A.R.; Ganesan, K.; Gharba, M.; Eichinger, J. Use cases, requirements and challenges of 5G communication for industrial automation. In Proceedings of the 2018 IEEE International Conference on Communications Workshops (ICC Workshops), Kansas City, MO, USA, 20–24 May 2018; pp. 1–6. [Google Scholar]
- Navarro-Ortiz, J.; Romero-Diaz, P.; Sendra, S.; Ameigeiras, P.; Ramos-Munoz, J.J.; Lopez-Soler, J.M. A survey on 5G usage scenarios and traffic models. IEEE Commun. Surv. Tutor. 2020, 22, 905–929. [Google Scholar] [CrossRef]
- Ivanova, D.; Markova, E.; Moltchanov, D.; Pirmagomedov, R.; Koucheryavy, Y.; Samouylov, K. Performance of Priority-Based Traffic Coexistence Strategies in 5G mmWave Industrial Deployments. IEEE Access 2022. Available online: https://ieeexplore.ieee.org/document/9682724 (accessed on 14 May 2022).
- Petrov, V.; Komarov, M.; Moltchanov, D.; Jornet, J.M.; Koucheryavy, Y. Interference and SINR in millimeter wave and terahertz communication systems with blocking and directional antennas. IEEE Trans. Wirel. Commun. 2017, 16, 1791–1808. [Google Scholar] [CrossRef]
- Bai, T.; Vaze, R.; Heath, R.W. Analysis of blockage effects on urban cellular networks. IEEE Trans. Wirel. Commun. 2014, 13, 5070–5083. [Google Scholar] [CrossRef] [Green Version]
- Gapeyenko, M.; Samuylov, A.; Gerasimenko, M.; Moltchanov, D.; Singh, S.; Aryafar, E.; Yeh, S.P.; Himayat, N.; Andreev, S.; Koucheryavy, Y. Analysis of human-body blockage in urban millimeter-wave cellular communications. In Proceedings of the 2016 IEEE International Conference on Communications (ICC), Kuala Lumpur, Malaysia, 22–27 May 2016; pp. 1–7. [Google Scholar]
- ITU-R. Propagation data and prediction methods required for the design of terrestrial broadband radio access systems operating in a frequency range from 3 to 60 GHz. In Recommendation ITU-R P.1410; ITU: Geneva, Switzerland, 2012. [Google Scholar]
- Gapeyenko, M.; Moltchanov, D.; Andreev, S.; Heath, R.W. Line-of-sight probability for mmwave-based UAV communications in 3D urban grid deployments. IEEE Trans. Wirel. Commun. 2021, 20, 6566–6579. [Google Scholar] [CrossRef]
- Begishev, V.; Moltchanov, D.; Gaidamaka, A.; Samouylov, K. Closed-Form UAV LoS Blockage Probability in Mixed Ground-and Rooftop-Mounted Urban mmWave NR Deployments. Sensors 2022, 22, 977. [Google Scholar] [CrossRef] [PubMed]
- Bragança, S.; Costa, E.; Castellucci, I.; Arezes, P.M. A brief overview of the use of collaborative robots in industry 4.0: Human role and safety. In Occupational Environmental Safety and Health; Springer: Berlin/Heidelberg, Germany, 2019; pp. 641–650. [Google Scholar]
- Klimchik, A.; Wu, Y.; Dumas, C.; Caro, S.; Furet, B.; Pashkevich, A. Identification of geometrical and elastostatic parameters of heavy industrial robots. In Proceedings of the 2013 IEEE International Conference on Robotics and Automation, Karlsruhe, Germany, 6–10 May 2013; pp. 3707–3714. [Google Scholar]
- Gapeyenko, M.; Samuylov, A.; Gerasimenko, M.; Moltchanov, D.; Singh, S.; Akdeniz, M.R.; Aryafar, E.; Himayat, N.; Andreev, S.; Koucheryavy, Y. On the temporal effects of mobile blockers in urban millimeter-wave cellular scenarios. IEEE Trans. Veh. Technol. 2017, 66, 10124–10138. [Google Scholar] [CrossRef] [Green Version]
- Pedersen, M.R.; Nalpantidis, L.; Andersen, R.S.; Schou, C.; Bøgh, S.; Krüger, V.; Madsen, O. Robot skills for manufacturing: From concept to industrial deployment. Robot. Comput.-Integr. Manuf. 2016, 37, 282–291. [Google Scholar] [CrossRef]
- Sheikh, M.U.; Ruttik, K.; Jäntti, R.; Hämäläinen, J. Blockage and Ray Tracing Propagation Model in 3GPP Specified Industrial Environment. In Proceedings of the 2021 International Conference on Information Networking (ICOIN), Jeju Island, Korea, 13–16 January 2021; pp. 397–402. [Google Scholar] [CrossRef]
- 3GPP. Study on Physical Layer Enhancements for NR Ultra-Reliable and Low Latency Case (URLLC), (Release 16). 3GPP TR 38.824 V16.0.0. March 2019. Available online: https://portal.3gpp.org/desktopmodules/Specifications/SpecificationDetails.aspx?specificationId=3498 (accessed on 14 May 2022).
- 3GPP. Study on Channel Model for Frequencies from 0.5 to 100 GHz, (Release 14). 3GPP TR 38.901 V14.0.0. March 2017. Available online: https://portal.3gpp.org/desktopmodules/Specifications/SpecificationDetails.aspx?specificationId=3173 (accessed on 14 May 2022).
- Cano, C.; Sim, G.H.; Asadi, A.; Vilajosana, X. A Channel Measurement Campaign for mmWave Communication in Industrial Settings. IEEE Trans. Wirel. Commun. 2021, 20, 299–315. [Google Scholar] [CrossRef]
- Hsu, C.H.; Kremer, U. IPERF: A framework for automatic construction of performance prediction models. In Workshop on Profile and Feedback-Directed Compilation (PFDC); Citeseer: Paris, France, 1998. [Google Scholar]
- Orsino, A.; Kovalchukov, R.; Samuylov, A.; Moltchanov, D.; Andreev, S.; Koucheryavy, Y.; Valkama, M. Caching-Aided Collaborative D2D Operation for Predictive Data Dissemination in Industrial IoT. IEEE Wirel. Commun. 2018, 25, 50–57. [Google Scholar] [CrossRef] [Green Version]
- Chetlur, V.V.; Dhillon, H.S.; Dettmann, C.P. Shortest path distance in manhattan Poisson line cox process. J. Stat. Phys. 2020, 181, 2109–2130. [Google Scholar] [CrossRef]
- Baccelli, F.; Zhang, X. A correlated shadowing model for urban wireless networks. In Proceedings of the 2015 IEEE Conference on Computer Communications (INFOCOM), Hong Kong, China, 26 April–1 May 2015; pp. 801–809. [Google Scholar]
- BlenderKit Database. Available online: https://www.blenderkit.com/ (accessed on 13 December 2021).
- UNIVERSAL ROBOT UR5e. Available online: https://www.universal-robots.com/products/ur5-robot (accessed on 13 December 2021).
- KR QUANTEC PA. Available online: https://www.kuka.com/en-de/products/robot-systems/industrial-robots/kr-quantec-pa (accessed on 13 December 2021).
- LBR iiwa. Available online: https://www.kuka.com/en-de/products/robot-systems/industrial-robots/lbr-iiwa (accessed on 13 December 2021).
- Blender 3D Modeler. Available online: https://www.blender.org/ (accessed on 13 December 2021).
- Kingman, J.F.C. Poisson Processes; Clarendon Press: Oxford, UK, 1992; Volume 3. [Google Scholar]
- Haenggi, M. Stochastic Geometry for Wireless Networks; Cambridge University Press: Cambridge, MA, USA, 2012. [Google Scholar]
- 3GPP. NR; Physical Channels and Modulation (Release 15). 3GPP TR 38.211, 3GPP. 2017. Available online: https://portal.3gpp.org/desktopmodules/Specifications/SpecificationDetails.aspx?specificationId=3213 (accessed on 14 May 2022).
- 3GPP. Study on Channel Model for Frequencies from 0.5 to 100 GHz (Release 14). 3GPP TR 38.901 V14.1.1, 3GPP. 2017. Available online: https://portal.3gpp.org/desktopmodules/Specifications/SpecificationDetails.aspx?specificationId=3173 (accessed on 14 May 2022).
- Alibakhshikenari, M.; Virdee, B.S.; See, C.H.; Shukla, P.; Moghaddam, S.M.; Zaman, A.U.; Shafqaat, S.; Akinsolu, M.O.; Liu, B.; Yang, J.; et al. Dual-polarized highly folded bowtie antenna with slotted self-grounded structure for sub-6 GHz 5G applications. IEEE Trans. Antennas Propag. 2021, 70, 3028–3033. [Google Scholar] [CrossRef]
- Alibakhshikenari, M.; Moghaddam, S.M.; Zaman, A.U.; Yang, J.; Virdee, B.S.; Limiti, E. Wideband sub-6 GHz self-grounded bow-tie antenna with new feeding mechanism for 5G communication systems. In Proceedings of the 2019 13th European Conference on Antennas and Propagation (EuCAP), Krakow, Poland, 31 March–5 April 2019; pp. 1–4. [Google Scholar]
- Moltchanov, D.; Sopin, E.; Begishev, V.; Samuylov, A.; Koucheryavy, Y.; Samouylov, K. A Tutorial on Mathematical Modeling of 5G/6G Millimeter Wave and Terahertz Cellular Systems. IEEE Commun. Surv. Tutor. 2022, 24, 2. Available online: https://ieeexplore.ieee.org/document/9726709 (accessed on 14 May 2022). [CrossRef]
| Publisher’s Note: MDPI stays neutral with regard to jurisdictional claims in published maps and institutional affiliations. |
© 2022 by the authors. Licensee MDPI, Basel, Switzerland. This article is an open access article distributed under the terms and conditions of the Creative Commons Attribution (CC BY) license (https://creativecommons.org/licenses/by/4.0/).


 ,
, 


