1. Introduction
A power-line carrier (PLC) designates the technique employed to send communication signals through power transmission lines [
1]. Its use dates back to the 1920s and it was the principal communication method used by power-supplying companies all over the world until the 1970s. Those PLC systems were based on analog techniques. By the 1980s, these were considered expensive and of a low communication capacity. Newer communication systems, such as fiber optics and ultrahigh frequency (UHF) and superhigh frequency (SHF) radio, took precedence among power companies.
The renewed interest in the PLC systems started in the 1990s with the advent of newer digital communication methods that allowed for a substantial capacity increase in PLC channels. Digital PLC communication is, at present, a very active area of research and development. Nevertheless, the vast majority of studies in this field are devoted to low-voltage (LV) and medium-voltage (MV) power systems, and very little attention has been given to the high-voltage (HV) systems (i.e., above 100 kV). HV-PLC systems are attractive at present due to two factors. One is that, with de-regulation, power companies are also becoming providers of communication services. The other one is the introduction of smart-grid technologies into power systems, which rely considerably on communication systems.
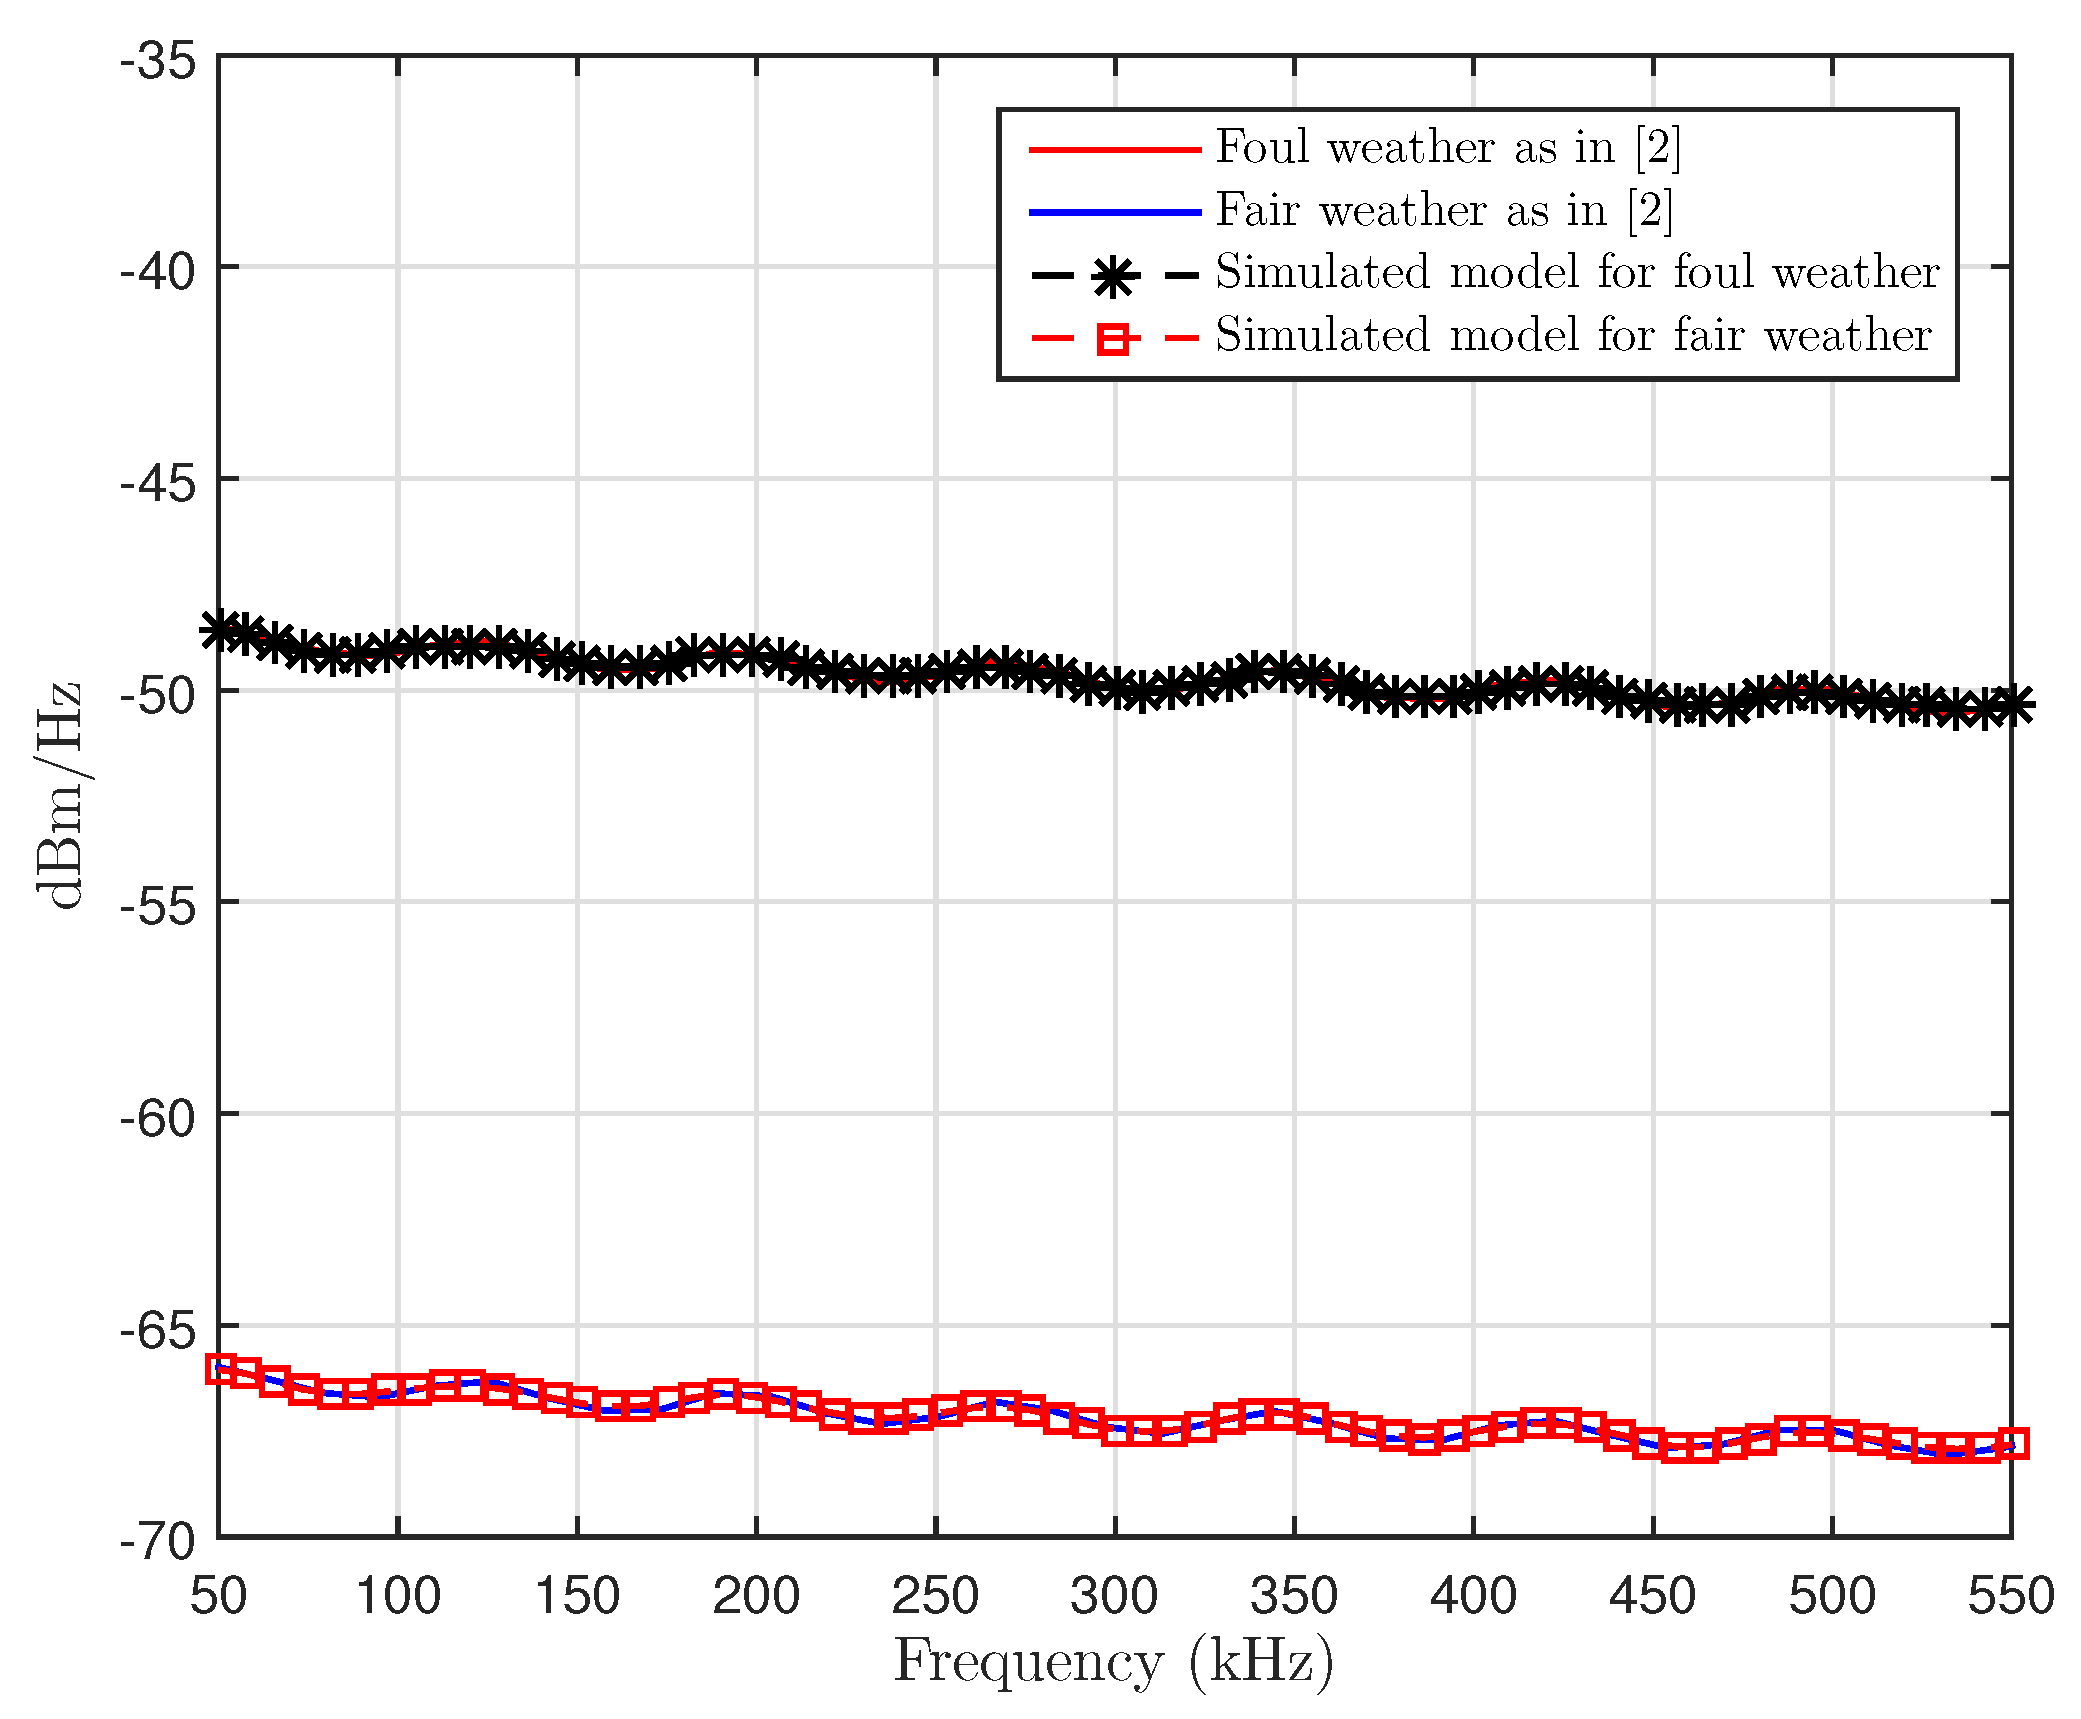
To adequately characterize the PLC channel, corona is considered the dominant noise present in the PLC system, as it is generated by the operation of the HV lines [
2]. This noise varies in intensity, depending on the operating power–voltage and weather conditions as reported in a previous work [
2]. The effects of an impulsive noise of a random nature and of a short duration due to the faulty, switching and lightning discharge in lines [
3,
4] will not be analyzed in this work as they are not indispensable to the channel characterization in the operating conditions of a PLC system. The study of the effects on the performance of the proposed system in the presence of this noise is left for further work.
Conventional PLC systems use the analog single-side band (SSB) modulation technique in combination with frequency-shift keying (FSK), with operating bandwidths of 4 kHz or multiples of 4 kHz, up to 16 kHz by using frequency-division multiplexing (FDM) for simultaneous transmission channels [
1], achieving transmission speeds up to 64 kbps. Current HV-PLC systems provide data rates between 28 kbit/s and 100 kbit/s. The main reason for operating in such narrow bands is that the single-carrier modulation schemes being used are unable to counteract the distortion caused by a selective PLC channel [
5,
6].
A PLC channel can be considered time-invariant for long periods of time compared with the symbol time-duration. The invariability of time for PLC channels on HV lines encourages the use of new modulation schemes of multiple carriers (MC) and channel estimation methods to mitigate the effects of distortion caused by the channel, as these have been analyzed in recent works for low-voltage PLC systems [
7,
8,
9,
10,
11,
12] and for wireless standards such as the 3GPP long-term evolution (LTE) and IEEE 802.16e (WiMax).
In this paper, we use modal analysis and nodal two-port
matrices [
13,
14] to characterize the frequency response of the PLC channel. The effects of wave reflections and of the limited bandwidth caused by the coupling configurations and the coupling equipment being used, which were not considered in previous works [
5,
6], are included here. In order to evaluate the performance of PLC systems in higher bandwidths, we propose as a solution the use of the MC scheme OFDM (Orthogonal Frequency-Division Multiplexing) used to transmit on highly frequency-selective channels [
15,
16,
17] at high transmission rates. The use of OFDM simplifies the processes of channel estimation and equalization on the receptor [
15,
16,
17], resulting in an increased spectral efficiency of the assigned bandwidth.
Objectives and Contributions
This work’s main contributions are the following. First, a PLC-channel model is introduced for the performance evaluation of the SC-FDM scheme in the PLC system, this model taking into account the attenuation caused by the power-line couplings at the terminals and corona noise, as well as by considering the power line as a multiline system [
18,
19] by means of the techniques proposed in [
2].
Secondly, it proposes a PLC system capable of operating in bandwidths higher than those previously mentioned. The solution is based on the use of the SC-FDM to counteract the selectivity in the frequency of the PLC channel, apart from adding stages of channel estimation by means of orthogonal bases and the LMS equalization on the receptor, as discussed in [
15].
The resulting system is thus capable of operating at higher frequencies than those found in conventional PLC systems, presenting a similar performance to an ideal lossless channel with white noise.
2. HV-PLC Channel
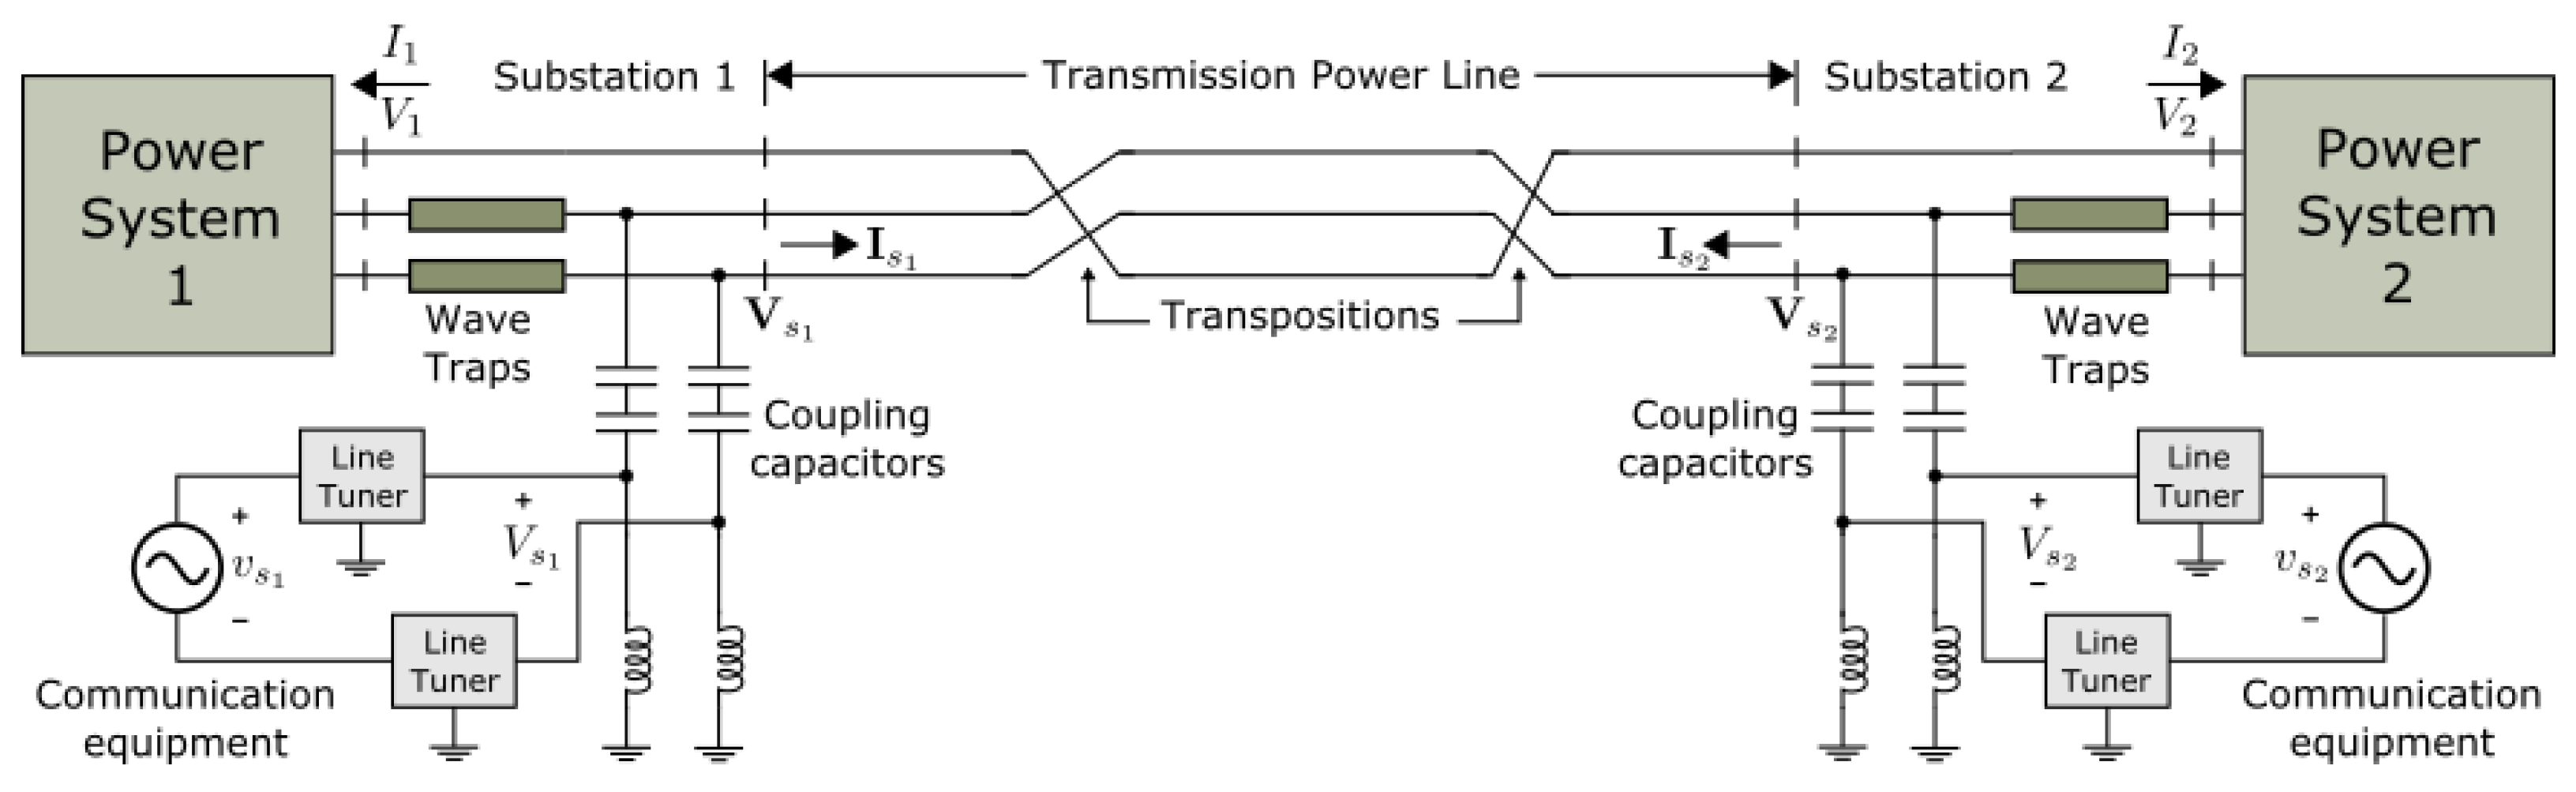
Figure 1 depicts an HV power transmission line connecting two power systems 1 and 2, along with the coupling equipment required to establish PLC communications between substations 1 and 2. Wave traps are essentially inductive devices intended to confine the high-frequency (HF) communication signals within the line-segment joining substations 1 and 2 and to prevent these signals from going into power systems 1 and 2. The wave traps must permit the free passage of the low-frequency high-power signal. The coupling capacitors, on the other hand, must prevent the high-power signal from entering the communication equipment and damaging it. Coupling capacitors must permit the passage of HF communication signals from the communication equipment into the HV power line.
Due to power-system requirements, the conductors of long HV lines are rotated at certain intermediate points in order to exchange positions. These rotations are referred to as transpositions and have the purpose of balancing the line admittances and impedances at the power-transmission frequency. Nevertheless, for the communication HF signals, the transpositions constitute discontinuities that provoke reflections and losses.
The performance of a PLC channel, either digital or analog, is determined by its frequency response and its noise features. The PLC bandwidth is assumed here to be from 30 kHz to 500 kHz [
1]. In order to determine the frequency response of a PLC system, one must account for the wave propagation features of the line, the reflection effects and the coupling equipment.
2.1. HF Signal Propagation along Power Lines
Power lines are multiconductor structures and a signal injected into one conductor will travel along all line conductors, including the ground plane [
14,
20]. The way to analyze wave propagations along a power line is to first break it into homogeneous line segments, that is, into the segments between transpositions as in
Figure 1. Then, the solutions of the homogeneous parts are cascaded according to the line layout and with the proper insertion of mathematical representations of the line discontinuities, in this case, of the transpositions [
14,
20].
Consider a uniform power line segment. Voltages and currents along this are determined by the following line equations [
20]:
and
where
and
are the respective vectors, or
–dimension column matrices, of voltages and of currents at the
n line conductors.
and
are the respective
n ×
n–dimension matrices of line impedances and admittances in per unit of length. The general solutions of (
1) and (
2) are given as follows: [
20]
with
and
At expressions (
3) and (
4),
and
represent vectors of integration constants to be determined by the boundary conditions (i.e., terminal connections) of the line segment. As the boundary conditions of
Figure 2 are introduced in (
3) and (
4), the following modal two-port representation is obtained for the homogeneous multiconductor line segment:
with
and
l is the length of the line segment.
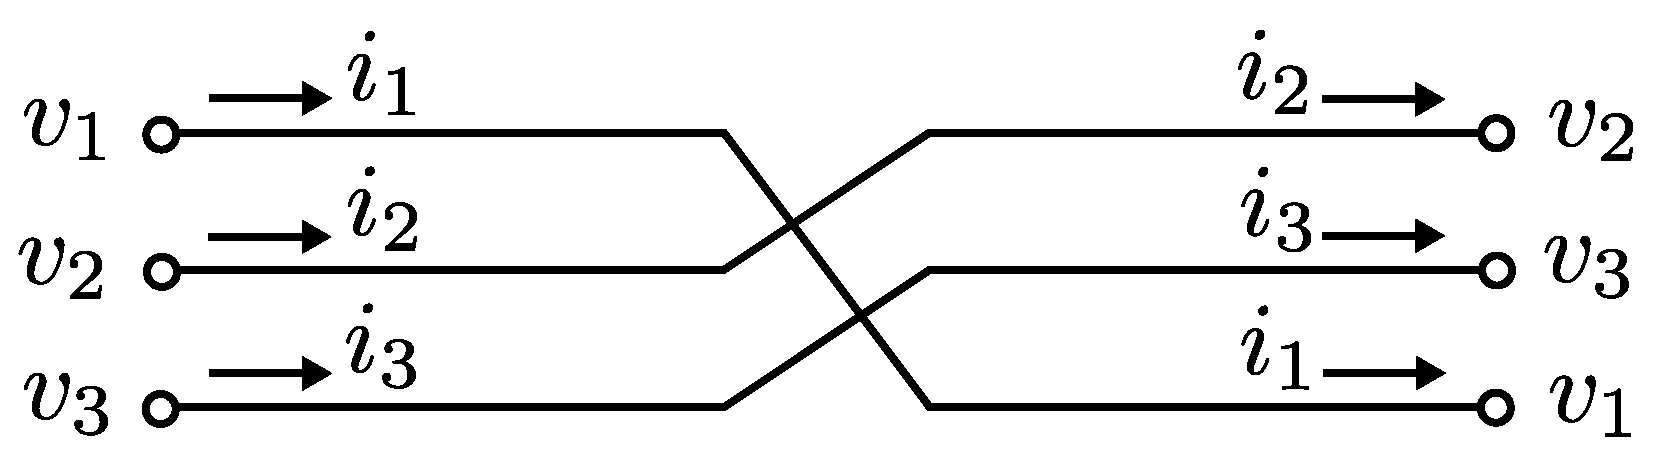
The line discontinuities of most interest to analyze PLC-signal propagation are the line transpositions.
Figure 3 provides an example of these for a three-conductor line.
Clearly from this figure, currents and voltages at both ends of the transposition are related as follows by means of a rotation matrix
:
with
The build-up of the nodal two-port representation of a non-uniform line, for the PLC analysis, proceeds by cascading each homogeneous section representation as in (
7) with its corresponding rotation matrix as in (
10) and (
11). The end result can be expressed as follows:
where
and
are the respective vectors of currents and of voltages at substation 1 (see
Figure 1) and
and
are those vectors at substation 2. Matrices
,
,
and
result from the cascading process [
14].
2.2. PLC-Channel Frequency Response
Power systems 1 and 2 of
Figure 1 are included in the PLC-channel analysis by means of their one-port nodal representation through a frequency-dependent matrix
:
Further inclusion in (
12) of coupling equipment yields the relation between voltages
and
at the communication equipment 1 and 2 in
Figure 1:
where
H is a scalar transfer function.
Figure 4 provides typical diagrams for the PLC coupling equipment being considered here: the wave trap and the line tuners. For details on the inclusion in (
12) of the coupling equipment the reader is referred to [
14]. Supposing
is the transmitted signal and
the received one, the PLC-channel attenuation is:
Mention is made here that the attenuation given by (
14) is frequency dependent and that its variations are due to the multiconductor line propagation features, to the choice of the line coupling scheme and to the values of the coupling-device elements.
The coupling schemes at both sides of the power line depicted in
Figure 1 involve two line conductors. This is referred to as a phase-to-phase coupling [
1]. In practice, the coupling is often made to one conductor only and to the ground, and this is called a phase-to-ground coupling [
1]. When designing a PLC system, one has to select the best coupling scheme. On a three-phase line, there are six possible coupling schemes for the phase-to-ground modality, as well as six other alternatives for the phase-to-phase coupling configuration.
One last remark about PLC coupling is that PLC signals travel in multiple line modes. There are
n modes for an
n-conductor line. Certain couplings present the problem known as modal cancellation [
14] consisting of two modes arriving with opposite phase angles and canceling each other, with the consequent loss of the communication signal. The proper design of a PLC system involves the selection of a coupling scheme immune to modal cancellation.
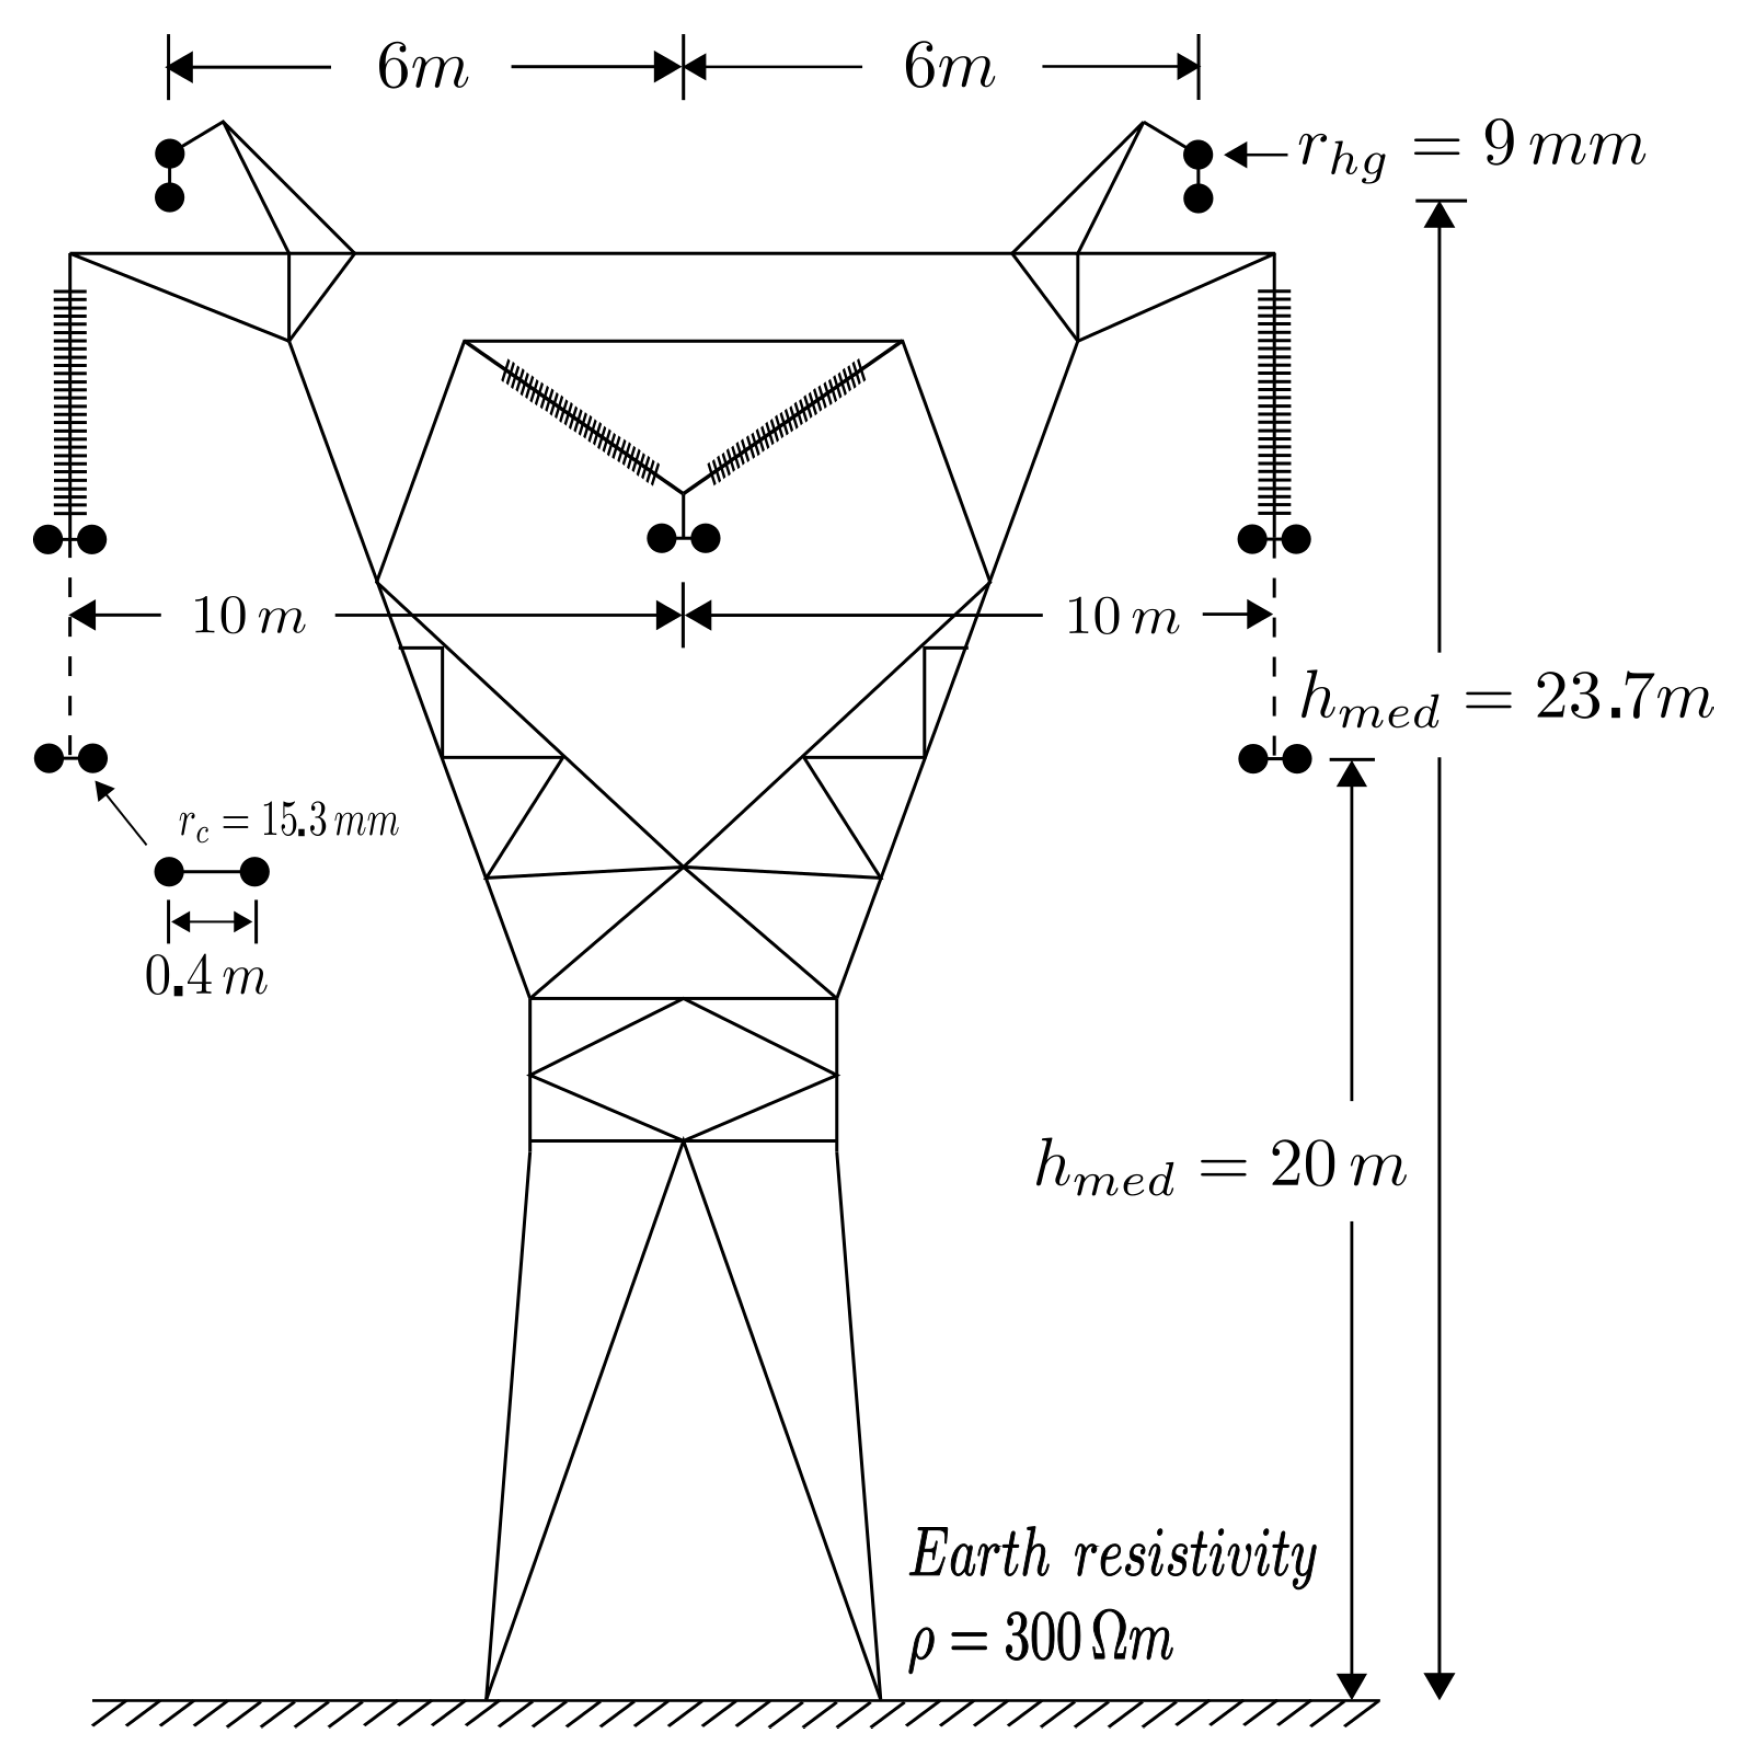
2.3. Study Case
Consider as study case the power system with the layout shown in
Figure 1. The full length of the line is
km and the distance between line transpositions is
km.
Figure 5 provides the transversal geometry of the transmission line and the electric data required to evaluate the corresponding frequency-dependent matrices
and
as in Equations (
1) and (
2) [
21]. From these matrices, one can then evaluate matrices
and
as in (
8) and (
9) and, further,
,
,
and
in (
12). The desired PLC-channel transfer function
H in (
13) is derived according to the connection diagram of
Figure 1, from the latter four matrix functions, from the nodal representations of the coupling devices in
Figure 4a–c and from the matrices
and
representing power systems 1 and 2. For the sake of simplicity, in the present study case, it is assumed that both power systems can be considered as semi-infinite power lines; thus, according to (
6):
Table 1 provides the coupling schemes being considered here.
Table 2 provides the data for the coupling devices in
Figure 4.
Figure 6 provides plots of the PLC-channel frequency-response (attenuation) for each coupling scheme. One can note from this figure that the best couplings are
and
. One can also notice there that coupling
presents a large attenuation peak very likely due to the cancellation of line modes. In practice, coupling
should thus be avoided.
4. System Model
Let
be the signal being transmitted with an OFDM modulation composed by a collection of properly weighted functions expressed as follows:
where coefficients
are composed of:
information symbols,
pilots and
guards. The set of orthogonal
functions transmitted in one block are in the following form:
where
N indicates the size of the OFDM symbol.
The signal received in time domain for a determined OFDM symbol
after cyclic prefix (CP) removal can be expressed in its complex baseband representation as:
where
,
,
) is the longitude of the channel impulse response (CIR) baseband,
is the maximum delay spread and
is the sampling period.
is the gain variable which corresponds to the
n-th symbol for an impulse introduced at
l previous samples and
the noise present under system operation: corona and additive white Gaussian noise (AWGN). Assuming that the PLC channel remains quasi-static over the period of an OFDM block, Equation (
20) can be rewritten in its frequency-domain representation as follows:
where
represents the frequency response of the PLC channel,
the transmitted OFDM symbols and
the noise present under system operation: corona and AWGN. In order to estimate the transmitted signal
, the following processes are carried out: channel estimation
, data reconstruction via least squares and equalization via Wiener filtering as reported in [
15].
4.1. Single-Carrier Frequency-Division Multiple
As a consequence of the fading present in the PLC channel, a certain number of data subcarriers are susceptible to detection errors due to deep fades on their channel gains. Considering that the proposed receptor utilizes linear estimators, it is not limited to finite constellations, permitting the use of linear codifiers, i.e., the domain and the image of the estimator covers any complex vector.
The technique known as SC-FDM [
23,
24,
25,
26] utilizes the Fourier
matrix:
as the appropriate data coder/decoder (DFT/IDFT proccessing) for the following reasons:
Structure of complex exponential sequences implies that each information symbol at the input distributes its energy uniformly over the entire output vector bandwidth. Consequently, deep fades are spread across the entire bandwidth and no particular data symbols are greatly affected. This process whitens the channel and helps each data symbol to experiment SNR close to the average.
Coding and decoding processes can be performed by using the fast Fourier transform (FFT) algorithm, which has reduced complexity.
It is important to mention that this coding process does not cause any reduction in the spectral efficiency achieved in conventional OFDM. This precoding method is currently used in standards such as LTE in uplink.
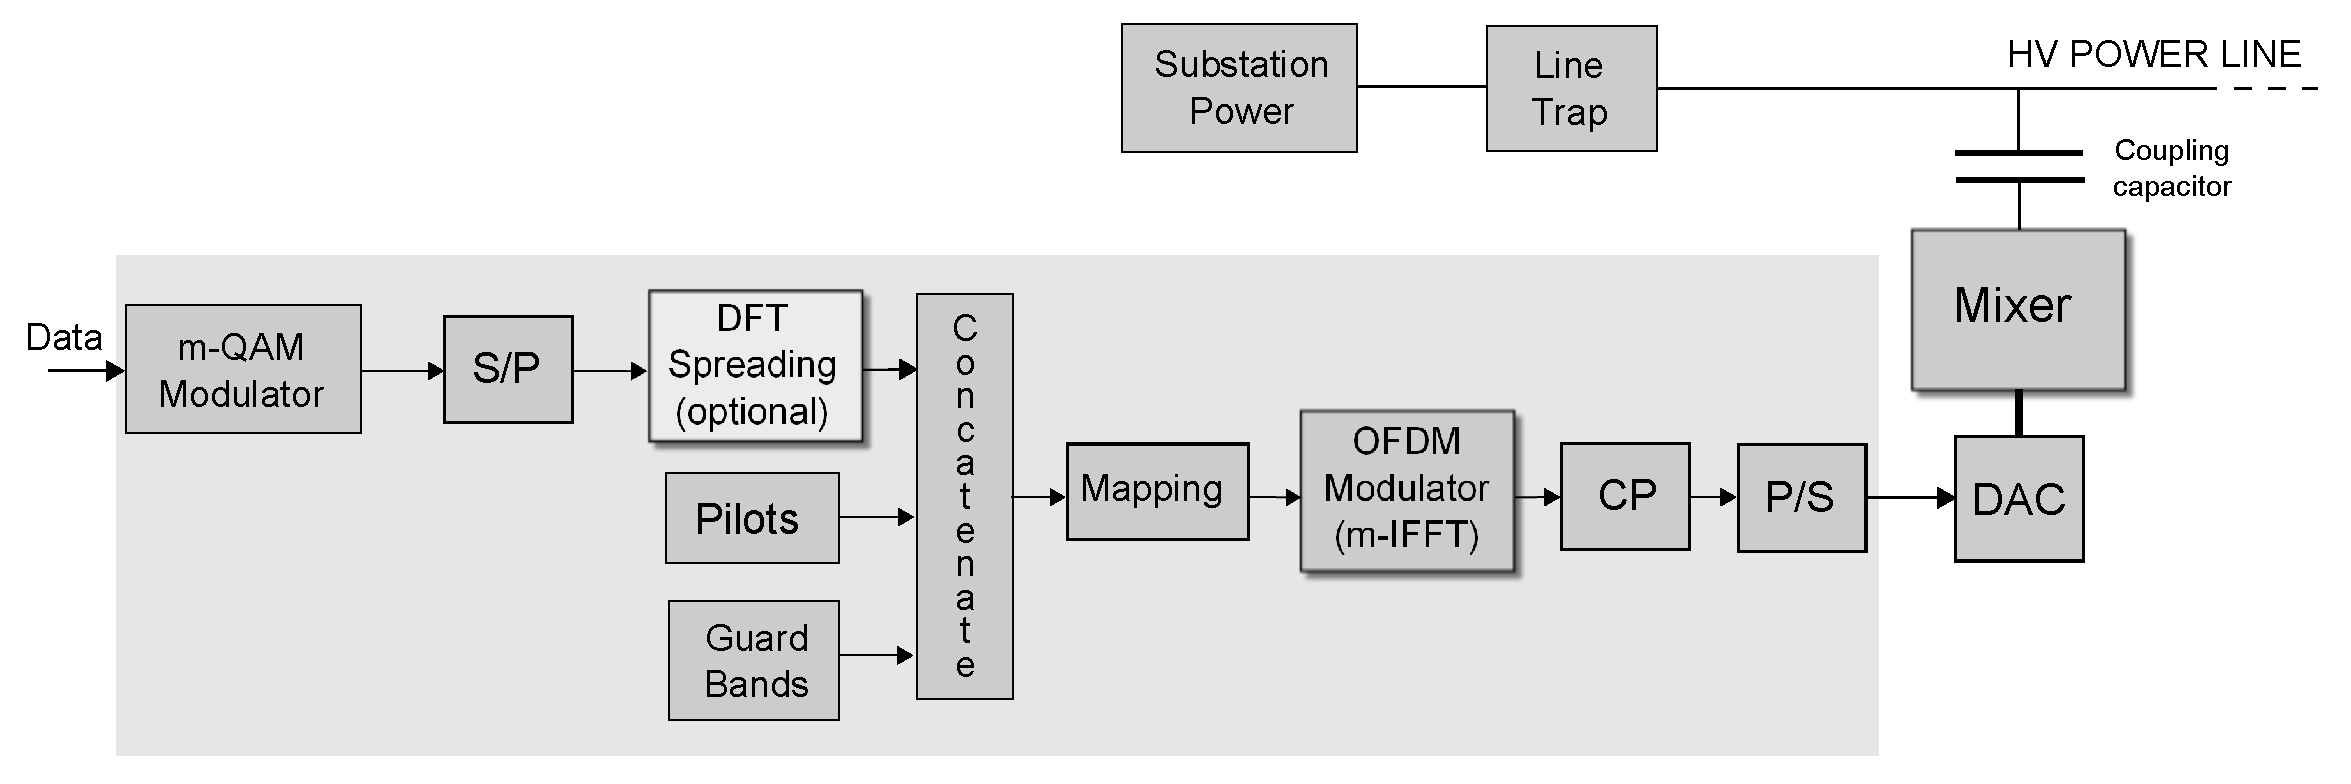
4.2. Computational Structure and Simulation Model
Figure 8 shows the transmitter model of the PLC communication system with the proposed SC-FDM modulation. The highlighted section indicates the time-domain process in baseband. The transmitter design consists of three stages: symbol formation, inverse fast Fourier transform (IFFT) modulation and CP insertion. The transmitter receives random bits of information as input, assuming a uniform distribution; the
m-Quadrature Amplitude Modulation (
m-QAM) maps
bit sets to a single complex number in the selected constellation, which are linearly precoded in blocks of size
, using the DFT.
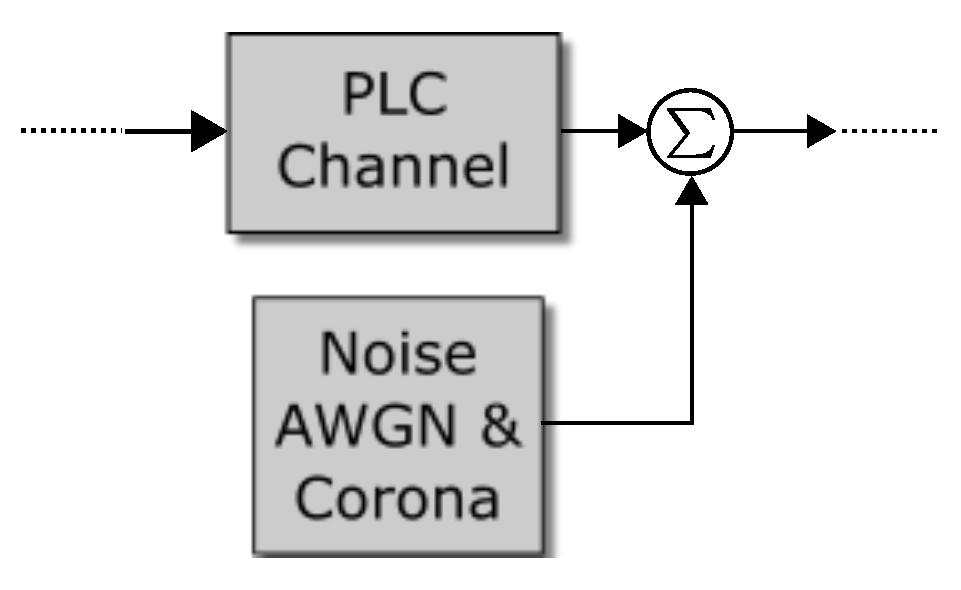
The OFDM symbols are subjected to the distortion effects of the PLC channel by means of a FIR filter, which replicates the characteristics found in the frequency-channel model. At the filter output, the AWGN and corona noise are added to the signal in order to replicate the PLC channel, as shown in
Figure 9.
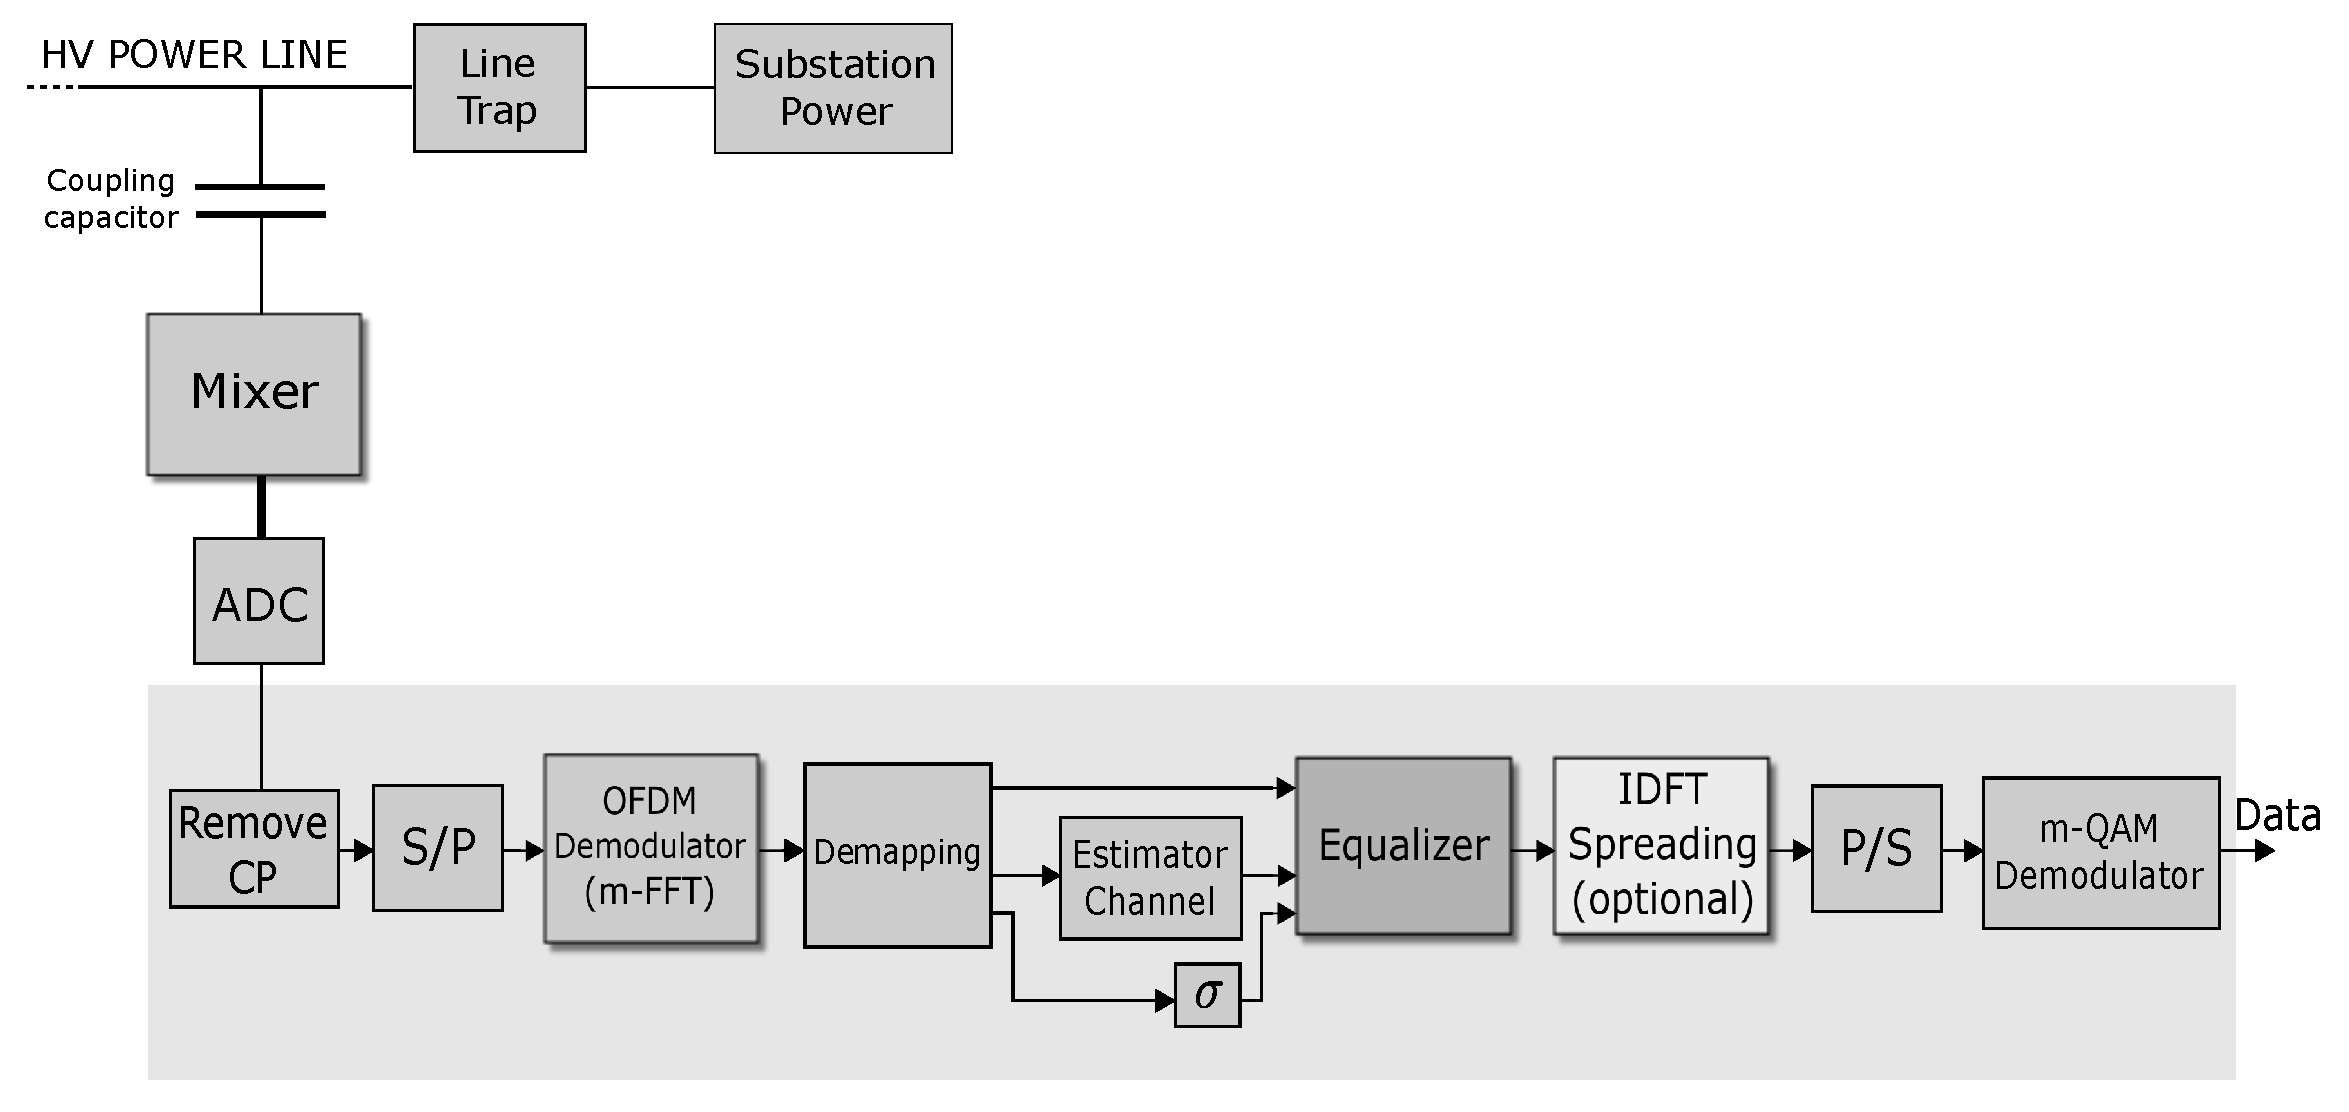
The design of the SC-FDM PLC receptor shown in
Figure 10 involves stages that carry out the inverse processing of each of the transmitter stages, as well as the annexation of the estimator and equalizer in order to compensate for the distortions caused by the PLC channel. The stages are: coupling to the HV line, Mixer, ADC, PC extraction, OFDM demodulation (FFT processing), OFDM symbol demapping (separation of data symbols, pilots and guards), data decoding (IDFT processing). Estimation of the PLC channel or system identification is carried out via techniques reported in recent works [
15] employing PROLATE orthogonal base expansion.
5. Performance Analysis
The performance of the proposed PLC system with the OFDM and SC-FDM modulation schemes was evaluated through bit-transmission speed, achieved by the
m-th constellation and bandwidth utilized, i.e., for an ideal OFDM system without guard intervals and pilots with a spectral efficiency equal to:
where
corresponds to the data constellation size. Therefore,
represents the system throughput, and
corresponds to the system bandwidth. However, the annexation of guards and pilots in practical OFDM systems gives:
where
N indicates the size of the OFDM symbol,
the number of pilots used and
M the size of the CP.
The system was tested and compared under the PLC-channel simulation environment for each coupling scheme in
Table 1. The configuration parameters are shown in
Table 3. For data transmission, the 64 QAM and 32 QAM constellations were used. The impulse response of the different channels in the discrete baseband representation is modeled as a FIR filter whose taps come from the inverse discrete Fourier transform of the sampled transference functions. The maximum longitude was truncated to an interval that contained practically all of the signal energy, approximating this with
taps. In order to obtain raw data regarding the performance of the proposed system, channel-coding stages have been omitted. Consequently, the bit error rate (BER) is calculated directly after quantizing the equalizer output (bit detection). Two testing schemes were carried out for the system evaluation, the first consisting of the system operation with the abovementioned parameters using the conventional OFDM and the second consisting of precoding the data with the aid of the SC-FDM.
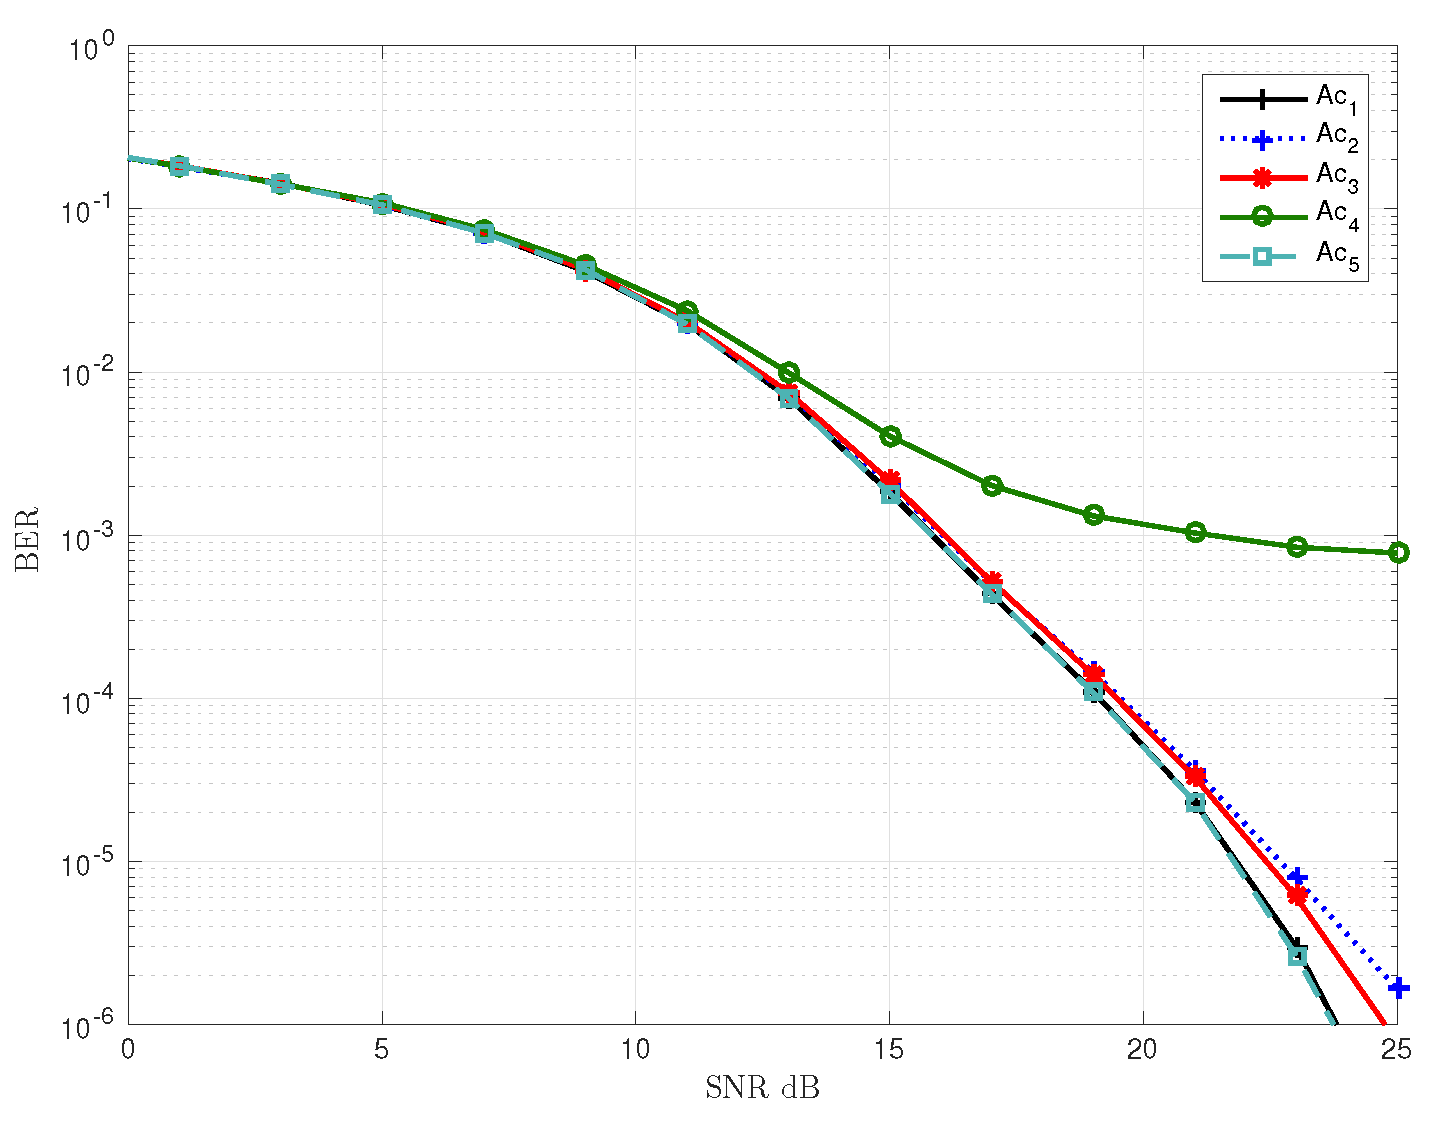
Figure 11 shows the BER obtained for each coupling mentioned in
Section 2, utilizing the OFDM modulation. For an SNR equal to 12 dB or lower, it can be observed that all couplings maintain a similar performance. However, for high SNR levels, the differences between the BER for each coupling become higher. For example, the difference between coupling
and
is of an order of magnitude for an
dB, while the other couplings that do not present fading as severe as in
maintain a similar behavior.
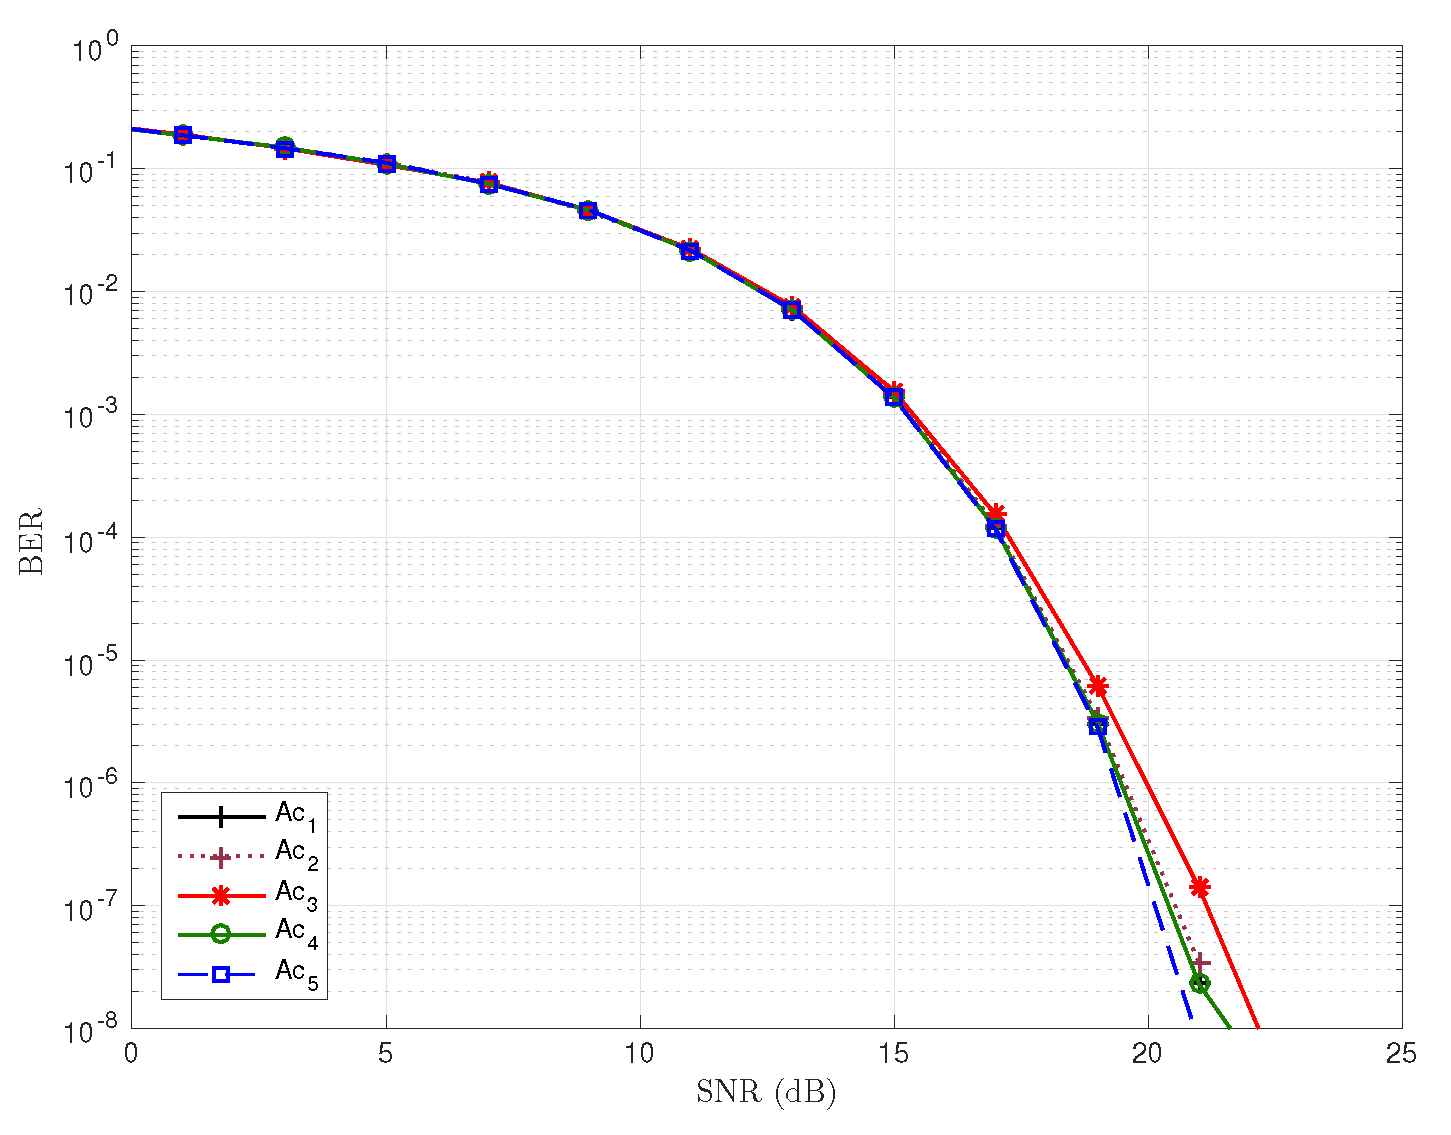
Figure 12 shows the BER obtained using the SC-FDM scheme and the same testing configuration as before. A significant improvement can be observed for each coupling, maintaining a similar behavior under 20 dB in the SNR and a five-fold improvement in coupling
with respect to tests carried out with the conventional OFDM modulation. These results corroborate that the use of the SC-FDM significantly increases the raw performance of the PLC without a loss of spectral efficiency.
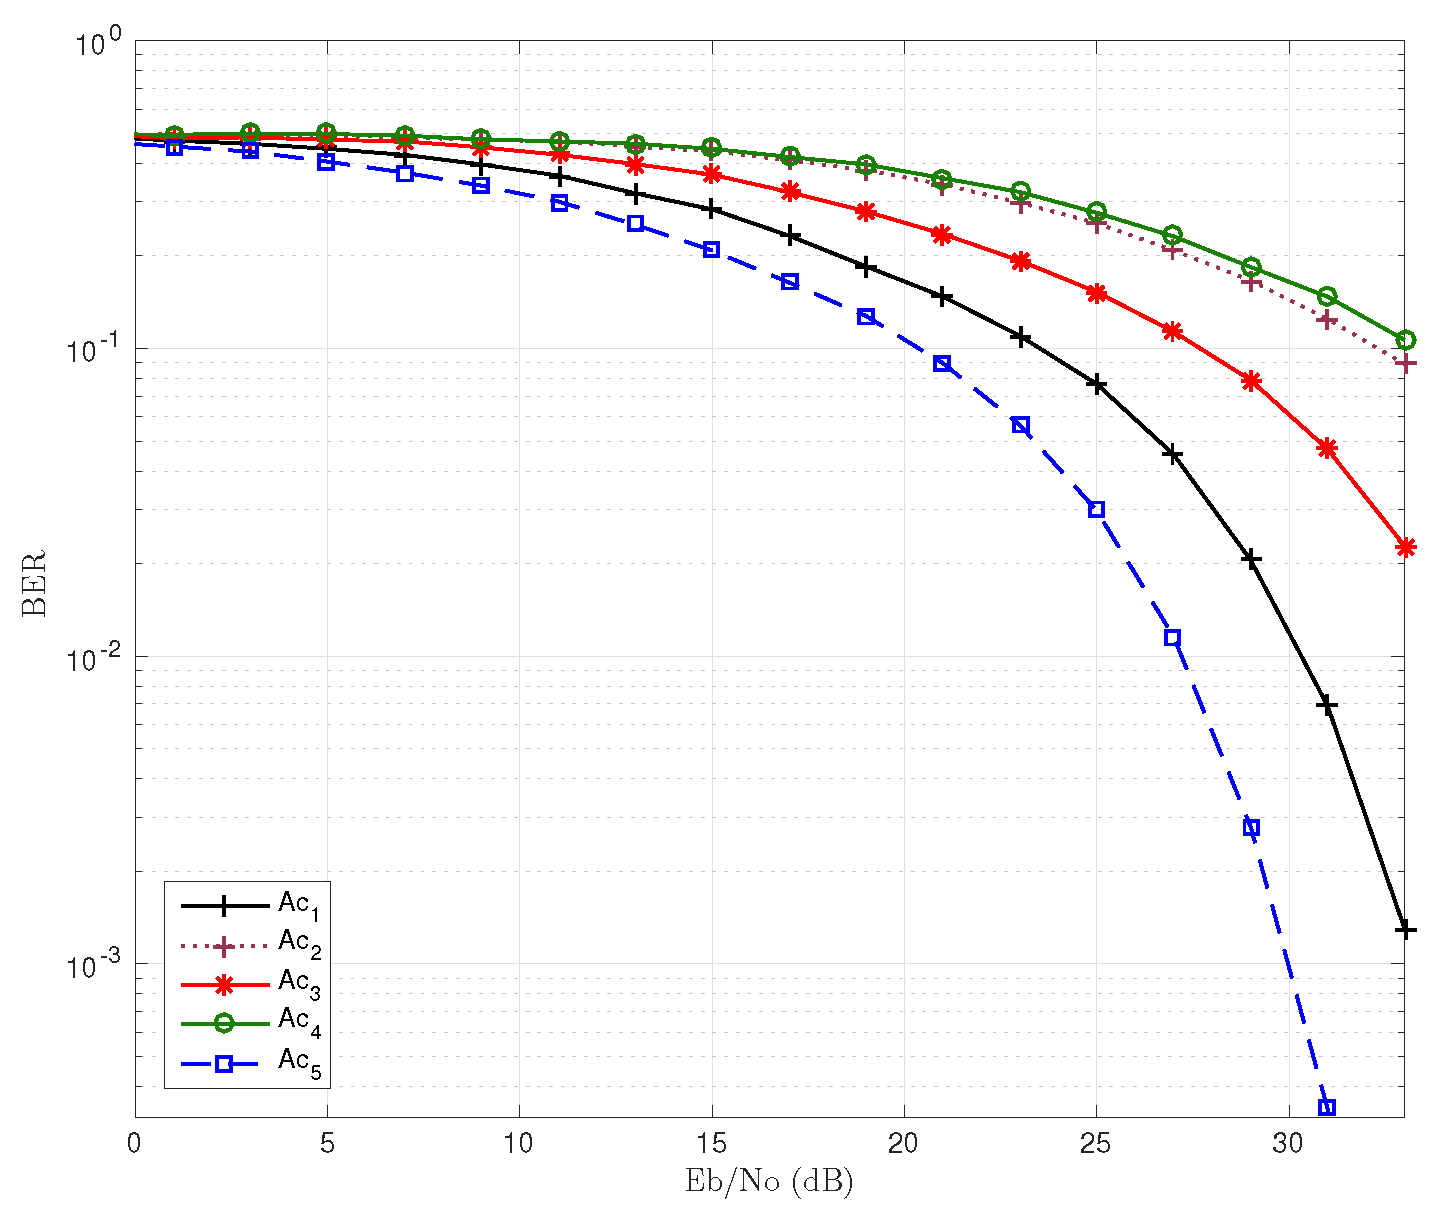
Figure 13 shows the BER results obtained with respect to energy per bit to noise power spectral density ratio (Eb/N0). This experiment reveals the impact of the average attenuation of each PLC coupling when the transmitter energy per bit is fixed. As in the previous test, the SC-FDM scheme is used. It can be seen that in comparison to
Figure 12, there are significant differences in the performance. The best results are achieved using the
coupling, in contrast with the
coupling, which has a significant loss of performance. The
and
couplings showed similar performance due to their closeness in frequency response and attenuation levels.
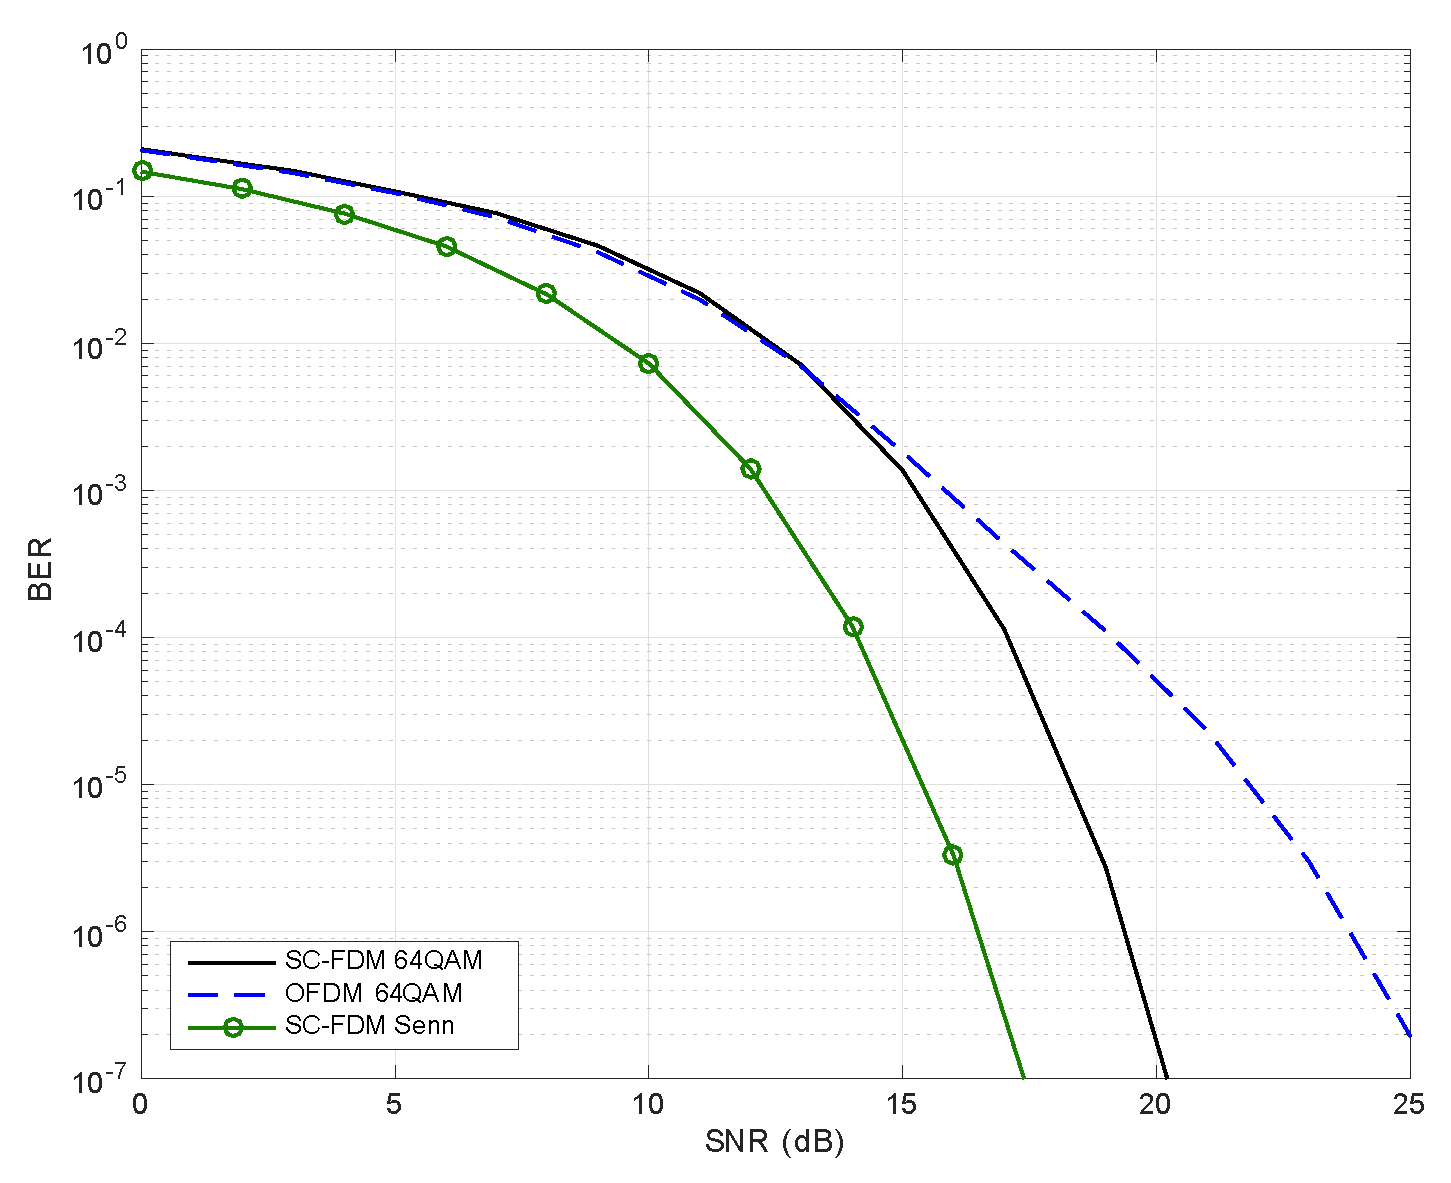
Figure 14 illustrates the comparison of the two modulation schemes over coupling
. Senn’s HV-PLC model [
6], which does not include reflection and coupling equipment effects, is compared there against the one being proposed here. The 3 dB performance difference (see
Table 4) in
Figure 14 shows the relevance of including the previously mentioned effects. The spectral efficiency achieved in the system is
bit/s/Hz using the 64 QAM constellation with a transmission capacity of
Mbits/s for the selected bandwidth, representing a better throughput than conventional PLC systems, unable to counteract the frequency selectivity of the channel to the BW above 100 kHz, which sustain transmission capacities between 28 kbit/s and 100 kbit/s.
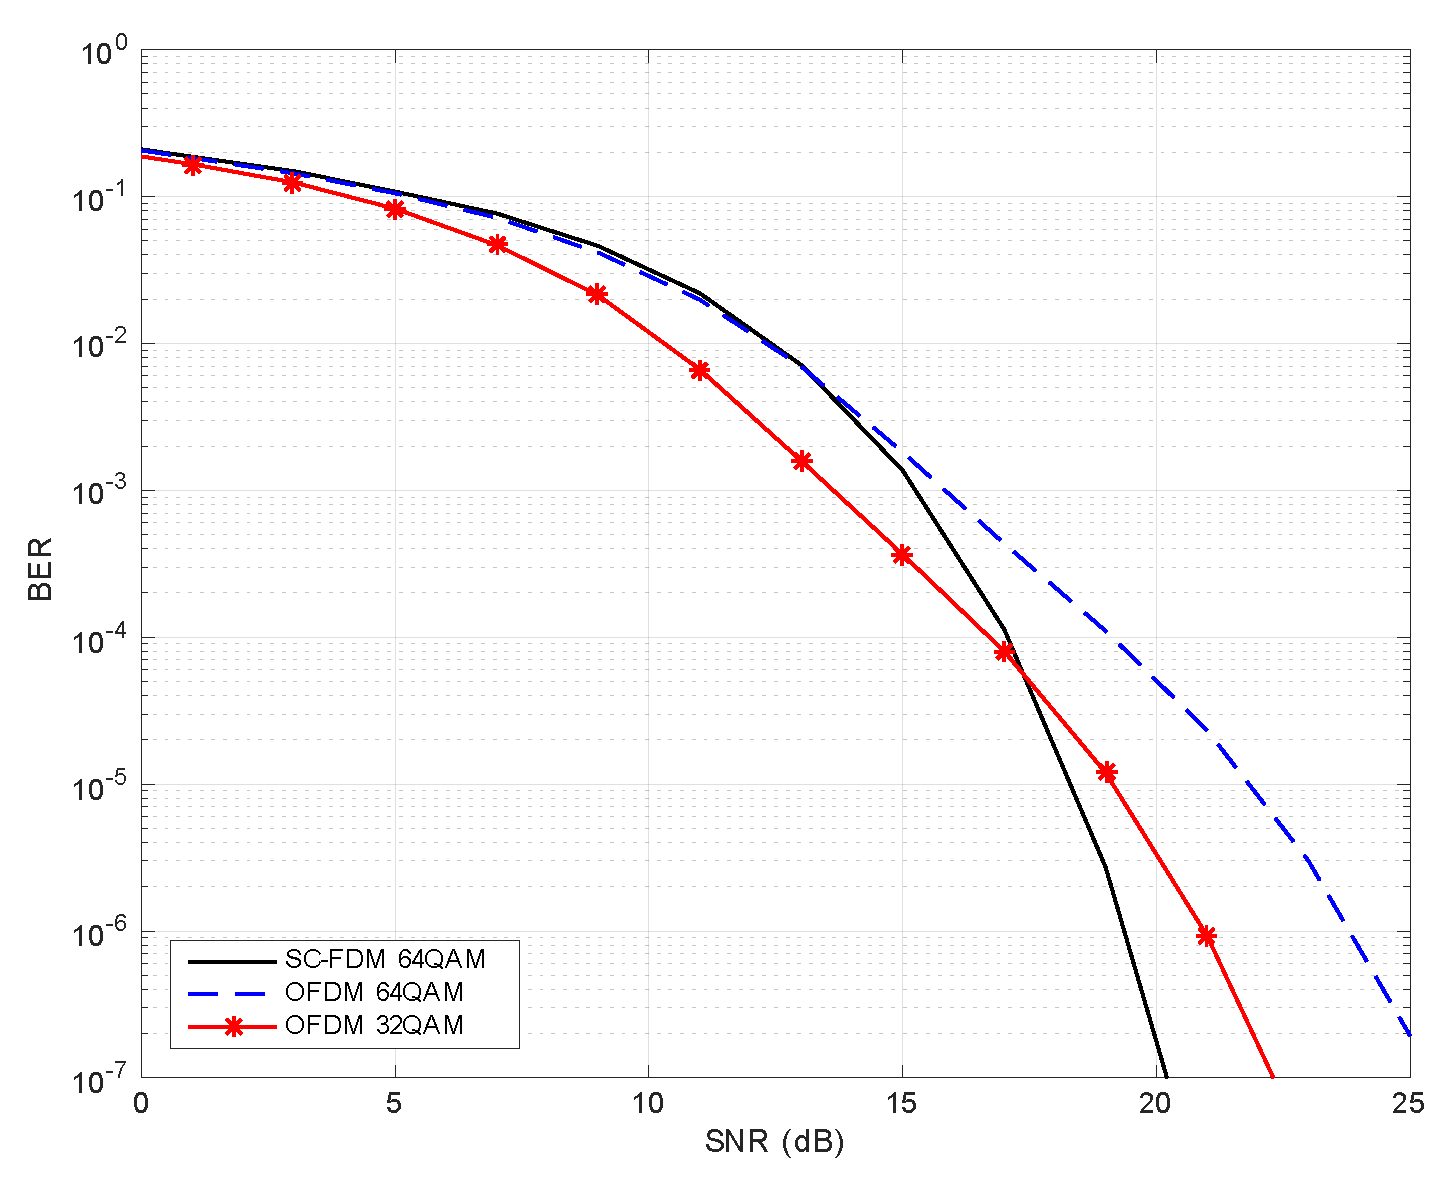
The superiority of the SC-FDM modulation scheme can be seen in
Figure 15. For an SNR = 18 dB, we obtain a BER lower than
with a spectral efficiency of 5.2941 bit/s/Hz. In order to achieve the same performance with the conventional OFDM scheme, the constellation must be reduced to 32 QAM, obtaining an inferior spectral efficiency of 4.4118 bit/s/Hz, or the constellation can be kept at 64 QAM with a cost of 3 dB in the SNR to sustain the same spectral efficiency. It is also important to highlight that a better performance can be obtained in all cases utilizing channel-coding schemes and forward-error correction (FEC) at the cost of throughput reductions. Finally,
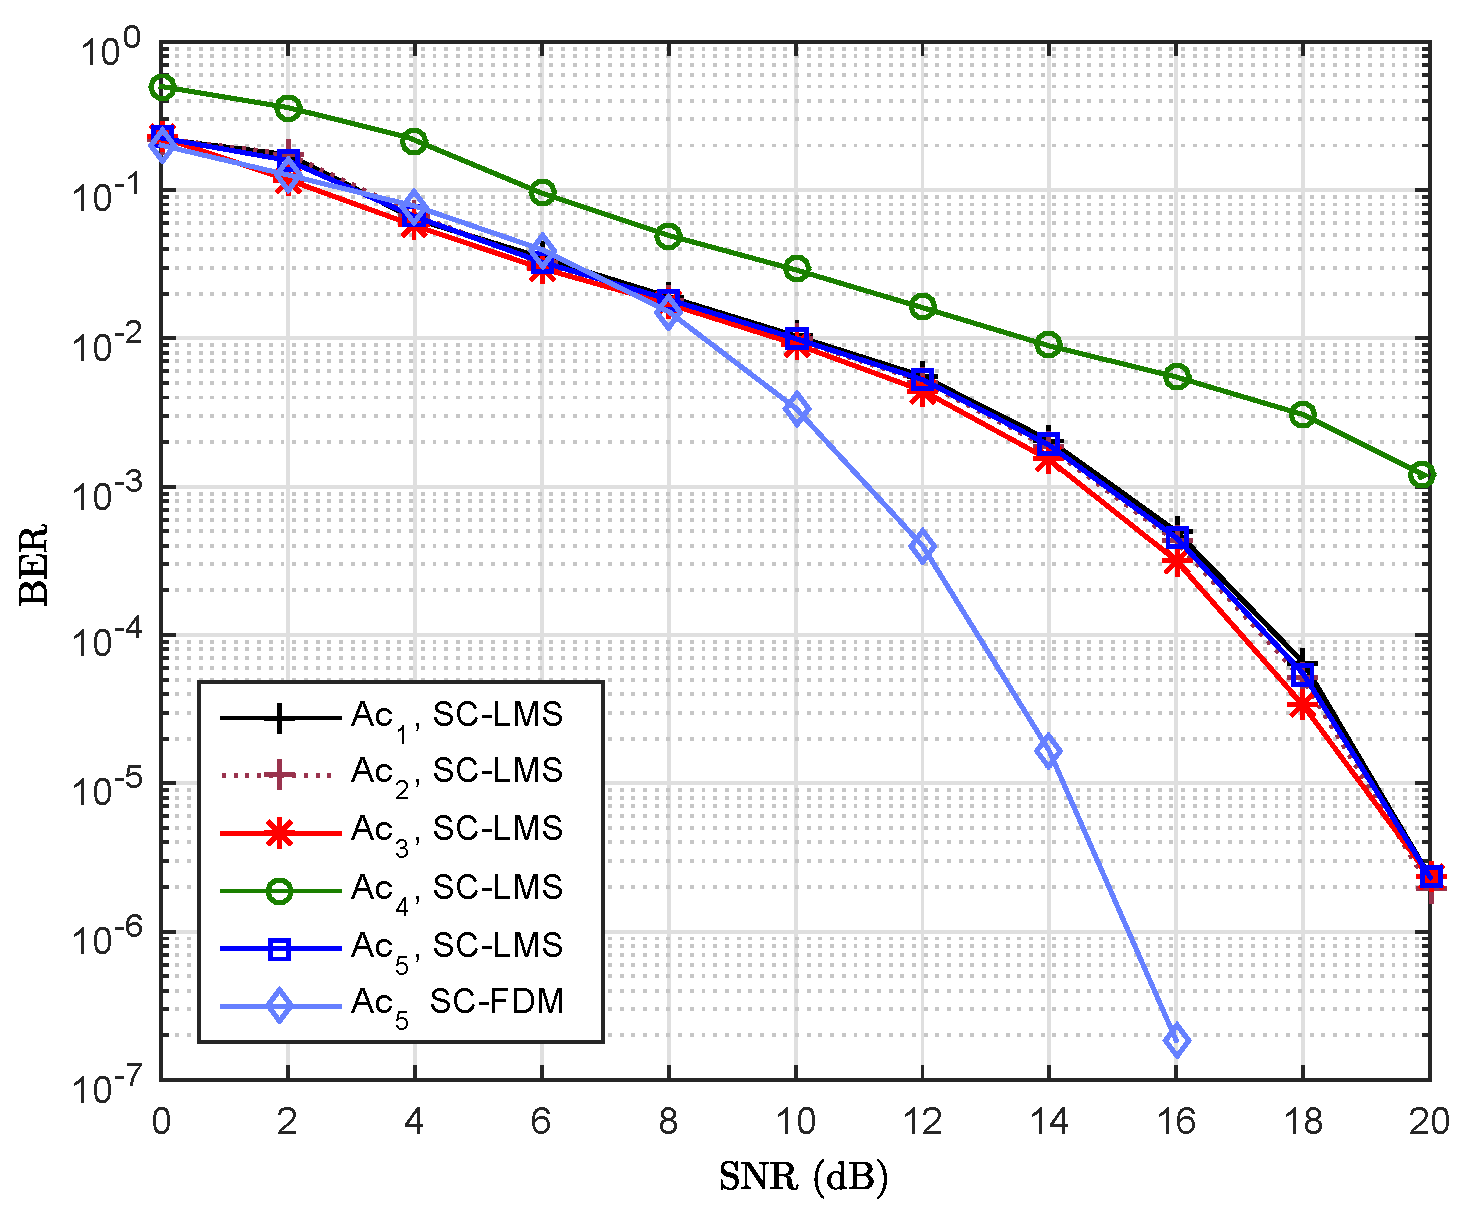
Figure 16 shows the comparison in the performance between the conventional PLC-systems, the modulation scheme 8-QAM of a single carrier (SC) and the linear equalization least mean squares (LMS) on the data reception, in contrast to the system proposed in this paper, both in 64 kHz bandwidth. The operating superiority of the SC-FDM scheme is shown as above 12 dB SNR, exhibiting a difference above 4 dB in performance for the couplings
,
,
,
and above 8 dB with respect to
.


 ,
, 


