
Enhancing Short-Term Sales Prediction with Microblogs: A Case Study of the Movie Box Office


Abstract
:1. Introduction
- Unlike previous works that focused on event detection or prediction from microblogging platforms, this paper concentrates on short-term product sales based on microblogs and presents a new framework based on sentiment analysis and social influence.
- We propose a new feature called social influence to reflect the impact of social-network information diffusion on short-term product sales. A new algorithm is presented to measure the social influence in the paper.
- We conduct experiments on a real dataset to evaluate the performance of the proposed framework. We take movie box office prediction as a case study and analyze the prediction performance of two regression models. The results show that the proposed sentiment feature and influence feature of microblogs play a positive role in improving the prediction precision.
2. Related Work
2.1. Microblog Influence Analysis
2.2. Social Network-Based Information Prediction
3. Framework of the Microblog-Based Short-Term Sales Prediction
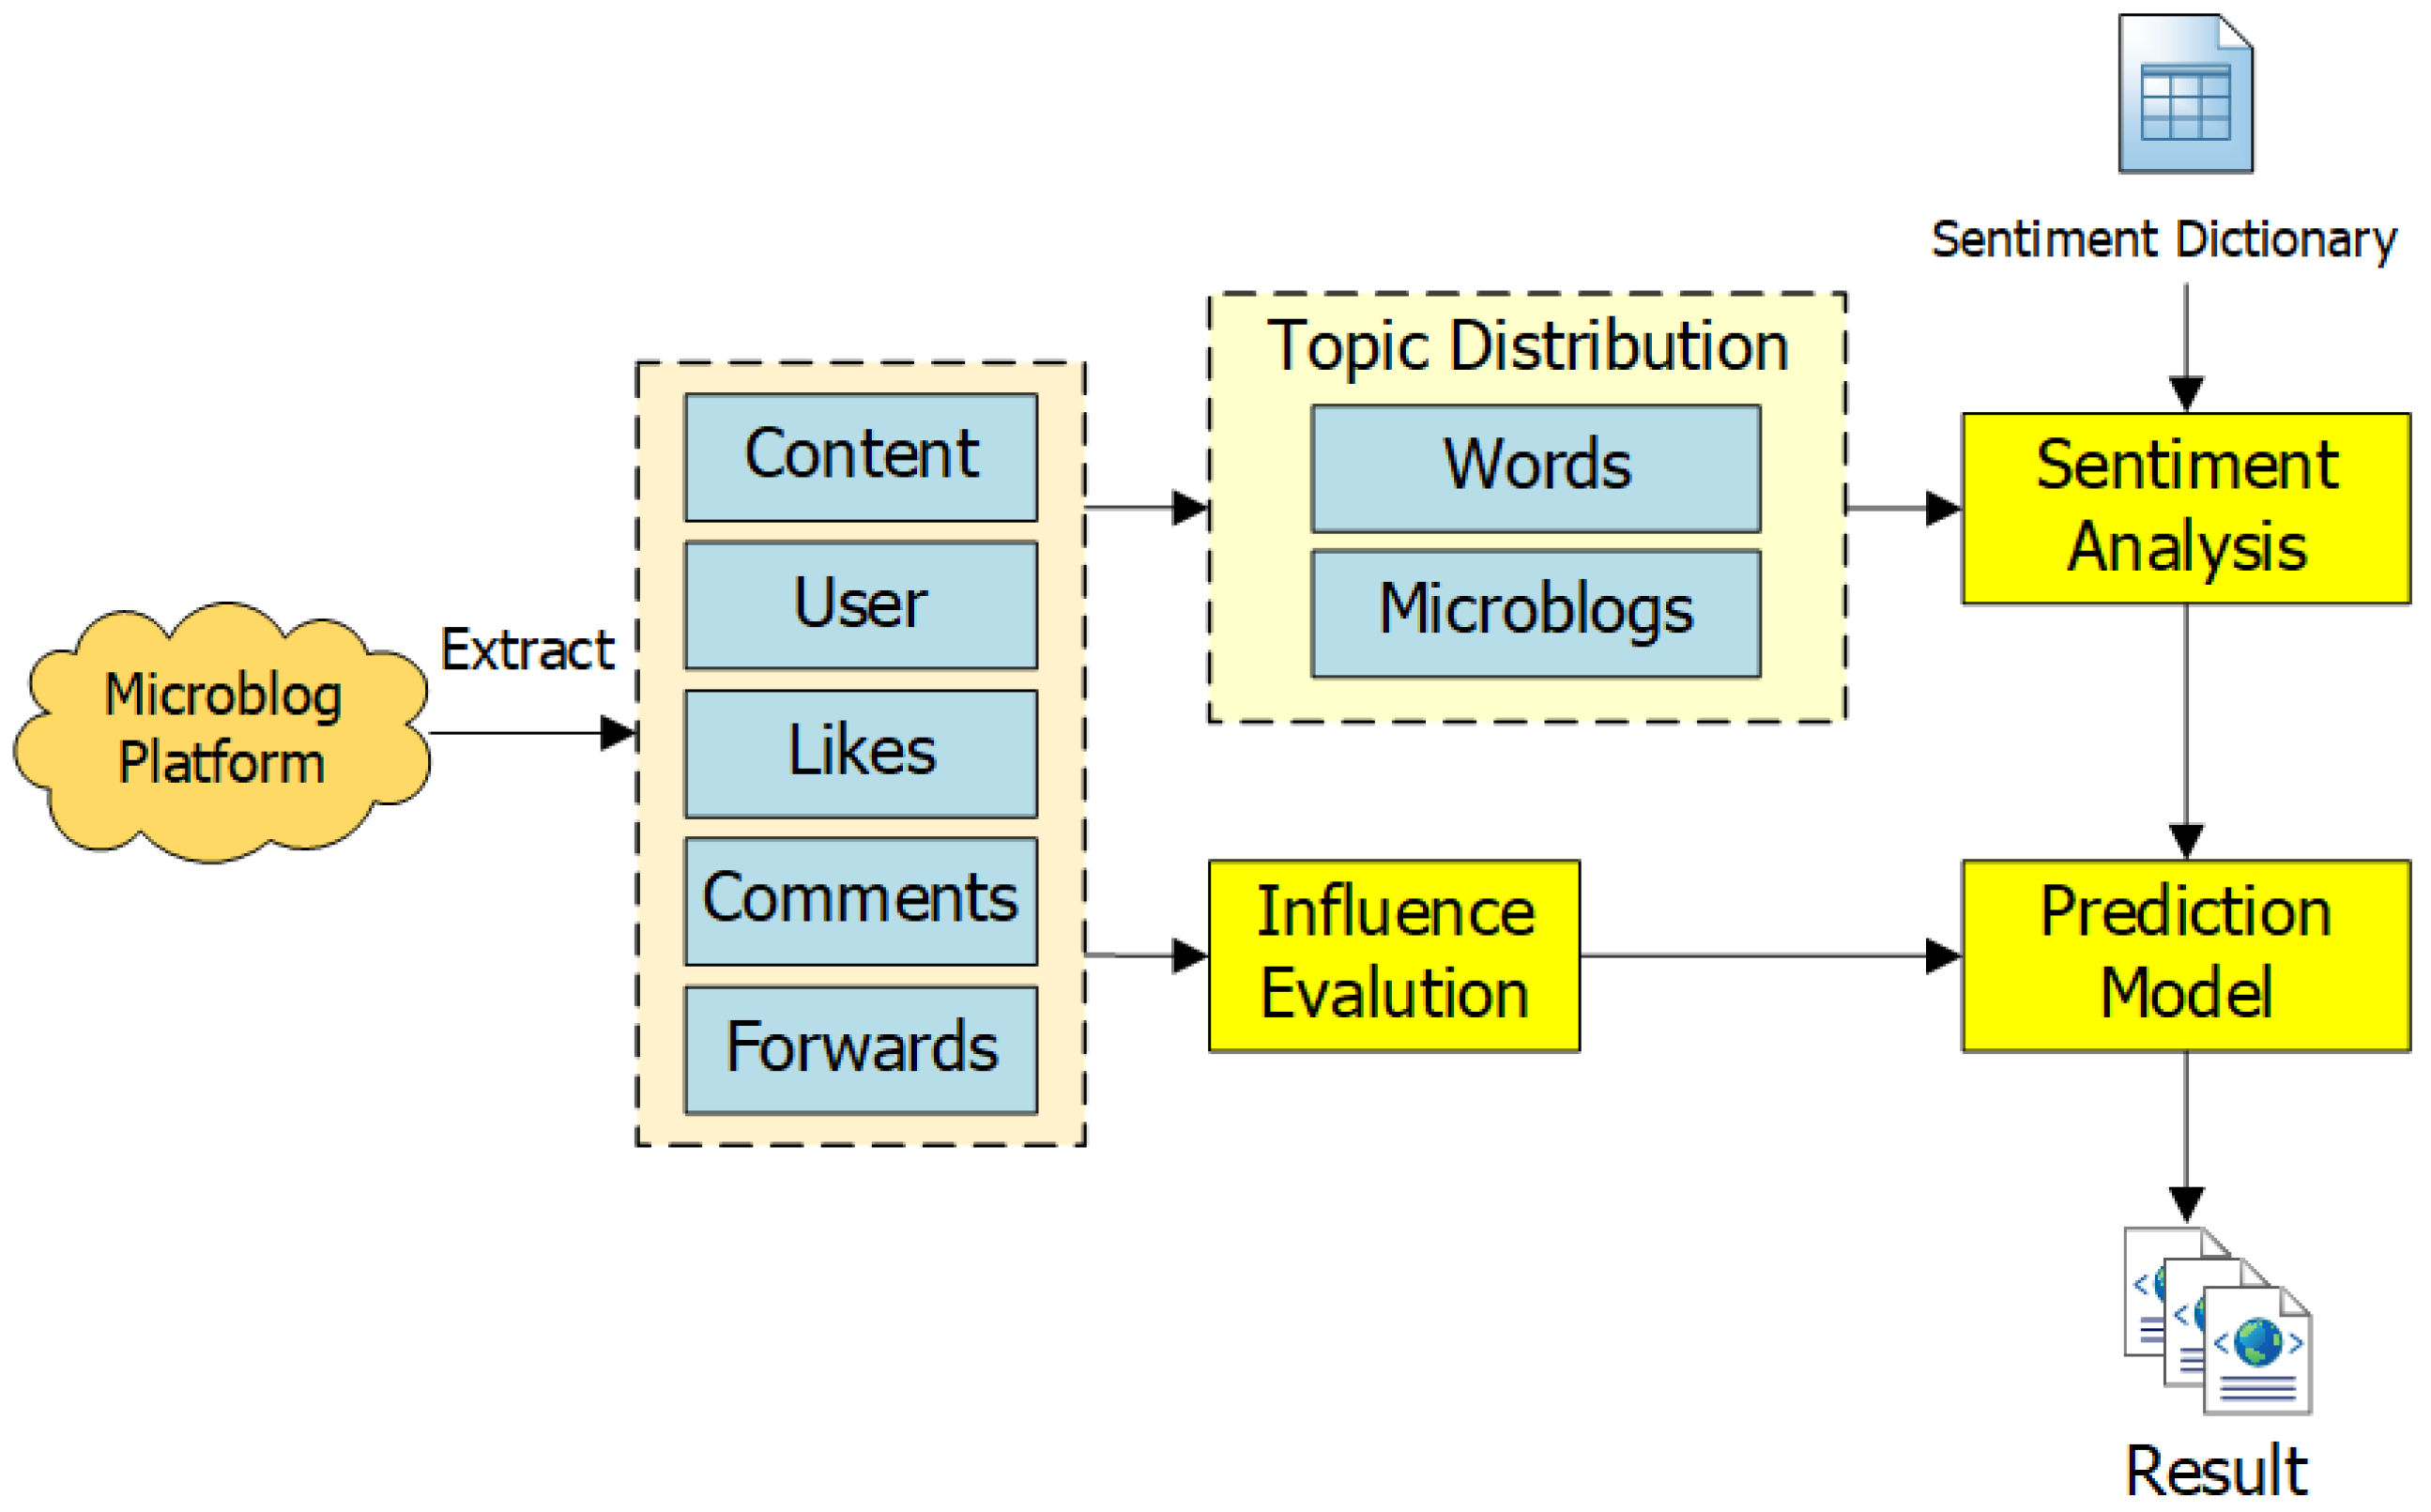
3.1. Architecture
3.2. Sentiment Analysis
| Algorithm 1Sentiment Feature Extraction |
Input: The set of all the related microblogs in one day, M; Output: Sentiment Feature pd Preliminary: is the set of the preprocessed microblogs is the set of all the topics in the LDA Model /* Preprocessing microblogs */
|
3.3. Social Influence
| Algorithm 2Influence Feature Extraction |
Input: The set of all the related microblogs in one day, M; The sentiment of each microblog, Influence of each microblog, Output: Influence Feature,
|
3.4. Prediction Model
4. Experiments
4.1. Settings
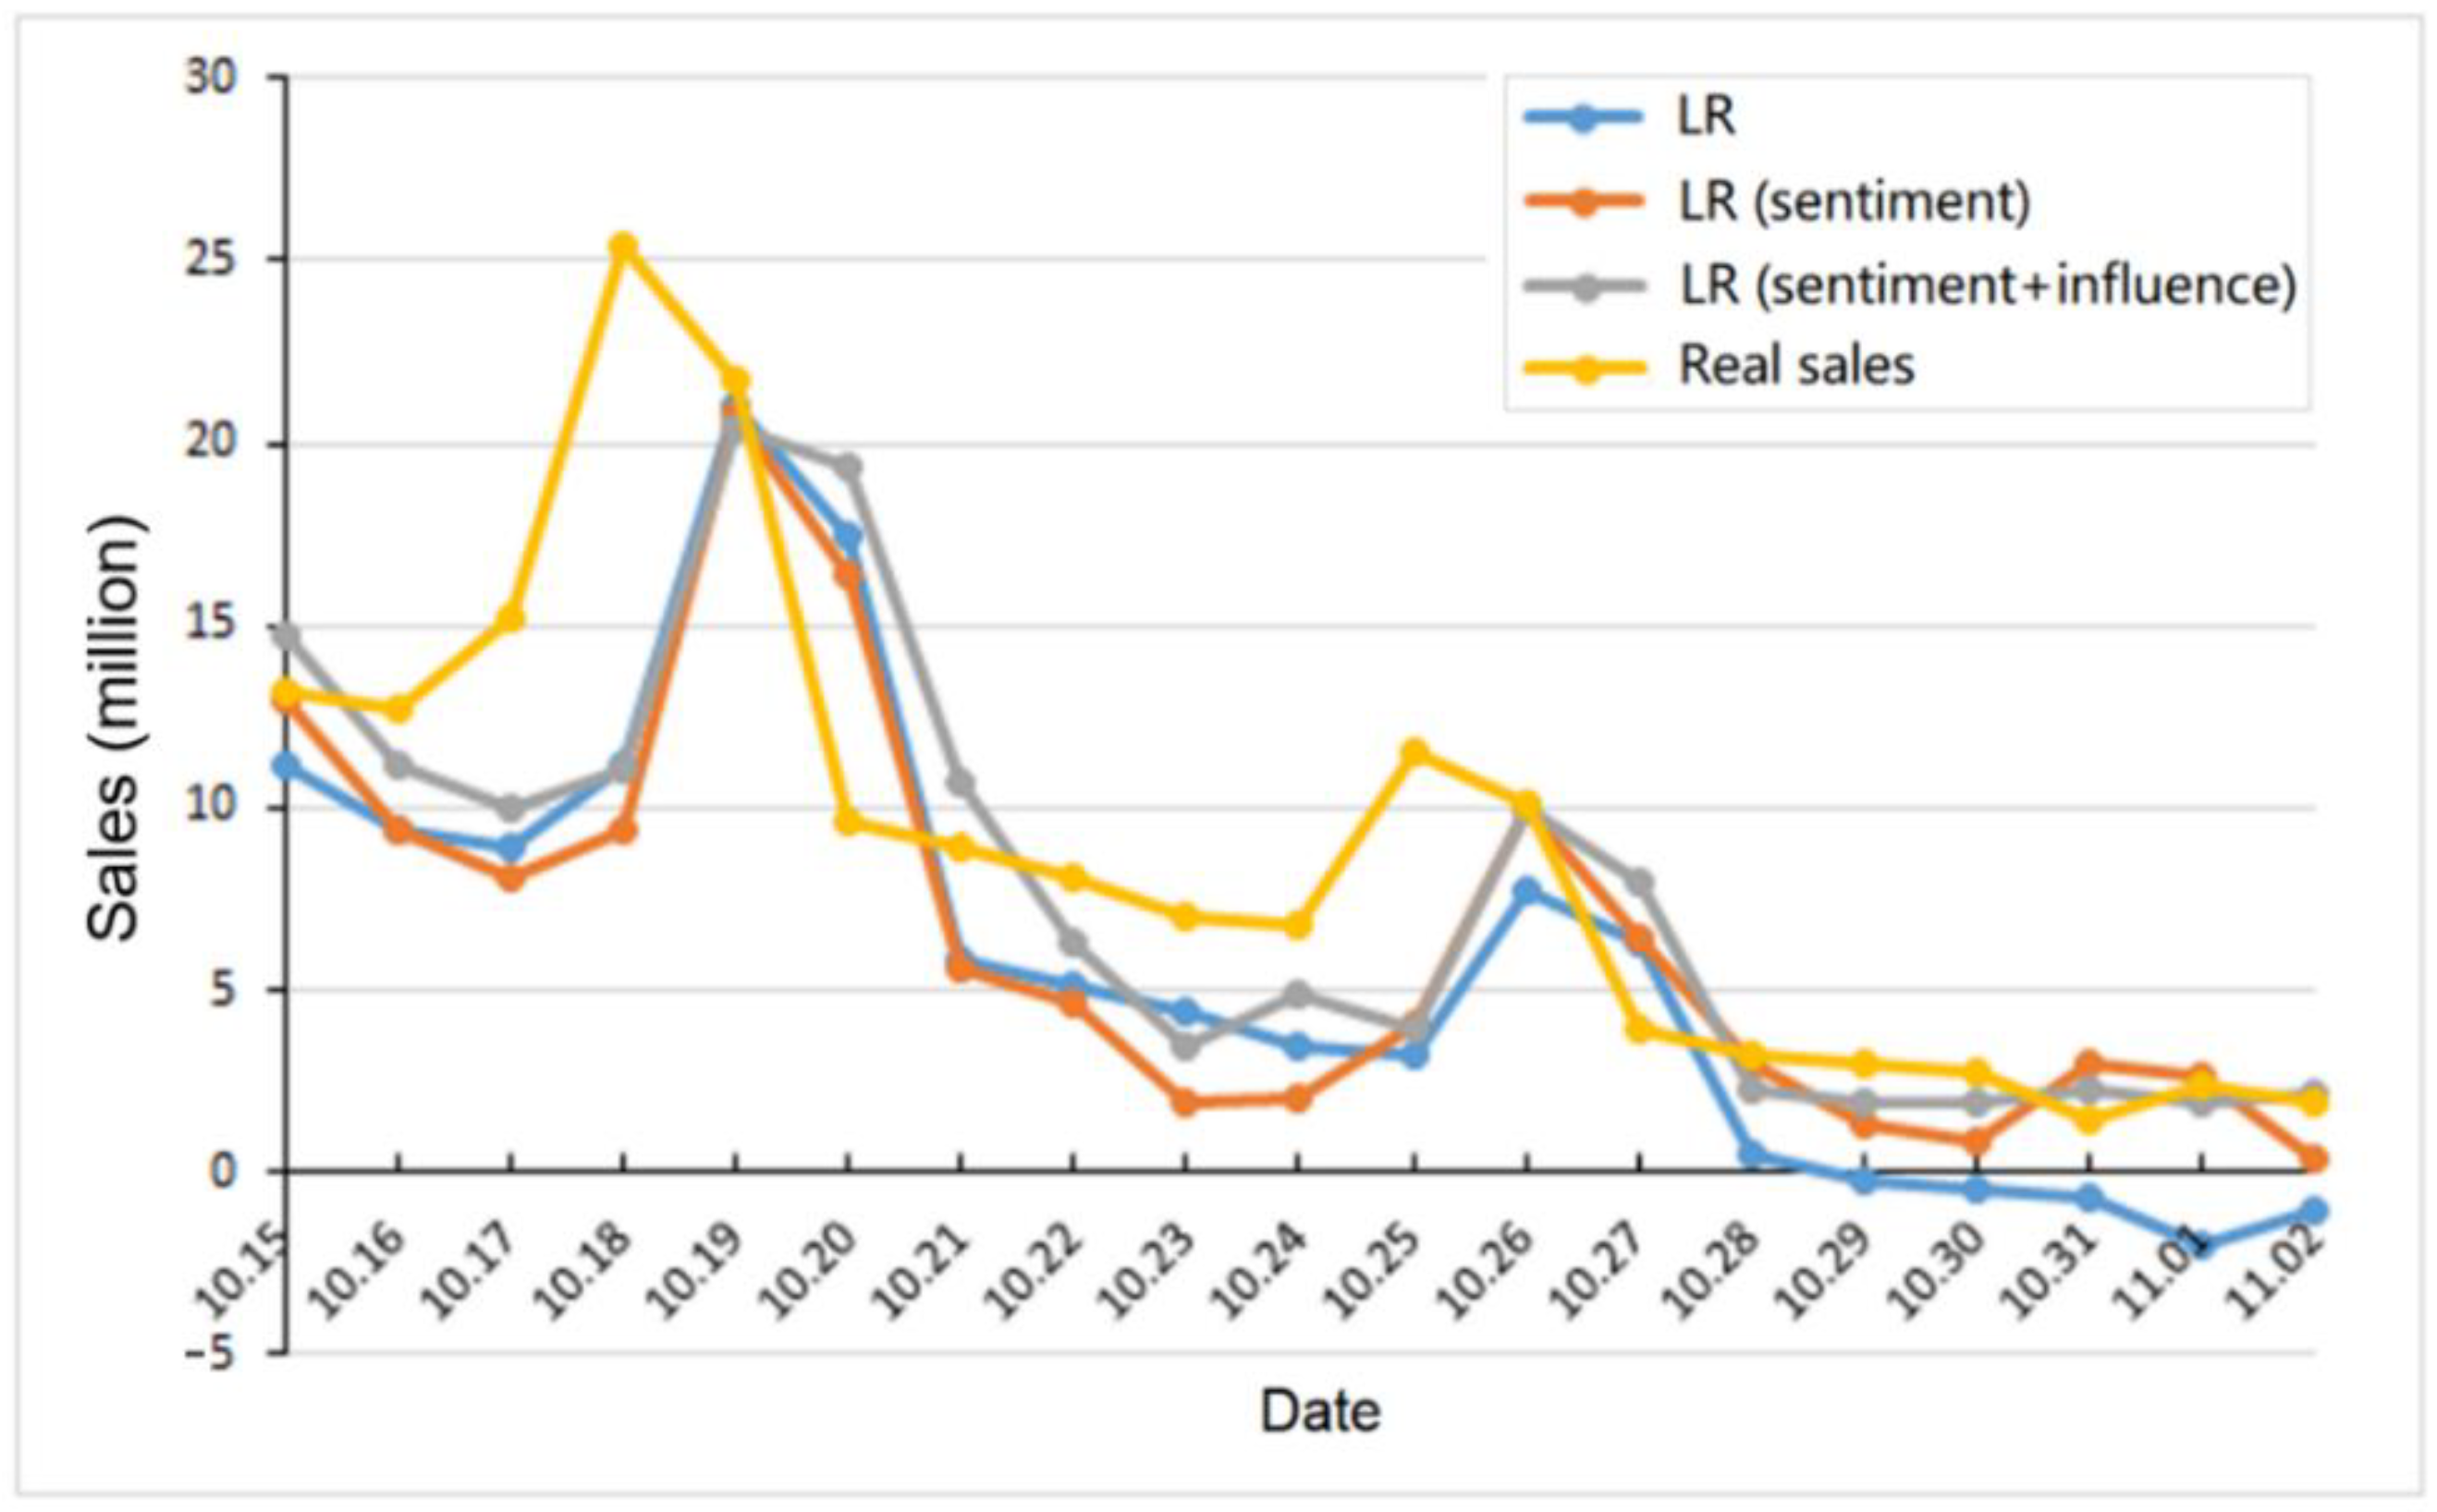
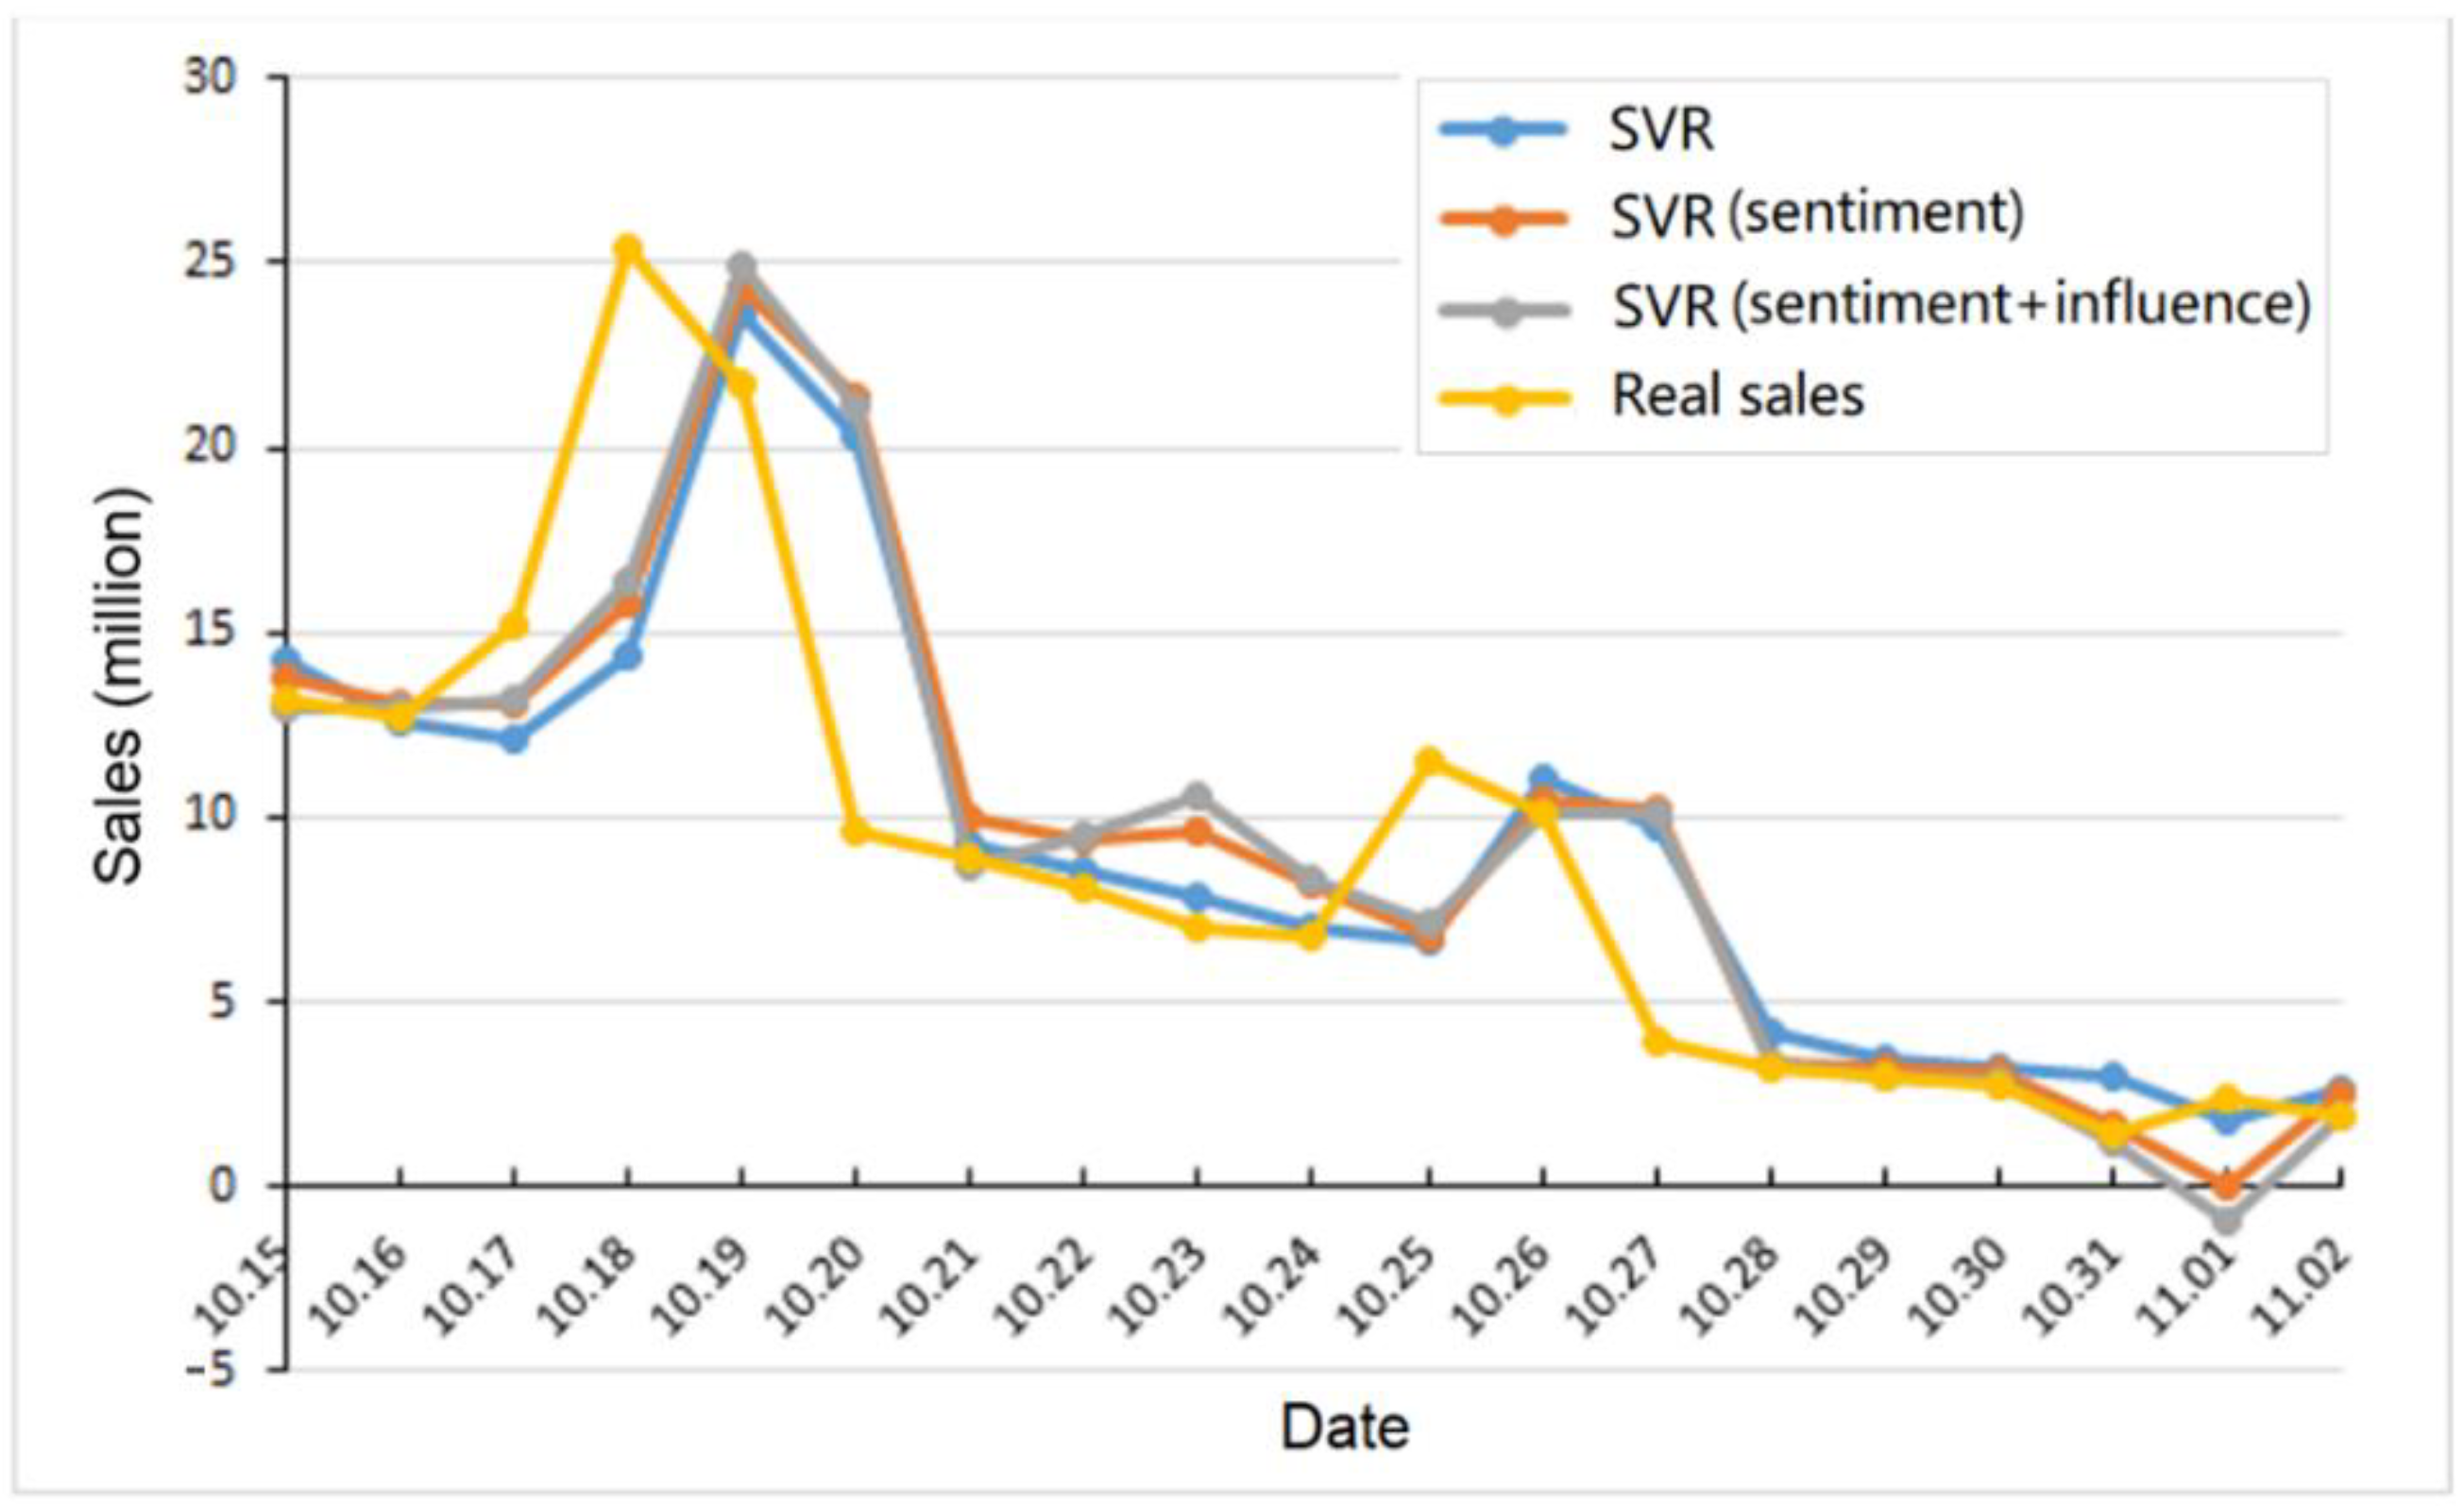
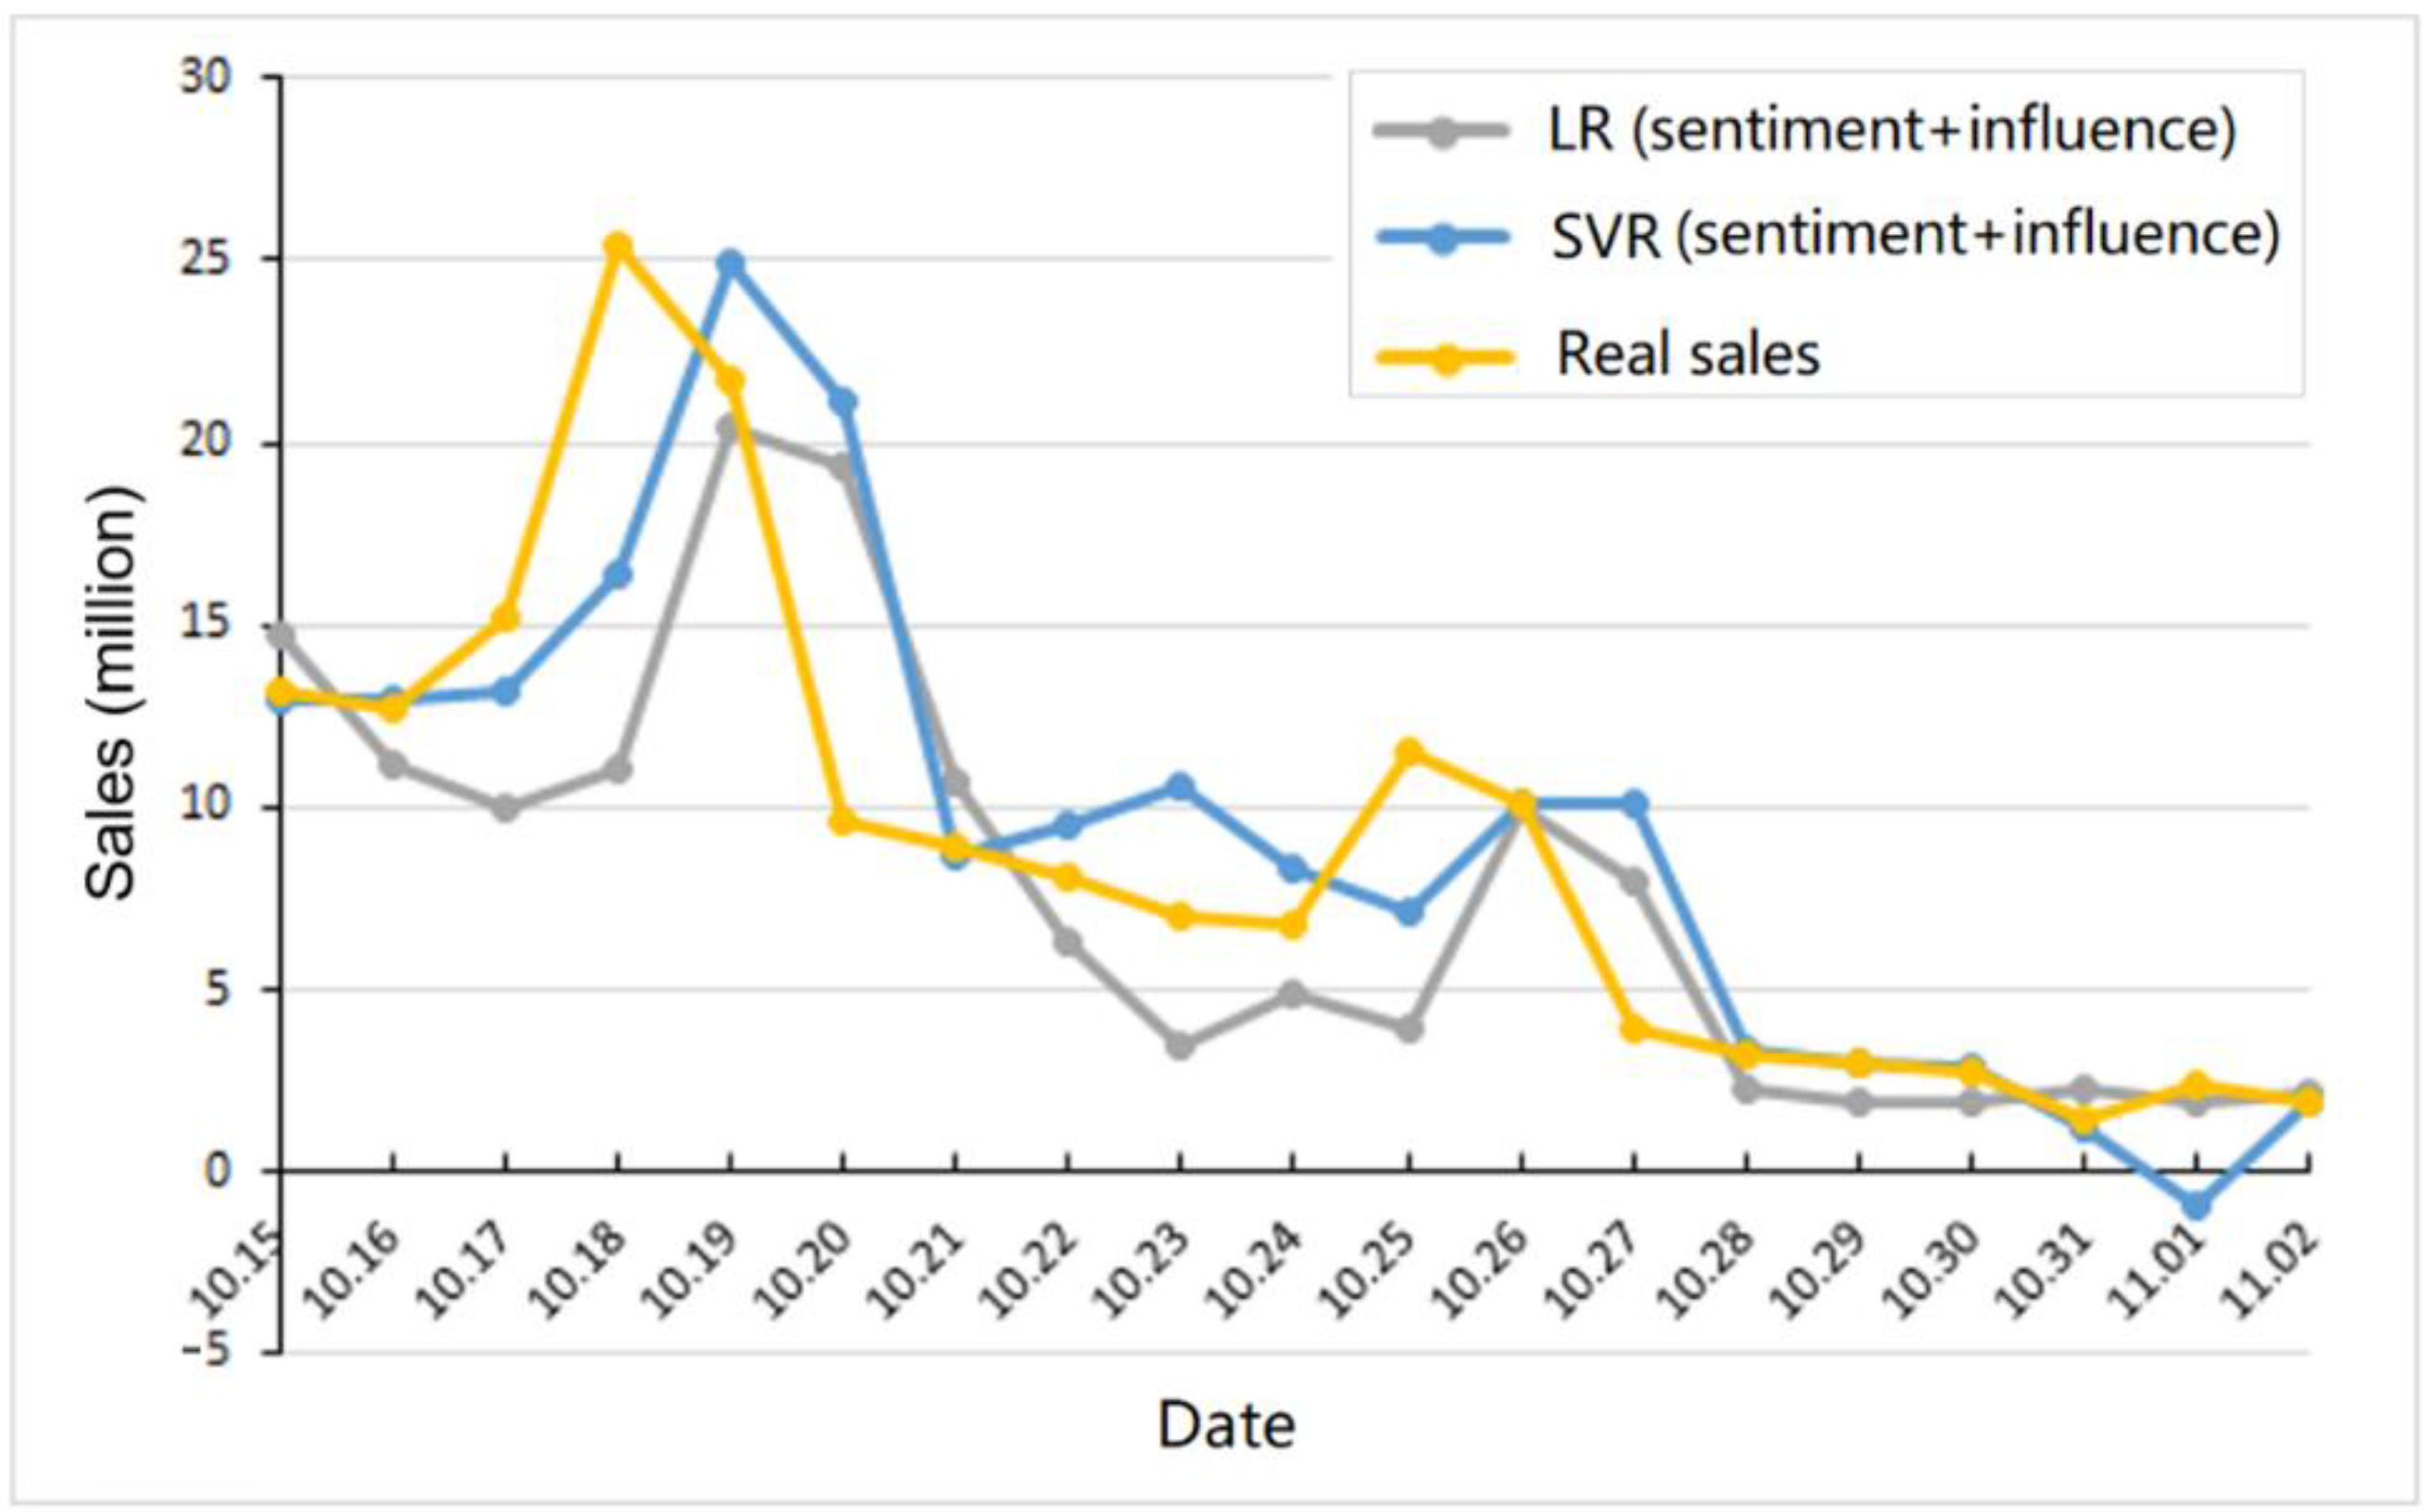
4.2. Results
5. Conclusions and Future Work
Author Contributions
Funding
Institutional Review Board Statement
Informed Consent Statement
Acknowledgments
Conflicts of Interest
References
- Mu, L.; Jin, P.; Zhao, J.; Chen, E. Detecting evolutionary stages of events on social media: A graph-kernel-based approach. Future Gener. Comput. Syst. 2021, 123, 219–232. [Google Scholar] [CrossRef]
- Jin, P.; Mu, L.; Zheng, L.; Zhao, J.; Yue, L. News feature extraction for events on social network platforms. In Proceedings of the 26th International Conference on World Wide Web Companion, Perth, Australia, 3–7 April 2017; pp. 69–78. [Google Scholar]
- Asur, S.; Huberman, B. Predicting the future with social media. In Proceedings of the 2010 IEEE/WIC/ACM International Conference on Web Intelligence and Intelligent Agent Technology, Toronto, ON, Canada, 31 August–3 September 2010; pp. 492–499. [Google Scholar]
- Bi, B.; Tian, Y.; Sismanis, Y.; Balmin, A.; Cho, J. Scalable topic-specific influence analysis on microblogs. In Proceedings of the 7th ACM International Conference on Web Search and Data Mining, New York, NY, USA, 24–28 February 2014; pp. 513–522. [Google Scholar]
- Afyouni, I.; Aghbari, Z.; Razack, R. Multi-feature, multi-modal, and multi-source social event detection: A comprehensive survey. Inf. Fusion 2022, 79, 279–308. [Google Scholar] [CrossRef]
- Mamo, N.; Azzopardi, J.; Layfield, C. An automatic participant detection framework for event tracking on Twitter. Algorithms 2021, 14, 92. [Google Scholar] [CrossRef]
- Kempe, D.; Kleinberg, J.; Tardos, É. Maximizing the spread of influence through a social network. In Proceedings of the Ninth ACM SIGKDD International Conference on Knowledge Discovery and Data Mining, Washington, DC, USA, 24–27 August 2003; pp. 137–146. [Google Scholar]
- Liu, X.; Wu, S.; Liu, C.; Zhang, Y. Social network node influence maximization method combined with degree discount and local node optimization. Soc. Netw. Anal. Min. 2021, 11, 31. [Google Scholar] [CrossRef]
- Xiao, Y.; Li, J.; Zhu, Y.; Li, Q. User behavior prediction of social hotspots based on multimessage interaction and neural network. IEEE Trans. Comput. Soc. Syst. 2020, 7, 536–545. [Google Scholar] [CrossRef]
- Bo, H.; McConville, R.; Hong, J.; Liu, W. Social network influence ranking via embedding network interactions for user recommendation. In Proceedings of the Web Conference 2020, Taipei, Taiwan, 20–24 April 2020; pp. 379–384. [Google Scholar]
- Xu, Y.; Liu, Y.; Zhang, X. Analysis of social network user behaviour and its influence. J. Intell. Fuzzy Syst. 2020, 38, 1159–1171. [Google Scholar] [CrossRef]
- Kong, S.; Feng, L.; Sun, G.; Luo, K. Predicting lifespans of popular tweets in microblog. In Proceedings of the 35th International ACM SIGIR Conference on Research and Development in Information Retrieval, Portland, OR, USA, 12–16 August 2012; pp. 1129–1130. [Google Scholar]
- Choi, H.; Varian, H. Predicting the present with google trends. Econ. Rec. 2012, 88, 2–9. [Google Scholar] [CrossRef]
- Jiang, W.; Wang, Y.; Xiong, Z.; Song, X.; Long, Y.; Cao, W. Detecting urban events by considering long temporal dependency of sentiment strength in geotagged social media data. ISPRS Int. J. Geo-Inf. 2021, 10, 322. [Google Scholar] [CrossRef]
- Gruhl, D.; Guha, R.; Kumar, R.; Novak, J.; Tomkins, A. The predictive power of online chatter. In Proceedings of the Eleventh ACM SIGKDD International Conference on Knowledge Discovery in Data Mining, Chicago, IL, USA, 21–24 August 2005; pp. 78–87. [Google Scholar]
- Du, J.; Xu, H.; Huang, X. Box office prediction based on microblog. Expert Syst. Appl. 2014, 41, 1680–1689. [Google Scholar] [CrossRef]
- Liu, Y.; Huang, X.; An, A.; Yu, X. ARSA: A sentiment-aware model for predicting sales performance using blogs. In Proceedings of the 30th Annual International ACM SIGIR Conference on Research and Development in Information Retrieval, Amsterdam, the Netherlands, 23–27 July 2007; pp. 607–614. [Google Scholar]
- Skoric, M.; Poor, N.; Achananuparp, P.; Lim, E.-P.; Jiang, J. Tweets and votes: A study of the 2011 Singapore general election. In Proceedings of the 45th Hawaii International Conference on System Sciences, Maui, HI, USA, 4–7 January 2012; pp. 2583–2591. [Google Scholar]
- Salehan, M.; Kim, D. An investigation of predictors of information diffusion in social media: Evidence from sentiment mining of Twitter messages. In Proceedings of the 53rd Hawaii International Conference on System Sciences, Wailea, HI, USA, 7–10 January 2020; pp. 1–10. [Google Scholar]
- Song, G.; Huang, D. A sentiment-aware contextual model for real-time disaster prediction using Twitter data. Future Internet 2021, 13, 163. [Google Scholar] [CrossRef]
- Sun, T.; Wang, J.; Zhang, P.; Cao, Y.; Liu, B.; Wang, D. Predicting stock price returns using microblog sentiment for Chinese stock market. In Proceedings of the 2017 3rd International Conference on Big Data Computing and Communications (BIGCOM), Chengdu, China, 10–11 August 2017; pp. 87–96. [Google Scholar]
- Okimoto, Y.; Hosokawa, Y.; Zhang, J.; Li, L. Japanese election prediction based on sentiment analysis of Twitter replies to candidates. In Proceedings of the 2021 International Conference on Asian Language Processing (IALP), Singapore, 11–13 December 2021; pp. 322–327. [Google Scholar]
- Jane, G.L.; Hari, S. Crime Prediction Using Twitter Data. Int. J. e-Collab. 2021, 17, 62–74. [Google Scholar]
- Shahzad, M.; Bukhari, L.; Khan, T.; Islam, S.; Hossain, M.; Kwak, K. BPTE: Bitcoin price prediction and trend examination using Twitter sentiment analysis. In Proceedings of the 2021 International Conference on Information and Communication Technology Convergence (ICTC), Jeju Island, Korea, 20–22 October 2021; pp. 119–122. [Google Scholar]
- Pai, P.; Liu, C. Predicting vehicle sales by sentiment analysis of Twitter data and stock market values. IEEE Access 2018, 6, 57655–57662. [Google Scholar] [CrossRef]
- Zheng, L.; Jin, P.; Zhao, J.; Yue, L. A fine-grained approach for extracting events on microblogs. In Proceedings of the International Conference on Database and Expert Systems Applications, Munich, Germany, 9–14 September 2014; pp. 275–283. [Google Scholar]
- Zou, X.; Yang, J.; Zhang, W.; Han, H. Collaborative community-specific microblog sentiment analysis via multi-task learning. Expert Syst. Appl. 2021, 169, 114322. [Google Scholar] [CrossRef]
- Yu, H.; Lu, J.; Zhang, G. An online robust support vector regression for data streams. IEEE Trans. Knowl. Data Eng. 2022, 34, 150–163. [Google Scholar] [CrossRef]
- Sun, Q.; Tan, Z.; Zhou, X. Workload prediction of cloud computing based on SVM and BP neural networks. J. Intell. Fuzzy Syst. 2020, 39, 2861–2867. [Google Scholar] [CrossRef]
- Türkbayragí, M.; Dogu, E.; Albayrak, Y. Artificial intelligence based prediction models: Sales forecasting application in automotive aftermarket. J. Intell. Fuzzy Syst. 2022, 42, 213–225. [Google Scholar] [CrossRef]
- Khodabakhsh, M.; Kahani, M.; Bagheri, E. Predicting future personal life events on twitter via recurrent neural networks. J. Intell. Inf. Syst. 2020, 54, 101–127. [Google Scholar] [CrossRef]
- Chang, Y.; Ku, C.; Nguyen, D. Predicting aspect-based sentiment using deep learning and information visualization: The impact of COVID-19 on the airline industry. Inf. Manag. 2022, 59, 103587. [Google Scholar] [CrossRef]
- Zheng, L.; Jin, P.; Zhao, J.; Yue, L. Multi-dimensional sentiment analysis for large-scale e-commerce reviews. In Proceedings of the International Conference on Database and Expert Systems Applications, Munich, Germany, 9–14 September 2014; pp. 449–463. [Google Scholar]
- Fiok, K.; Karwowski, W.; Gutiérrez, E.; Wilamowski, M. Analysis of sentiment in tweets addressed to a single domain-specific Twitter account: Comparison of model performance and explainability of predictions. Expert Syst. Appl. 2021, 186, 115771. [Google Scholar] [CrossRef]
- AlRubaian, M.; Al-Qurishi, M.; Hassan, M.; Alamri, A. A credibility analysis system for assessing information on Twitter. IEEE Trans. Dependable Secur. Comput. 2018, 15, 661–674. [Google Scholar] [CrossRef]
- Castillo, C.; Mendoza, M.; Poblete, B. Information credibility on twitter. In Proceedings of the 20th International Conference on World Wide Web, Hyderabad, India, 28 March–1 April 2011; pp. 675–684. [Google Scholar]

| Notation | Description |
|---|---|
| m | A document, which refers to a microblog in this paper. |
| n | A word in a microblog |
| A topic in a microblog | |
| N | The word count of a document |
| . | |
| The sentiment polarity of the word n. | |
| The sentiment polarity of the microblog m. | |
| d | A day |
| The proportional difference between positive and negative sentiment within the day d. | |
| The influence of the microblog m. | |
| The normalized influence of the microblog m. | |
| The social influence of the microblog m. | |
| The social influence of the microblog within the day d. |
| Movie ID | Movie Title | Start Time | End Time | Days on Show |
|---|---|---|---|---|
| #1 | Breakup Buddies | 2014-09-30 | 2014-11-02 | 34 |
| #2 | Interstellar | 2014-11-12 | 2014-12-12 | 31 |
| Breakup Buddies | Interstellar | |
|---|---|---|
| #Original microblogs | 30,484 | 30,459 |
| #Likes | 57,323 | 73,453 |
| #Comments | 59,956 | 78,167 |
| #Forwards | 48,483 | 91,039 |
| #Micorblogs liked | 10,540 | 12,159 |
| #Microblogs commented | 9395 | 11,456 |
| #Microblogs forwarded | 2273 | 3420 |
| #Most likes | 6142 | 6336 |
| #Most comments | 3411 | 3782 |
| #Most forwards | 16,264 | 17,282 |
| Breakup Buddies | Interstellar | |
|---|---|---|
| The count of users | 87,787 | 144,221 |
| The highest fans number of users | 13,640,601 | 33,332,635 |
| The users with the most followers | 28 | 47 |
| Prediction Model | Features | Breakup Buddies | Interstellar |
|---|---|---|---|
| LR | sentiment (weighted) | 0.471416 | 2.636955 |
| sentiment (not weighted) | 0.543178 | 2.827116 | |
| SVR | sentiment (weighted) | 0.347621 | 0.817183 |
| sentiment (not weighted) | 0.363807 | 0.837459 |
| Prediction Model | Features | Breakup Buddies | Interstellar |
|---|---|---|---|
| LR | sentiment (weighted) | 0.471416 | 2.636955 |
| sentiment (weighted) + influence | 0.365470 | 1.128859 | |
| SVR | sentiment (weighted) | 0.347621 | 0.817183 |
| sentiment (weighted) + influence | 0.335603 | 0.694272 |
Publisher’s Note: MDPI stays neutral with regard to jurisdictional claims in published maps and institutional affiliations. |
© 2022 by the authors. Licensee MDPI, Basel, Switzerland. This article is an open access article distributed under the terms and conditions of the Creative Commons Attribution (CC BY) license (https://creativecommons.org/licenses/by/4.0/).
Share and Cite
Zhao, J.; Xiong, F.; Jin, P. Enhancing Short-Term Sales Prediction with Microblogs: A Case Study of the Movie Box Office. Future Internet 2022, 14, 141. https://doi.org/10.3390/fi14050141
Zhao J, Xiong F, Jin P. Enhancing Short-Term Sales Prediction with Microblogs: A Case Study of the Movie Box Office. Future Internet. 2022; 14(5):141. https://doi.org/10.3390/fi14050141
Chicago/Turabian StyleZhao, Jie, Fangwei Xiong, and Peiquan Jin. 2022. "Enhancing Short-Term Sales Prediction with Microblogs: A Case Study of the Movie Box Office" Future Internet 14, no. 5: 141. https://doi.org/10.3390/fi14050141
APA StyleZhao, J., Xiong, F., & Jin, P. (2022). Enhancing Short-Term Sales Prediction with Microblogs: A Case Study of the Movie Box Office. Future Internet, 14(5), 141. https://doi.org/10.3390/fi14050141