Abstract
Indoor localization systems are used to locate mobile devices inside buildings where traditional solutions, such as the Global Navigation Satellite Systems (GNSS), do not work well due to the lack of direct visibility to the satellites. Fingerprinting is one of the most known solutions for indoor localization. It is based on the Received Signal Strength (RSS) of packets transmitted among mobile devices and anchor nodes. However, RSS values are known to be unstable and noisy due to obstacles and the dynamicity of the scenarios, causing inaccuracies in the position estimations. This instability and noise often cause the system to indicate a location that it is not quite sure is correct, although it is the most likely based on the calculations. This property of RSS can cause algorithms to return a localization with a low confidence level. If we could choose more reliable results, we would have an overall result with better quality. Thus, in our solution, we created a checking phase of the confidence level of the localization result. For this, we use the prediction probability provided by KNN and the novelty detection to discard classifications that are not very reliable and often wrong. In this work, we propose LocFiND (Localization using Fingerprinting and Novelty Detection), a fingerprint-based solution that uses prediction probability and novelty detection to evaluate the confidence of the estimated positions and mitigate inaccuracies caused by RSS in the localization phase. We implemented our solution in a real-world, large-scale school area using Bluetooth-based devices. Our performance evaluation shows considerable improvement in the localization accuracy and stability while discarding only a few, low confidence estimations.
1. Introduction
The problem of localizing mobile devices or people has seen increasing attention in recent decades, especially in robotics [1], sensor networks [2], and even vehicular networks [3]. Smartphones and other wearable devices can use the Global Navigation Satellite System (GNSS), which includes the Global Positioning System (GPS), to obtain a location outdoors. However, GNSS data can be problematic indoors due to the poor reception of satellite signals [4]. Thus, several indoor localization systems have been proposed to solve this problem, all of them with different hardware requirements and performances [5,6,7].
Many wireless networking technologies have been used in localization systems. Some of these technologies include WiFi, Bluetooth, Radio Frequency Identification (RFID), Ultra Wide Band (UWB), and cellular networks [8]. Allied to these technologies, many techniques have been proposed for the estimation of distances such as Time of Arrival (ToA), Time Difference of Arrival (TDoA), Received Signal Strength (RSS), and Angle of Arrival (AoA) [9]. Even with these various technologies, there is no single, definitive solution due to the many peculiarities of the environments (e.g., obstacles, layouts), hardware (e.g., processing and energy limitations), and requirements (e.g., accuracy, real-time data) [8].
One technology that has been employed is the use of Bluetooth Low Energy (BLE) beacons which have the following advantages: small size, lightweight, low cost, power-saving and are widely supported by smart devices [10]. BLE devices can be operated at multiple transmission power levels with the RSS more stable at a high transmission power level [11,12], but it has important practical implications for energy efficiency, resulting in a trade-off between location performance and battery lifetime [13].
RSS is one of the most popular and available information used by localization systems. One of the reasons for its widespread adoption is that it does not require extra equipment and can be found on most devices equipped with wireless communications [14]. The RSS is a measure of the received signal strength of the packets. A common technique for indoor localization systems is fingerprinting, which uses RSS data to construct radio maps, also known as fingerprint databases. In the offline phase, RSS maps are created based on the RSS values obtained at the different points of the area where we want to have the localization service. Then, a classifier uses this information to estimate the position of the nodes in the online phase. A commonly used classifier for this purpose is the k-Nearest Neighbors (kNN), as used by RADAR [15,16].
The main idea of the fingerprinting technique is based on the assumption that each spatial location indoors can be identified by a single, mostly unique, set of measurable RSSs [4]. However, since the RSS is very susceptible to noise in the environment, RSS often can cause errors in the location estimations. For instance, our main application in this paper aims at providing location information for small, battery-powered devices to be used by students in schools and allowing several interesting applications such as automatic student attendance record-keeping, entry and exit control, and so on. However, in the first versions of our localization system, the instability of the RSS resulted in the students “jumping” from room to room, even though they were static.
Several techniques are proposed in the literature to deal with the RSS noise [17,18,19,20,21,22]. Most of these solutions focus on averaging RSS values or making other transformations in the fingerprint database. However, this noise can affect not only the training data but also the data received in the online phase especially when considering that, in most cases, training is done in an empty building while the online phase occurs in a more crowded, dynamic scenario. Unfortunately, averaging several RSS values is not an option for the online phase of our application since the mobile devices are extremely power-limited and it is not possible to change or recharge their batteries. Thus, we need a solution that also considers the impact of this RSS variation in the online phase without requiring sending additional data packets.
The main limitation of the RSS-based localization systems is the RSS fluctuation, which can induce several errors even when using machine learning techniques. This fluctuation can result in classifications/positions with low reliability. Thus, an intuitive step is to detect and discard these classifications to get more reliable results with better quality. Thus, in our proposed solution, we created an additional step called “Evaluation of Confidence”. For this, we use the prediction probability provided by KNN and the Novelty Detection technique to detect and discard classifications that are not considered reliable and, often, have higher errors. This is done using prediction probability, which is an additional step on the KNN technique based on the distances of the k nearest neighbors. Additionally, a second filter was created that uses the concept of “novelty” which uses machine learning techniques to categorize a new classification as “normal” (belongs to that class) or “novelty” (does not belong to that class).
In this work, we propose a new localization system called LocFiND (Localization using Fingerprinting and Novelty Detection), a fingerprint-based solution that uses techniques of novelty detection to evaluate the confidence of the estimated positions in the online phase allowing the system to discard some of the position estimations that would have unacceptable higher errors due to a noisy RSS data that suffered some unexpected degradation from the environment. Three confidence evaluation techniques have been proposed, one simpler and one more rigid, but they discard many positions that can be useful. To try to reduce these losses, a hybrid approach that recovers some of these discarded locations has been proposed as well.
For our application and performance evaluation, we used Bluetooth-based anchor nodes and smartwatch-like mobile devices to be used by the students. We implemented our solution in a large-scale, real-world school area and compared its performance to the traditional kNN fingerprint-based solution. Our results show that our solution was able to improve both the localization accuracy and the number of position fixes while discarding noisy RSS data.
The main contributions of this paper are as follows:
- The use of novelty detection techniques to evaluate the confidence of the predictions.
- Considering that we have noise in the localization phase and solving this problem without requiring the need for sending extra data packets, which would consume more energy of the mobile devices.
- Implementing and evaluating the performance of the proposed solution in a real-world, large-scale school application.
This paper is organized as follows. Section 2 shows our related work. Section 3 describes our proposed LocFiND solution. In Section 4, we present our methodology and the results of our performance evaluation. In Section 5, we discuss the application of our solution. Finally, Section 6 shows our conclusions and future work.
2. Related Work
In RADAR [15,16], one of the first localization systems using RSS and fingerprinting, RSS readings are taken at different points in the place where the localization is to be carried out. Each reading contains the RSS values received from the WiFi routers. Such information is recorded in a fingerprint database. After this training, when a user requests your location, the RSS values of the request are compared with those observed in the training phase using the kNN classifier, which will return the most likely position from which the request was sent.
In the Horus System [23,24], a joint grouping technique is proposed for the location estimation using a probabilistic method. In this system, each possible coordinate that the candidate may be in is considered a class or category. To minimize the distance error, the location is chosen where its probability is the highest. Increasing the number of samples at each sampling site improves accuracy, as this improves the estimation of the mean and standard deviation of the Gaussian distribution used. Similar probabilistic systems have also been proposed in other works [25,26,27]. A training-based method for determining the localization using classifiers based on neural networks is proposed in [28]. In a more broad approach, the authors in [29] compared the various classifiers mentioned: neural networks, kNN, and probabilistic methods. Their results show that all techniques performed well in different scenarios.
In [30], several experiments were carried out to show that localization techniques for indoor environments based on training (fingerprinting) perform better than the traditional ones based on trilateration/multilateration. The main reason given was the multipath phenomenon, in which the signal behavior is affected by the various obstacles encountered in such scenarios. However, an observation raised in this work is that the training-based localization techniques suffer degradations in the location accuracy in dynamic environments, where the properties of the place can change with time (e.g., rearranging cabinets, tables, partitions).
Due to multipath, shadow fading, and some hardware restrictions, outliers in RSS measurements are not uncommon. If the measurement is a outiler, either in the offline or online phase, the resulting position estimate is likely to be the wrong [31]. In [19], an outlier detection technique called iF_Ensemble was developed. The proposed solution is able to analyze the quality of the RSS using a combination of supervised, unsupervised, and ensemble machine learning methods. In this solution, the isolation forest (iForest) is used as an unsupervised learning method. The supervised learning method includes support vector machine (SVM), kNN, and random forest (RF) classifiers.
In [17], the authors propose a novel multiple-bandwidth generalized regression neural network (GRNN) with the outlier filter indoor positioning approach, named GROF, to improve the positioning accuracy and robustness. It uses a new type of multiple bandwidth kernel architecture to achieve more flexible regression performance than the traditional GRNN. In addition, an outlier filtering scheme is used to improve the system’s robustness against RSS fluctuation caused by the dynamic environment.
A Probabilistic Threshold k-Nearest-Neighbor Query (T-k-PNN) is proposed in [32]. This solution returns sets of k results with probabilities higher than some threshold T. The result is refined using filters to remove results with the aid of a spatial index and probabilistic candidate selection.
In [33], a probabilistic threshold kNN (PTkNN) query is used. It uses a combination of three techniques for the efficient processing of PTkNN queries. Minimal indoor walking distance (MIWD) metric to prune objects that are too far away, efficient probability estimation to prune unqualified candidates, and an efficient probability evaluation for the remaining candidate and k-subsets. Similarly, in [34], it is used the probabilistic KNN (pkNN) algorithm that uses the probability of RSS in the radio-map as a weighting to calculate the Euclidean distance. This solution also filters the RSS values whose probability is less than 3%.
In [35], it was proposed an iBeacon-based method by integrating a trilateration algorithm and a fingerprinting method that uses weight matrix to differentiate the contribution of beacons in various distances and adopt cosine similarity to reveal the consistent trend between two RSSI vectors to reduce effects of RSS fluctuations. In the second phase, the pedestrian trajectories are segmented and applied a Kalman filter (KF) to improve the locations derived by the pedestrian dead reckoning (PDR). The last step uses another KF to derive locations in each segmented path by fusing the BLE-based positioning and the PDR. The positioning accuracy of the iBeacon-based method is RMSE 2.75 m. When the smartphone is held steadily, the fusion positioning tests result in RMSE of 2.39 and 2.22 m for the two routes.
Ref. [36] has evaluated BLE localization performances based on RSS fingerprinting. They presented a Ray-Launching based application to emulate BLE radio frequency (RF) signal propagation in an indoor office environment. An appropriate measurement workplace and its setup are proposed to measure RSS values and are used to create an RSS-fingerprinting map. Accuracy of position determination is computed and evaluated. The results show that the performance of the BLE technology, for indoor localization purposes, highly depends on both the number of considered BLE nodes and the applied evaluation method (e.g., number of considered sectors).
In [37], it is used BLE with multiple anchors and multiple radio channels to improve the reliability of power measurements. The accuracy–complexity trade-off affects the four most popular supervised learning techniques (k-Nearest Neighbors, Support Vector Machines, Random Forest, and Artificial Neural Network). They were evaluated in one and two-dimensional environments with four static anchors. The best result is obtained by the Random Forest with a classification accuracy of over 99%.
Another pedestrian dead reckoning (PDR) localization technique is proposed in [38]. The authors used the smartphone sensors to estimate a pedestrian’s location with a lower installation cost. Nowadays, smartphones have multiple inertial sensors (e.g., accelerometer, gyroscope, and magnetometer) that can be used for mobility and localization sensing [39].
In [40], using a magnetometer, a magnetic field strength fingerprinting approach is used to localize a pedestrian indoor. Accelerometer and gyroscope sensors are also used to find the pedestrian’s traveled distance and heading estimation combined with the patterns of magnetic field strength to formulate a fingerprint database. Experiments were conducted with many models of smartphones and they were able to localize a pedestrian within 1.21 m at 50% and within 1.93 m at 75%, irrespective of the device used for localization. The performance of the proposed approach is compared to the K-Nearest Neighbor (KNN).
The geomagnetic field localization has a limit because smartphones have embedded magnetic sensors from different manufacturers. In [41], the authors propose the use of geomagnetic field data collected from multiple smartphones to make the geomagnetic field pattern (MP) database. The evaluation using four different smartphones demonstrates that using a database with multiple smartphones has the same performance when compared to using a single smartphone. Moreover, the performance comparison with previous research indicates that the overall performance of smartphones is improved.
In all of these works, there is no evaluation of the quality of the returned positions. Thus, even a result which the system is not quite sure is correct is still returned by the system. This can lead to higher localization errors and, in a real-world application, can cause the position of the user to jump between different rooms even when the user is static. Our proposed solution tries to solve this problem by carefully analyzing the quality of the positioning before passing it to the application.
In these works, even though they try to improve accuracy using probabilities and other filters, most of them are based on refining the training database and/or combining information from several samples for statistical analysis, making them harder to be used by energy-constrained mobile devices. In this work, we are proposing a different approach by combining a novelty detection system with the prediction probability to filter out these unreliable position estimations without discarding correct, useful information from mobile devices.
3. LocFiND—Localization Using Fingerprinting and Novelty Detection
In this section, we present our proposed solution called LocFiND (Localization using Fingerprinting and Novelty Detection). The main objective of our solution is to provide the location of mobile devices in indoor environments for different location-based services. In this type of environment, it is expected that the traditional solutions (e.g., GNSS, GPS) will not work very well [42].
We propose three variations of our solution: a naive one that uses only the prediction probability and two extended versions that use novelty detection to refine the results.
In these applications, it is common for the person to be located to carry some type of device, that can be used to estimate your location. Another requirement of our application is that this mobile device needs to be low-profile, i.e., each person carries a very small, battery-powered device. To enable localization, our mobile nodes send information to Bluetooth-based anchor nodes so that there is lower interference with the wireless data network at the location.
As in other solutions, LocFiND can be divided into two distinct phases, as depicted in Figure 1. In the first, training phase, samples for training the algorithm are gathered. The obtained fingerprint database follows the format as described,
where is the collected packet set i, is the RSS of packet i received at anchor node n, and is the class (or label) that can be mapped to the location at which the packet was sent. All of these data will be used by the supervised training algorithm to generate a model.
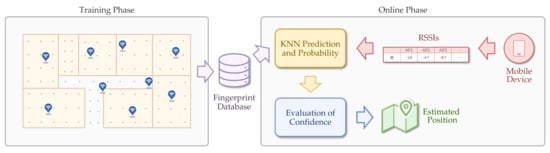
Figure 1.
LocFiND architecture: the training phase generates the fingerprint database, which is used in the online phase to estimate the position of the mobile devices.
For the label of the samples, two granularities were used. For room classification = {41, 57, 40, 53, 39, 47, 51, 62, 45, 43, 61, 46, 16, 63}, where each number represents the ID of a room. For the classification of specific points inside rooms, the labels have the format R_X_Y that represents the R as the room ID, X as the line, and Y as the column inside the room (with cells of approximately 2 m × 2 m).
In the second, online phase, the procedures for estimating the localization of the mobile devices are executed. A centralized architecture was chosen mainly due to the limitations of the mobile nodes (e.g., energy savings and limited hardware). In this phase, a mobile node sends a data packet that will be received by the anchor nodes that will measure the RSS for this packet and forward the information to a central server. The server will then be able to estimate the location in which the packet was sent and, thus, the mobile device location.
The central server uses a KNN algorithm with the fingerprint database from the training phase, thus will return not only the class but also the probabilities of the sample to belong to each one of the different classes. These probabilities will then be evaluated by our proposed approaches for the evaluation of confidence for the final classification. The similarity measuring metric used in KNN is the euclidean distance.
As previously mentioned, RSS values have a variation even when the node is not moving. This is due to ambient characteristics and obstacles that can change the signal momentarily causing errors both in the training phase and in the online phase.
Many works in the literature deal with the RS noise in the training phase [43], but the signal information in the online phase suffers from the same problem or worse since, in most cases, training is done in an empty building while the online phase occurs in a more crowded and dynamic scenario. Thus, we need solutions that also take into consideration the impact of this RSS variation in the online phase.
An intuitive step would be to discard and ignore data where we have low confidence at the time of localization. However, after some time without localization information, this missing information will start being noticeable. Thus, we cannot simply start ignoring any information that might be unreliable. The question that remains is how to define, in the online phase, if a set of RSS’s received can be considered reliable for correct classification. We refer to this step as Evaluation of Confidence in our LocFiND architecture.
As mentioned before, we propose three different techniques in LocFiND to evaluation the confidence for estimated positions:
- Prediction Probability: uses the estimated prediction probability to decide whether to accept the estimated class.
- Novelty Detection: uses the novelty detection technique to identify the reliability of the classified sample.
- Hybrid Approach: uses both probability and novelty detection to improve on the isolated solutions.
These three techniques are explained and detailed in the next sections.
3.1. Using Prediction Probability
In the first technique, called Prediction Probability, we evaluate the confidence of the estimated position by using the classification probability, available in the scikit-learn KNN implementation. In this implementation, the predict_proba function returns the probabilities that a sample has for belonging to each one of the different classes (trained positions, labels). The most probable class is the result of the classification. For probability estimation, predictors usually implement methods that quantify the confidence of the predictions. In KNN, each class probabilities are the normalized weighted average of indicators for the k-nearest classes, weighted by the inverse distance [44].
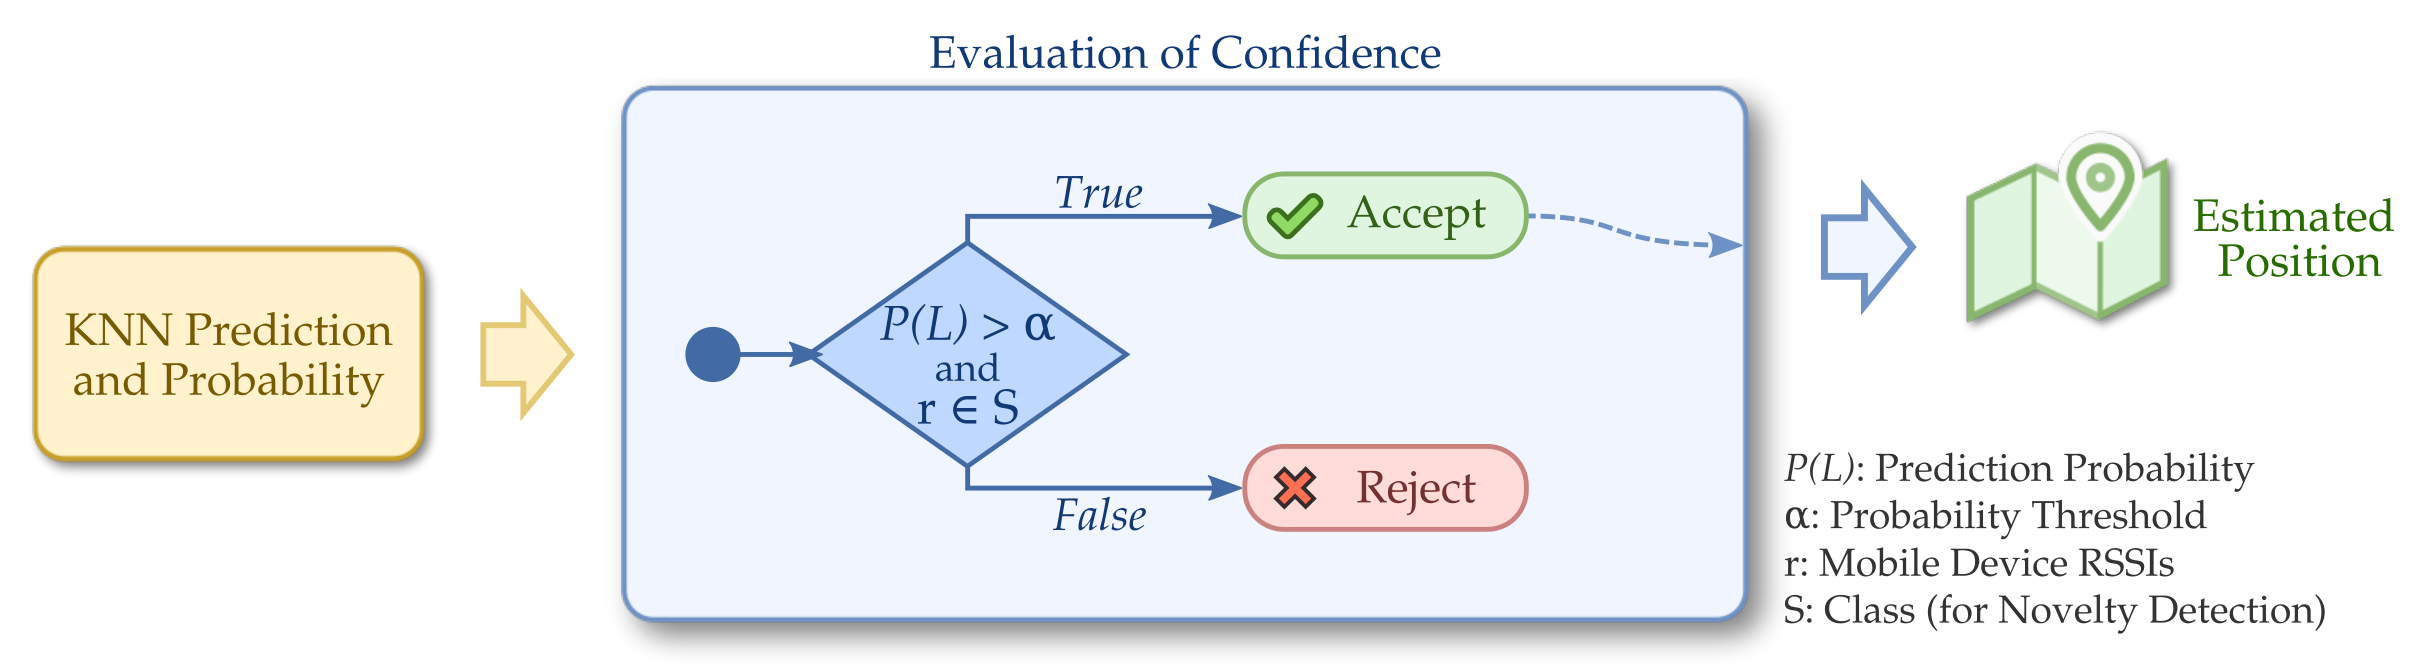
Prediction Probability approach uses the model generated by KNN using the fingerprint database from the training phase. The model evaluates each new, online sample received and returns the probabilities that it belongs to each one of the available classes. In this approach, we choose the class with the highest probability and, if this probability is greater than a threshold , the classification is accepted and the new estimated position is sent to the application. Otherwise, the result is rejected. Figure 2 shows the complete diagram for this confidence evaluation.
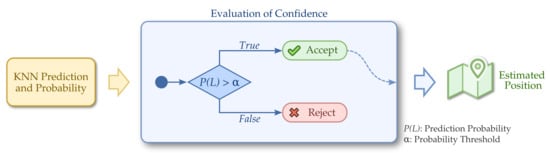
Figure 2.
Evaluation of confidence using prediction probability: classifications with low probabilities are discarded to improve accuracy.
3.2. Using Novelty Detection
In the previous solution, as we will show in Section 4, even when discarding classifications that have a low prediction probability, we still have some wrong classifications. In this section, we define a novel approach that helps to decide which classifications should be discarded. In this solution, which we refer simply as Novelty Detection, we check (i.e., confirm) whether the classified sample really belongs to the class that was estimated by the classifier (KNN chooses the class that most closely matches). For this, we use the concept of novelty, a concept used in the area of outlier detection. Novelty can be defined as the task of recognizing whether a tested sample differs, in some aspects, from the data gathered during the training phase [45].
Detecting new, never seen samples is an important skill for any classification system. When realizing that it is not possible to train a machine learning system with all types of data the system is likely to find, it becomes important to be able to differentiate between information from known and unknown data during the online phase [46].
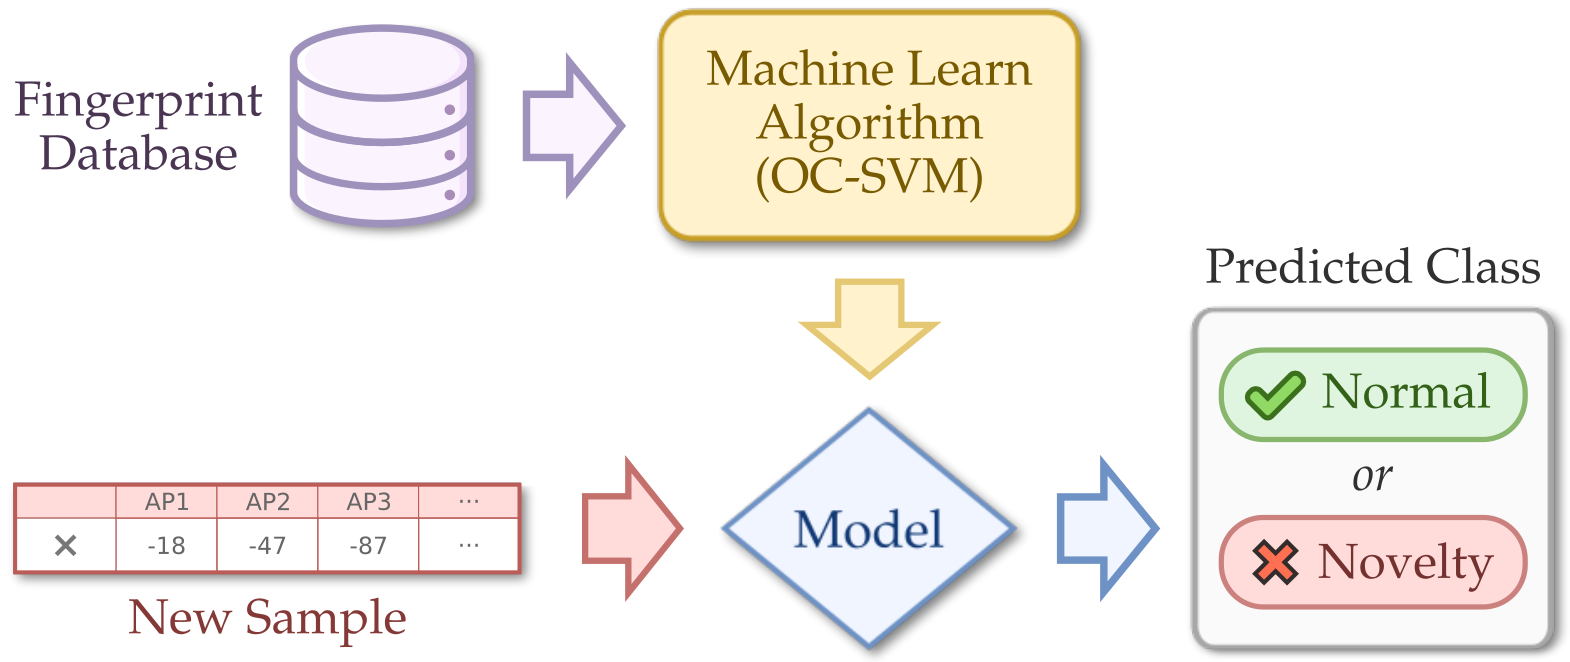
Novelty detection refers to the identification of novel or abnormal patterns embedded in a large amount of normal data. Novelty (anomaly, outlier, exception) happens when a sample does not conform to the expected, normal behavior [47]. Unlike outlier detection approaches, that are done in training, novelty detection defines whether or not a new sample (online phase) belongs to a class. A novelty detection architecture is depicted in Figure 3.
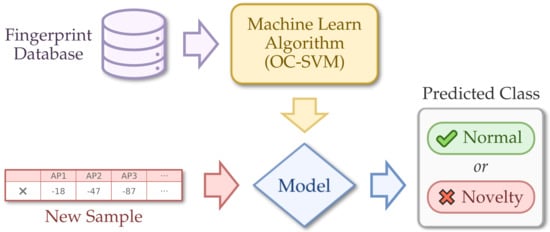
Figure 3.
Novelty detection using One-Class SVM.
Novelty detection techniques can be implemented using different techniques such as support vector machines based techniques, clustering-based techniques, nearest-neighbor-based techniques, and statistical techniques [48].
A commonly used unsupervised novelty detection technique is based on SVM. It builds a spherical boundary scheme that groups and encloses most normal data samples. Any new, unseen sample falling outside the group’s boundaries is detected as novelty. In recent works on SVM-based novelty detection, a variation called OC-SVM (one-class SVM) is used since it has some kernel tricks that allow it to easily separate normal and novel data in higher dimensional spaces [49], which is the case of our localization system with 15 dimensions (i.e., anchor nodes).
In this evaluation of confidence part of LocFiND, we first use the prediction probability, as in the previous Section 3.1, to have a first evaluation from the KNN itself regarding the classification reliability. Then, in order to have a second validation of the result, we use the concept of novelty detection to confirm that a given sample really belongs to that class.
Thus, the same prediction probability explained previously with the threshold is used. However, the classifications are further validated using novelty detection implemented using the One-Class SVM. In addition to passing the threshold test, a new validation is done by the novelty algorithm that tests whether that sample really belongs to the chosen class (the one with the highest probability returned by KNN). Only when both tests are passed, a classification is accepted. This complete decision process for the evaluation of confidence is depicted in Figure 4.
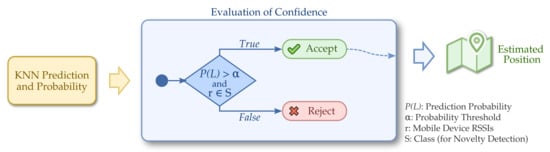
Figure 4.
Evaluation of confidence using the novelty detection technique: accuracy is improved by further discarding unreliable classifications.
3.3. Hybrid Approach: Combining Prediction Probability with Novelty Detection
The previous Section 3.1 and Section 3.2 are more reliable and accurate but, as we show in Section 4, it discards and ignores a high number of position estimations, leaving the system with little position information. Thus, in this section, we propose a new technique called Hybrid Approach. We call it hybrid because it combines the confidence assessment of the two previous configurations, each one being applied to a threshold used in different steps and techniques. The first threshold is a probability estimate, while the second is a novelty factor. Thus, this hybrid approach combines the first and second approaches.
To understand the hybrid approach, we need to first understand the behavior of the probability threshold . The lower the probability threshold, the higher the classification errors, resulting in a higher average localization error. However, in this case, we also have a higher number of position estimations, which is good for the application. If we increase this threshold, we improve accuracy but also reduce the number of accepted classifications, leaving the system without enough position estimations.
In the hybrid approach, we initially use the same probability threshold as in the previous sections. However, instead of simply rejecting the classifications that do not pass this filter, we use novelty detection to give a second chance for some of these classifications that would be discarded otherwise. For this, we use a second, lower probability threshold and use novelty detection to confirm the classifications above this second threshold.
The result of this decision process, which is depicted in Figure 5, is that classifications with high prediction probabilities (threshold ) are not checked by the novelty detection. Classifications with lower prediction probabilities, but still higher than the threshold , will be confirmed by the novelty detection. Finally, classifications with prediction probabilities lower than or that did not pass the novelty check, are discarded.
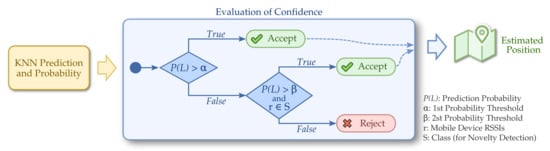
Figure 5.
Evaluation of confidence using the hybrid approach: a compromise between accuracy and number of position estimations.
4. Performance Evaluation
In this section, we evaluate the performance of our proposed LocFiND solution and its approaches for the evaluation of confidence of the estimated positions. We will discuss the results of our solution compared in various ways, to have a better view of its operation and a better understanding of its behavior.
4.1. Methodology
We evaluated the performance of our solution in a large-scale, real-world testbed, shown in Figure 6. Since we are focused on applications based on small, low-processing, low-power, and battery-operated mobile devices, we used nodes and anchors with BLE technology. Figure 7a shows the hardware used for the mobile devices, a smartwatch-based wearable device, while Figure 7b shows the hardware used as anchor nodes for the location data gathering.
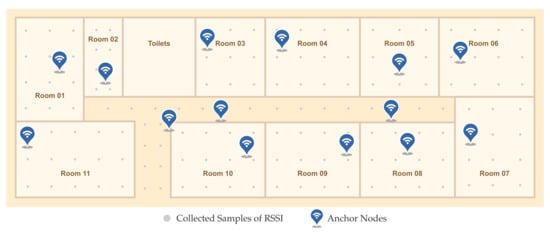
Figure 6.
Real-world application/testbed map: area of 645 (43 m × 15 m), 11 rooms of averaged 42 (7 m × 6 m), 3 halls, 15 anchor nodes, and 150 reference points. For each reference point, 100 samples were gathered to a total of 15,000 samples. 11 different mobile devices were used, 9 for training and 3 for testing.
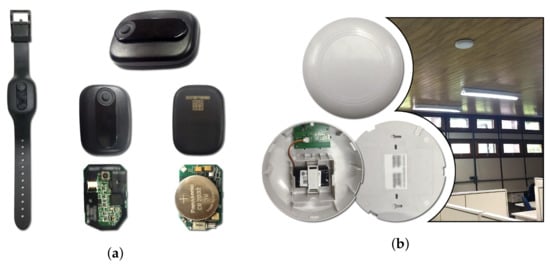
Figure 7.
Device Nodes [20]. (a) Bluetooth-based, smartwatch-like devices are used as mobile devices. (b) Bluetooth-based access points are used as anchor nodes.
Since our main application is to localize students, our testbed was implemented in a school area of 645 consisting of 15 spaces (11 rooms and 3 halls). The complete map of the area is depicted in Figure 6. To cover the entire area, 15 anchor nodes were installed on the ceiling of the rooms in places where it was somewhat convenient to connect them to the mains power. These anchor nodes are depicted in blue in Figure 6. This base was collected and used in other works from our research group [20].
To execute the training phase of LocFiND and generate the fingerprint database, we evenly distributed 150 reference points (RPs) throughout the area. These RPs are depicted as gray dots in Figure 6. For each RP, we went to that location and started sending data packets using 11 different mobile devices. We collected a total of 100 samples per RP to a total of 15,000 samples in our fingerprint database. Finally, in our results shown in the following sections, we used the samples from nine mobile devices as training and the samples from three other mobile devices as testing. Thus, the samples used for testing are from never-seen devices from the training.
To choose the parameters of KNN, the GridSearchCV method of the scikit-learn was used, which is a tool of selection of parameters using cross-validation on the training base, thus avoiding overfitting. By using GridSearchCV with five folds, we set the main parameters in KNN the value of . Selecting k is not an exact science because it’s hard to estimate how well your fold represents your overall dataset. For this reason, we used the GridSearchCV with a 5-fold cross-validation to find the best k value without overfitting the system. Finally, we also used different devices for training and testing, so that the values in testing are from never-seen devices. This increases the chances for the proposed solution to work with new devices in a real-world application.
As a baseline of comparison for the results, a traditional fingerprint-based solution that uses the RSS database and KNN (with k = 9) was used, having a 96% accuracy for room classification and a 36% for point estimation with an average error of m. Since in this case there is no evaluation of confidence, 100% of the position estimations were sent to the application. Our goal for LocFiND is to improve these classifications and average localization error while delivering as many position estimates for the application as possible.
4.2. Evaluation of Confidence Using Prediction Probability
As mentioned in Section 3.1, the evaluation of confidence using prediction probability uses the threshold to decide whether to accept or discard an estimated class/position based on the probability of the sample belonging to that class. Only samples with prediction probability higher than are accepted.
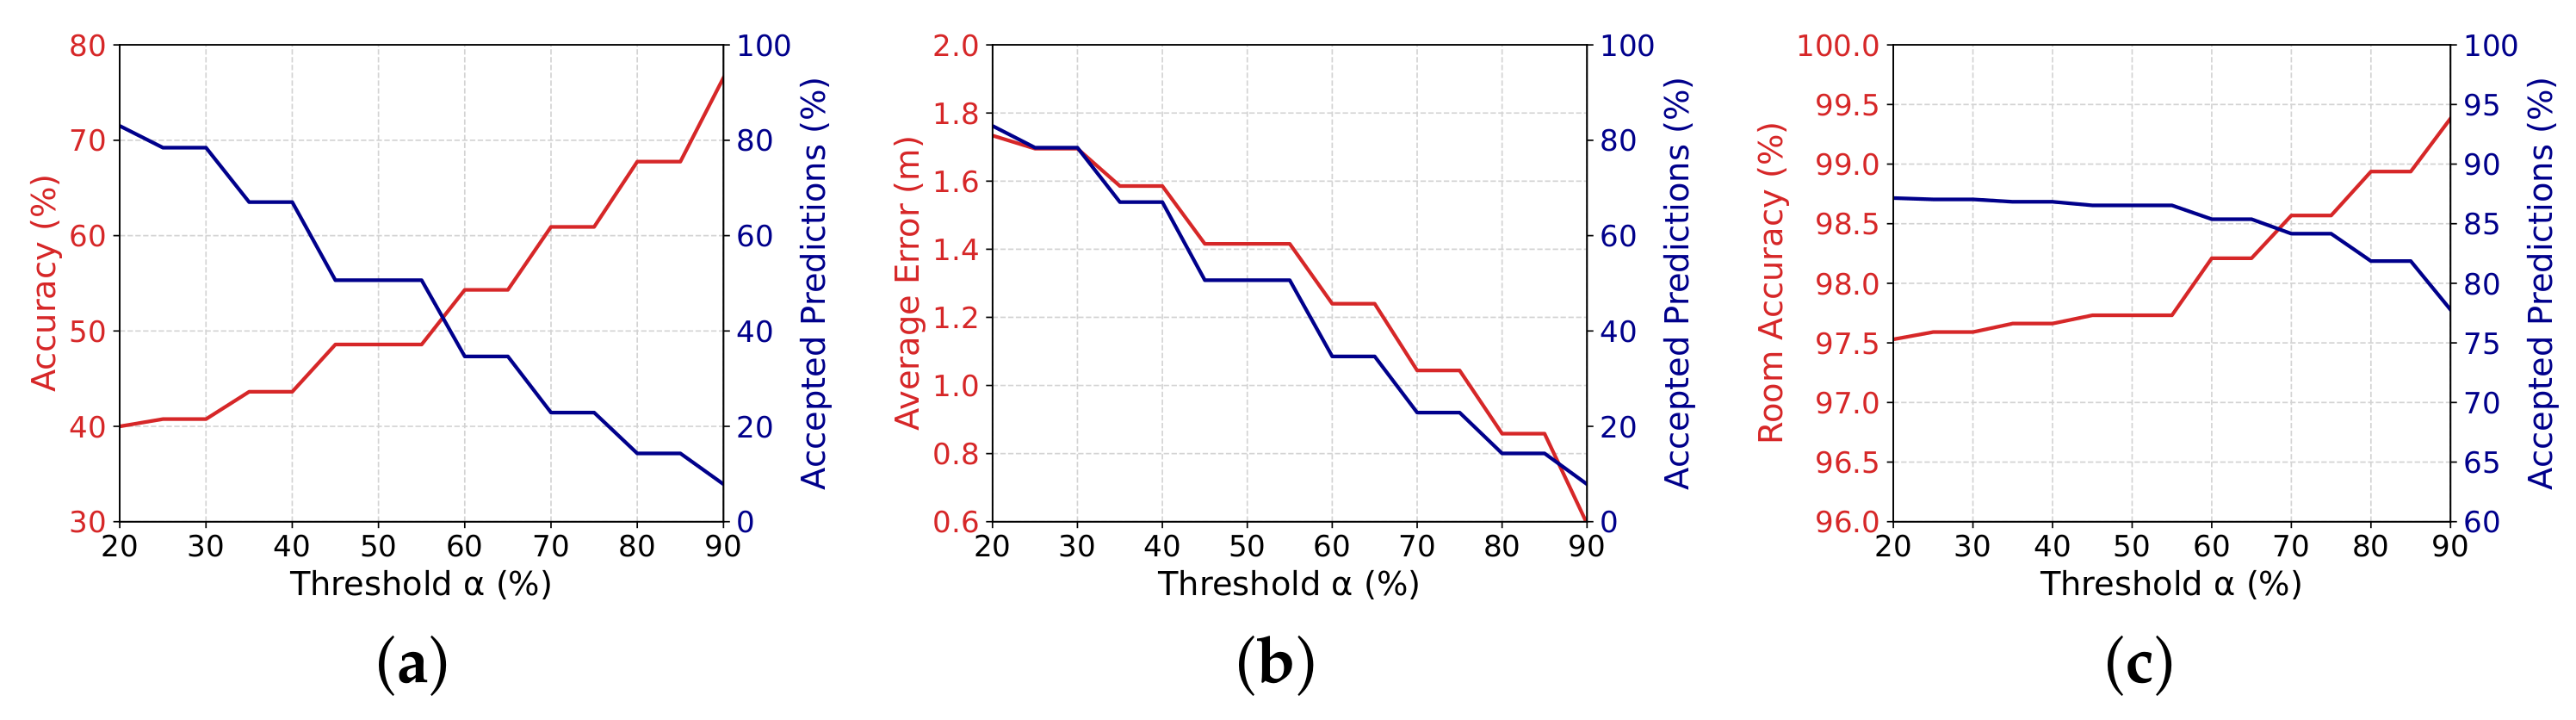
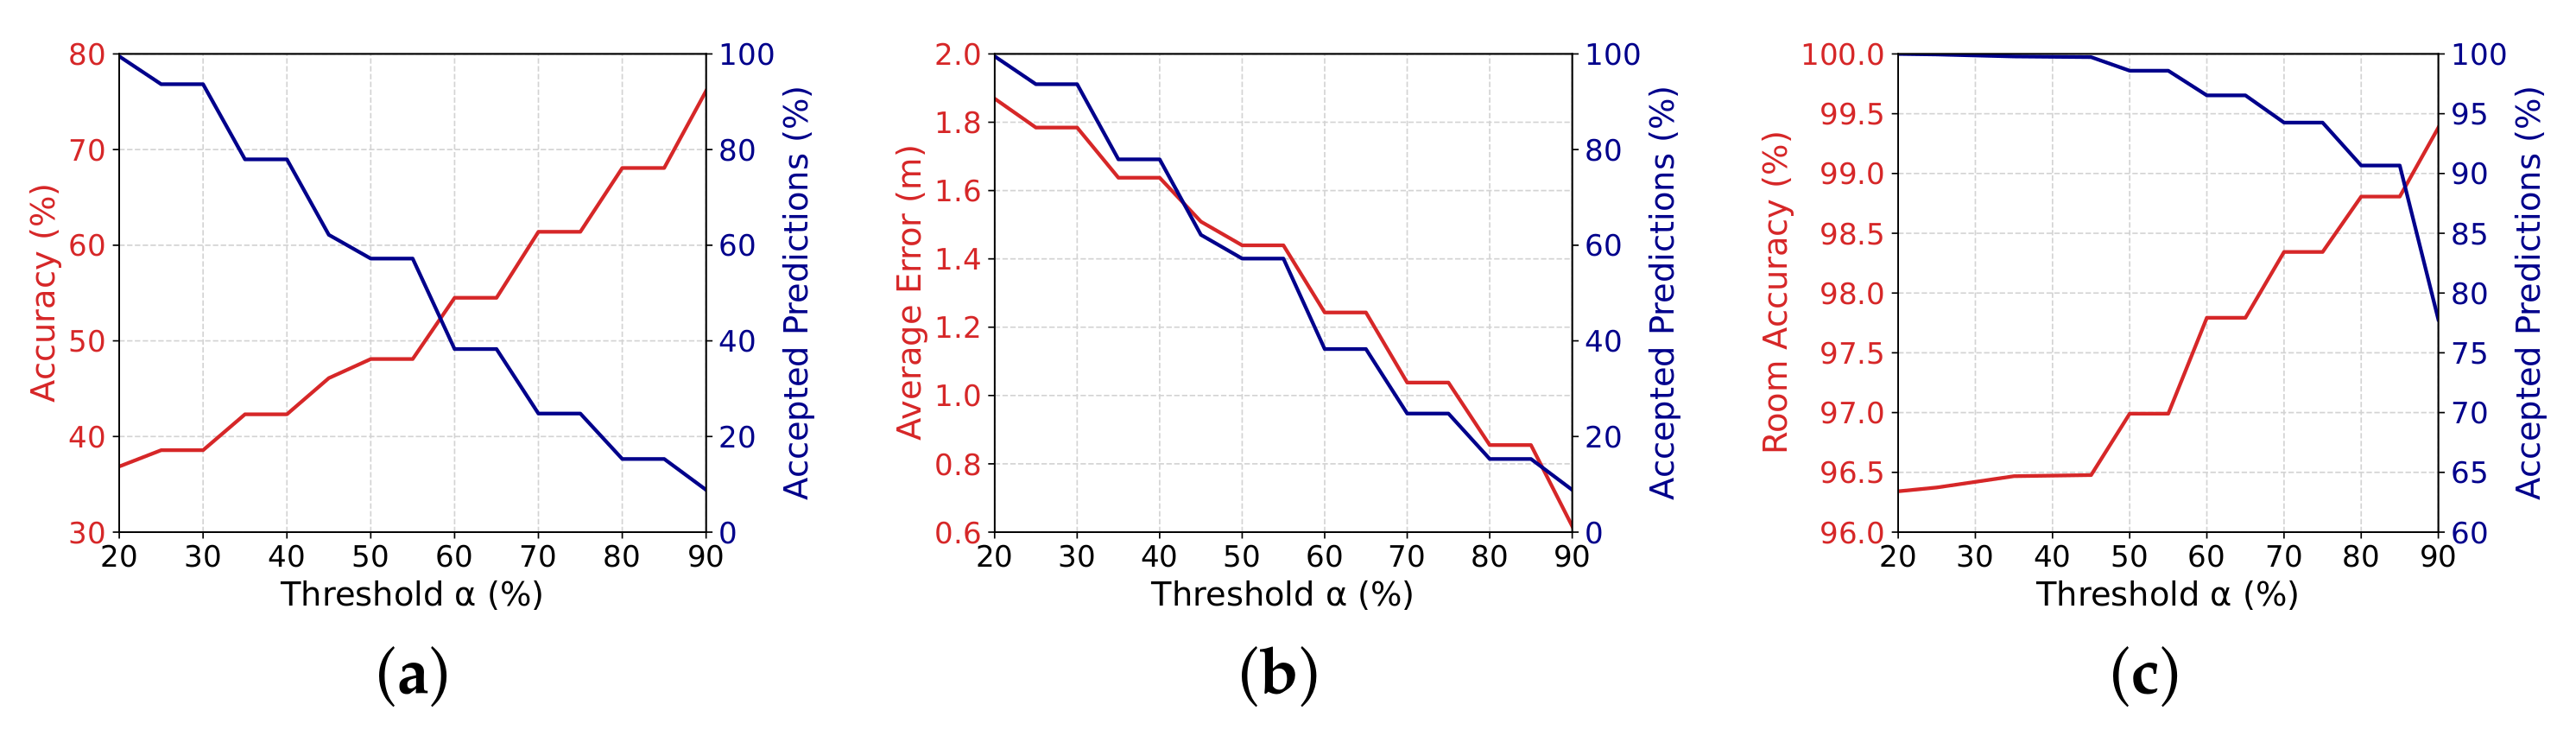
Figure 8a shows the relationship among the value of the threshold , and the final accuracy of the accepted classifications (in red) as well as the percentage of accepted estimations (in blue). Similarly, Figure 8b shows the behavior of the average localization error (in red) and, again, the percentage of accepted estimations (in blue) as we increase the threshold . Finally, Figure 8c shows the behavior of the room estimation accuracy, i.e., we are using the room name as classes. These results show several characteristics of our proposed LocFiND solution that we will discuss in the next paragraphs.
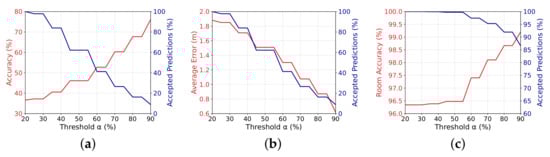
Figure 8.
Results for the evaluation of confidence using prediction probability: relationship among the value of the threshold (x-axis), the percentage of accepted estimations (in blue), and (a) the final accuracy of the accepted classifications, (b) the average localization error, and (c) the room accuracy.
First, as expected, as we increase the threshold , the number of accepted estimations decreases (blue curve in Figure 8a–c). However, since we are accepting higher quality predictions, the accuracy increases (Figure 8a), and thus the average localization error decreases (Figure 8b) and the room accuracy also increases (Figure 8c).
For instance, compared to a traditional kNN, in the case of Figure 8a,b, a threshold accept of the predictions while increasing the accuracy from to and decreasing the average localization error from m to m. In the case of room accuracy, for , the number of accepted predictions remained almost the same at , while increasing only slightly the accuracy to . This is mostly because it is easier to estimate rooms and the classifier is able to do it with higher probabilities.
On the other hand, when we use a threshold , only of the position estimations were forwarded to the application, as depicted in Figure 8a,b. However, these estimations were very reliable, having almost accuracy and a localization error lower than m. A better result came from the room accuracy, in which of the predictions were accepted with an accuracy of almost .
To have a better understanding of how the localization errors are distributed, Figure 9 shows the cumulative distribution function for the thresholds , , and . This graph shows the percentage of estimations (y-axis) with an error lower than the x-axis. In this curve, the smaller the x-axis value and the larger the y-axis value, the better since this means that the majority of the estimations have lower errors. As we can see, for instance, when using a threshold , only of the estimations resulted in an error lower than or equal to 2 m. On the other hand, for a threshold , almost of the estimations resulted in errors lower than or equal to 2 m.
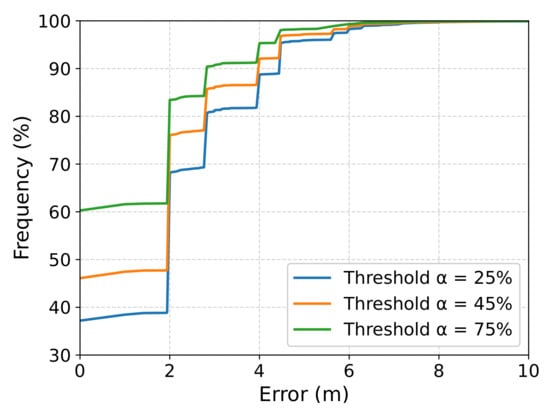
Figure 9.
Cumulative distribution function of the localization error using prediction probability with thresholds , , and : it shows the percentage of estimations (y-axis) with an error smaller than the x-axis.
Thus, as we can see, the choice of which threshold to use really depends on the scenario and type of application. The main challenge is how to decide what is the best case for our current problem: a higher number of position estimations with a lower accuracy or fewer estimations with higher accuracy. However, we can make this decision easier if we can improve this solution by using better mechanisms for the evaluation of confidence. Thus, in our LocFiND solution, we used Novelty Detection to improve this evaluation of confidence.
4.3. Evaluation of Confidence Using Novelty Detection
As mentioned in Section 3.2, in order to further improve the accuracy of the localization system, we introduced the novelty detection test. This test evaluates whether a sample belongs to a certain class (KNN predicted class/position). This approach still uses the threshold , but uses the novelty detection to improve even more the evaluation of confidence.
Similar to the previous section, Figure 10 shows the relationship among the value of the threshold (x-axis), the percentage of accepted estimations (in blue), and the final accuracy of the accepted classifications (red curve in Figure 10a), the average localization error (red curve in Figure 10b), and the room accuracy (red curve in Figure 10c).
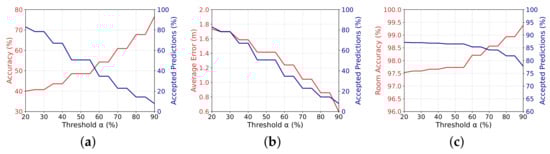
Figure 10.
Results for the evaluation of confidence using novelty detection: relationship among the value of the threshold (x-axis), the percentage of accepted estimations (in blue), and (a) the final accuracy of the accepted classifications, (b) the average localization error, and (c) the room accuracy. Compared to the previous results, the localization accuracy is improved, but at the cost of reducing the number of accepted estimations.
As we can see, the novelty detection was indeed able to improve both the localization accuracy and the average error. However, it was at the cost of a lower number of accepted predictions. For instance, compared to the prediction probability in Section 4.2, as we can see in Figure 10a, for a threshold of , the classification accuracy is near , increased from . As for the average localization error, shown in Figure 10b, it decreased from m to m. However, in both cases, the accepted predictions went from to . In the case of room accuracy, it increased from to , while the accepted predictions decreased from to .
On the other hand, for a threshold the results do not change significantly since, in most cases, the estimations with high prediction probabilities also passed the test for novelty detection.
Finally, Figure 11 shows the cumulative distribution function for the thresholds , , and . When compared to the previous results, we can notice some improvements in the localization errors. For instance, when using a threshold and considering the estimations with errors lower than or equal to 2 m, the number of estimations increased from to .
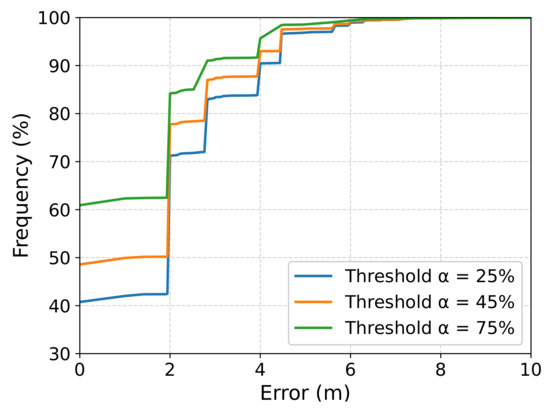
Figure 11.
Cumulative distribution function of the localization error using novelty detection with thresholds , , and : a higher percentage of the position estimations resulted in lower errors.
As we can see, even though the novelty detection is able to improve accuracy, it was at the cost of accepted predictions. In the next section, we will show the results for our hybrid approach for the evaluation of confidence, that tries to minimize this problem.
4.4. Evaluation of Confidence Using the Hybrid Approach
In this section, we show and discuss the results of our third, hybrid approach to evaluate the confidence of the estimated positions. As mentioned in Section 3.3, it combines the previous two approaches in order to improve accuracy while reducing the number of discarded estimations.
It was observed in the previous sections that the lower the probability threshold, the higher the localization error. Thus, in this hybrid solution, we use the prediction probability for higher values of as a first, initial filter. Then, we use a lower probability threshold to get possibly wrong estimations and apply the stricter, novelty detection test, to confirm their predictions. Thus, we expect to mitigate the loss of predictions in the highest probabilities and, thus, have some lost estimations only in the predictions with lower probabilities.
As in the previous sections, Figure 12 shows our results when using the hybrid approach for the evaluation of confidence. In the case of Figure 12a, we can notice that the localization accuracy is very close to the ones obtained by the novelty detection approach (as shown in Section 4.3). On the other hand, the number of accepted predictions is closely similar to the ones obtained by the probability prediction approach (as shown in Section 4.2). For instance, for the threshold , the accuracy is , close to the second approach and, in terms of accepted predictions, it increased from to , similar to the first approach. These results show that this hybrid approach can reach a compromise, improving the localization while decreasing only slightly the number of discarded estimations.
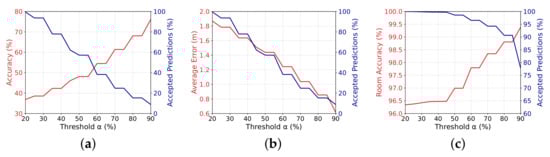
Figure 12.
Results for the evaluation of confidence using the hybrid approach: relationship among the value of the threshold (x-axis), the percentage of accepted estimations (in blue), and (a) the final accuracy of the accepted classifications, (b) the average localization error, and (c) the room accuracy. A compromise is reached having improved localization estimations while increasing the number of accepted predictions.
The same can be observed for the average localization error, shown in Figure 12b. Finally, in the case of room accuracy, shown in Figure 12c, the hybrid approach was also able to improve this accuracy while having almost the same number of accepted samples when compared to the prediction probability.
Figure 13 shows the cumulative distribution function of the localization error using our three approaches for the evaluation of confidence in three different threshold configurations. As we can see, the hybrid approach has an error curve almost equal to or better than the more restrictive technique but, as seen in the previous results, it has a higher number of accepted estimations.
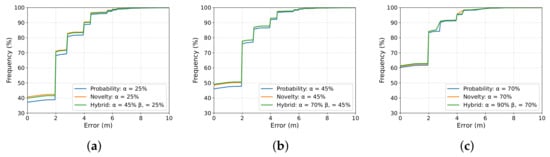
Figure 13.
Comparing the cumulative distribution function of the localization error using our three approaches, (a) Using lower probability 25% (b) Using lower probability 45%, and (c) Using lower probability 70%.
5. Applicability, Strengths, and Weaknesses of the Proposed System
Our main motivation for implementing an indoor localization system is to localize students inside a school. However, in the first version of our system, the unstable position estimations resulted in the students jumping from room to room, even though they were actually static. To reduce these jumps and improve our system accuracy and stability, we started looking for solutions to evaluate and improve the confidence of the predictions.
Thus, we proposed and applied the LocFiND solution, our localization system, which was able to significantly improve the results and stability while keeping the feeling of a real-time system. Our solution has the advantage of choosing the most reliable results, based on the assessment of probability and novelty. This makes the system more resilient since even if we have any communication problem, packet loss, or interference up to a limit, the system can keep working just by discarding the problematic information. For other scenarios, depending on the requirements of the application, our proposed solution can be easily adjusted to have an acceptable percentage of discarded estimations while considerably improving the accuracy and stability of the system.
However, discarding data causes some problems for evaluating the results since the final amount of results is less than if we used all of the data. In this work, the evaluation was based on accuracy and mean error. Accuracy can be defined as , and the average error as , where h is the number of correct sort results, and e is the sum of errors associated with the results considered valid by the algorithms, and n is the number of valid outputs from the algorithm. However, as our algorithm discards some data, the value of n for them becomes different, making the comparison between them not totally fair. Thus, in most results, we included the percentage of accepted predictions to make it clear that, even though the error decreased, the number of accepted predictions also decreased.
Finally, it is known that RSS values reported by the devices are somewhat hardware-dependent and can vary from one manufacturer to another. Even though this might affect the performance of the localization systems, in the case of our application, in which we implemented the proposed solution in the school area, this was not an issue since all of the hardware was similar and from the same manufacturer.
6. Conclusions and Future Work
In this paper, we propose and evaluate the performance of a new approach for indoor localization, the LocFiND (Localization using Fingerprinting and Novelty Detection). In our solution, information received in the online phase will only be accepted after it passes an evaluation of confidence. We then propose three different approaches for this evaluation of confidence. A first using only the probability of classification, another adding novelty detection, and a hybrid approach uses both prediction probability and novelty detection to improve localization accuracy while trying to discard as little information as possible.
The main contribution of our solution is the possibility of removing unreliable results (which may have been affected by noisy information) in the online phase, while most works in the literature assess the impact of noise in the training or data collection phase. The main concern of our approach is how to discard the fewer possible estimations while increasing the accuracy and stability. Thus, our solution provides an important tradeoff between accuracy and the number of estimations that can be discarded without compromising the system.
Our results show that we can have less restricted configurations, for a threshold , that improves the position accuracy from to and the average localization error from m to m compared to a traditional kNN, while discarding only of the estimations. On the other hand, we can have more strict configurations, for a threshold , that can improve the accuracy to almost and the average localization error to m but accepting only of the estimations. In terms of room accuracy, which was the main focus of our application, LocFiND was able to improve the accuracy from to almost while discarding only of the estimations for a threshold .
In future work, we intend to propose and analyze other methods for the evaluation of confidence. For instance, the residual value, mainly used in the least square method, could be used to compute a “distance” between the new sample and the nearest neighbors in the fingerprint database. We aim at evaluating how this and other measures of discrepancies could be used to improve our solution.
Another point that we can advance is the problem generated by discarding unreliable information in the localization phase. We aim at defining, given the response time required by the system, how much information we can discard without harming its operation. We can define minimum amounts of data distributed over time as an application requirement, which defines the maximum data discard limit.
Also in future work, we intend to compare our work to a more robust, state-of-the-art approach, other than KNN. Our proposed solution has some particularities that make it somewhat different from most proposed solutions, mainly the characteristic of discarding unreliable classifications based on novelty detection. Since most known solutions do not discard these classifications, it would be difficult, in this current work, to make the comparison while being able to see the isolated gains obtained by our evaluation of confidence step.
Author Contributions
The authors contributed equally to this work. All authors have read and agreed to the published version of the manuscript.
Funding
This research was partially funded by the Institute for Innovation, Research, and Scientific and Technological Development of Amazonas (IPDEC), Positivo Technologies and, according to Article 48 of Decree no 6.008/2006, Samsung Electronics of Amazonia Ltda, under the terms of Federal Law no 8.387/1991, through agreement no 003, signed with ICOMP/UFAM.
Data Availability Statement
The codes and bases used in the experimentation part of this work are available at https://github.com/hasm/doc (accessed on 15 January 2022).
Conflicts of Interest
The authors declare no conflict of interest.
References
- Zafari, F.; Gkelias, A.; Leung, K.K. A Survey of Indoor Localization Systems and Technologies. IEEE Commun. Surv. Tutor. 2019, 21, 2568–2599. [Google Scholar] [CrossRef] [Green Version]
- Boukerche, A.; Oliveira, H.A.; Nakamura, E.F.; Loureiro, A.A. Localization systems for wireless sensor networks. IEEE Wirel. Commun. 2007, 14, 6–12. [Google Scholar] [CrossRef]
- Balico, L.N.; Loureiro, A.A.F.; Nakamura, E.F.; Barreto, R.S.; Pazzi, R.W.; Oliveira, H.A.B.F. Localization Prediction in Vehicular Ad Hoc Networks. IEEE Commun. Surv. Tutor. 2018, 20, 2784–2803. [Google Scholar] [CrossRef]
- Wang, B.; Chen, Q.; Yang, L.T.; Chao, H. Indoor smartphone localization via fingerprint crowdsourcing: Challenges and approaches. IEEE Wirel. Commun. 2016, 23, 82–89. [Google Scholar] [CrossRef]
- Gu, Y.; Lo, A.; Niemegeers, I. A survey of indoor positioning systems for wireless personal networks. IEEE Commun. Surv. Tutor. 2009, 11, 13–32. [Google Scholar] [CrossRef] [Green Version]
- Harle, R. A Survey of Indoor Inertial Positioning Systems for Pedestrians. IEEE Commun. Surv. Tutor. 2013, 15, 1281–1293. [Google Scholar] [CrossRef]
- Subbu, K.P.; Zhang, C.; Luo, J.; Vasilakos, A.V. Analysis and status quo of smartphone-based indoor localization systems. IEEE Wirel. Commun. 2014, 21, 106–112. [Google Scholar] [CrossRef]
- Liu, H.; Darabi, H.; Banerjee, P.; Liu, J. Survey of Wireless Indoor Positioning Techniques and Systems. IEEE Trans. Syst. Man Cybern. Part C Appl. Rev. 2007, 37, 1067–1080. [Google Scholar] [CrossRef]
- Yassin, A.; Nasser, Y.; Awad, M.; Al-Dubai, A.; Liu, R.; Yuen, C.; Raulefs, R.; Aboutanios, E. Recent Advances in Indoor Localization: A Survey on Theoretical Approaches and Applications. IEEE Commun. Surv. Tutor. 2017, 19, 1327–1346. [Google Scholar] [CrossRef] [Green Version]
- Zhuang, Y.; Yang, J.; Li, Y.; Qi, L.; El-Sheimy, N. Smartphone-Based Indoor Localization with Bluetooth Low Energy Beacons. Sensors 2016, 16, 596. [Google Scholar] [CrossRef] [Green Version]
- Castillo-Cara, M.; Lovón-Melgarejo, J.; Bravo-Rocca, G.; Orozco-Barbosa, L.; García-Varea, I. An Empirical Study of the Transmission Power Setting for Bluetooth-Based Indoor Localization Mechanisms. Sensors 2017, 17, 1318. [Google Scholar] [CrossRef] [Green Version]
- Sie, M.K.; Kuo, C.H. Indoor location estimation using BLE beacon with multiple transmission power levels. In Proceedings of the 2017 IEEE International Conference on Consumer Electronics-Taiwan (ICCE-TW), Taipei, Taiwan, 12–14 June 2017; pp. 323–324. [Google Scholar] [CrossRef]
- Qureshi, U.M.; Umair, Z.; Hancke, G.P. Evaluating the Implications of Varying Bluetooth Low Energy (BLE) Transmission Power Levels on Wireless Indoor Localization Accuracy and Precision. Sensors 2019, 19, 3282. [Google Scholar] [CrossRef] [Green Version]
- Sadowski, S.; Spachos, P. RSSI-Based Indoor Localization with the Internet of Things. IEEE Access 2018, 6, 30149–30161. [Google Scholar] [CrossRef]
- Bahl, P.; Padmanabhan, V. RADAR: An in-building RF-based user location and tracking system. In Proceedings of the IEEE INFOCOM 2000, Conference on Computer Communications. Nineteenth Annual Joint Conference of the IEEE Computer and Communications Societies (Cat. No.00CH37064), Tel Aviv, Israel, 26–30 March 2000; Volume 2, pp. 775–784. [Google Scholar] [CrossRef]
- Bahl, P.; Bahl, P.; Padmanabhan, V.N.; Balachandran, A. Enhancements to the RADAR User Location and Tracking System; Technical Report; Microsoft: Redmond, WA, USA, 2000. [Google Scholar]
- Chen, Z.; Wang, J. GROF: Indoor Localization Using a Multiple-Bandwidth General Regression Neural Network and Outlier Filter. Sensors 2018, 18, 3723. [Google Scholar] [CrossRef] [PubMed] [Green Version]
- Ye, Y.; Wang, B. RMapCS: Radio Map Construction from Crowdsourced Samples for Indoor Localization. IEEE Access 2018, 6, 24224–24238. [Google Scholar] [CrossRef]
- Bhatti, M.A.; Riaz, R.; Rizvi, S.S.; Shokat, S.; Riaz, F.; Kwon, S.J. Outlier detection in indoor localization and Internet of Things (IoT) using machine learning. J. Commun. Netw. 2020, 22, 236–243. [Google Scholar] [CrossRef]
- Assayag, Y.; Oliveira, H.; Souto, E.; Barreto, R.; Pazzi, R. Indoor Positioning System Using Dynamic Model Estimation. Sensors 2020, 20, 7003. [Google Scholar] [CrossRef]
- Ashraf, I.; Hur, S.; Park, Y. Indoor Positioning on Disparate Commercial Smartphones Using Wi-Fi Access Points Coverage Area. Sensors 2019, 19, 4351. [Google Scholar] [CrossRef] [PubMed] [Green Version]
- Ali, M.U.; Hur, S.; Park, S.; Park, Y. Harvesting Indoor Positioning Accuracy by Exploring Multiple Features from Received Signal Strength Vector. IEEE Access 2019, 7, 52110–52121. [Google Scholar] [CrossRef]
- Youssef, M.A.; Agrawala, A.; Shankar, A.U. WLAN Location Determination via Clustering and Probability Distributions. In Proceedings of the First IEEE International Conference on Pervasive Computing and Communications (PERCOM ’03), Fort Worth, TX, USA, 26 March 2003; IEEE Computer Society: Washington, DC, USA, 2003; p. 143. [Google Scholar]
- Youssef, M.; Agrawala, A. Handling samples correlation in the Horus system. In Proceedings of the INFOCOM 2004, Twenty-Third AnnualJoint Conference of the IEEE Computer and Communications Societies, Hong Kong, China, 7–11 March 2004; Volume 2, pp. 1023–1031. [Google Scholar] [CrossRef] [Green Version]
- Roos, T.; Myllymäki, P.; Tirri, H.; Misikangas, P.; Sievänen, J. A Probabilistic Approach to WLAN User Location Estimation. Int. J. Wirel. Inf. Netw. 2002, 9, 155–164. [Google Scholar] [CrossRef]
- Castro, P.; Chiu, P.; Kremenek, T.; Muntz, R.R. A Probabilistic Room Location Service for Wireless Networked Environments. In Proceedings of the 3rd International Conference on Ubiquitous Computing (UbiComp ’01); Springer: London, UK, 2001; pp. 18–34. [Google Scholar]
- Pinto, B.H.O.U.V.; de Oliveira, H.A.B.F.; Souto, E.J.P. Factor Optimization for the Design of Indoor Positioning Systems Using a Probability-Based Algorithm. J. Sens. Actuator Netw. 2021, 10, 16. [Google Scholar] [CrossRef]
- Battiti, R.; Nhat, T.L.; Villani, A. Location-Aware Computing: A Neural Network Model for Determining Location in Wireless LANs; Technical Report; University of Trento: Trento, Italy, 2002. [Google Scholar]
- Saha, S.; Chaudhuri, K.; Sanghi, D.; Bhagwat, P. Location determination of a mobile device using IEEE 802.11b access point signals. In Proceedings of the 2003 IEEE Wireless Communications and Networking (WCNC 2003), New Orleans, LA, USA, 16–20 March 2003; Volume 3, pp. 1987–1992. [Google Scholar] [CrossRef]
- Hamza, L.N.C. A dynamic system approach for radio location fingerprinting in wireless local area networks. In Proceedings of the IEEE 2009 IEEE International Symposium on Intelligent Signal Processing (WISP 2009), Budapest, Hungary, 26–28 August 2009; pp. 253–258. [Google Scholar]
- Chen, Y.C.; Juang, J.C. Outlier-Detection-Based Indoor Localization System for Wireless Sensor Networks. Int. J. Navig. Obs. 2012, 2012, 961785. [Google Scholar] [CrossRef]
- Cheng, R.; Chen, L.; Chen, J.; Xie, X. Evaluating Probability Threshold K-Nearest-Neighbor Queries over Uncertain Data. In Proceedings of the 12th International Conference on Extending Database Technology: Advances in Database Technology (EDBT ’09), Saint Petersburg, Russia, 24–26 March 2009; Association for Computing Machinery: New York, NY, USA, 2009; pp. 672–683. [Google Scholar] [CrossRef]
- Yang, B.; Lu, H.; Jensen, C.S. Probabilistic Threshold k Nearest Neighbor Queries over Moving Objects in Symbolic Indoor Space. In Proceedings of the 13th International Conference on Extending Database Technology (EDBT ’10), Lausanne Switzerland, 22–26 March 2010; pp. 335–346. [Google Scholar] [CrossRef] [Green Version]
- Yang, L.; Chen, H.; Cui, Q.; Fu, X.; Zhang, Y. Probabilistic-KNN: A Novel Algorithm for Passive Indoor-Localization Scenario. In Proceedings of the 2015 IEEE 81st Vehicular Technology Conference (VTC Spring), Glasgow, UK, 11–14 May 2015; pp. 1–5. [Google Scholar] [CrossRef]
- Liu, L.; Li, B.; Yang, L.; Liu, T. Real-Time Indoor Positioning Approach Using iBeacons and Smartphone Sensors. Appl. Sci. 2020, 10, 2003. [Google Scholar] [CrossRef] [Green Version]
- Pelant, J.; Tlamsa, Z.; Benes, V.; Polak, L.; Kaller, O.; Bolecek, L.; Kufa, J.; Sebesta, J.; Kratochvil, T. BLE device indoor localization based on RSS fingerprinting mapped by propagation modes. In Proceedings of the 2017 27th International Conference Radioelektronika (RADIOELEKTRONIKA), Brno, Czech Republic, 19–20 April 2017; pp. 1–5. [Google Scholar] [CrossRef]
- Polak, L.; Rozum, S.; Slanina, M.; Bravenec, T.; Fryza, T.; Pikrakis, A. Received Signal Strength Fingerprinting-Based Indoor Location Estimation Employing Machine Learning. Sensors 2021, 21, 4605. [Google Scholar] [CrossRef] [PubMed]
- Qian, J.; Ma, J.; Ying, R.; Liu, P.; Pei, L. An improved indoor localization method using smartphone inertial sensors. In Proceedings of the International Conference on Indoor Positioning and Indoor Navigation, Montbeliard, France, 28–31 October 2013; pp. 1–7. [Google Scholar] [CrossRef]
- Yang, Z.; Wu, C.; Zhou, Z.; Zhang, X.; Wang, X.; Liu, Y. Mobility Increases Localizability: A Survey on Wireless Indoor Localization Using Inertial Sensors. ACM Comput. Surv. 2015, 47, 1–34. [Google Scholar] [CrossRef]
- Ashraf, I.; Hur, S.; Shafiq, M.; Kumari, S.; Park, Y. GUIDE: Smartphone sensors-based pedestrian indoor localization with heterogeneous devices. Int. J. Commun. Syst. 2019, 32, e4062. [Google Scholar] [CrossRef]
- Ashraf, I.; Hur, S.; Park, Y. Enhancing Performance of Magnetic Field Based Indoor Localization Using Magnetic Patterns from Multiple Smartphones. Sensors 2020, 20, 2704. [Google Scholar] [CrossRef]
- Basiri, A.; Lohan, E.S.; Moore, T.; Winstanley, A.; Peltola, P.; Hill, C.; Amirian, P.; Figueiredo e Silva, P. Indoor location based services challenges, requirements and usability of current solutions. Comput. Sci. Rev. 2017, 24, 1–12. [Google Scholar] [CrossRef] [Green Version]
- Swangmuang, N.; Krishnamurthy, P. Location Fingerprint Analyses toward Efficient Indoor Positioning. In Proceedings of the 2008 Sixth Annual IEEE International Conference on Pervasive Computing and Communications (PerCom), Hong Kong, China, 17–21 March 2008; pp. 100–109. [Google Scholar] [CrossRef]
- Buitinck, L.; Louppe, G.; Blondel, M.; Pedregosa, F.; Mueller, A.; Grisel, O.; Niculae, V.; Prettenhofer, P.; Gramfort, A.; Grobler, J.; et al. API Design for Machine Learning Software: Experiences from the Scikit-Learn Project. 2013, pp. 108–122. Available online: https://hal.inria.fr/hal-00856511/document (accessed on 15 January 2022).
- Pimentel, M.A.; Clifton, D.A.; Clifton, L.; Tarassenko, L. A review of novelty detection. Signal Process. 2014, 99, 215–249. [Google Scholar] [CrossRef]
- Markou, M.; Singh, S. Novelty detection: A review—Part 1: Statistical approaches. Signal Process. 2003, 83, 2481–2497. [Google Scholar] [CrossRef]
- Miljković, D. Review of novelty detection methods. In Proceedings of the 33rd International Convention MIPRO, Opatija, Croatia, 24–28 May 2010; pp. 593–598. [Google Scholar]
- Sayyed, S.; Deolekar, R. A survey on novelty detection using level set methods. In Proceedings of the 2017 International Conference on Inventive Communication and Computational Technologies (ICICCT), Coimbatore, India, 10–11 March 2017; pp. 415–418. [Google Scholar] [CrossRef]
- Ding, X.; Li, Y.; Belatreche, A.; Maguire, L.P. An experimental evaluation of novelty detection methods. Neurocomputing 2014, 135, 313–327. [Google Scholar] [CrossRef]


Publisher’s Note: MDPI stays neutral with regard to jurisdictional claims in published maps and institutional affiliations. |
© 2022 by the authors. Licensee MDPI, Basel, Switzerland. This article is an open access article distributed under the terms and conditions of the Creative Commons Attribution (CC BY) license (https://creativecommons.org/licenses/by/4.0/).