
Multi-Attribute Decision Making for Energy-Efficient Public Transport Network Selection in Smart Cities


Abstract
:1. Introduction
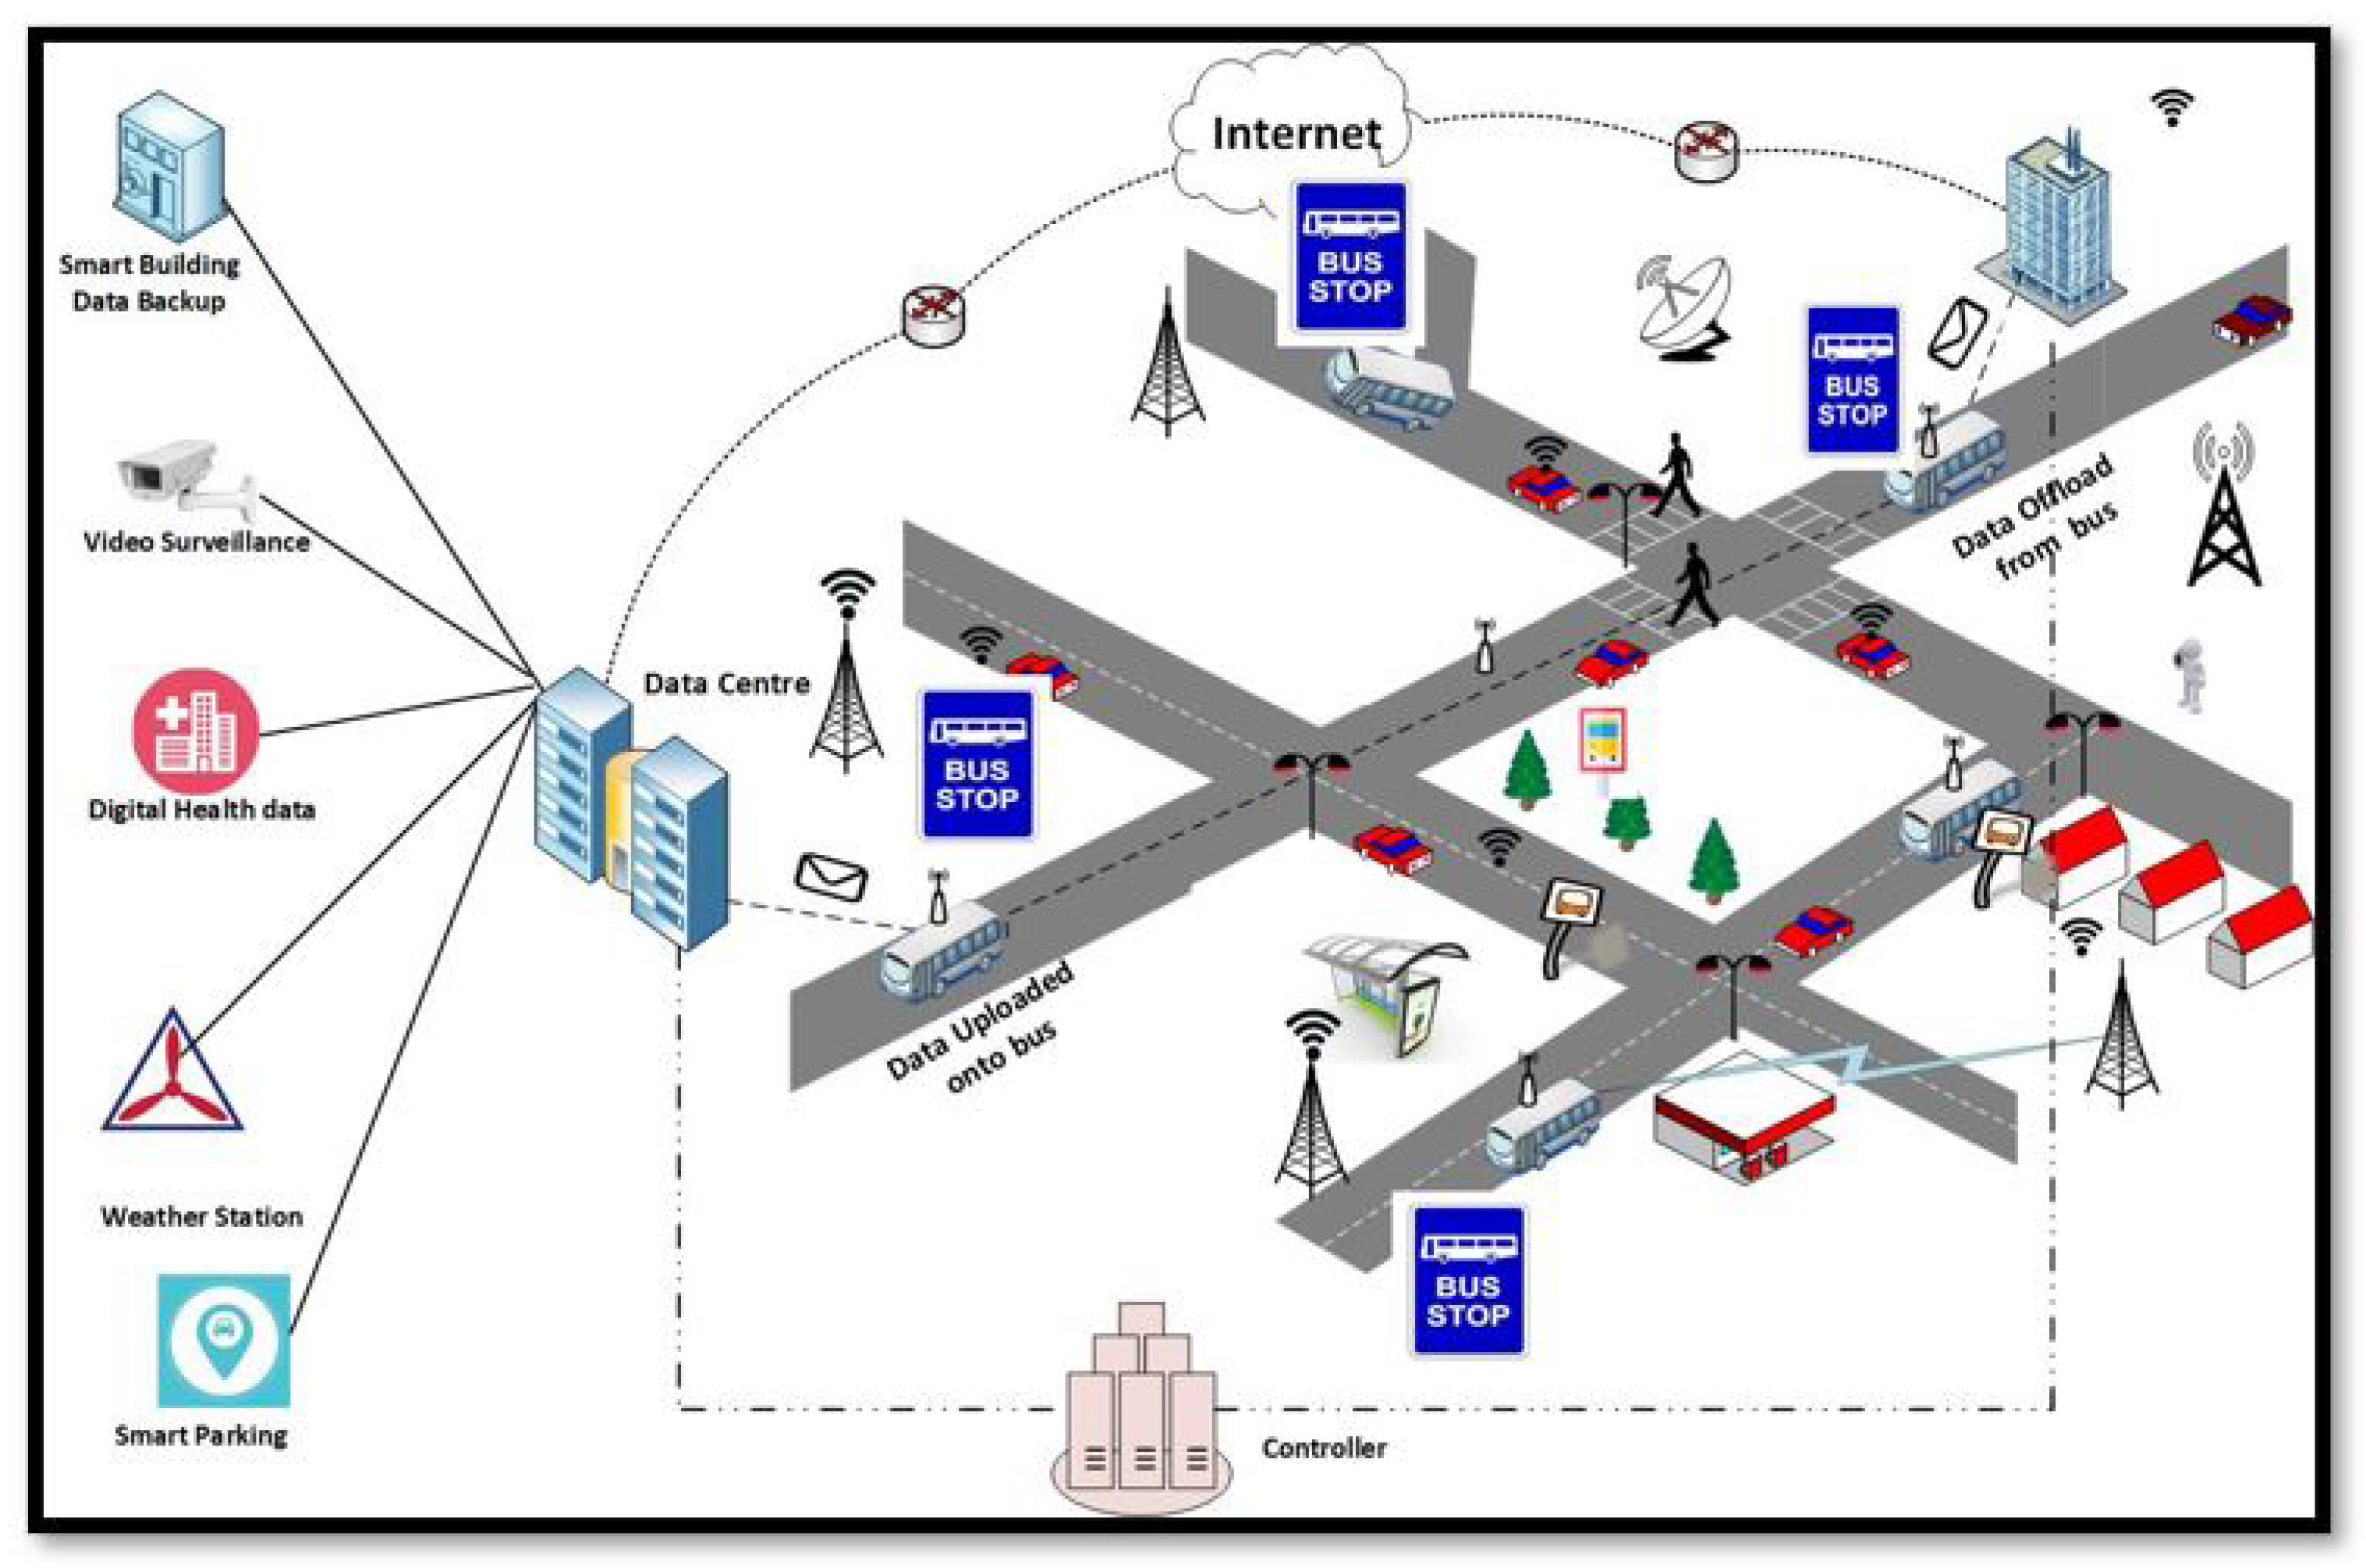
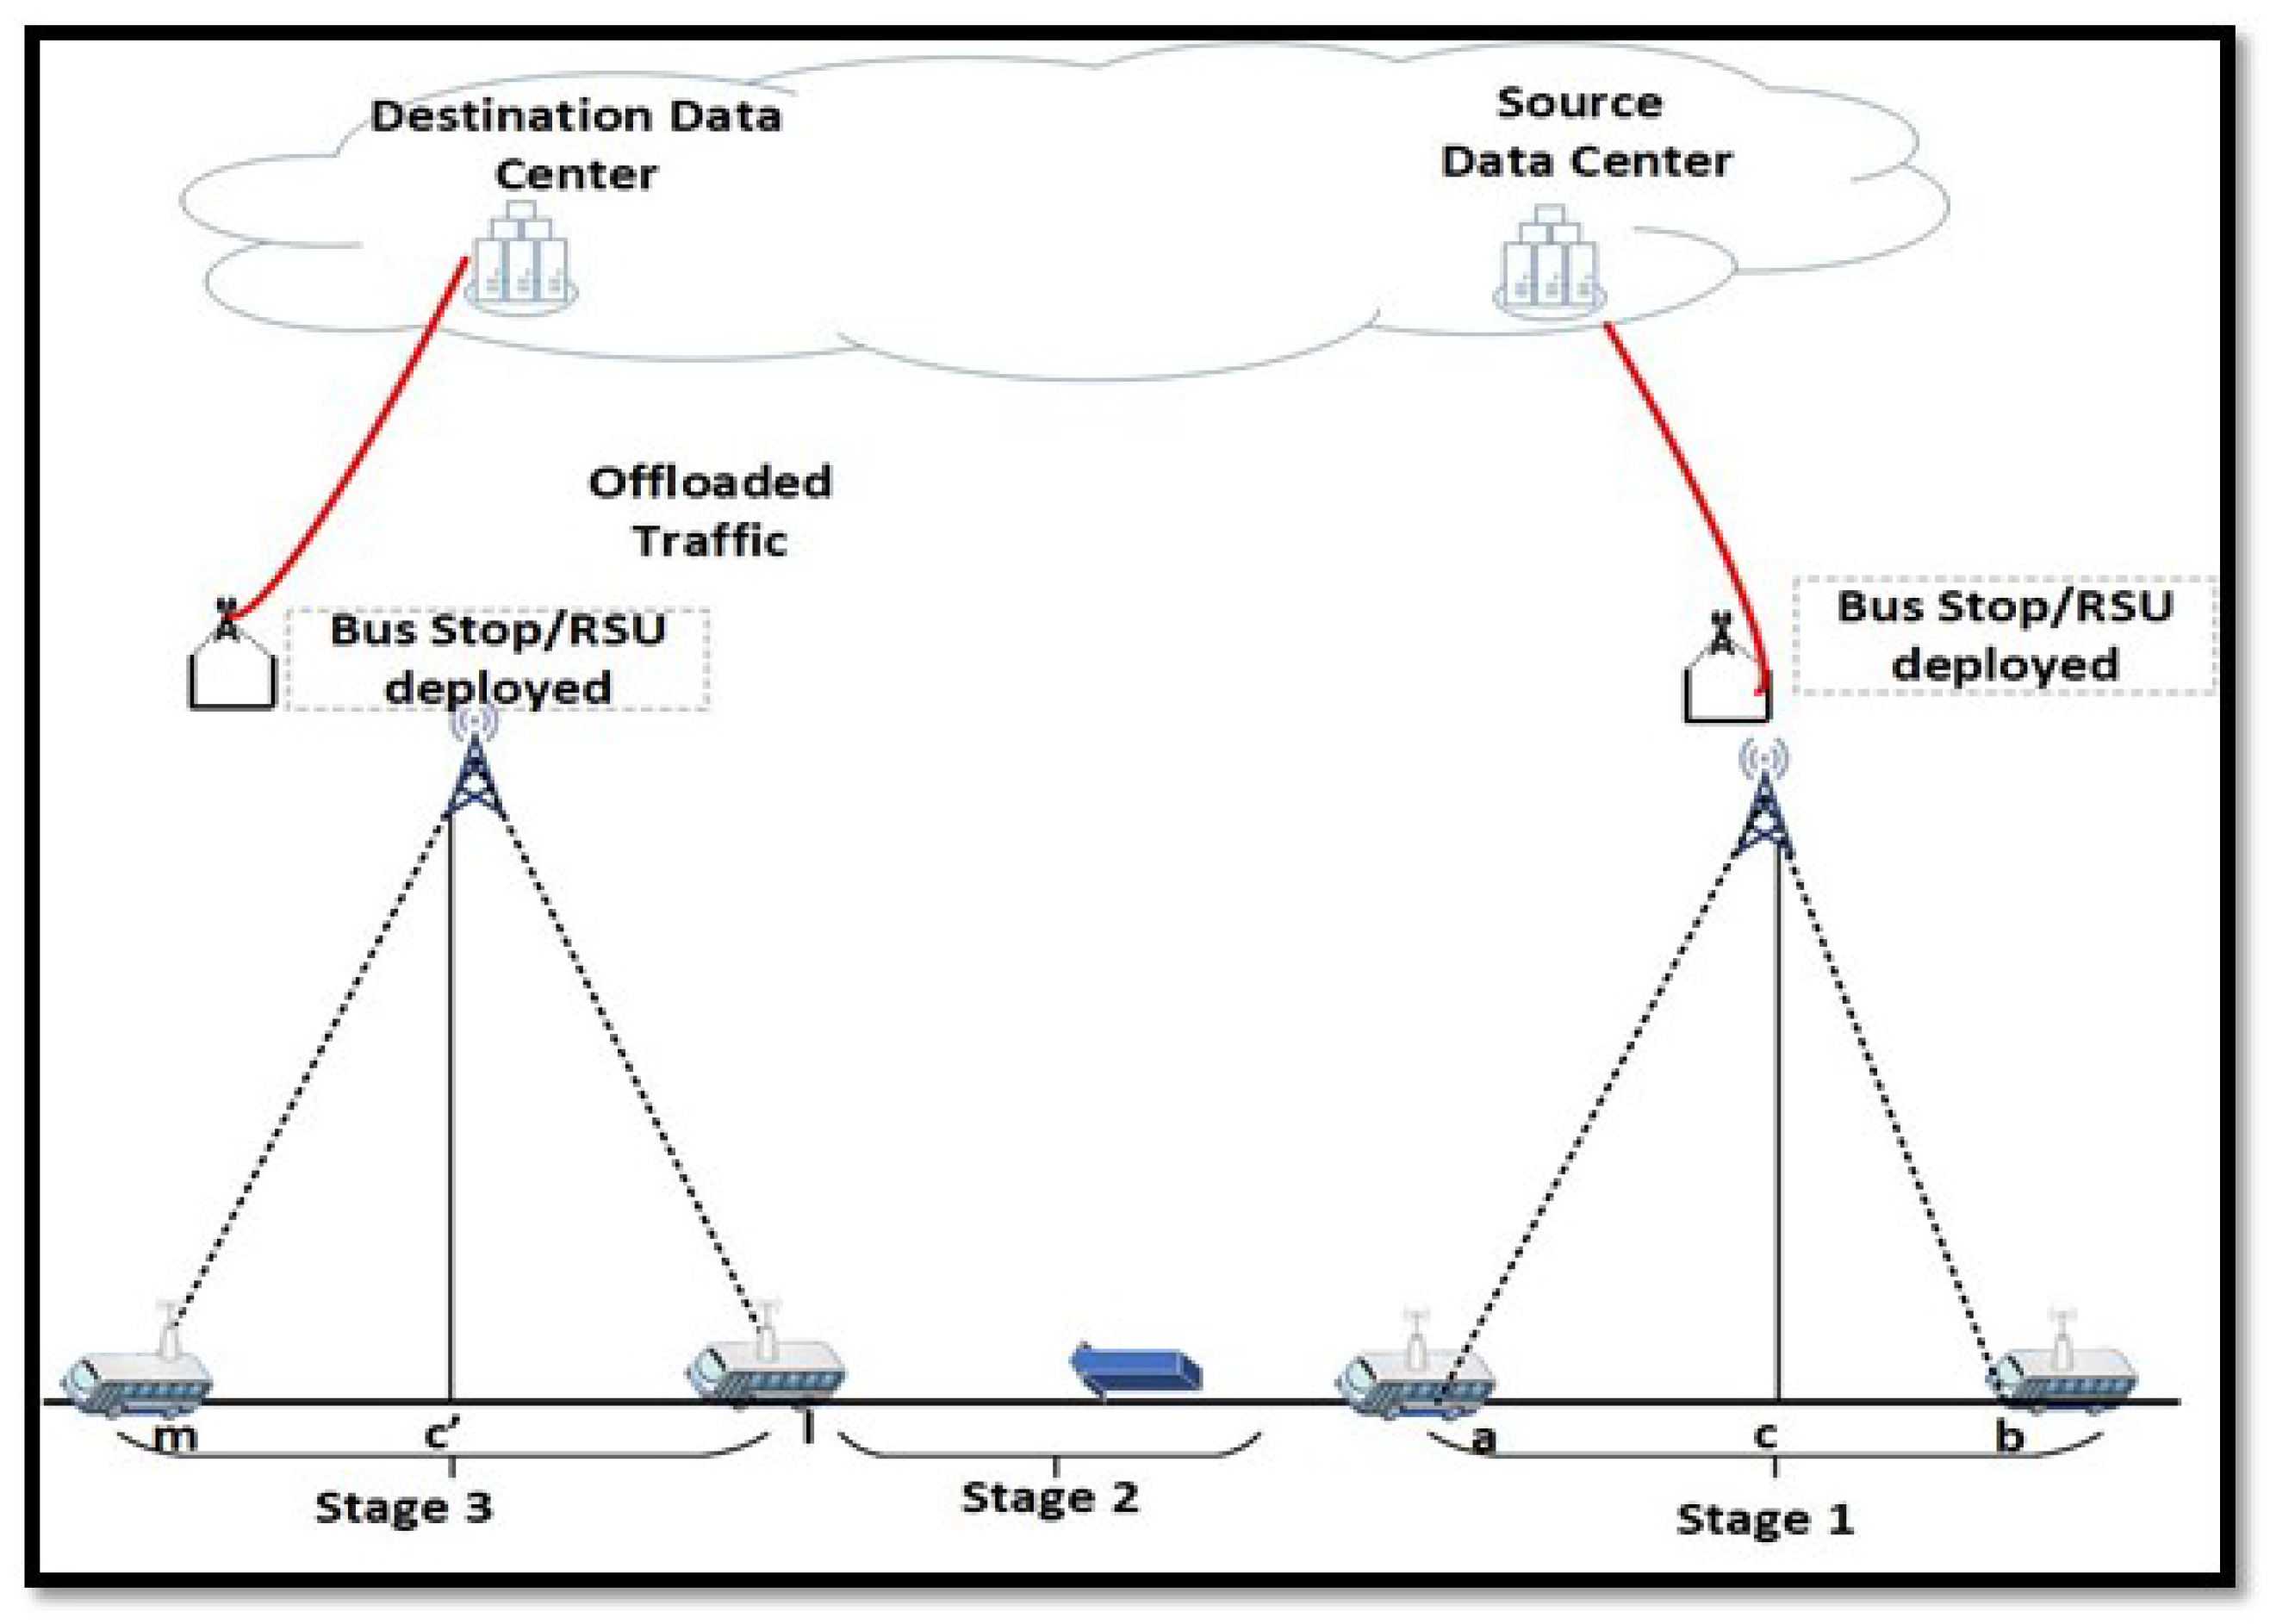
- We designed the Public Transport-Assisted Data-Dissemination (PTDD) System in a smart city which will be equipped with wireless sensors and data centers to handle massive data using wired, wireless, and public transport networks;
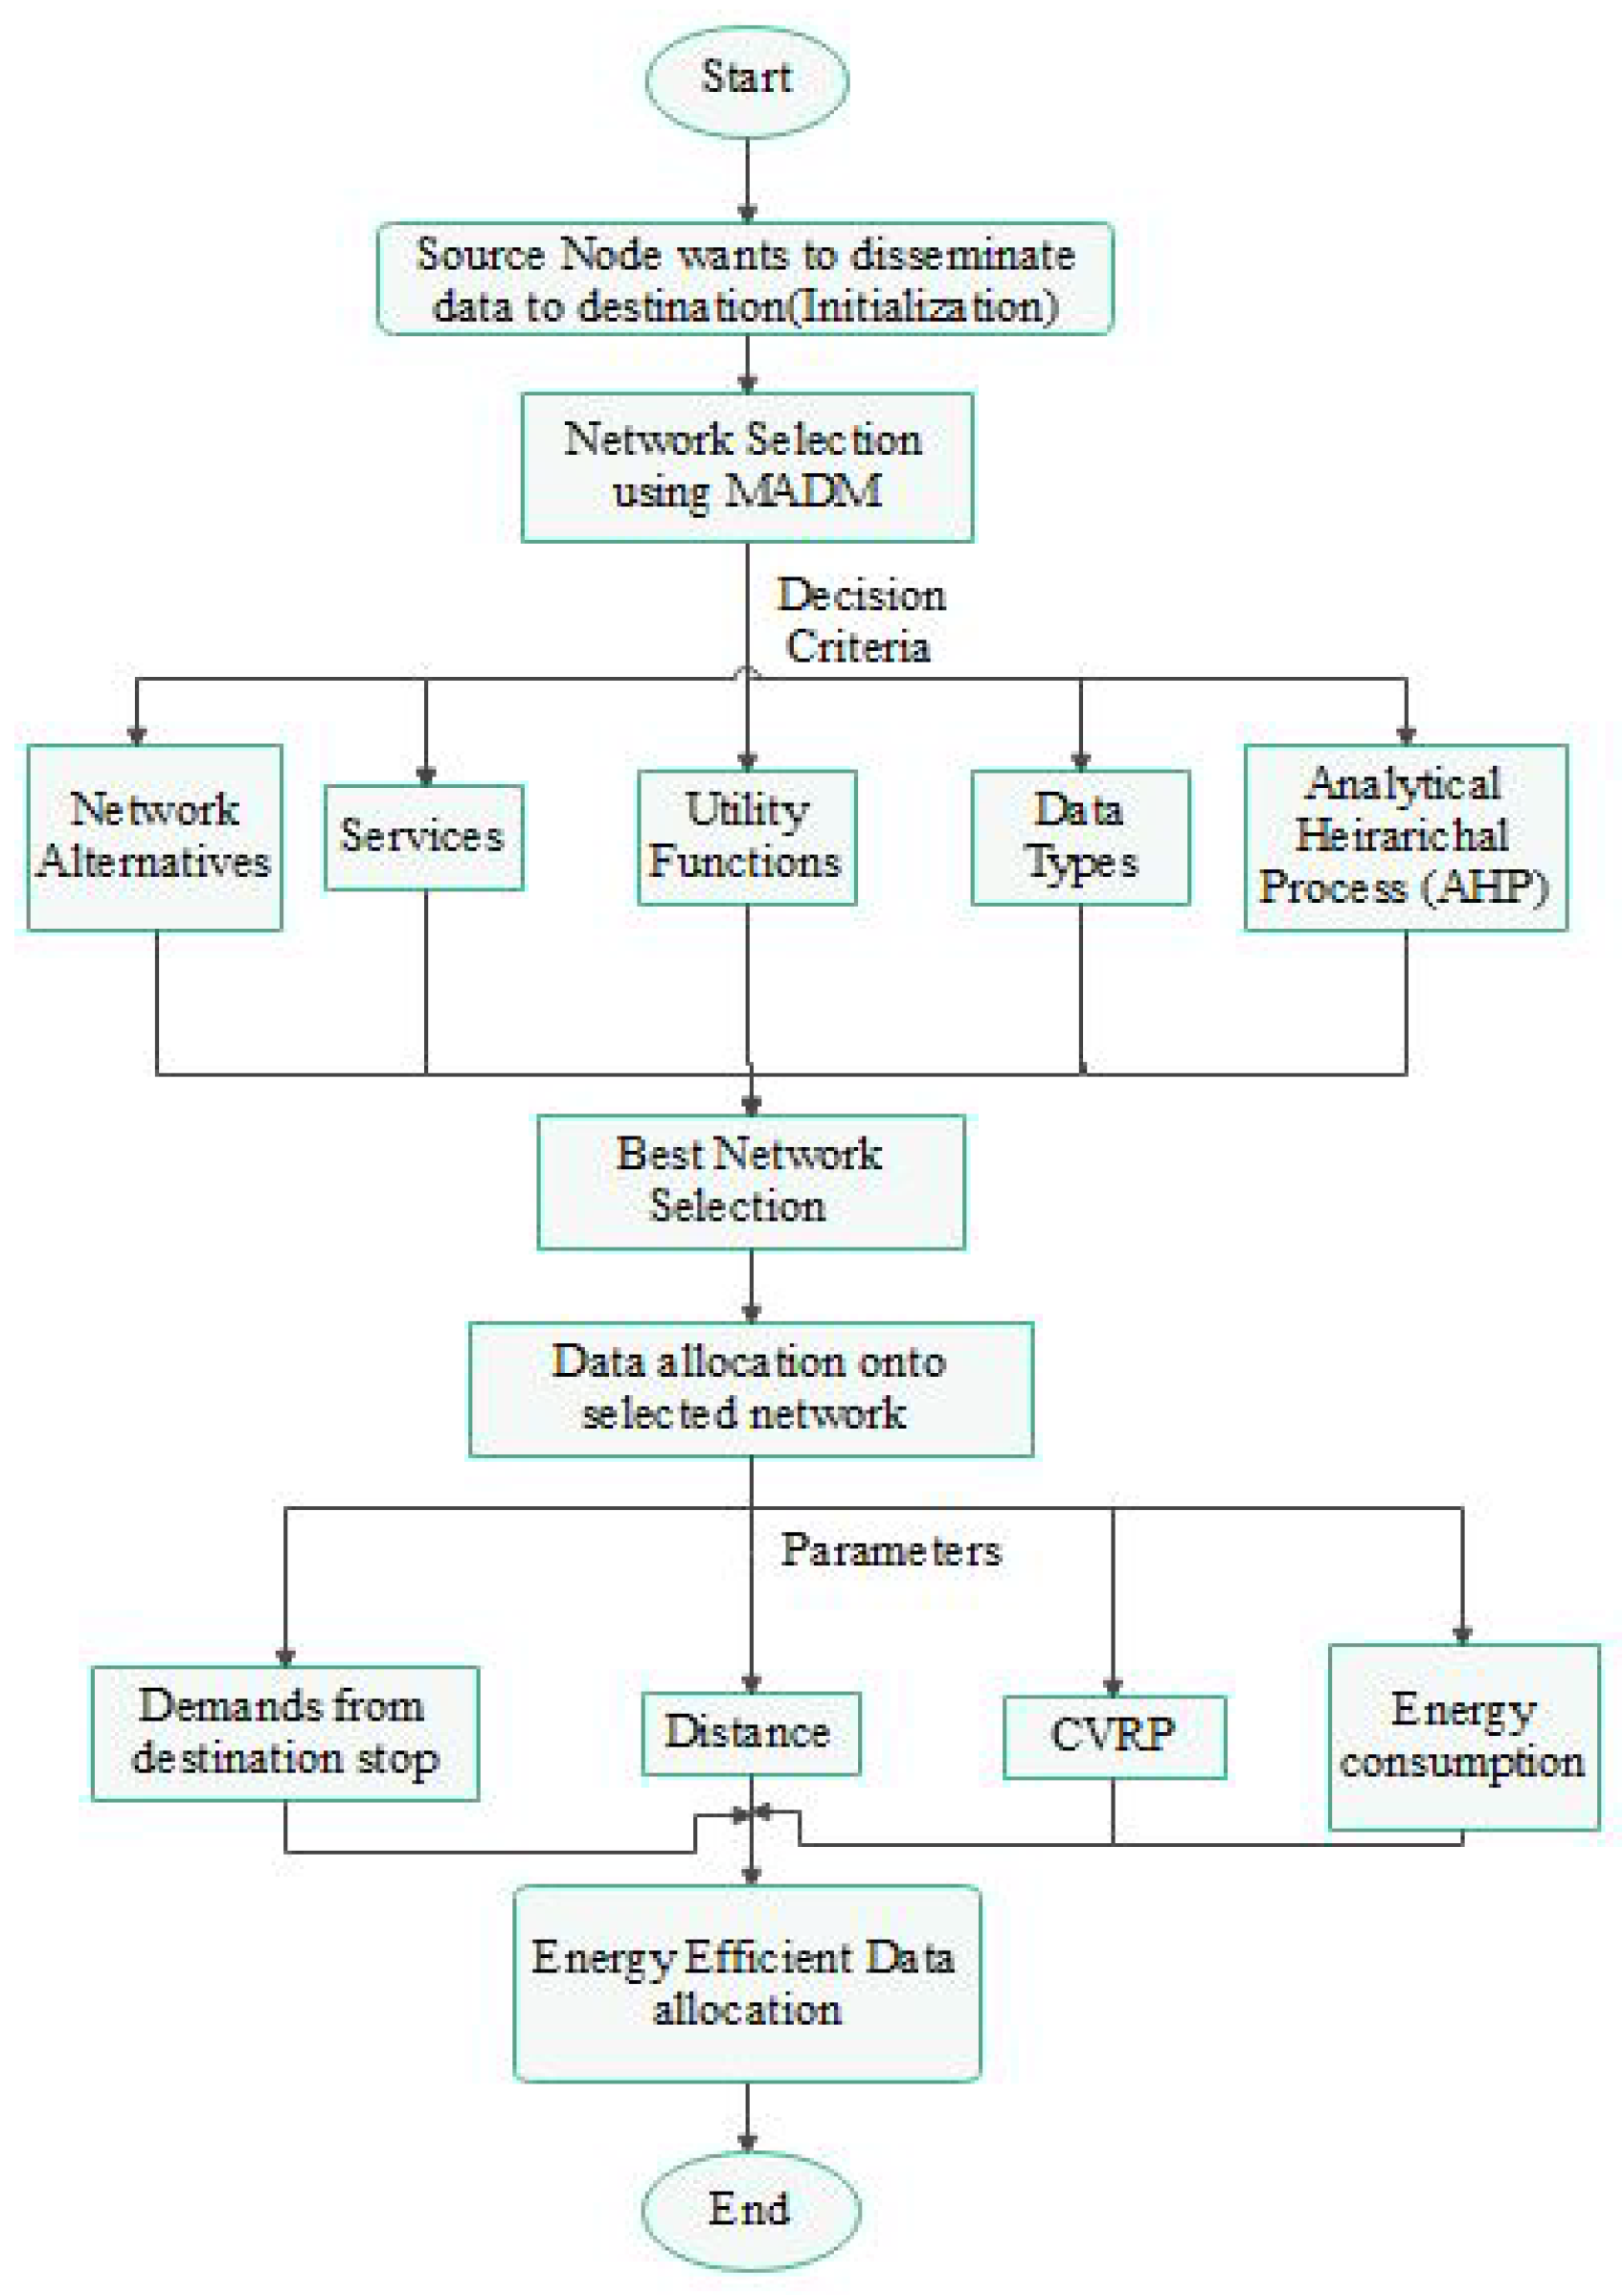
- We applied a Multi-Attribute Decision making (MADM) algorithm for best network selection based upon different user requirements and different attributes;
- We applied the Capacitated Vehicle Routing Problem (CVRP) to minimize energy consumption using public transport as a data carrier. We will use buses to offload the entire set of demands of each bus stop. Our model constrains the objective by the maximum capacity of the bus;
- For the evaluation of the best network selection, different services are considered, based upon user requirements, to find the best network in the heterogeneous network. Next, a detailed comparative analysis of energy consumption is performed for traditional and public transport networks for the various demands of users.
2. Related Work
3. Public Transport-Assisted Data-Dissemination System
3.1. Multi-Attribute Decision Making
- (a)
- Alternatives: Alternatives are defined as several different options to prioritize or select. These can be called candidates, users, or networks, etc.;
- (b)
- Decision Matrix: Any MADM problem can be mathematically defined by using a decision matrix, :where denotes all the alternatives/parameters to consider for decision making. represents all N criteria, which is being calculated as per different alternatives and denotes its performance. For example, is the performance ranking of the ith alternative w.r.t. to the jth alternative. The main aim of the decision matrix is to select the best alternative from the given alternatives with respect to others;
- (c)
- Attribute Weight: Attribute weight is the value obtained by the decision-maker as per each attribute of the network. This weight depends upon the value assigned to the attribute. This weight is calculated by the pairwise comparison matrix;
- (d)
- Normalization: The attribute used for network selection has different measurement units. Therefore, normalization is a necessary step for this calculation.
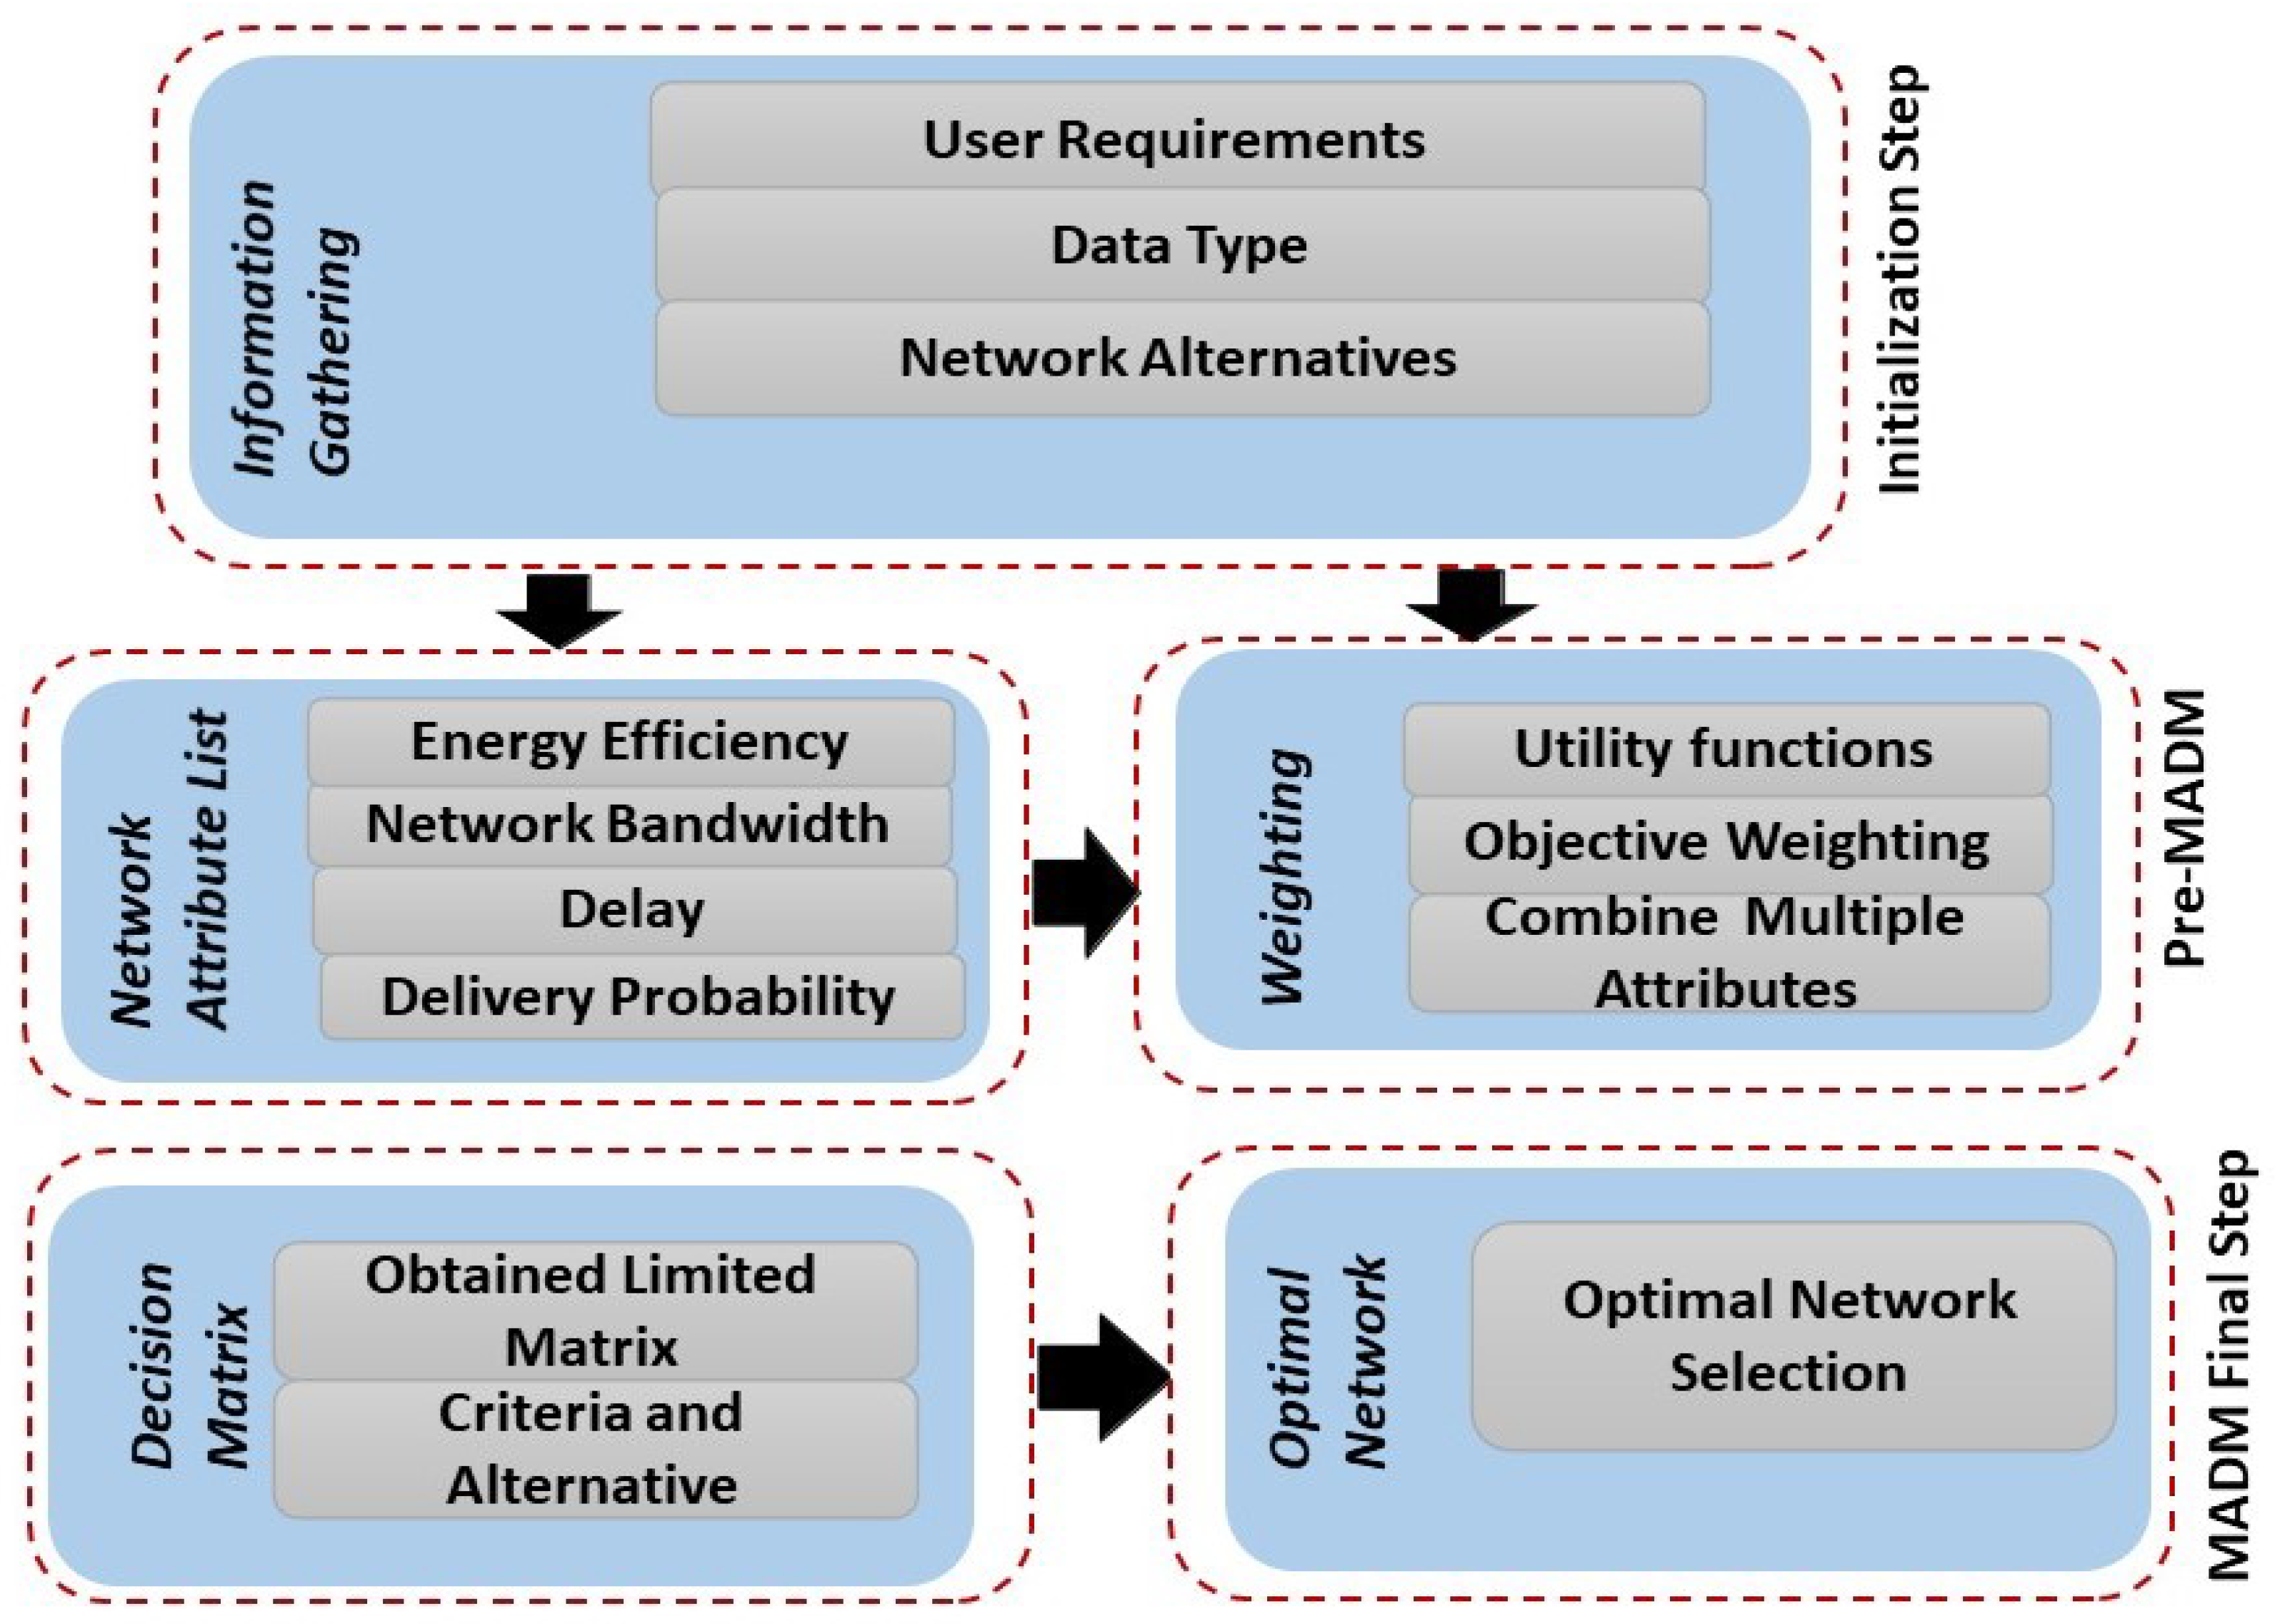
3.1.1. Initialization Step
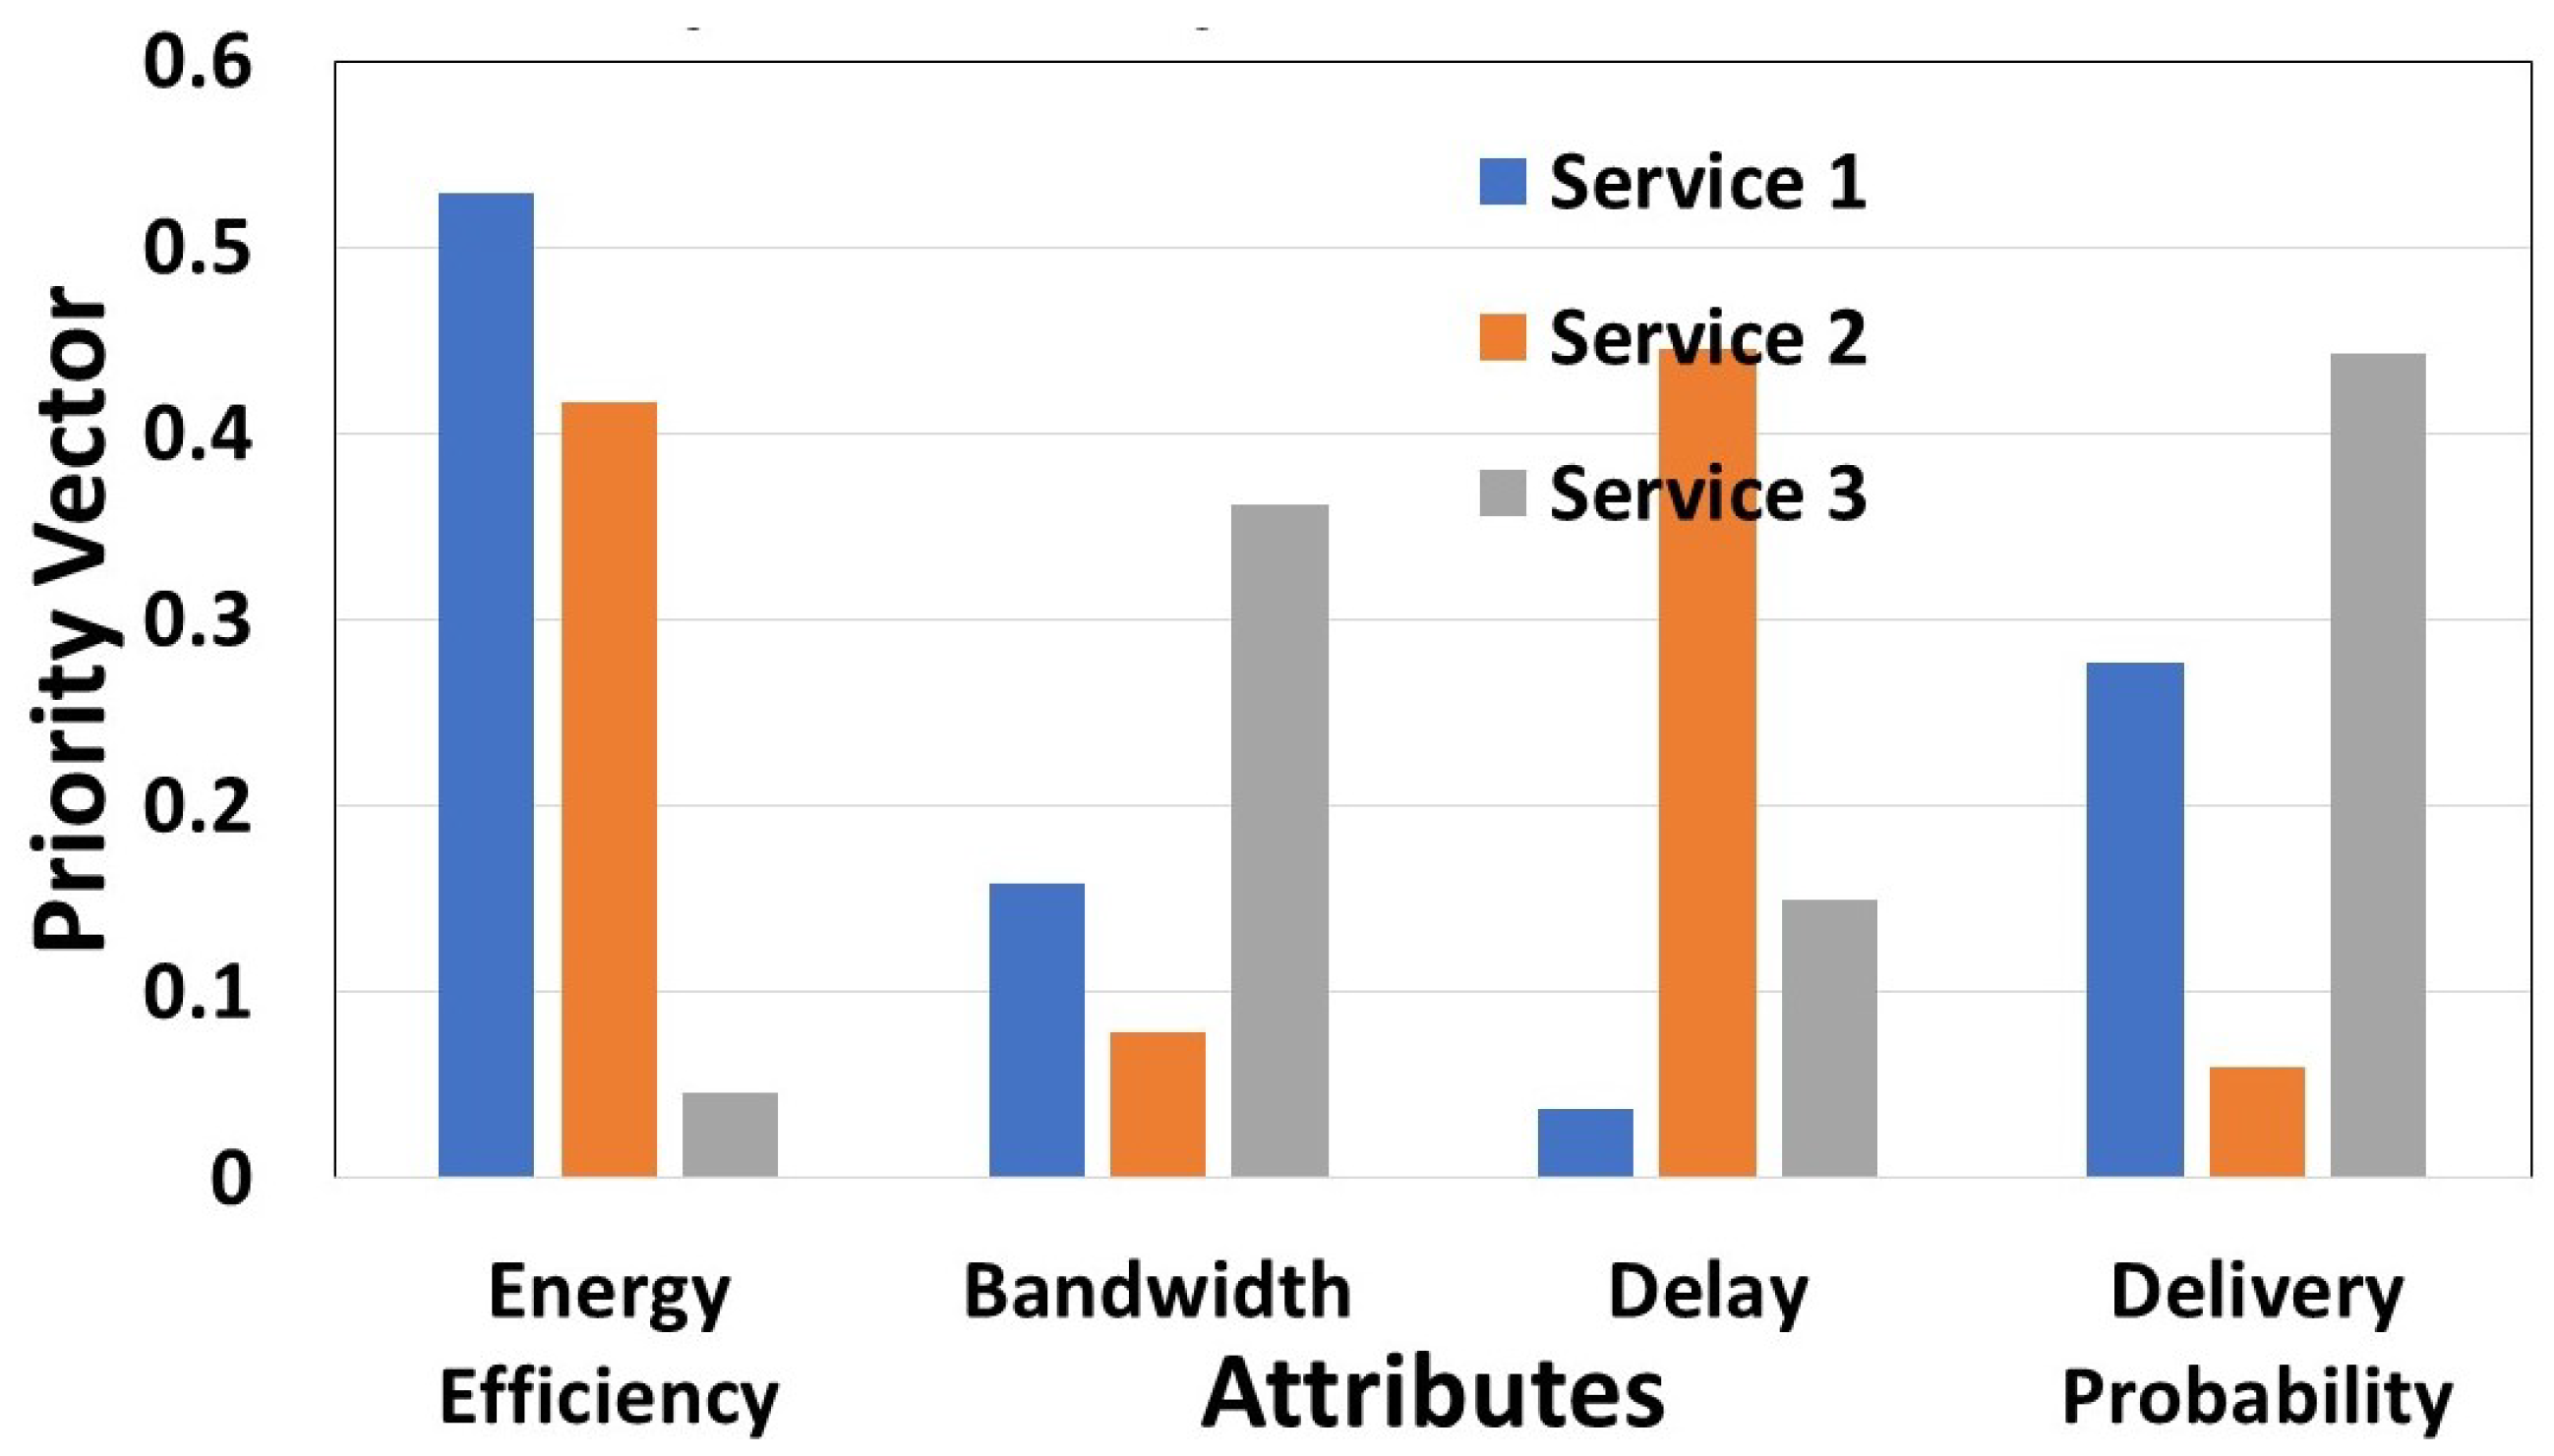
- Service’s Requirement: The most important aspect is the user’s requirements. For different users, they have different demands and objectives. In our proposed system, we categorize users’ requirements into three categories, such as Service 1, Service 2, and Service 3. Different services have different levels of sensitivity to the same networking attribute. For example, considering bandwidth as an attribute, if its service 1, a lower bandwidth will be used. However, if it is a large data transfer, a higher bandwidth will be used. In addition to that, it is assumed that a user can select any one service at one time. Users can select the priority of services used. They can select the urgency or non-urgency of data delivery, which relates to the data type, such as delay-tolerant or delay-sensitive, and helps the controller to make optimal network-selection decisions;
- Data Type: Data types belong to the type of application selected by users. It can be delay-tolerant or delay-sensitive. Some of the services, such as video or data type, can be categorized as a real-time or non-real-time application and can, accordingly, be delayed for some time. This is another important piece of information to consider for optimal network selection;
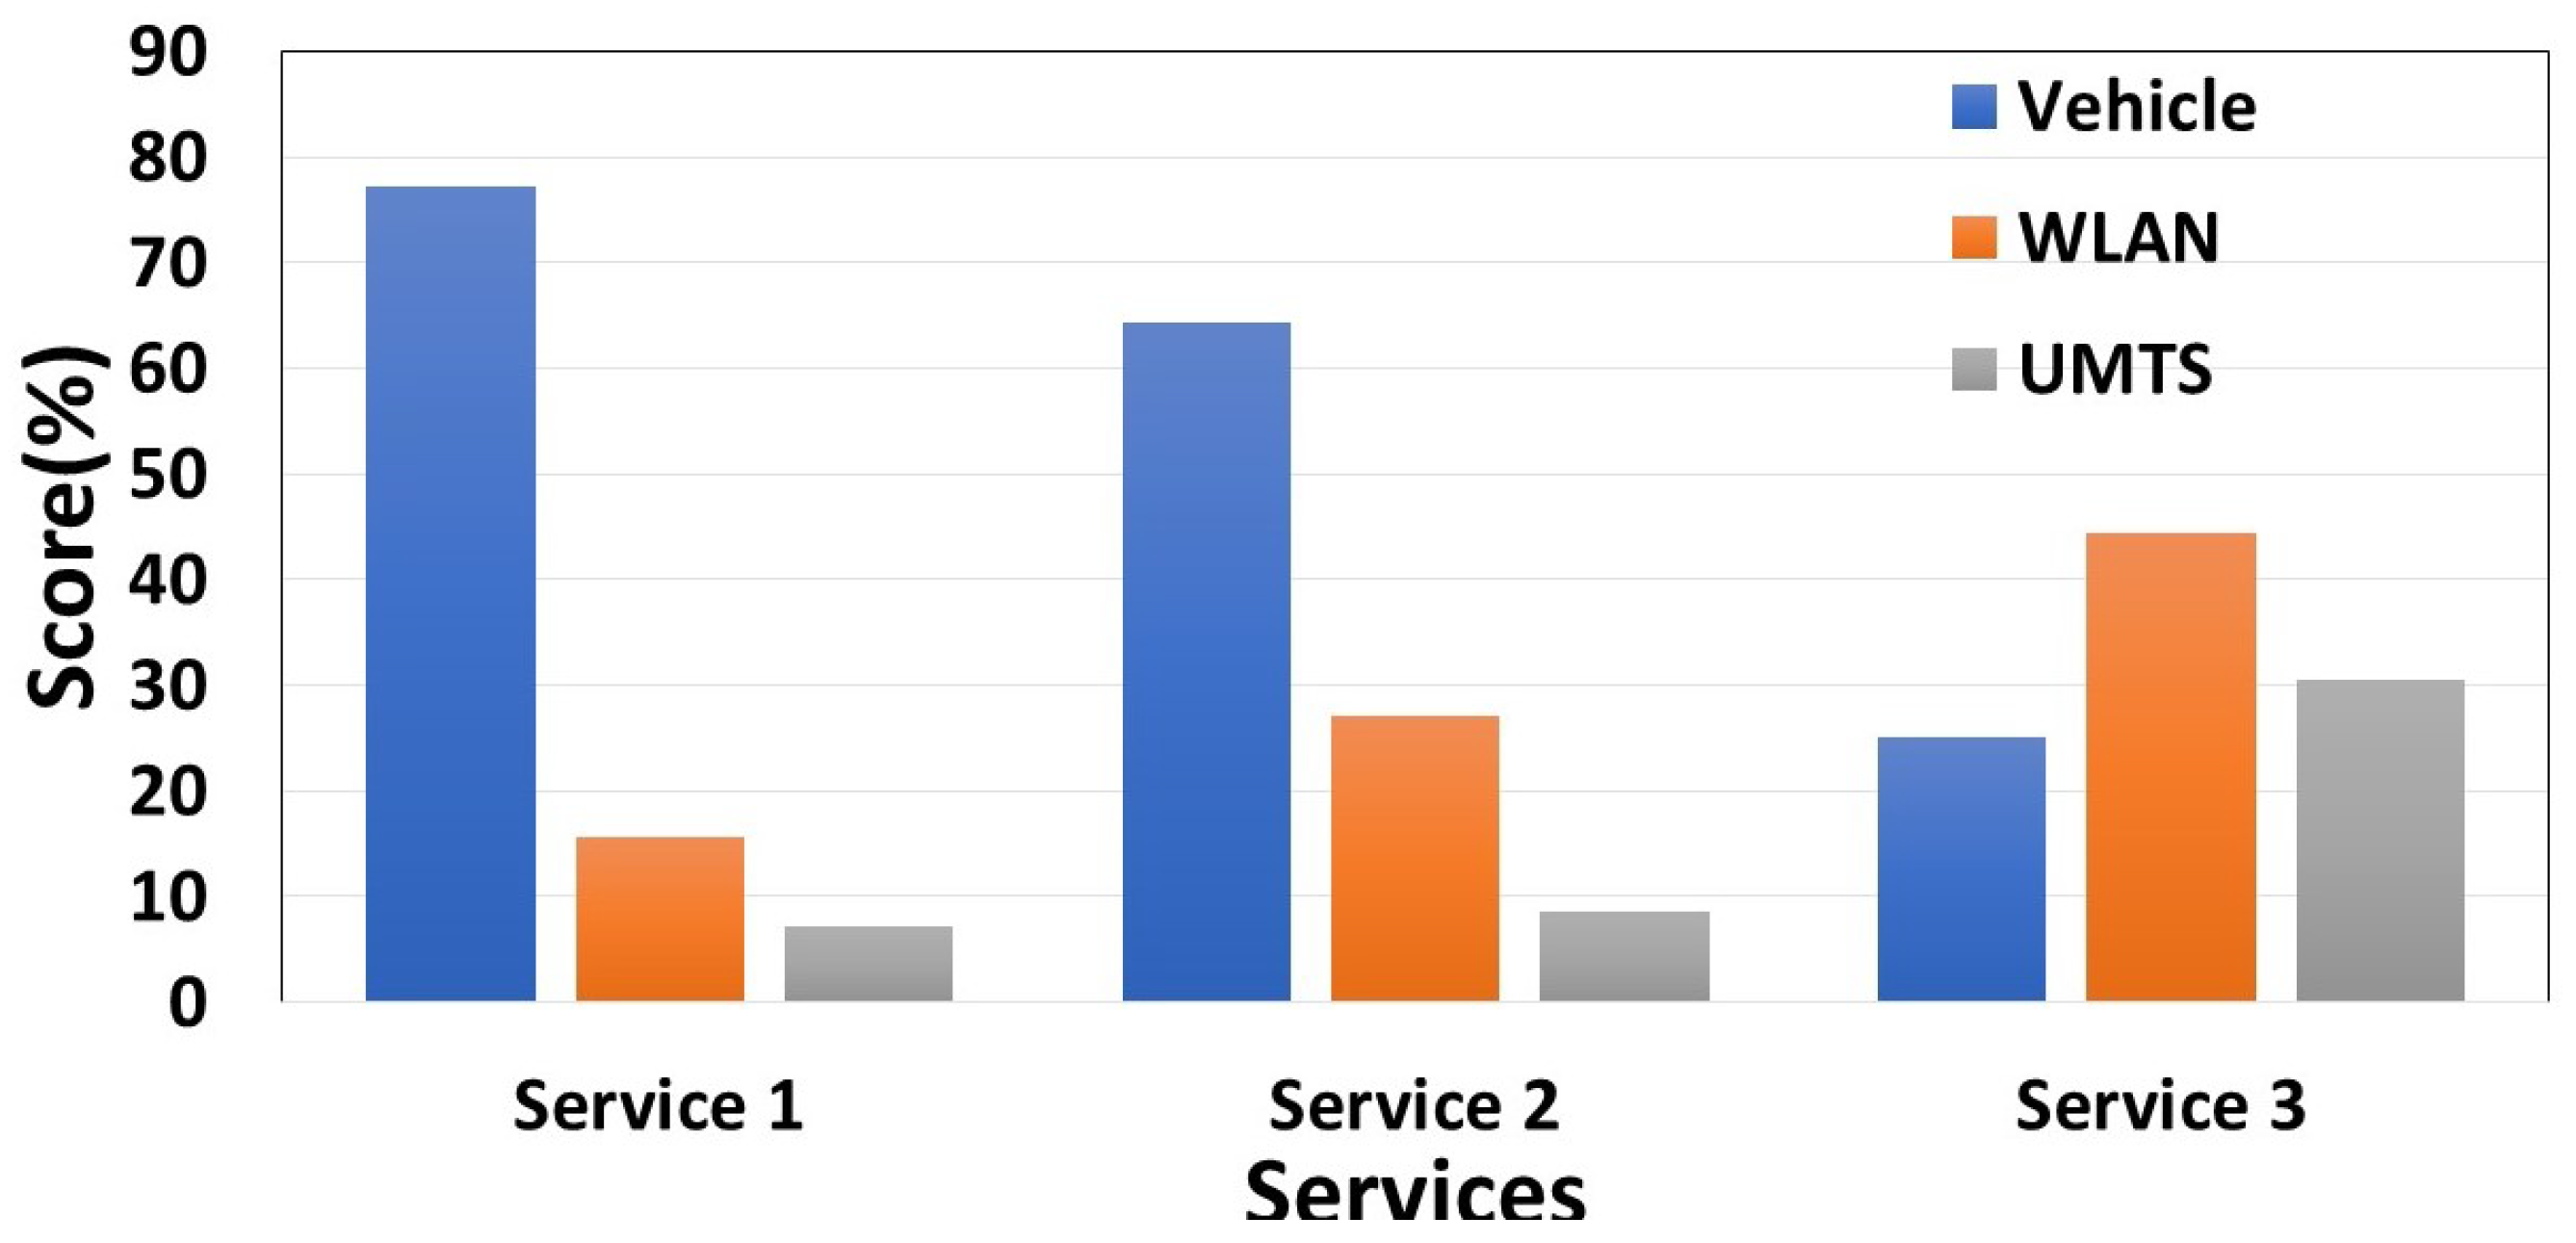
- Network Alternatives: In our proposed work, we are demonstrating the offloading of data from traditional networks to road networks with delay-tolerant conditions. Therefore, to choose among a list of networks, we will be considering WLAN, UMTS, and Vehicular Networks. The controller will choose the best optimal network among these networks based upon user requirements and data type. Three of these networks have different properties. The vehicular network is used for all delay-tolerant applications, such as emails, data backup, video download, and photos, which significantly contribute to energy efficiency without a negative effect on user satisfaction. We assume that all vehicles are equipped with On-Board Units (OBU) to carry data. If we compare the other two networks, WLAN networks are managed for higher bandwidths and lower delay applications, although UMTS networks are the most energy-efficient with lower bandwidth requirements and large delays.
3.1.2. Pre-MADM
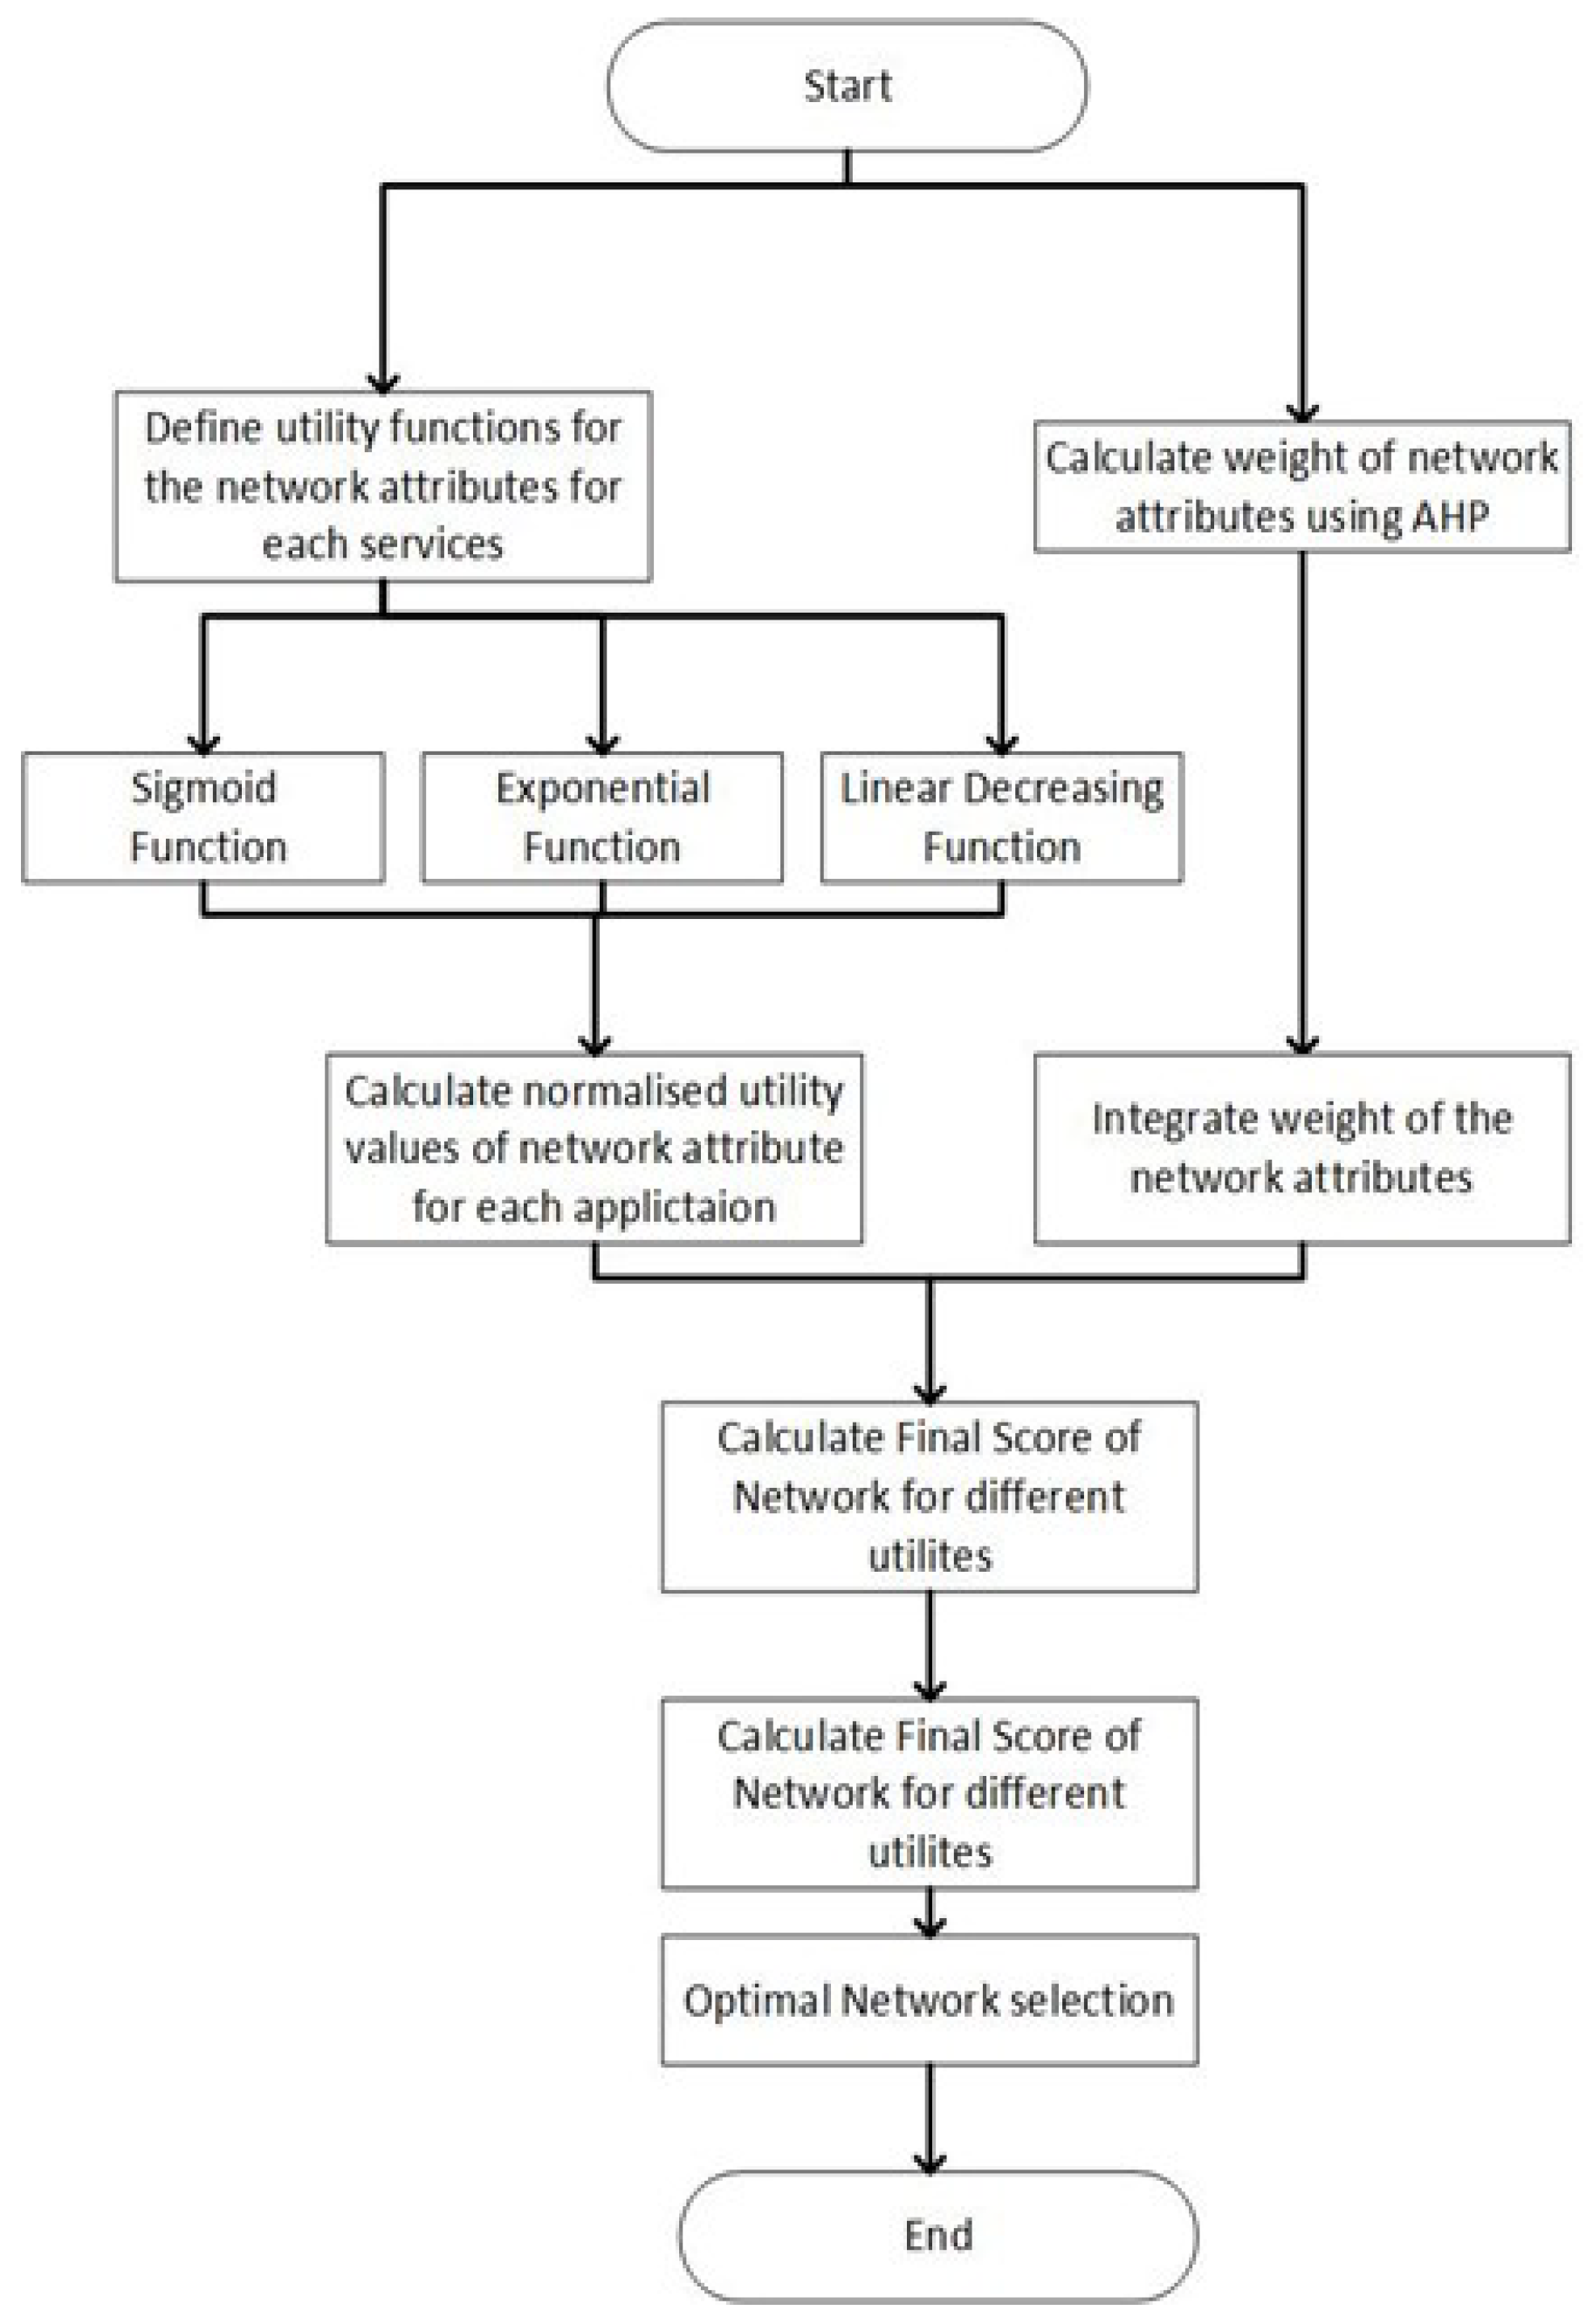
- Utility function—theory-based network:Utility functions measure the level of satisfaction for each user as per different attributes of each network alternative. We design utility functions to map decision factors to the respective utility metrics in order to evaluate the decision factors of network selection. We consider user requirements as per their profile, delay-tolerant indicator (DTI), both network properties, and QoS requirements. There are generally three types of utility functions that network selection uses: (1) sigmoid; (2) monotonically increasing; (3) linearly decreasing. These functions are further categorized as beneficial or non-beneficial criteria. The sigmoid utility function is used with given minimum and maximum requirements. Bandwidth and energy efficiency are beneficial criteria and can be represented as a sigmoid function. The utility theory states that utility functions must satisfy twice differentiability, monotonicity, and concavity–convexity [37]. Therefore, we design different utility functions for different objectives. The value of the utility function lies between 0 and 1. For the most satisfied user, it is 1, and for the least satisfied user, it counts as 0.
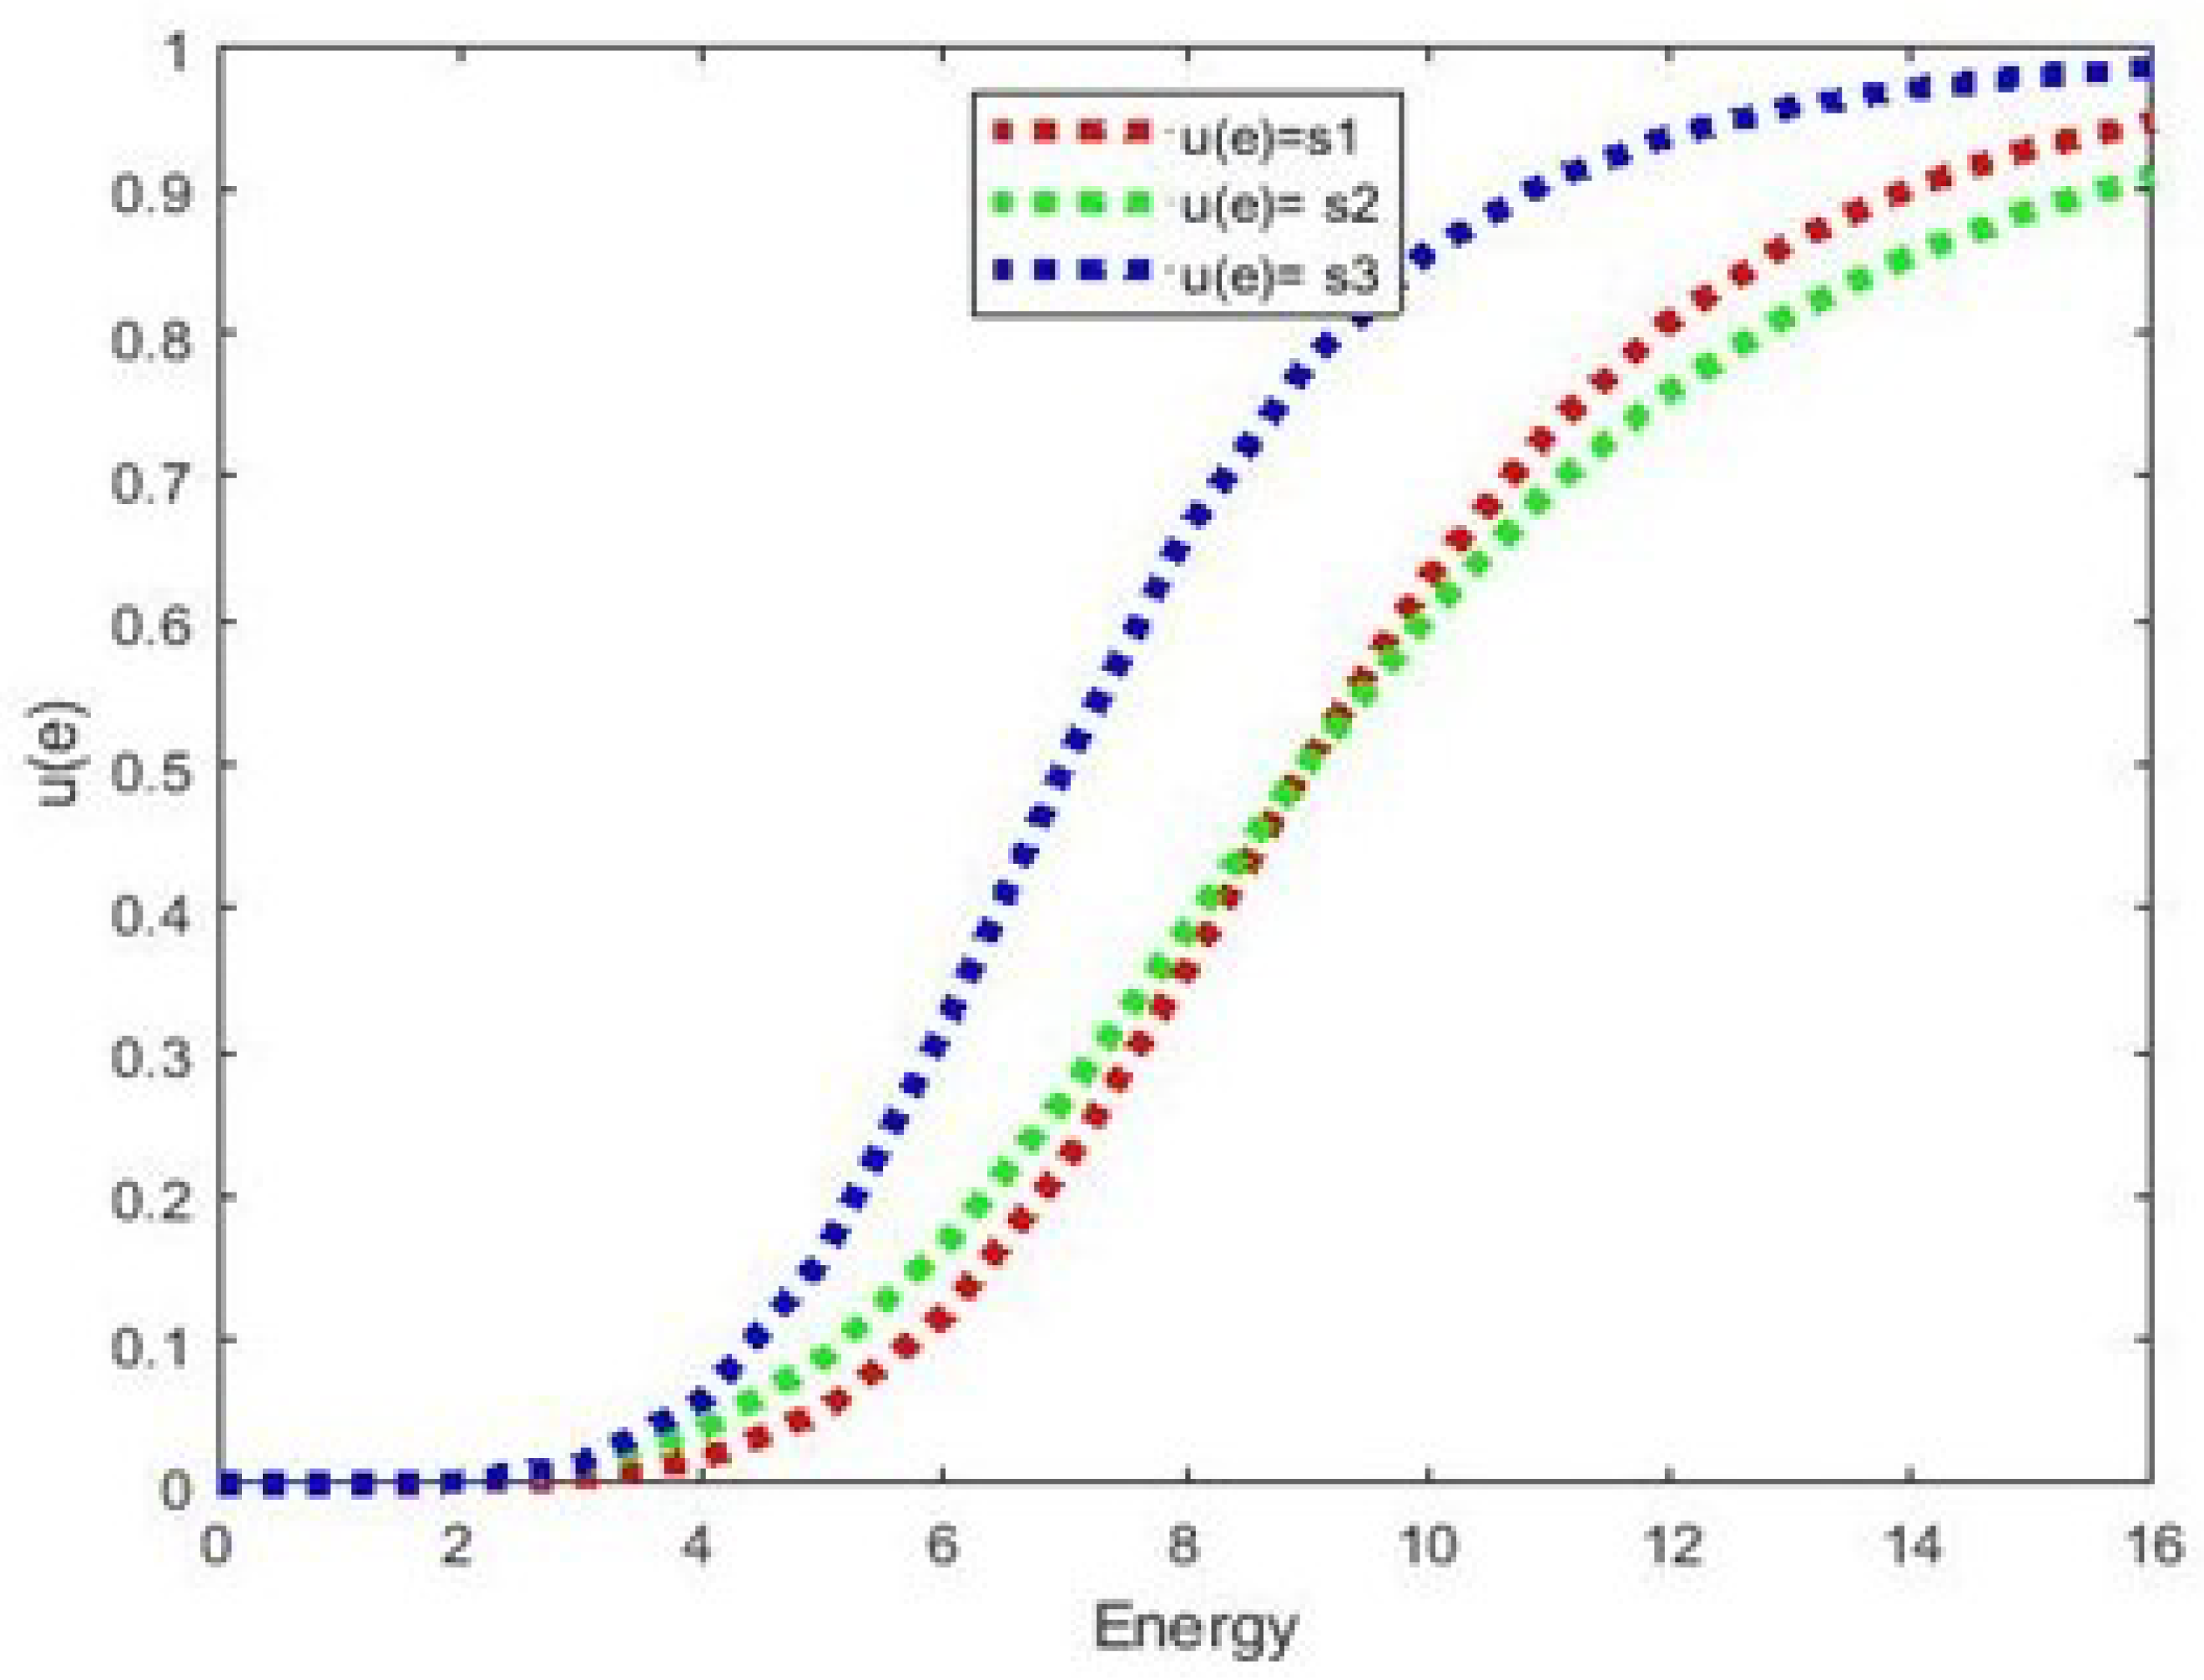
- Utility function for Energy Efficiency EE: In this utility function, EE, as discussed, is a beneficial criterion, and the energy-efficient utility function will be modeled as a sigmoid curve. The sigmoidal utility function is defined below:where and e represent the average network energy efficiency and network energy efficiency; x is used as a constant value that is always greater than zero . The notation c is used to denote the sensitivity of network attributes affecting energy efficiency. The utility function for EE is plotted in Figure 5; we can make sure that the utility function is monotonic and concave–convex. In physical terms, Equation (2) is the result of a higher network energy efficiency, with e translating into a larger utility function, , resulting in a more preferred network.
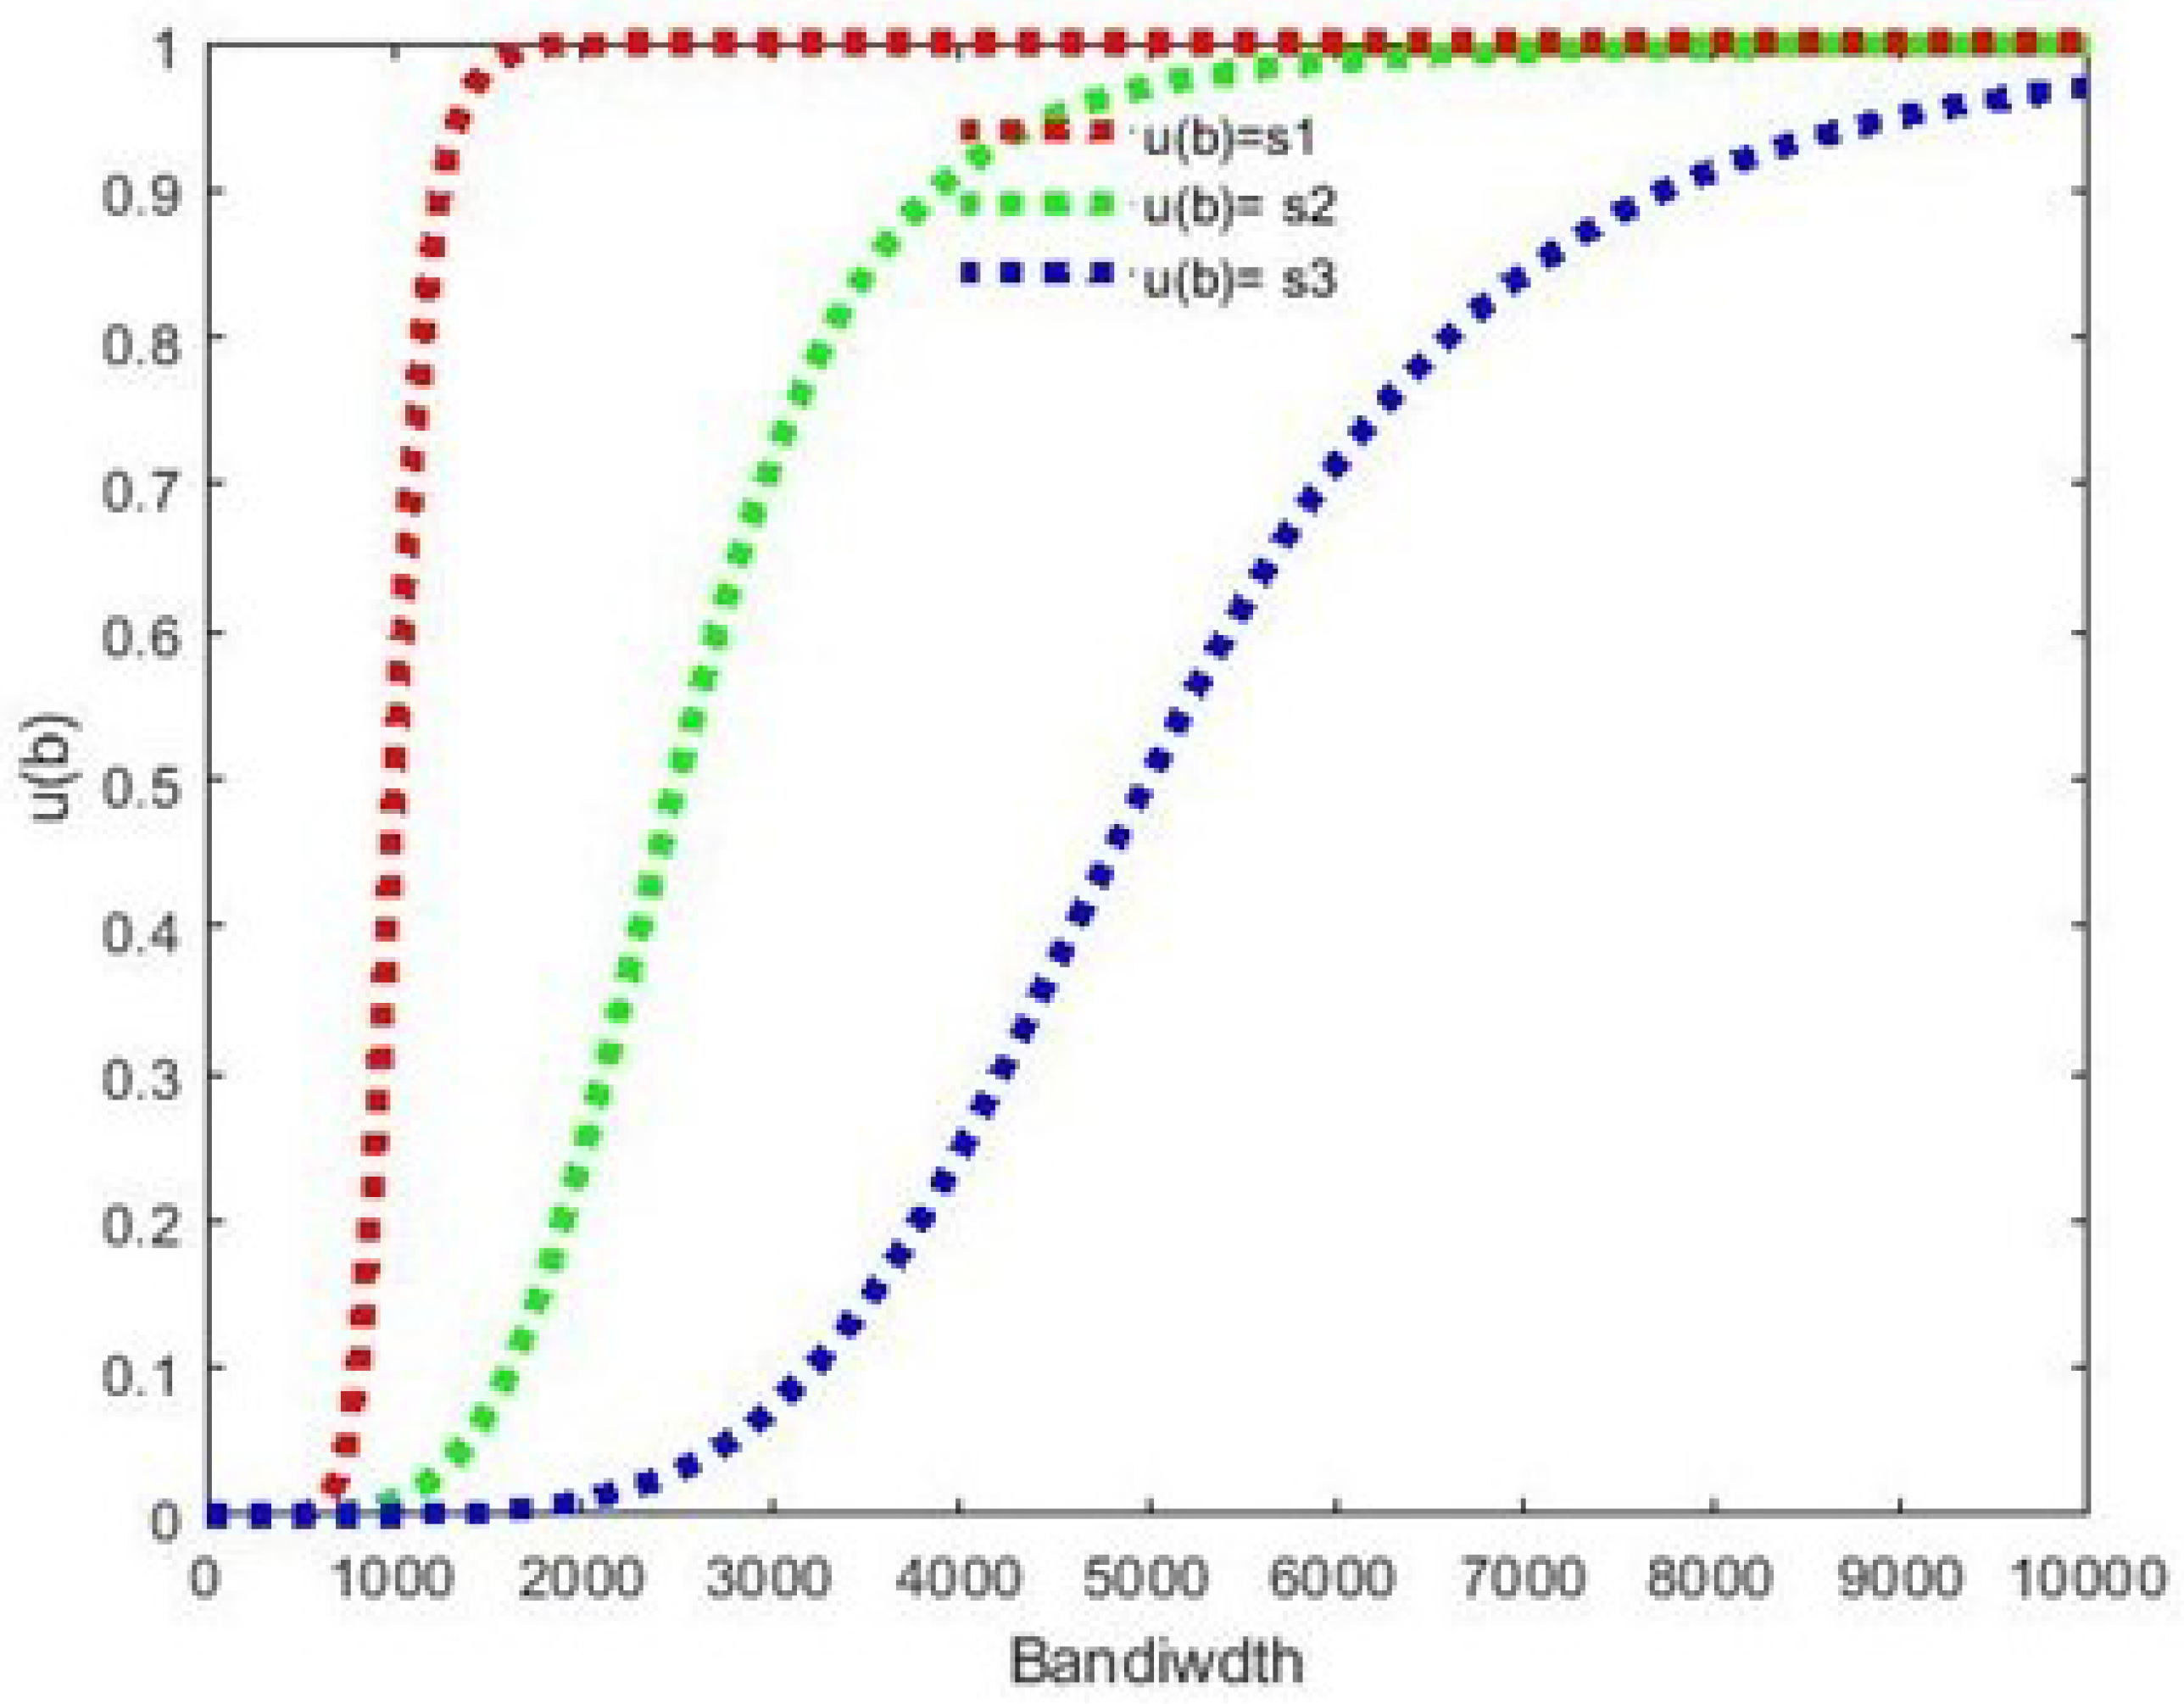
- Utility function for Network Bandwidth: Network Bandwidth is an important attribute for network selection. For three of these networks, the network bandwidth has a different value. When the network bandwidth is lower than the required bandwidth, as per different service requirements, then there is a compromise in QoS, and there will be a loss of packets. We are using the following utility function to define bandwidth requirements for different applications:where and define the minimum and maximum bandwidths of each network. In addition, b is the actual bandwidth required by the user, as per the services required. This is the same as an energy utility function. All the utility functions fulfill the conditions of being is twice differentiable, monotonic, and concave–convex, as shown in Figure 6.
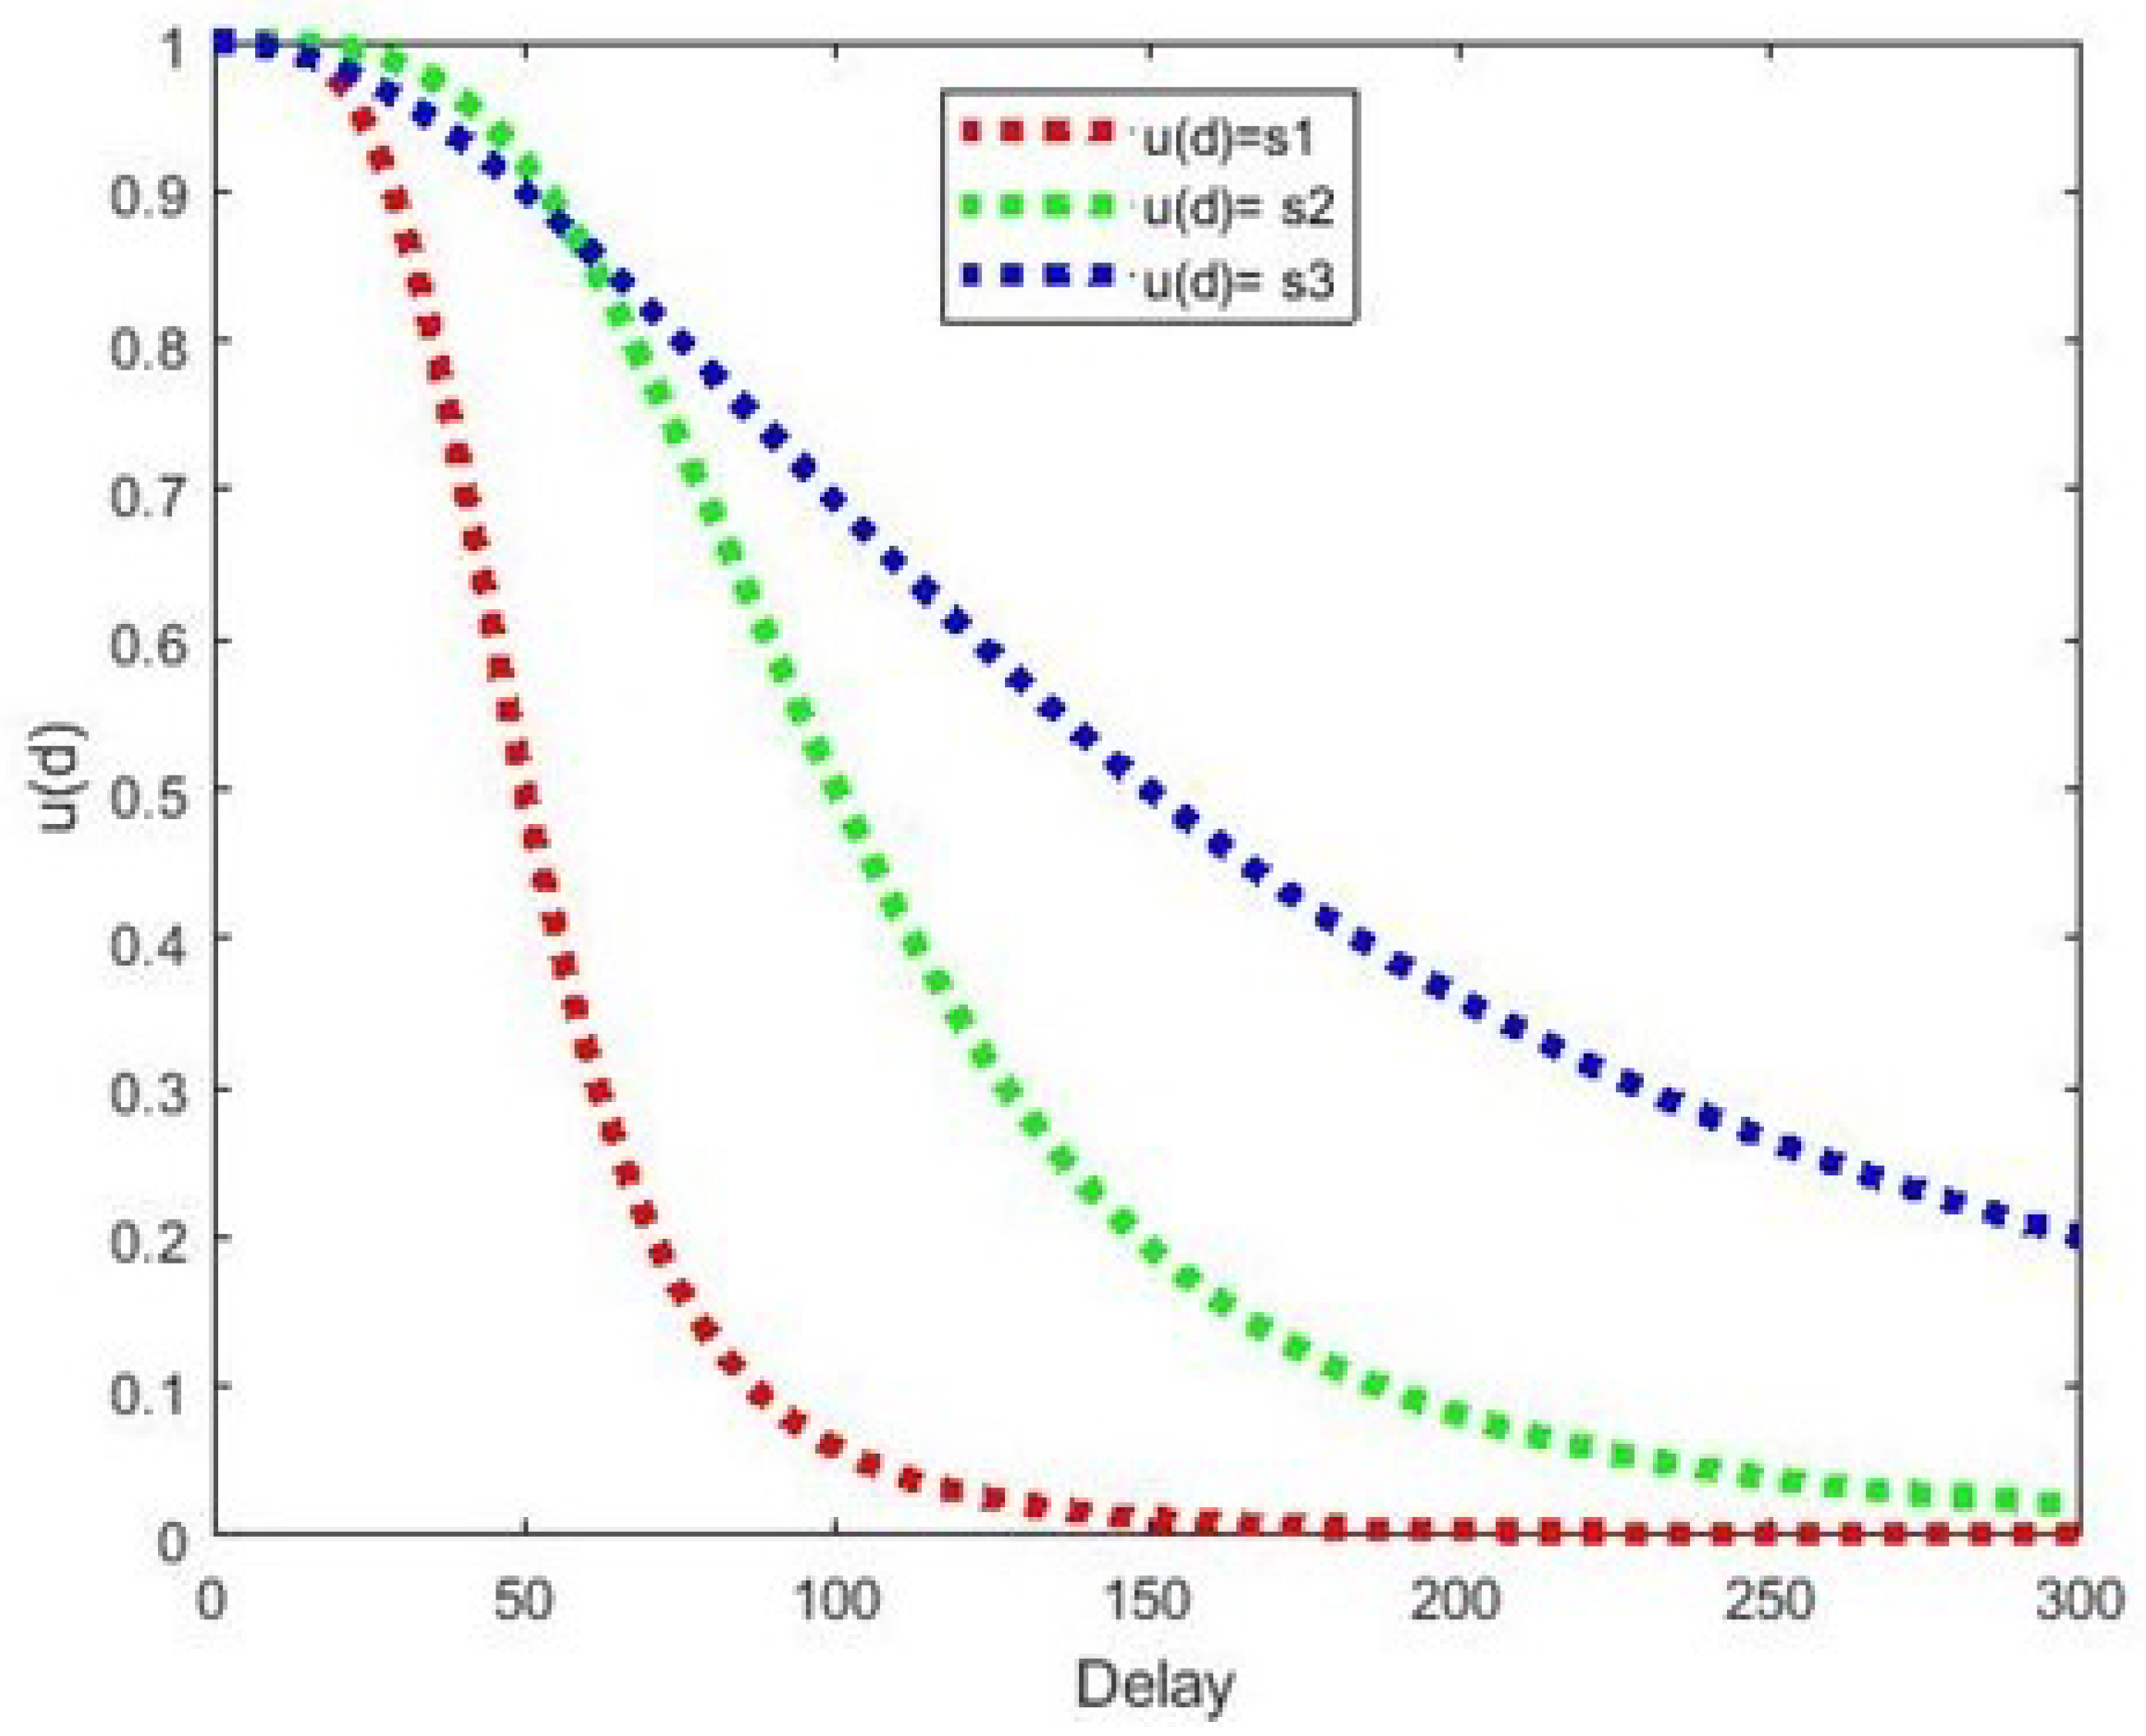
- Utility function for Delay Tolerance: Generally, incremental latency values are acceptable in a Delay-Tolerant Networks (DTN). While designing the utility function for network delay tolerance, a larger network delay value will result in a lower utility value. It is a decreasing criterion to measure network delay. Delay varies in both networks as per the data volume. u(d) is defined as a utility function for the delay, as below:where is the maximum delay and x is the sensitivity factor for delay calculation among both networks. The delay utility function is shown in Figure 7.
- Utility function for the Delivery Probability: Delivery probability is to be defined as the volume of data to be sent using any of the networks. We defined the utility function of delivery probability as , where , in case of successful delivery, is 1, and otherwise, for packet loss, it will be considered as 0. Otherwise, it lies between 0 and 1. is the delivery probability obtained and is the maximum delivery probability that is acceptable to the user, and is shown in Figure 8.
3.1.3. MADM
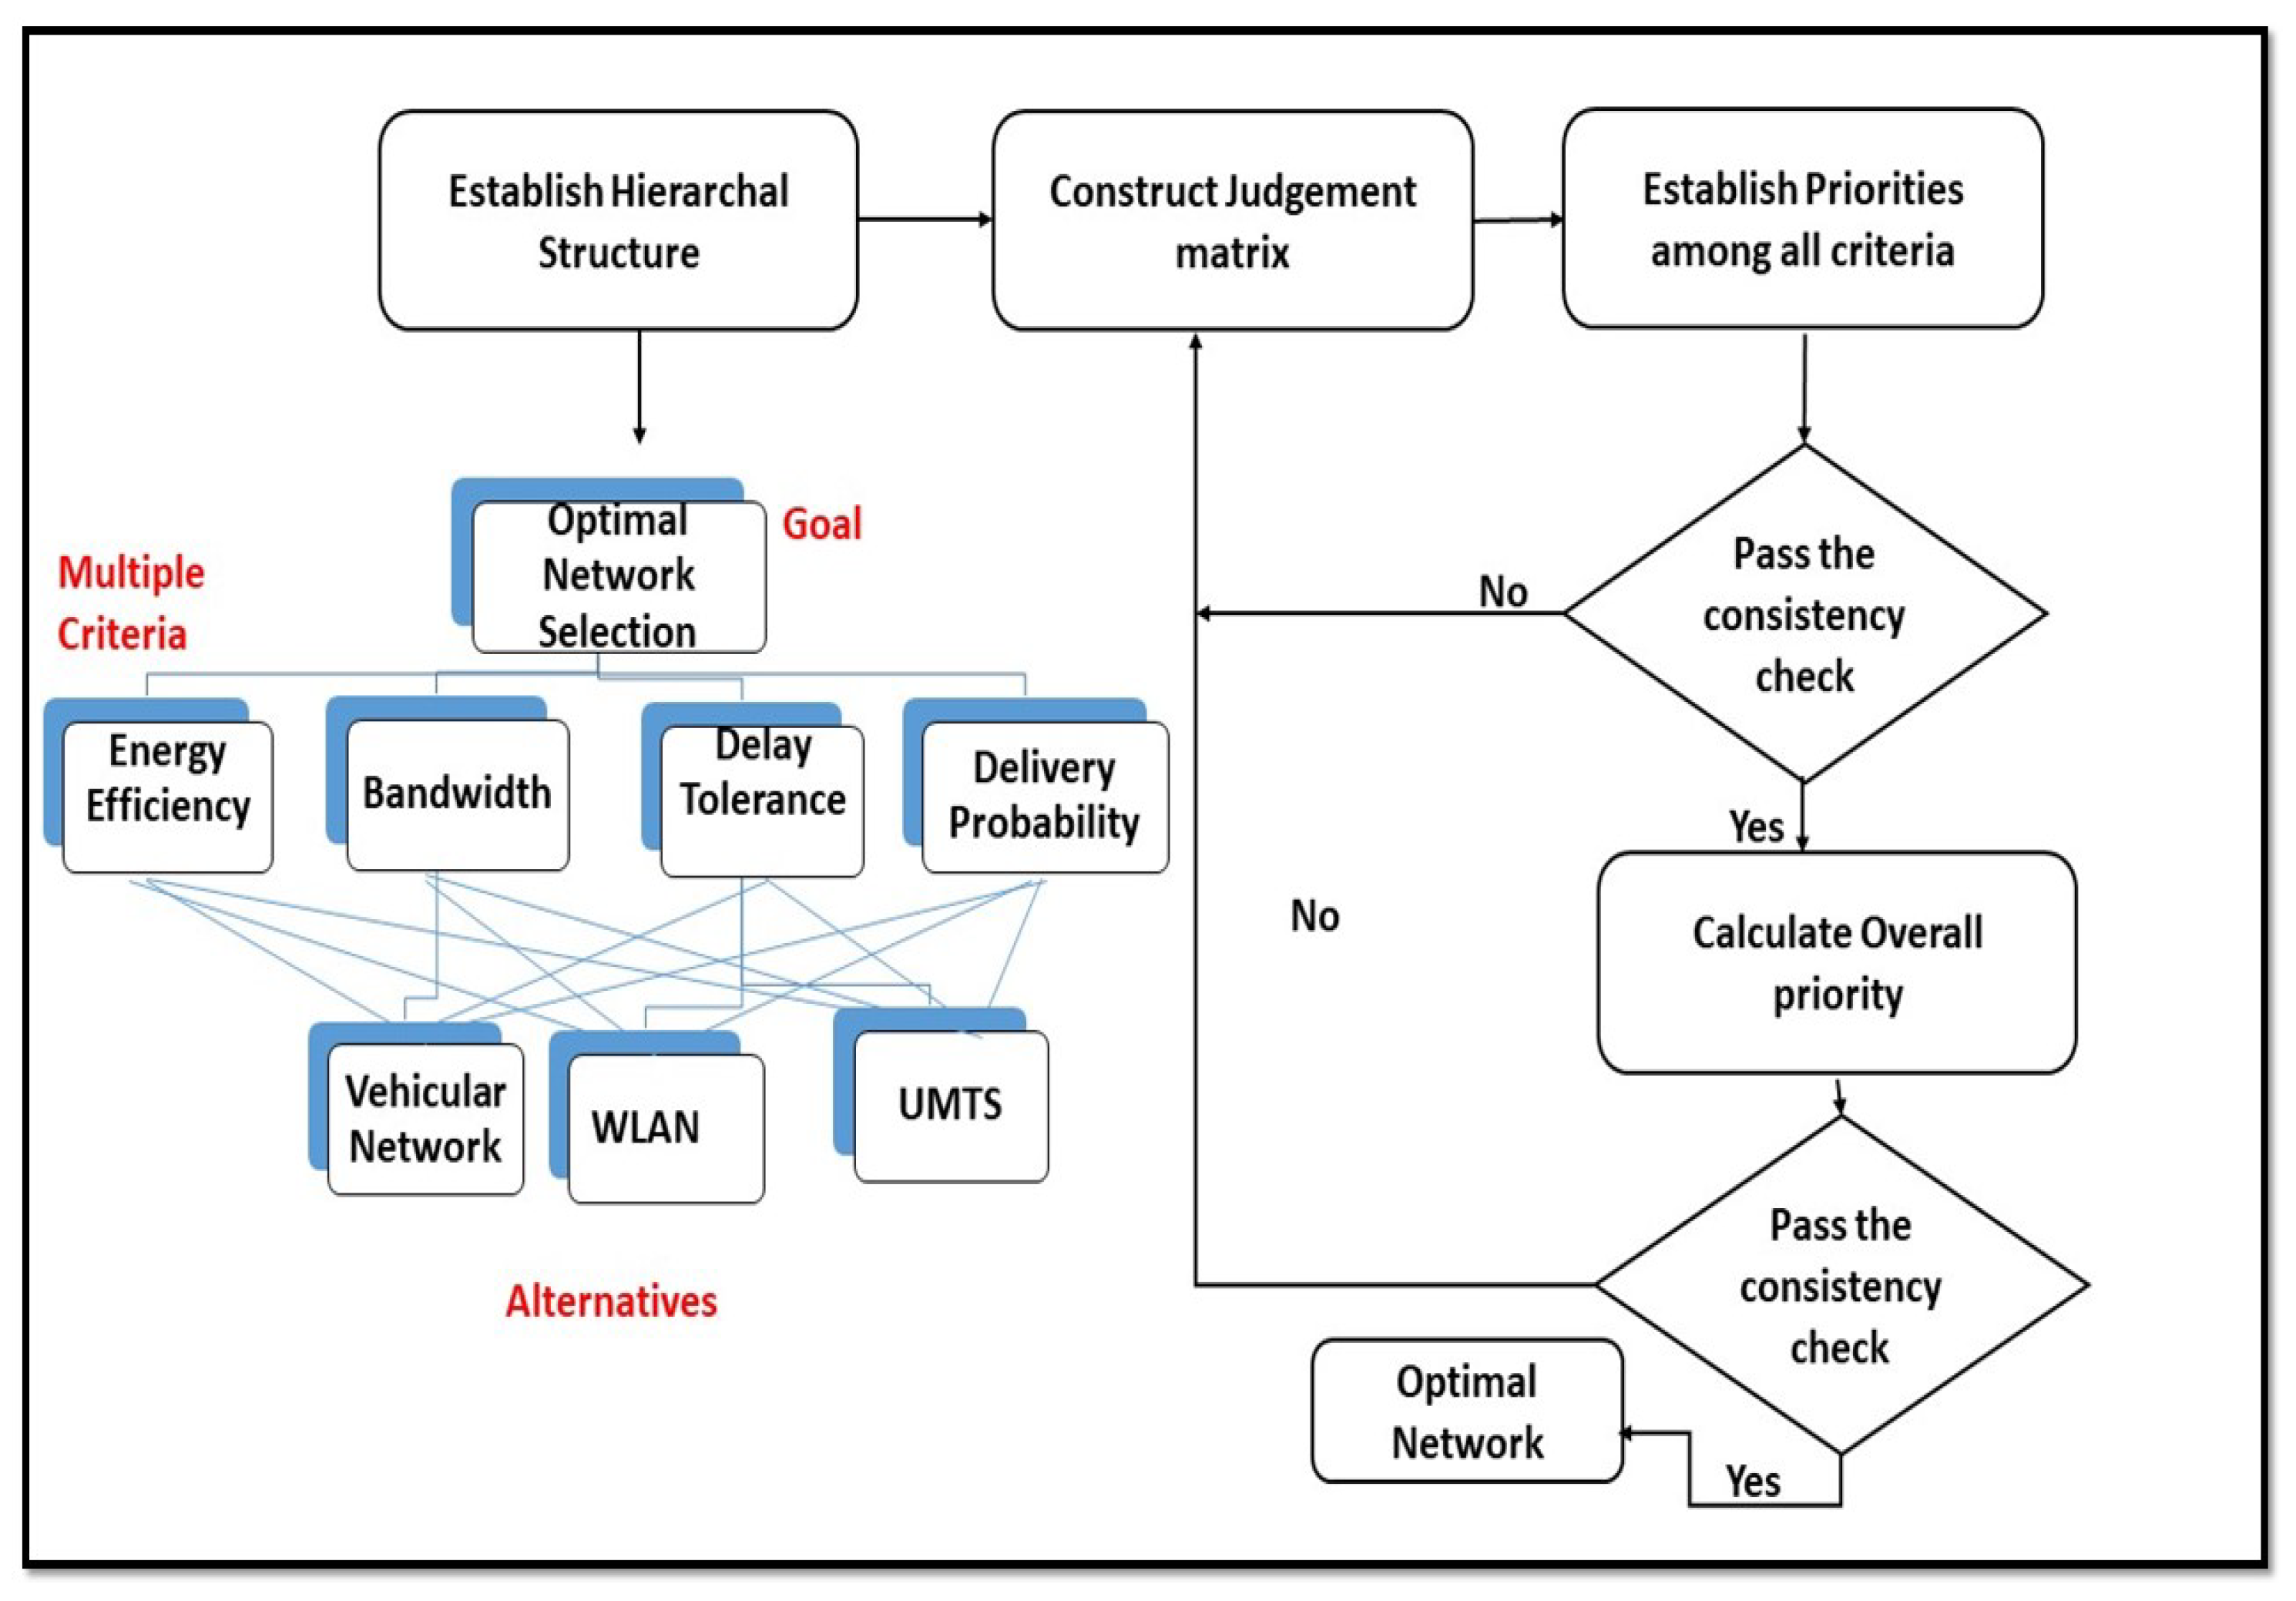
- Analytical Hierarchical ProcessThe analytical Hierarchical process (AHP) method is a multi-criteria decision-making process for network selection. It was developed at the Wharton School of Business by Thomas Saaty in the 1970s [38]. AHP works on the function of priority and rank to evaluate subjective weights to achieve the specified goals. We have used this process to select a best-featured network from the given alternatives for the given service class based on the following criteria—Energy Consumption, Bandwidth, Delay, and Delivery Probability. We have also used this process for choosing a priority of network types for each data type. Network weighing is an important factor to characterize the network performance and user’s preferences. We use the hierarchy analysis method to allocate the appropriate weight to each selection metric.We further categorize traditional networks into WLAN and UMTS networks for impartial scheming with different attributes, as shown in Figure 9. The logical flowchart of the AHP algorithm considers the hierarchical structure with the main goal, multiple criteria, and network alternatives to select. We have defined utility functions for all the attributes for a network assessment. A user’s preference will be based on multiple criteria for network selection. We assume that WLAN users have wireless access to their system, but with a fixed location—or we can say a local network—and that they use all their devices to avail the services and disseminate data to nearby RSUs for further transmission. However, they have good speed and bandwidth values. On the other hand, UMTS is a mobile cellular device and can roam around with their data plans, but with limited bandwidths and larger delays as per the delivery probability and data network’s range.
- Subdivide a problem into further sub-problems by defining an objective function, criteria, and possible alternatives. Here, the objective is our goal of achieving optimal network selection. The multiple criteria are the factors affecting the preference for selection.
- Develop the hierarchy model of all objectives along with their elements to obtain the priorities of criteria through pairwise comparison matrices.
- Construct a pairwise comparison matrix for each criterion of hierarchical structure in such a way that all associated criteria are compared with each other as per the intensity of importance [39], with respect to the scale. We believe that a pairwise comparison between alternatives helps for qualitative judgment. This qualitative pairwise comparison follows the importance scale, as shown in Table 1.
- Perform the normalization of a given matrix P, which is now denoted as :
- The contributions of each normalized metric are multiplied by the assigned importance weight wj, and can be calculated for the ith criteria, as below:such that is the weight vector.
- Calculate the consistency index, where is the largest eigenvalue of , and it is determined from the eigenvalue computation of :
- In the last step, evaluate the consistency of the comparison using the Consistency Ratio (CR), defined as:where [31], as defined in Table 2, is the index used for the number of attributes used in decision making; the network is ranked based on this index. For acceptable results, ; otherwise, pairwise comparison should be repeated.In such a way, AHP helps with network selection among different networks based upon different attributes. After the selection of the public transport network, the next section will elaborate further about allocating data onto buses as per their stay-time at each bus stop.
3.2. Capacitated Vehicle Routing Problem (CVRP)
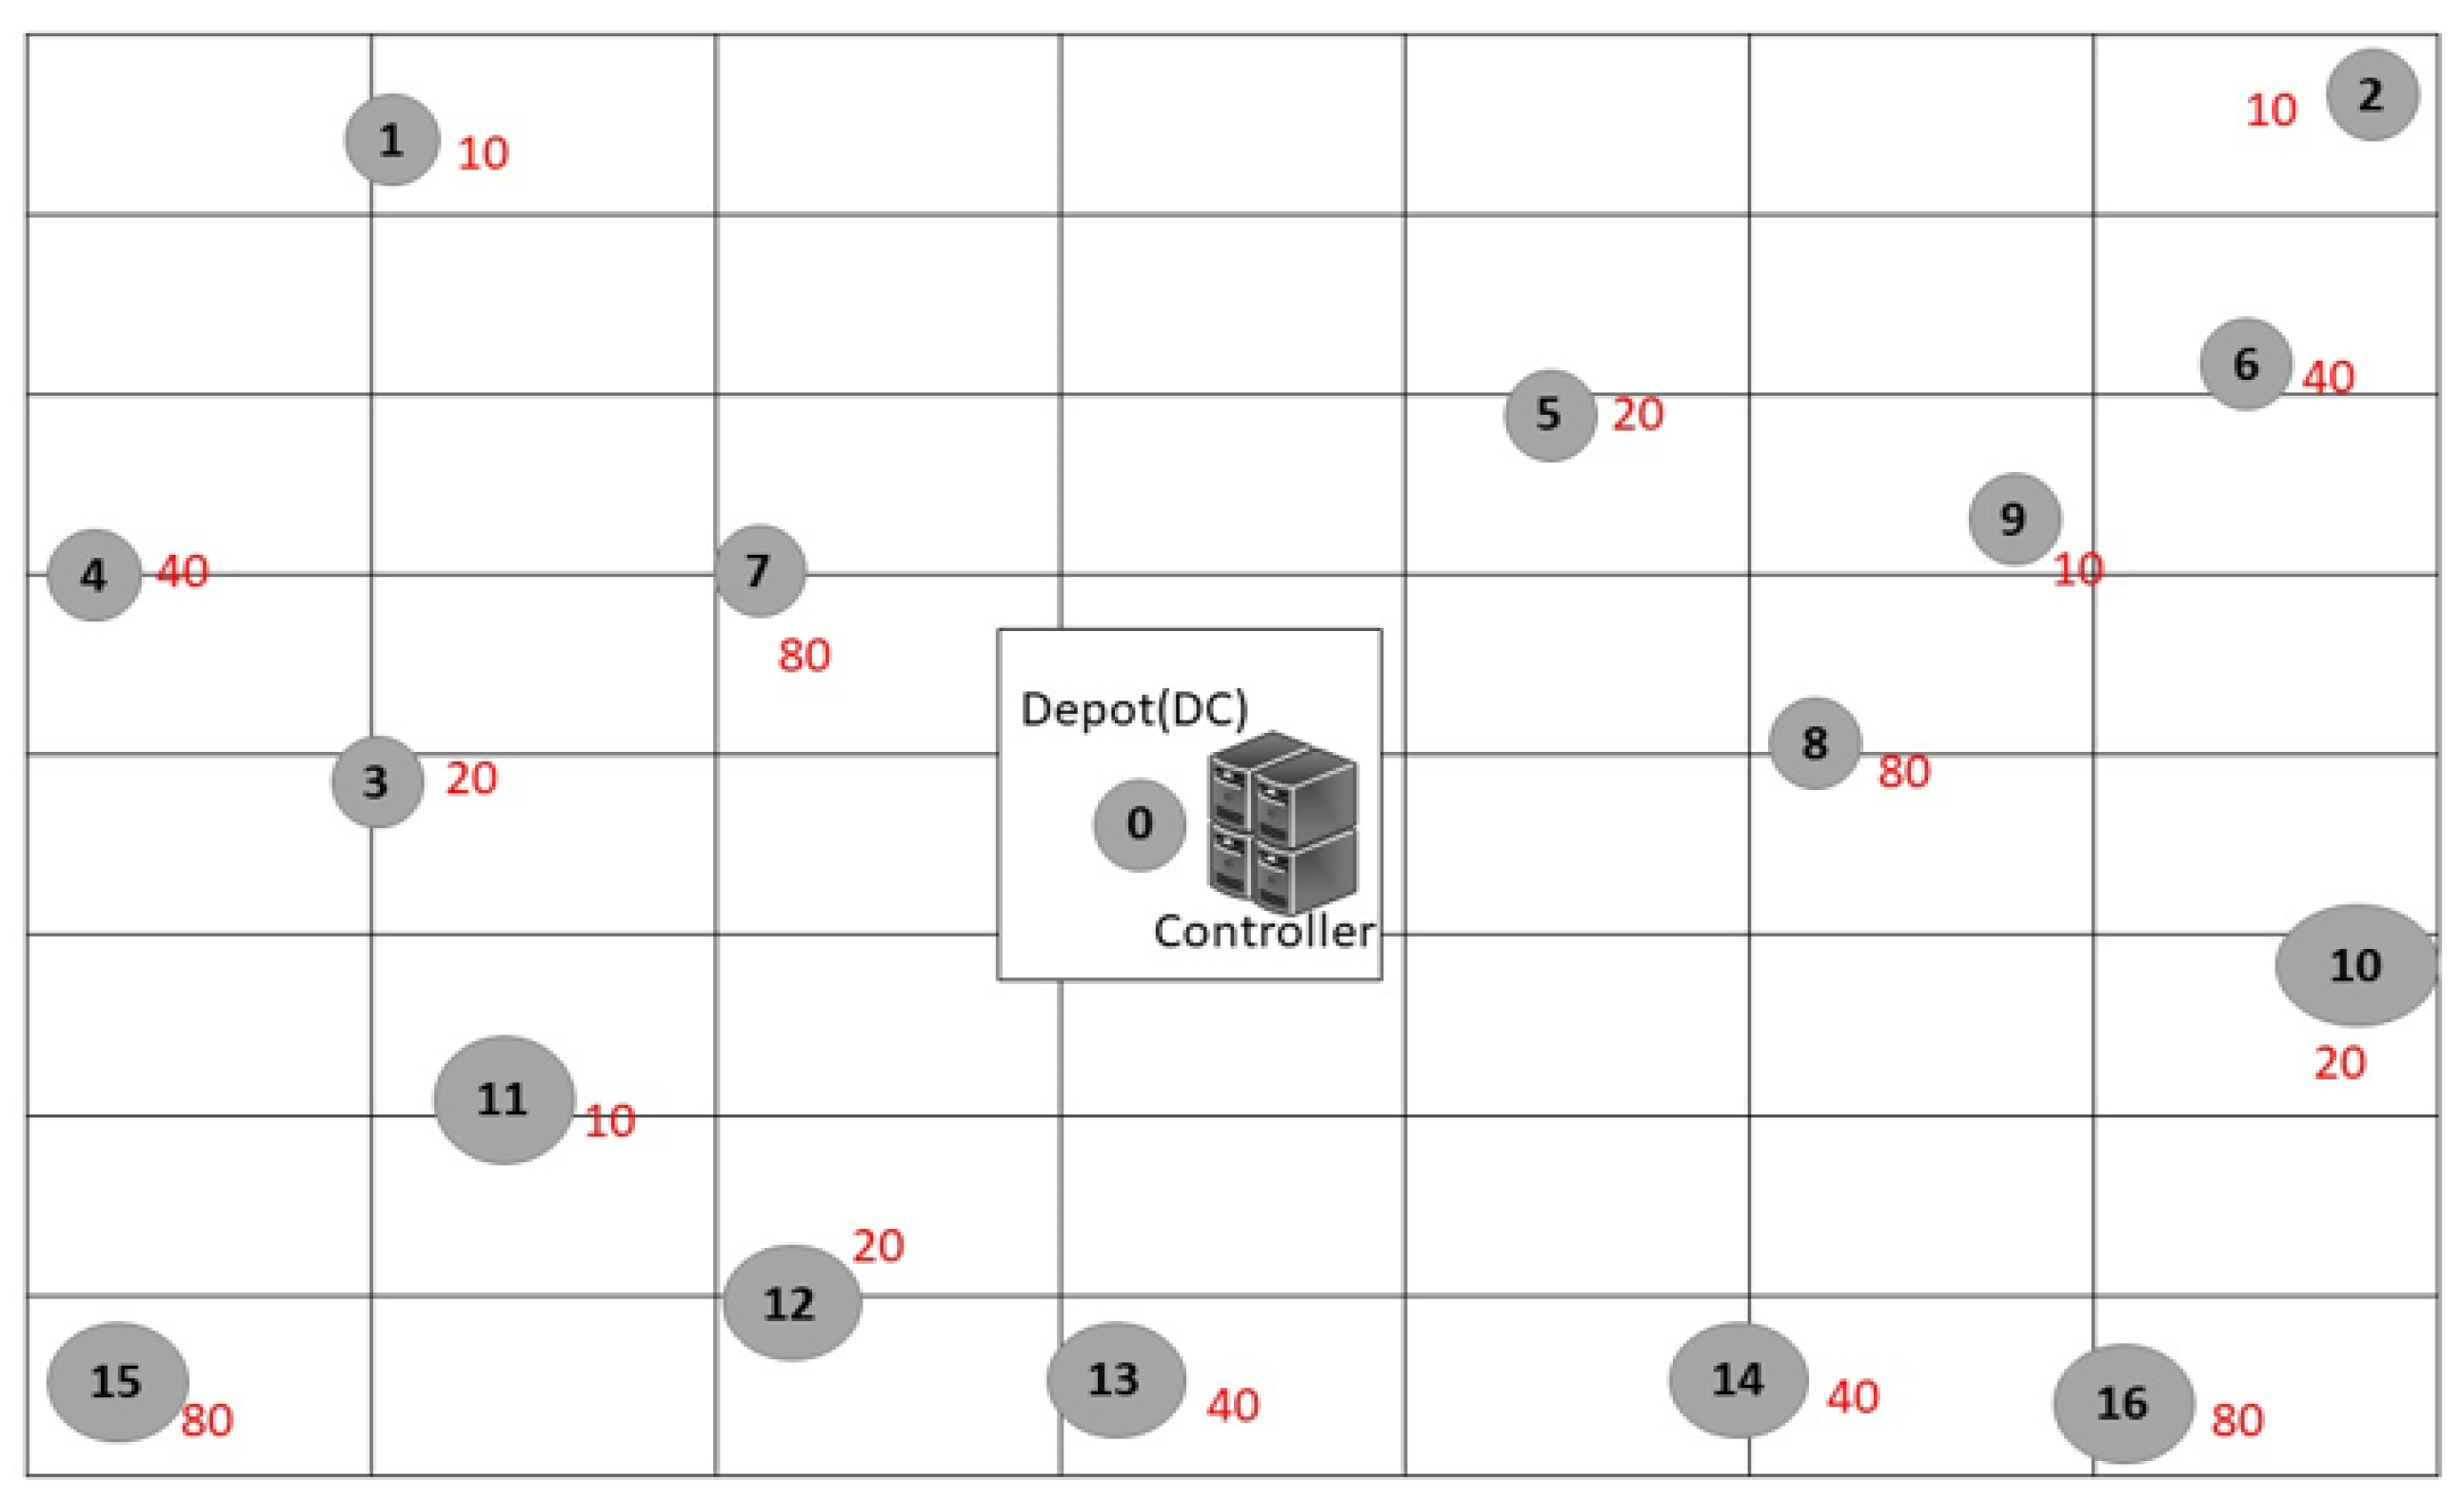
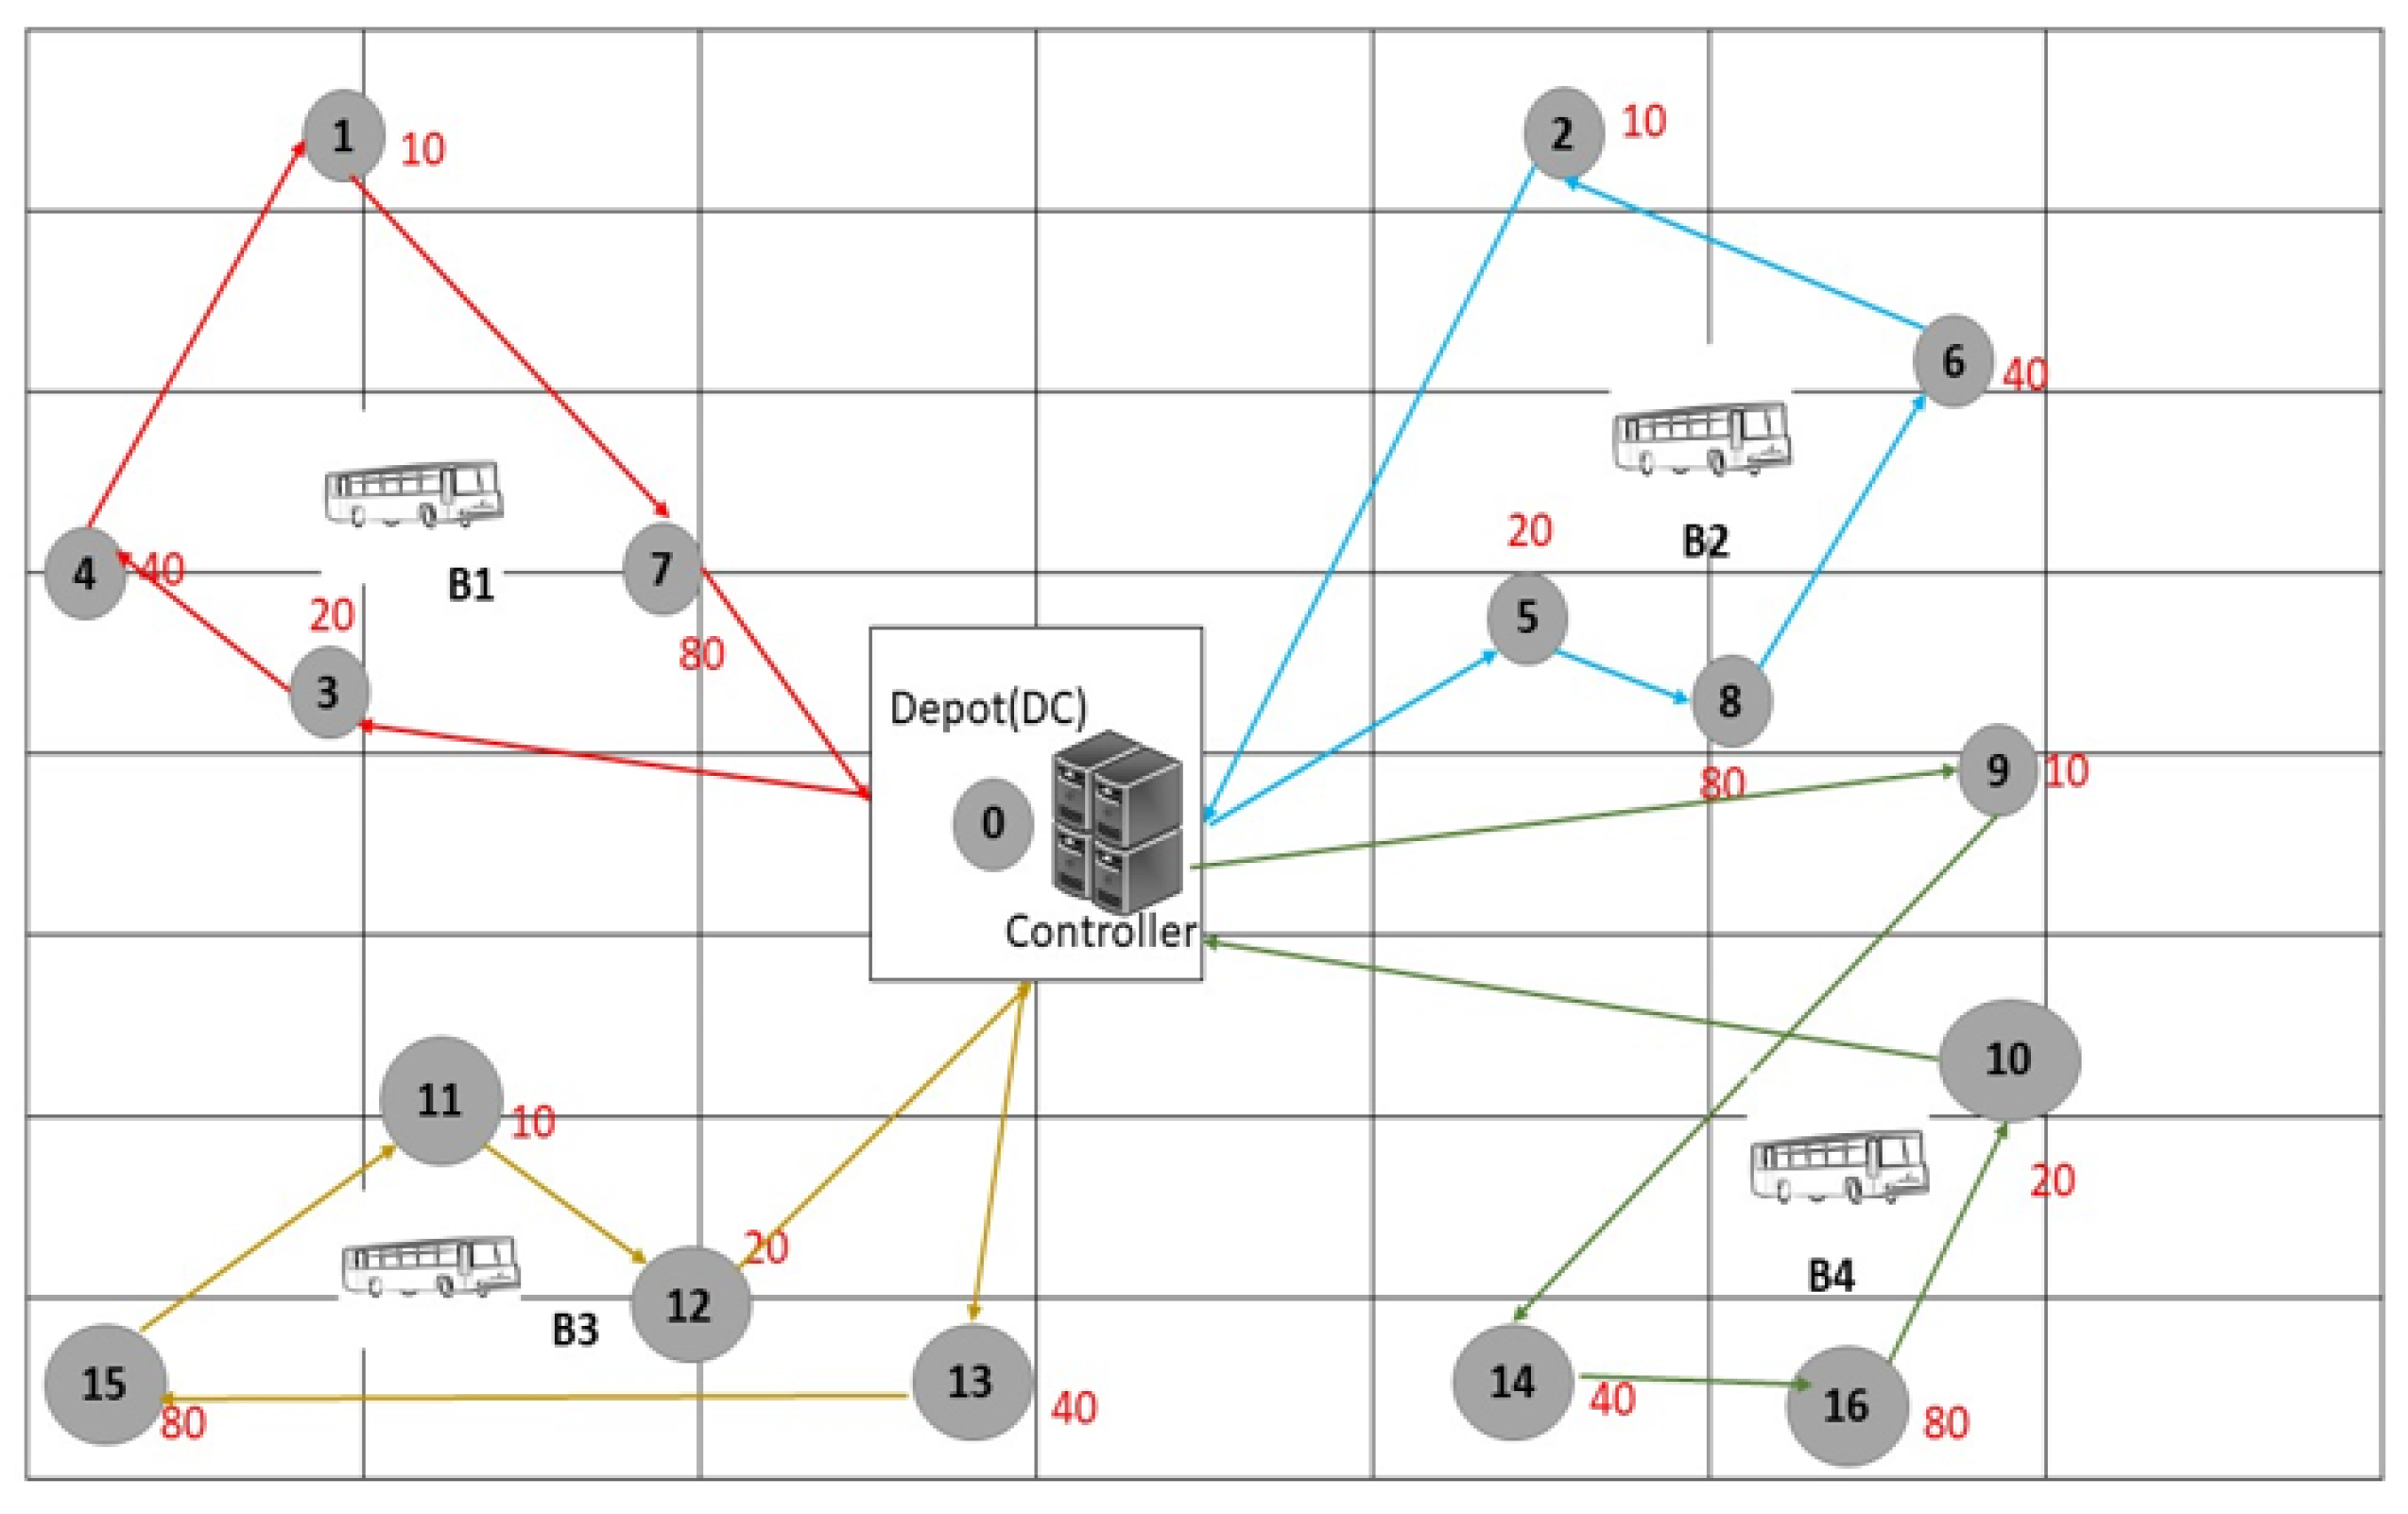
- Problem DefinitionTo offload data onto buses, there is n number of demands being fulfilled by a DC, and a nearby stop is a depot to start the bus journey and return to the same bus stop after finishing its route. B is the set of buses, CB is the capacity of the bus, D is the deadline for the message delivery, which also considers the number of trips being taken by a bus. Each DC has different demands di for different locations. We define our problem in a graph , where is a set of all nodes of the graph and E is the set of edges . Arc represents the path from node i to node j. The energy cost is calculated for each bus to carry data from the source until the destination. The minimum number of buses required to fulfill all the demands is . The controller will assign demands onto each bus as per the destination location. A CVRP can be formulated as follows:Objective: To minimizewhich minimizes the total energy consumption cost of buses. There are various constraints subjected to this function, defined below:Subjected to:where , the binary variable, defines a set of buses , that traverses an arc . The objective function, defined in Equation (13), minimizes the energy-consumption cost. Constraint 14 is the degree constraints, confirming that each demand will be fulfilled by an available bus. Each bus starts its trip from the parent stop, where data is offloaded, delivers data at the destination, and finishes the trip at the same stop as shown in constraint 15 and 16. Constraint 17 defines the maximum capacity of the bus to carry data. All the demands of the DC are fulfilled by the available buses of the day. Constraint 18 defines that, as per the defined time, there are no cycles disconnected to the parent stop. The definition domains of the variables are described in constraint 19.
4. Numerical Analysis and Results
4.1. Case Study I
4.1.1. Service 1
4.1.2. Service 2
4.1.3. Service 3
4.2. Network Selection for Different Services
| Algorithm 1 Optimal Network Selection | |
| Input | : Different services as per user’s profile: energy efficient , delivery probability , delay demand , available bandwidth of both networks, available network list . |
| Output | : Decision factor weight and rank of selected newtork, energy efficient weight , bandwidth weight , delivery probability weight , delay weight . |
| |
4.3. Case Study II
5. Discussion
6. Conclusions and Future Work
Author Contributions
Funding
Data Availability Statement
Conflicts of Interest
References
- Dehghani-Sanij, A.R.; Al-Haq, A.; Bastian, J.; Luehr, G.; Nathwani, J.; Dusseault, M.B.; Leonenko, Y. Assessment of current developments and future prospects of wind energy in Canada. Sustain. Energy Technol. Assess. 2022, 50, 101819. [Google Scholar] [CrossRef]
- Babiceanu, R.F.; Seker, R. Big Data and virtualization for manufacturing cyber-physical systems: A survey of the current status and future outlook. Comput. Ind. 2016, 81, 128–137. [Google Scholar] [CrossRef]
- Munjal, R.; Liu, W.; Li, X.J.; Gutierrez, J.; Chong, P.H.J. Telco asks transp: Can you give me a ride in the era of big data? In Proceedings of the 2017 IEEE Conference on Computer Communications Workshops (INFOCOM WKSHPS), Atlanta, GA, USA, 1–4 May 2017; IEEE: Piscataway, NJ, USA, 2017; pp. 766–771. [Google Scholar]
- Deebak, B.D. Cooperative Mobile Traffic Offloading in Mobile Edge Computing for 5G HetNet IoT Applications In Real-Time Intelligence for Heterogeneous Networks; Springer: Berlin/Heidelberg, Germany, 2021; pp. 43–58. [Google Scholar]
- Han, C.; Harrold, T.; Armour, S.; Krikidis, I.; Videv, S.; Grant, P.M.; Haas, H.; Thompson, J.S.; Ku, I.; Wang, C.X. Green radio: Radio techniques to enable energy-efficient wireless networks. IEEE Commun. Mag. 2011, 49, 46–54. [Google Scholar] [CrossRef] [Green Version]
- Wang, X.; Vasilakos, A.V.; Chen, M.; Liu, Y.; Kwon, T.T. A survey of green mobile networks: Opportunities and challenges. Mob. Netw. Appl. 2012, 17, 4–20. [Google Scholar] [CrossRef]
- Kelly, T.; Head, S. ICTs and Climate Change. In ITU-T Technology, Tech. Rep; 2007; Available online: https://www.itu.int/ITU-D/cyb/events/2008/geneva/docs/kelly-icts_and_climate_change-may2008.pdf (accessed on 22 December 2021).
- Chen, Y. Great project overview,(slides). In Proceedings of the GreenTouch Open Forum (2011), Seoul, Korea, 8 April 2011. [Google Scholar]
- Fettweis, G.; Zimmermann, E. ICT energy consumption-trends and challenges. In Proceedings of the 11th International Symposium on Wireless Personal Multimedia Communications, Lapland, Finland, 8–11 September 2008; Volume 2, p. 6. [Google Scholar]
- McGreehan, J. Climate change and natural resources: What contribution can wireless communications make? In UK Green Wireless Communication—Future Trend and Technology; Springer: Berlin/Heidelberg, Germany, 2009; Volume 25, pp. 1–7. [Google Scholar]
- Etoh, M.; Ohya, T.; Nakayama, Y. Energy consumption issues on mobile network systems. In Proceedings of the 2008 International Symposium on Applications and the Internet, SAINT 2008, Turku, Finland, 28 July–1 August 2008; IEEE: Piscataway, NJ, USA, 2008; pp. 365–368. [Google Scholar]
- Li, M.; Si, P.; Zhang, Y. Delay-tolerant data traffic to software-defined vehicular networks with mobile edge computing in smart city. IEEE Trans. Veh. Technol. 2018, 67, 9073–9086. [Google Scholar] [CrossRef]
- Baron, B.; Spathis, P.; Rivano, H.; de Amorim, M.D.; Viniotis, Y.; Ammar, M.H. Centrally controlled mass data offloading using vehicular traffic. IEEE Trans. Netw. Serv. Manag. 2017, 14, 401–415. [Google Scholar] [CrossRef]
- Baron, B.; Spathis, P.; Rivano, H.; de Amorim, M.D. Vehicles as big data carriers: Road map space reduction and efficient data assignment. In Proceedings of the 2014 IEEE 80th Vehicular Technology Conference (VTC2014-Fall), Vancouver, BC, Canada, 14–17 September 2014; p. 1-5. [Google Scholar]
- Wang, T.; Li, P.; Wang, X.; Wang, Y.; Guo, T.; Cao, Y. A comprehensive survey on mobile data offloading in heterogeneous network. Wirel. Netw. 2019, 25, 573–584. [Google Scholar] [CrossRef]
- Bendaoud, F. A modified-SAW for network selection in heterogeneous wireless networks. ECTI Trans. Electr. Eng. Electron. Commun. 2017, 15, 8–17. [Google Scholar]
- Salih, Y.K.; See, O.H.; Ibrahim, R.W.; Yussof, S.; Iqbal, A. A user-centric game selection model based on user preferences for the selection of the best heterogeneous wireless network. Ann. -Telecommun.-Ann. Télécommun. 2015, 70, 239–248. [Google Scholar] [CrossRef]
- Sgora, A.; Vergados, D.D.; Chatzimisios, P. An access network selection algorithm for heterogeneous wireless environments. In Proceedings of the IEEESymposium on Computers and Communications, Riccione, Italy, 22–25 June 2010; IEEE: Piscataway, NJ, USA, 2010; pp. 890–892. [Google Scholar]
- Wang, L.; Kuo, G.S.G. Mathematical modeling for network selection in heterogeneous wireless networks—A tutorial. IEEE Commun. Surv. Tutor. 2012, 15, 271–292. [Google Scholar] [CrossRef]
- Bi, T.; Yuan, Z.; Trestian, R.; Muntean, G.M. URAN: Utility-based reputation-oriented access network selection strategy for HetNets. In Proceedings of the 2015 IEEE International Symposium on Broadband Multimedia Systems and Broadcasting, Ghent, Belgium, 17–19 June 2015; IEEE: Piscataway, NJ, USA, 2015; pp. 1–6. [Google Scholar]
- Çalhan, A.; Çeken, C. An optimum vertical handoff decision algorithm based on adaptive fuzzy logic and genetic algorithm. Wirel. Pers. Commun. 2012, 64, 647–664. [Google Scholar] [CrossRef]
- Fu, S.; Li, J.; Li, R.; Ji, Y. A game theory based vertical handoff scheme for wireless heterogeneous networks. In Proceedings of the 2014 10th International Conference on Mobile Ad-hoc and Sensor Networks, Maui, HI, USA, 19–21 December 2014; IEEE: Piscataway, NJ, USA, 2014; pp. 220–227. [Google Scholar]
- Abid, M.; Yahiya, T.A.; Pujolle, G. A utility-based handover decision scheme for heterogeneous wireless networks. In Proceedings of the 2012 IEEE Consumer Communications and Networking Conference (CCNC), Las Vegas, NV, USA, 14–17 January 2012; IEEE: Piscataway, NJ, USA, 2012; pp. 650–654. [Google Scholar]
- Goyal, R.K.; Kaushal, S.; Sangaiah, A.K. The utility based non-linear fuzzy AHP optimization model for network selection in heterogeneous wireless networks. Appl. Soft Comput. 2018, 67, 800–811. [Google Scholar] [CrossRef]
- Jiang, D.; Huo, L.; Lv, Z.; Song, H.; Qin, W. A joint multi-criteria utility-based network selection approach for vehicle-to-infrastructure networking. IEEE Trans. Intell. Transp. Syst. 2018, 19, 3305–3319. [Google Scholar] [CrossRef]
- Poirot, V.; Ericson, M.; Nordberg, M.; Andersson, K. Energy efficient multi-connectivity algorithms for ultra-dense 5G networks. Wirel. Netw. 2020, 26, 2207–2222. [Google Scholar] [CrossRef] [Green Version]
- Sede, M.; Li, X.; Li, D.; Wu, M.Y.; Li, M.; Shu, W. Routing in large-scale buses ad hoc networks. In Proceedings of the 2008 IEEE Wireless Communications and Networking Conference, Las Vegas, NV, USA, 31 March–3 April 2008; IEEE: Piscataway, NJ, USA, 2008; pp. 2711–2716. [Google Scholar]
- Xian, Y.; Huang, C.T.; Cobb, J. Look-ahead routing and message scheduling in delay-tolerant networks. Comput. Commun. 2011, 34, 2184–2194. [Google Scholar] [CrossRef]
- Komnios, I.; Tsapeli, F.; Gorinsky, S. Cost-effective multi-mode offloading with peer-assisted communications. Ad Hoc Netw. 2015, 25, 370–382. [Google Scholar] [CrossRef]
- Kassar, M.; Kervella, B.; Pujolle, G. An overview of vertical handover decision strategies in heterogeneous wireless networks. Comput. Commun. 2008, 31, 2607–2620. [Google Scholar] [CrossRef]
- Song, Q.; Jamalipour, A. A network selection mechanism for next generation networks. In Proceedings of the IEEE International Conference on Communications, ICC 2005, Seoul, Korea, 16–20 May 2005; IEEE: Piscataway, NJ, USA, 2005; Volume 2, pp. 1418–1422. [Google Scholar]
- Liang, G.; Guo, X.; Sun, G.; Fang, J. A User-Oriented Intelligent Access Selection Algorithm in Heterogeneous Wireless Networks. Comput. Intell. Neurosci. 2020, 2020, 8828355. [Google Scholar] [CrossRef]
- Yu, H.; Ma, Y.; Yu, J. Network selection algorithm for multiservice multimode terminals in heterogeneous wireless networks. IEEE Access 2019, 7, 46240–46260. [Google Scholar] [CrossRef]
- Munjal, R.; Liu, W.; Li, X.J.; Gutierrez, J. A Neural Network-Based Sustainable Data Dissemination through Public Transportation for Smart Cities. Sustainability 2020, 12, 10327. [Google Scholar] [CrossRef]
- Munjal, R.; Liu, W.; Li, X.J.; Gutierrez, J. Big data offloading using smart public vehicles with software defined connectivity. In Proceedings of the 2019 IEEE Intelligent Transportation Systems Conference (ITSC), Auckland, New Zealand, 27–30 October 2019; IEEE: Piscataway, NJ, USA, 2019; pp. 3361–3366. [Google Scholar]
- Poulliat, C. Mobile Data Offloading via Urban Public Transportation Networks. Ph.D. Thesis, Institut de Recherche en Informatique de Toulouse, Toulouse, France, 2017. [Google Scholar]
- Nguyen-Vuong, Q.T.; Agoulmine, N.; Cherkaoui, E.H.; Toni, L. Multicriteria optimization of access selection to improve the quality of experience in heterogeneous wireless access networks. IEEE Trans. Veh. Technol. 2012, 62, 1785–1800. [Google Scholar] [CrossRef] [Green Version]
- Saaty, T.L. Decision making with the analytic hierarchy process. Int. J. Serv. Sci. 2008, 1, 83–98. [Google Scholar] [CrossRef] [Green Version]
- Vanier, D.; Tesfamariam, S.; Sadiq, R.; Lounis, Z. Decision models to prioritize maintenance and renewal alternatives. In Proceedings of the Joint International Conference on Computing and Decision Making in Civil and Building Engineering, Montréal, QC, Canada, 14–16 June 2006; pp. 14–16. [Google Scholar]
- 2021. Available online: www.idc.com/ap/smartcities (accessed on 22 December 2021).
- Heinzelman, W.R.; Kulik, J.; Balakrishnan, H. Adaptive protocols for information dissemination in wireless sensor networks. In Proceedings of the 5th annual ACM/IEEE International Conference on Mobile Computing and Networking, Seattle, WA, USA; ACM: New York, NY, USA, 15–19 August 1999; pp. 174–185. [Google Scholar]
- Boukerche, A.; Darehshoorzadeh, A. Opportunistic routing in wireless networks: Models, algorithms, and classifications. ACM Comput. Surv. (CSUR) 2015, 47, 22. [Google Scholar] [CrossRef]


| Preferences as per Importance | Definition |
|---|---|
| 1 | Equal Importance |
| 3 | Moderate importance |
| 5 | Strong importance |
| 7 | Very strong importance |
| 9 | Extreme importance |
| 2, 4, …, 8 | Intermediate values |
| N | 1 | 2 | 3 | 4 | 5 | 6 | 7 | 8 | 9 | 10 |
| RI | 0 | 0 | 0.58 | 0.9 | 1.12 | 1.24 | 1.32 | 1.41 | 1.45 | 1.49 |
| Attributes | Energy Efficiency | Bandwidth | Delay Tolerance | Delivery Probability |
|---|---|---|---|---|
| Energy Efficiency | 1 | 7 | 9 | 3 |
| Bandwidth | 1/3 | 1 | 7 | 2 |
| Delay Tolerance | 1/9 | 1/7 | 1 | 1/5 |
| Delivery probability | 1/3 | 1/2 | 5 | 1 |
| Attributes | Energy Efficiency | Bandwidth | Delay Tolerance | Delivery Probability | Critera Weight |
|---|---|---|---|---|---|
| Energy Efficiency | 1 | 7 | 9 | 3 | 0.530345069 |
| Bandwidth | 1/3 | 1 | 7 | 2 | 0.164911216 |
| Delay Tolerance | 1/9 | 1/7 | 1 | 1/5 | 0.041457905 |
| Delivery probability | 1/7 | 1/2 | 5 | 1 | 0.280751063 |
| Attributes | Energy Efficiency | Bandwidth | Delay Tolerance | Delivery Probability | Critera Weight | Priority Vector |
|---|---|---|---|---|---|---|
| Energy Efficiency | 1 | 3 | 9 | 7 | 0.530345069 | 0.5289 |
| Bandwidth | 1/3 | 1 | 7 | 2 | 0.164911216 | 0.1582 |
| Delay Tolerance | 1/9 | 1/7 | 1 | 1/5 | 0.041457905 | 0.0366 |
| Delivery probability | 1/7 | 1/2 | 5 | 1 | 0.280751063 | 0.2763 |
| Attributes | Energy Efficiency | Bandwidth | Delay Tolerance | Delivery Probability |
|---|---|---|---|---|
| Energy Efficiency | 1 | 7 | 1 | 5 |
| Bandwidth | 1/7 | 1 | 1/7 | 2 |
| Delay Tolerance | 1 | 7 | 1 | 7 |
| Delivery probability | 1/5 | 1/2 | 1/7 | 1 |
| Attributes | Energy Efficiency | Bandwidth | Delay Tolerance | Delivery Probability | Criteria Weight |
|---|---|---|---|---|---|
| Energy Efficiency | 1 | 7 | 1 | 5 | 0.42274576 |
| Bandwidth | 1/7 | 1 | 1/7 | 2 | 0.08567345 |
| Delay Tolerance | 1 | 7 | 1 | 7 | 0.45678945 |
| Delivery probability | 1/5 | 1/2 | 1/7 | 1 | 0.06435676 |
| Attributes | Energy Efficiency | Bandwidth | Delay Tolerance | Delivery Probability | Critera Weight | Priority Vector |
|---|---|---|---|---|---|---|
| Energy Efficiency | 1 | 7 | 1 | 5 | 0.42274576 | 0.4163 |
| Bandwidth | 1/7 | 1 | 1/7 | 2 | 0.08567345 | 0.0782 |
| Delay Tolerance | 1 | 7 | 1 | 7 | 0.45678945 | 0.4455 |
| Delivery probability | 1/5 | 1/2 | 1/7 | 1 | 0.06435676 | 0.0599 |
| Attributes | Energy Efficiency | Bandwidth | Delay Tolerance | Delivery Probability |
|---|---|---|---|---|
| Energy Efficiency | 1 | 1/6 | 1/6 | 1/7 |
| Bandwidth | 6 | 1 | 3 | 1 |
| Delay Tolerance | 6 | 1/3 | 1 | 1/5 |
| Delivery probability | 7 | 1 | 5 | 1 |
| Attributes | Energy Efficiency | Bandwidth | Delay Tolerance | Delivery Probability | Criteria Weight |
|---|---|---|---|---|---|
| Energy Efficiency | 1 | 1/6 | 1/6 | 1/7 | 0.05355183 |
| Bandwidth | 6 | 1 | 3 | 1 | 0.36439882 |
| Delay Tolerance | 6 | 1/3 | 1 | 1/5 | 0.15369319 |
| Delivery probability | 7 | 1 | 5 | 1 | 0.4540202 |
| Attributes | Energy Efficiency | Bandwidth | Delay Tolerance | Delivery Probability | Criteria Weight | Priority Vector |
|---|---|---|---|---|---|---|
| Energy Efficiency | 1 | 1/6 | 1/6 | 1/7 | 0.05355183 | 0.0459 |
| Bandwidth | 6 | 1 | 3 | 1 | 0.36439882 | 0.3613 |
| Delay Tolerance | 6 | 1/3 | 1 | 1/5 | 0.15369319 | 0.1499 |
| Delivery probability | 7 | 1 | 5 | 1 | 0.45402002 | 0.4429 |
| Number of Buses per Day | Demands from Destination Stop (TB) | Distance from Depot (0) (Km) | Bus Capacity (TB) |
|---|---|---|---|
| 1 | 10 | 5.48 | 150 |
| 2 | 10 | 7.76 | 150 |
| 3 | 20 | 6.95 | 150 |
| 4 | 40 | 5.82 | 150 |
| 5 | 20 | 2.74 | 150 |
| 6 | 40 | 5.02 | 150 |
| 7 | 80 | 1.94 | 150 |
| 8 | 80 | 3.08 | 150 |
| 9 | 10 | 1.94 | 150 |
| 10 | 20 | 5.36 | 150 |
| 11 | 10 | 5.02 | 150 |
| 12 | 20 | 3.88 | 150 |
| 13 | 40 | 3.54 | 150 |
| 14 | 40 | 4.68 | 150 |
| 15 | 80 | 7.76 | 150 |
| 16 | 80 | 6.62 | 150 |
| Bus Number | Selected Route | Total Distance Covered During the Trip |
|---|---|---|
| B1 | 0-3-4-1-7-0 | 12 km |
| B2 | 0-5-8-6-2-0 | 13 km |
| B3 | 0-13-15-11-12-0 | 12 km |
| B4 | 0-9-14-16-10-0 | 13 km |
Publisher’s Note: MDPI stays neutral with regard to jurisdictional claims in published maps and institutional affiliations. |
© 2022 by the authors. Licensee MDPI, Basel, Switzerland. This article is an open access article distributed under the terms and conditions of the Creative Commons Attribution (CC BY) license (https://creativecommons.org/licenses/by/4.0/).
Share and Cite
Munjal, R.; Liu, W.; Li, X.; Gutierrez, J.; Chong, P.H.J. Multi-Attribute Decision Making for Energy-Efficient Public Transport Network Selection in Smart Cities. Future Internet 2022, 14, 42. https://doi.org/10.3390/fi14020042
Munjal R, Liu W, Li X, Gutierrez J, Chong PHJ. Multi-Attribute Decision Making for Energy-Efficient Public Transport Network Selection in Smart Cities. Future Internet. 2022; 14(2):42. https://doi.org/10.3390/fi14020042
Chicago/Turabian StyleMunjal, Rashmi, William Liu, Xuejun Li, Jairo Gutierrez, and Peter Han Joo Chong. 2022. "Multi-Attribute Decision Making for Energy-Efficient Public Transport Network Selection in Smart Cities" Future Internet 14, no. 2: 42. https://doi.org/10.3390/fi14020042
APA StyleMunjal, R., Liu, W., Li, X., Gutierrez, J., & Chong, P. H. J. (2022). Multi-Attribute Decision Making for Energy-Efficient Public Transport Network Selection in Smart Cities. Future Internet, 14(2), 42. https://doi.org/10.3390/fi14020042