7.2. Gateway Evaluation
To measure the time penalty induced by the examination of the webpage source code, we used the Resource Timing API that is part of the Chrome Developers Tools and made measurements during webpage loading both with and without the use of the gateway. To approximate the actual time it takes for each HTTP/HTTPS GET request to be examined before it is sent back to the user, we need to identify the different components that contribute to the final webpage load time. To this end, we employed the Resource Timing API, which provides a way to get detailed network timing data about the resource loading. The interface splits the webpage’s loading time in different parts, each one representing a network event, such as DNS lookup delay, response start and end times, as well as the actual content downloading. Modern browsers use Resource Timing API [
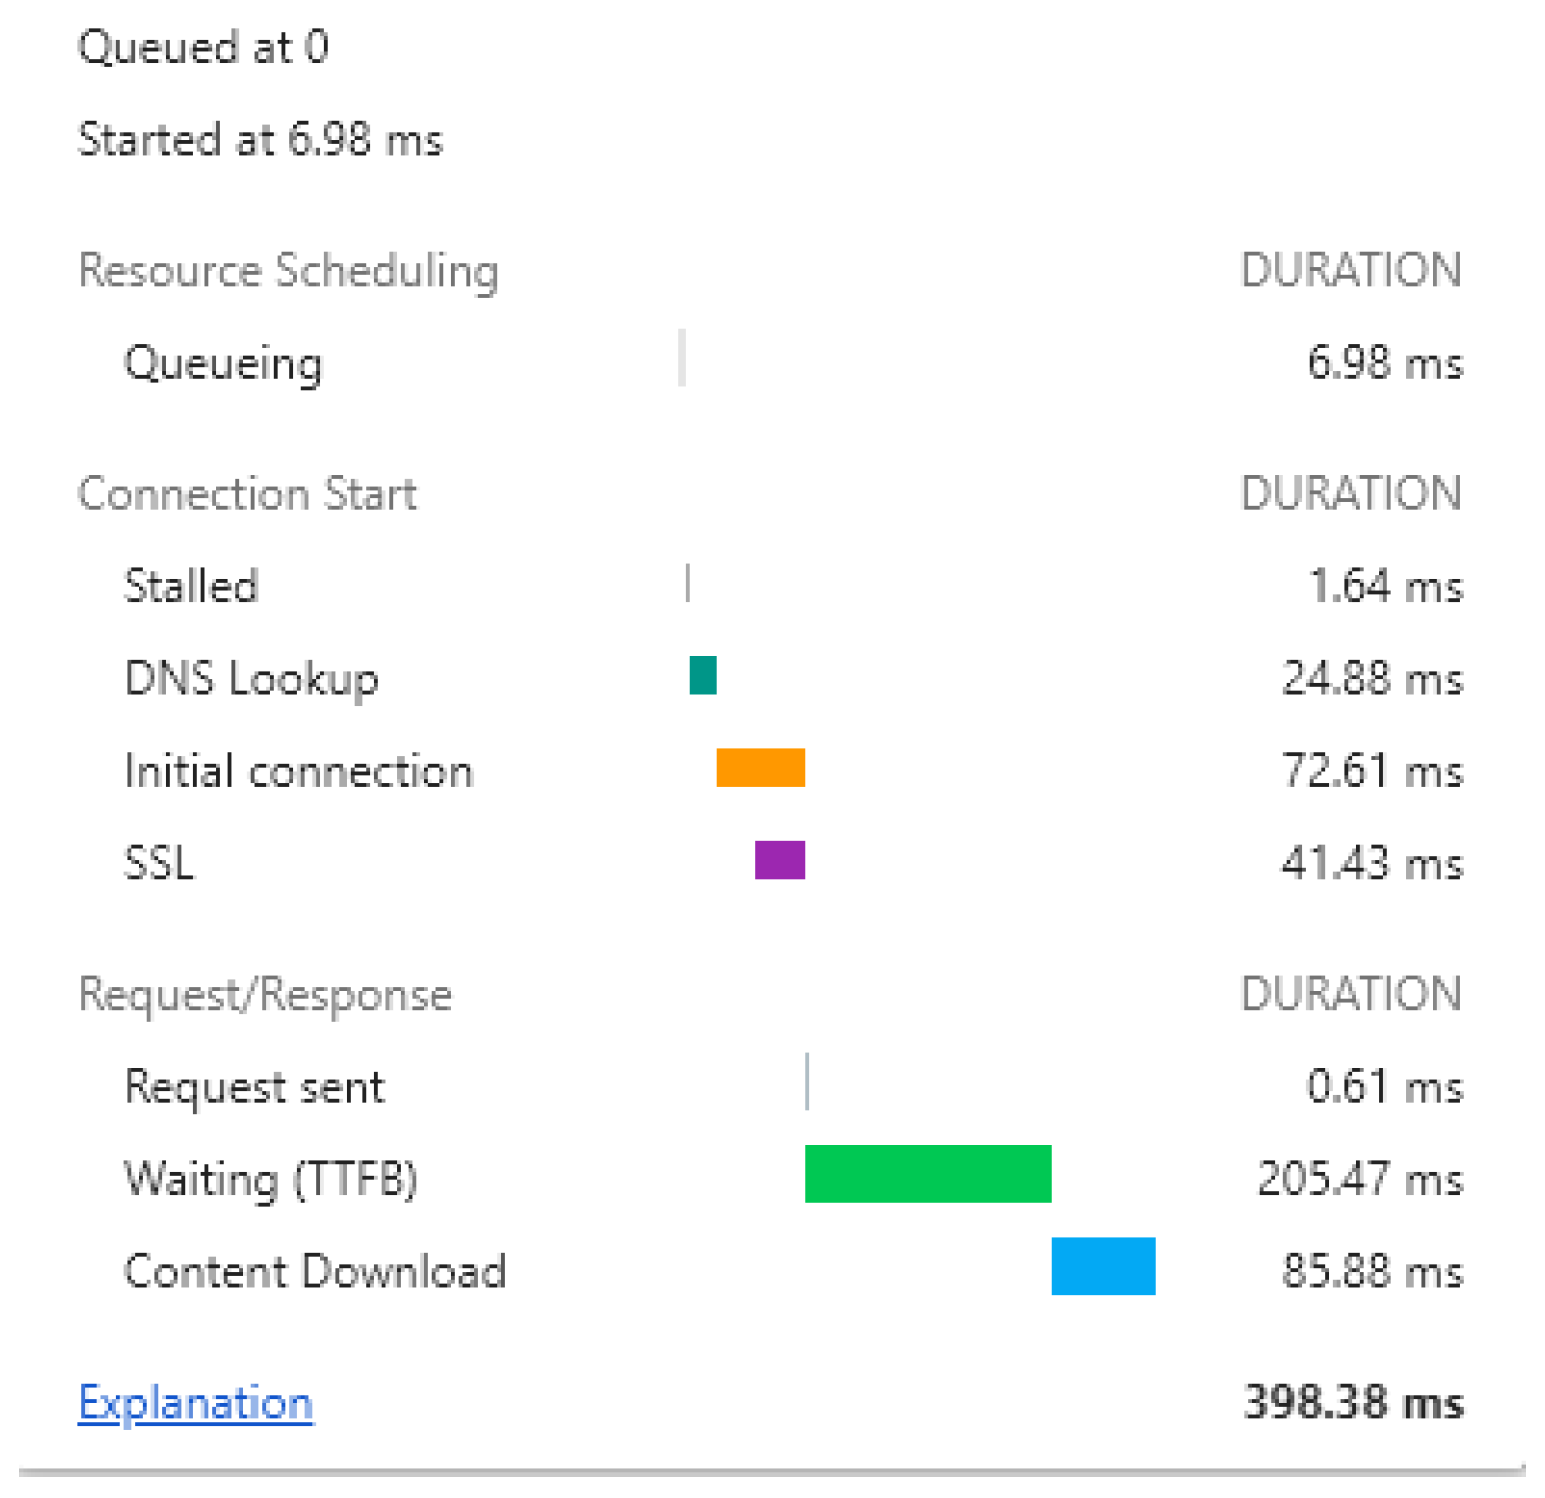
27], which is usually embedded by default, to offer developers the ability to calculate a web request load and serving time. In Chrome, a user can observe detailed information about the time each request needs to be fulfilled, using the Network Analysis Tool that is placed in the Network panel. An example of a request’s timing breakdown is presented in
Figure 5.
In the following, we succinctly describe each of the webpage phases for the sake of understanding the whole lifecycle of a web request. Before each request is sent to its final destination it may need to be delayed for several reasons, like other higher priority requests waiting to be served, the allowed number of TCP connections has been exceeded, or the disk cache is full. For one of the aforementioned reasons, a request may be queued or even stalled. The “DNS Lookup” delay comprises the time spent for a request to perform a DNS lookup for a certain domain in a webpage. However, if the same webpage along with the carrying domains has been visited in the past, most or even all of its domains already exist in the DNS cache of the browser, and thus the DNS Lookup delay will be close to zero. The connection process with the remote webserver is measured by the “Initial connection” metric, which represents the time the connection needs to be initialized, including the TCP handshake and the needed retries, and, if applicable, the negotiation of TLS, that is, the TLS handshake between the client and the server. Finally, the “SSL” is the time spent until the TLS handshake protocol completes, that is, the change cipher spec message, which is used to switch to symmetric key protection. The “Request Sent” is the actual time spent for the request to be sent, overcoming any network issues, which usually is negligible. The subsequent two phases are probably the most significant ones when it comes to the delay of the request. The “Waiting” represents the time spent waiting for the initial response to be processed, also known as Time to First Byte (TTFB). This pertains to the number of milliseconds it takes for a browser to accept the first byte of the response after a request has been sent to a web server, that is, the latency of a round trip to the server. Last but not least, the “Content Download” is the actual time spent before the client receives the complete web content from the server, a phase which is obviously the most critical, as most of the web request’s time is spent here.
It is expected that, as the whole webpage source is downloaded and parsed by our proxy, the size of the source code will affect the final delay. However, the browser can also employ several techniques to speed up the content downloading process, including caching. Namely, the browser cache is being used to store website documents like HTML files, Cascading Style Sheets (CSS), and JavaScript code in order to avoid downloading it again in future site visits. This means that, if a user revisits a webpage, the browser will try to download only new content, loading the rest from its cache. The previous action will naturally lead to negligible delays when it comes to security checks on a webpage, since the content has already been checked in the past.
As already mentioned, the average webpage size is ≈3 MB, which makes source code parsing a really quick task. It is also worth mentioning that the heavier part of the webpage is being bound by images or other multimedia type objects, while our interest lies solely on the JavaScript source code possibly existing in the webpage. With that in mind, the proxy needs to only deal with the parsing of the source code, whose actual size will be significantly reduced, hence introducing less delay.
The gateways were implemented in C++ and Golang and installed on Ubuntu Linux 18.10 on a laptop machine equipped with an Intel Core i7-6700HQ 3.4 GHz CPU and 16 GB of RAM. The Internet connection used provides a bandwidth of 34 Mbps downstream and 28 Mbps upstream. The laptop machine was connected to the Internet via an IEEE 802.11n access point. We also configured a Coturn server [
28], which is an open-source TURN/STUN server for Linux. Additionally, we created a webpage, which executes requests to our STUN server, and thus we were able to examine the exact log entry at the server side.
We compared the two gateway implementations and logged key metrics that characterize a website visit. The acquired results are summarized in
Table 2. We tested our gateway implementations against some of the most popular websites which mandate HTTPS, as well as websites that are plain HTTP.
The time each solution needs to download all of the (possibly compressed) contents of the webpage is of course dependent upon its size. The “content size" column represents the actual size of the resource, while “response size" represents the number of MB transferred on the wire or the wireless medium. As long as most of the modern web servers use compression to the response body before they are sent over the network, the size of the transferred data are significantly reduced. The “load time” column is the total time delay that the webpage spent in order to load all of its contents, including JavaScript and CSS code, images, as well as the main HTML document. In detail, the “load time” is divided into the “DOM content load time” and the webpage rendering. The first represents the time that the webpage needs to build the DOM. That is, when the browser receives the HTML document from the server, it stores it into the local memory and automatically parses it for creating the DOM tree. During this time, any synchronous scripts will be executed and static assets, such as images saved on the server side, will be downloaded as well. The webpage rendering phase is the amount of time that the browser needs to show the content of the webpage to the user. However, in that stage, no extra delay will be added since the initial code will be sent directly to the client’s browser.
As observed from
Table 2, checking a website’s intentions, in terms of JavaScript code, comes with a cost, although most of the times it will not be noticeable. Both C++ and Golang have proven good choices for a proxy implementation, producing negligible delay vis-à-vis to a non-proxy scenario. Precisely, neglecting the web page size factor, in the case of the C++ proxy, the average time across all the websites we tested was 6.25 s with a standard deviation of 3.41 s, while for the Golang one the corresponding times were 5.83 and 2.69 s. These times compared to those of the proxyless configuration (4.18 s and 1.65 s) are rather insignificant. However, the delay becomes noticeable on sites almost 300% bigger than the average one, which in our table exceed the size of 8 MB. In addition, no major difference appears between HTTP and HTTPS websites, which means that the client’s gateway acting as an “TLS Termination Proxy” adds a negligible delay. All in all, the most critical parameter is the “content size" of each website. The most significant time delay was observed on amazon.com, nba.com, and espn.com whose size is among the biggest in
Table 2. As expected, the larger the size of the source code to be examined, the greater the webpage’s loading time.


