Article

A Bibliometric Overview of Twitter-Related Studies Indexed in Web of Science

Department of Social Psychology, Universitat Autònoma de Barcelona, 08193 Barcelona, Spain
*
Author to whom correspondence should be addressed.
Future Internet 2020, 12(5), 91; https://doi.org/10.3390/fi12050091
Submission received: 23 April 2020 / Revised: 18 May 2020 / Accepted: 19 May 2020 / Published: 20 May 2020
(This article belongs to the Special Issue Social Web, New Media, Algorithms and Power)

Abstract

:
Twitter has been one of the most popular social network sites for academic research; the main objective of this study was to update the current knowledge boundary surrounding Twitter-related investigations and, further, identify the major research topics and analyze their evolution across time. A bibliometric analysis has been applied in this article: we retrieved 19,205 Twitter-related academic articles from Web of Science after several steps of data cleaning and preparation. The R package “Bibliometrix” was mainly used in analyzing this content. Our study has two sections, and performance analysis contains 5 categories (Annual Scientific Production, Most Relevant Sources, Most Productive Authors, Most Cited Publications, Most Relevant Keywords.). The science mapping included country collaboration analysis and thematic analysis. We highlight our thematic analysis by splitting the whole bibliographic dataset into three temporal periods, thus a thematic evolution across time has been presented. This study is one of the most comprehensive bibliometric overview in analyzing Twitter-related studies by far. We proceed to explain how the results will benefit the understanding of current academic research interests on the social media giant.

1. Introduction

With more than ten years of prosperity and development, Twitter possesses 330 million monthly active users that send about 500 million tweets per day [1]. Previous reports [2,3] indicated that Twitter was losing its users, but statistics show that the trend of active users in this social network platform is still relatively positive [4].
Data from diverse social network platforms is being used by researchers to develop “a better understanding of how people are using social media in specific circumstances” [5]. Under the global tendency of using Twitter as a daily communication and information tool [6], scientific research about this social network platform has maintained a high growth rate year by year [7]. Twitter data, compared with other digital platforms (e.g., Facebook, Instagram, Snapchat, etc.), is more accessible and can contain valuable resources for academic research; besides, the wide range of data-retrieving method options makes Twitter one of the most studied objects in the social sciences [5,8].
Figuring out the focus of scholars when they study Twitter became a realistic problem in understating such a rapidly developing research field. There are some academic works focusing on this issue; for example, Williams, Terras and Warwick [9] qualitatively reviewed the title and abstract of 1161 Twitter-related articles, they classified these remaining academic works across three dimensions: aspect, method and domain, they found that the majority of the publications relating to Twitter concentrates on messages sent and details of the users. Kang and Lee [10] applied a co-word analysis to a limited bibliographic data of the Korea Citation Index, revealing 53 different disciplines in Twitter scientific literatures. Gupta et al. [7] quantitatively ranked 4709 Twitter-related studies by various categories, including annual global publication, geographic distribution, subject distribution, top keywords, top productive institutions, top authors etc.
Above-mentioned studies have successfully argued the current research environment about Twitter-related studies, but important limitations were also included: First, as the study of Gupta et al. revealed, the total number of academic output of Twitter study is growing rapidly; thus, their study may lose accuracy and representability in today’s view. Second, none of the listed academic publications systematically analyzed the common characteristics of the Twitter scientific literatures, the current Twitter studies’ community structure remains in blank. Third, fore-mentioned studies were mainly descriptive, no analytic insights were explicitly discussed or concluded regarding to how do the related study hotspots or domains were evolved across time.
In this paper, we aim to update the current knowledge boundary in Twitter-related studies by amplifying the research sample, and provide a longitudinal analysis to discuss our proposed research gap.

2. Literature Review

2.1. Twitter and Its Research Lines

One of the most discussed research field of Twitter was its implication on political issues [10], recent years, scholars have argued the influence of using Twitter in sociopolitical movements [11,12,13], in political elections and campaigns [14,15,16]. Despite the fact that how much influence Twitter has in such events remains under discussion, scholars’ enthusiasm toward Twitter in politics seems increasing. Along with the development of computer science and artificial intelligence, using Twitter as a social, political and economic monitor and predictor becomes a new subject for debate in both engineering and social sciences subjects. For example, scholars used Twitter data to monitor natural disaster social dynamics [17], to detect traffic events [18], to predict general election results [19], to make stock market predictions [20] etc. Table 1 presents a summary table of the aforementioned articles, which provides the researchers easy access to these studies.
Such research domains and examples are too numerous to list here; there are also several academic works that provided a panorama for this subject. Williams et al., [9] qualitatively classified more than 1000 Twitter-related academic works, they categorized them into 13 domains, which were Business, Classification, Communication, Education, Emergency, Geography, Health, Libraries, Linguistics, Search, Security, Technical, Other. Zimmer and Proferes [21] analyzed the content of 382 Twitter-related academic publications from 2006 to 2012, they classified 17 different domains and 9 categories of research methods regarding to their analyzed papers. On the other hand, they found that the publications related to emerging innovative research methods such as data-driven analysis were developed more rapidly than other types of publication, at the same time, the demand for tweet content as research raw data is also increasing. Hence, they argued that more studies mush be updated with the continued growth of Twitter-based research.
Weller [22] analyzed Twitter-related scientific literature within social science disciplines, with a focus on the most highly cited articles. The common patterns inside these publications have been found, they fit new methods and research designs into classical methodological backgrounds in both qualitative and quantitative approaches. Meanwhile, she argued that studies about Twitter should not solely rely on single datasets and methods, and that the combination of newly emerged methods and classical methods and the connection of Twitter data with other online or offline data sources would positively improve future studies. Researchers have also studied 134 Twitter-related scientific articles indexed in PubMed [23]: they found the early Twitter-focused publications introduced the topic and highlighted its potential, but without any form of data analysis. However, data analytic techniques were mainstream methods in most of the later publications. Despite the fact that the size of the dataset in these papers varies significantly, they argued that the study of Twitter is becoming quantitative research.

2.2. Methodological Background

For fully completing our research aim, an in-depth bibliometric analysis is going to be applied. Bibliometric analysis is a useful method for measuring the scientific impact, influence and relationships of the published academic works in a certain research framework [24]. Due to the huge amount of scientific literature, manually organizing results within a specific subject under a giant database becomes unfeasible; hence, scientific measurement technique was considered a viable approach for obtaining a detailed overview of a large bibliographic information [25,26].
In bibliometric studies, two main procedures are contained: performance analysis and science mapping [27,28]. Performance analysis enables the evaluation of scientific publication and citation structures on the basis of bibliographic data such as author(s), author affiliation(s) (university, department), academic journal, conference and country, etc., as well as the impact of their activities on the basis of those data [29,30]. Science mapping displays structural and dynamic aspects of scientific research, which can be generated by the visualization function of digital bibliometric tools [27,31]. Corresponding to our objectives, performance analysis serves for describing the current environment of Twitter studies (e.g., annual scientific production, most productive authors etc.) Science mapping will allow us to illustrate the collaboration structure between countries, the main themes of Twitter-related studies and their evolution over time.
There are different ways to analyze and visualize the research topics of an academic subject; one of them is thematic map. It was first proposed by Callon, Courtial and Laville [32], and is a coordinate system consisting of centrality (x-axis) and density (y-axis). According to them [32] “centrality measures for a given cluster the intensity of its links with other clusters, the more numerous and stronger are these links, the more this cluster designates a set of research problems considered crucial by the scientific or technological community” (p. 164), while “density characterizes the strength of the links that tie the words making up the cluster together. The stronger these links are, the more the research problems corresponding to the cluster constitute a coherent and integrated whole” (p. 165). Thus, a research subject could be classified in 4 quadrants by these two values, each representing a specific theme module, and it would be displayed by a relevant (author) keyword of the bibliographic data, analyzing where the keyword (research theme) lies on is the essential method to interpret the thematic map, thus, the research topics.
Figure 1 shows a thematic map strategic diagram [32]. In the last ten years, researchers have also interpreted this diagram in a more easily understandable way. Cobo et al. [33] take the first quadrant (central and developed) as the space of motor themes, the second quadrant (Central and undeveloped) as the space of basic and transversal themes, the third quadrant (Peripheral and developed) as the space of highly developed and isolated themes, and the fourth quadrant (Peripheral and undeveloped) as the space of emerging or declining themes.

3. Methods

3.1. Data Collection and Preparation

We retrieved our original data from Web of Science (Core Collection) with the keyword (topic) ‘Twitter’, during the period from January 2006 to April 2020. Searched documents (articles, conference proceedings, books, book chapters) are saved with full records and cited references.
The data preparation phase contained two parts. First, a keyword data depuration step was performed. For this purpose, we built a de-pluralization corpus with the help of SciMAT word manager function [34], such function provides an automatic procedure to generate de-pluralization list of the existing keywords (e.g., tweets - tweet), as a result, a total number of 1864 terms were set for this phase. Second, since “Twitter” was the term used for the selection of data, apparently it is the most common keyword in our data, and appears in every document, it might be too impactful to best present our results. Inspired by Leopold, May and Paaß [35], we eliminated it from the set of keywords to improve the quality of our results.

3.2. Bibliometric Analysis Strategies

In the performance analysis phase, by using R package “Bibliometrix” [26], basic analysis results about Twitter-related research were calculated and reported in 5 categories: Annual Scientific Production, Most Relevant Sources, Most Productive Authors, Most Cited Publications and Most Relevant Keywords.
In the science mapping phase, a country collaboration network based on association strength normalization [36] will be plotted. This network is made by using bibliometric analysis tool Vosviewer [37] with its own clustering algorithm [38]. For studying the research topics and their temporal evolution, we will split our bibliographic dataset according to the Annual Scientific Production, three main research periods will be sliced: initial research period, developing research period, and advanced research period. Bibliometrix provides the possibility to plot thematic map for each of the period based on co-word networks and clustering [26,32].

4. Results and Discussion

4.1. Performance Analysis

A total number of 19,205 academic publications were collected according to our searching strategy. There were 7033 different sources (journals, books etc.) for the publication of all the retrieved bibliographic data, including 37,455 authors. The number of average citations per article was 9.06, and the number of authors per article was 1.95. A total number of 73,178 Author Keywords (AK, keywords provided by the original authors) and 39,747 Keywords Plus (KP, keywords extracted from the titles of the cited references by Thomson Reuters) have been collected, among them, there were 27,179 unique AK, and 7066 unique KP. After applying the de-pluralization corpus, the number of AK has reduced to 25,686, and the number of KP was 6565.
Wang and Chai has introduced the concept of indicator K to quantitatively describe the discipline’s development stages [39], it is measured by the ratio between the unique AK number and the overall AK number. The indicator K of Twitter-related scientific literature is 0.35, which means Twitter research is currently on its normal science stage. This stage means a long-period development of the subject, with further establishment of mature concepts; this stage is expected to step into the post-normal stage with less scientific innovation and vitality [39].

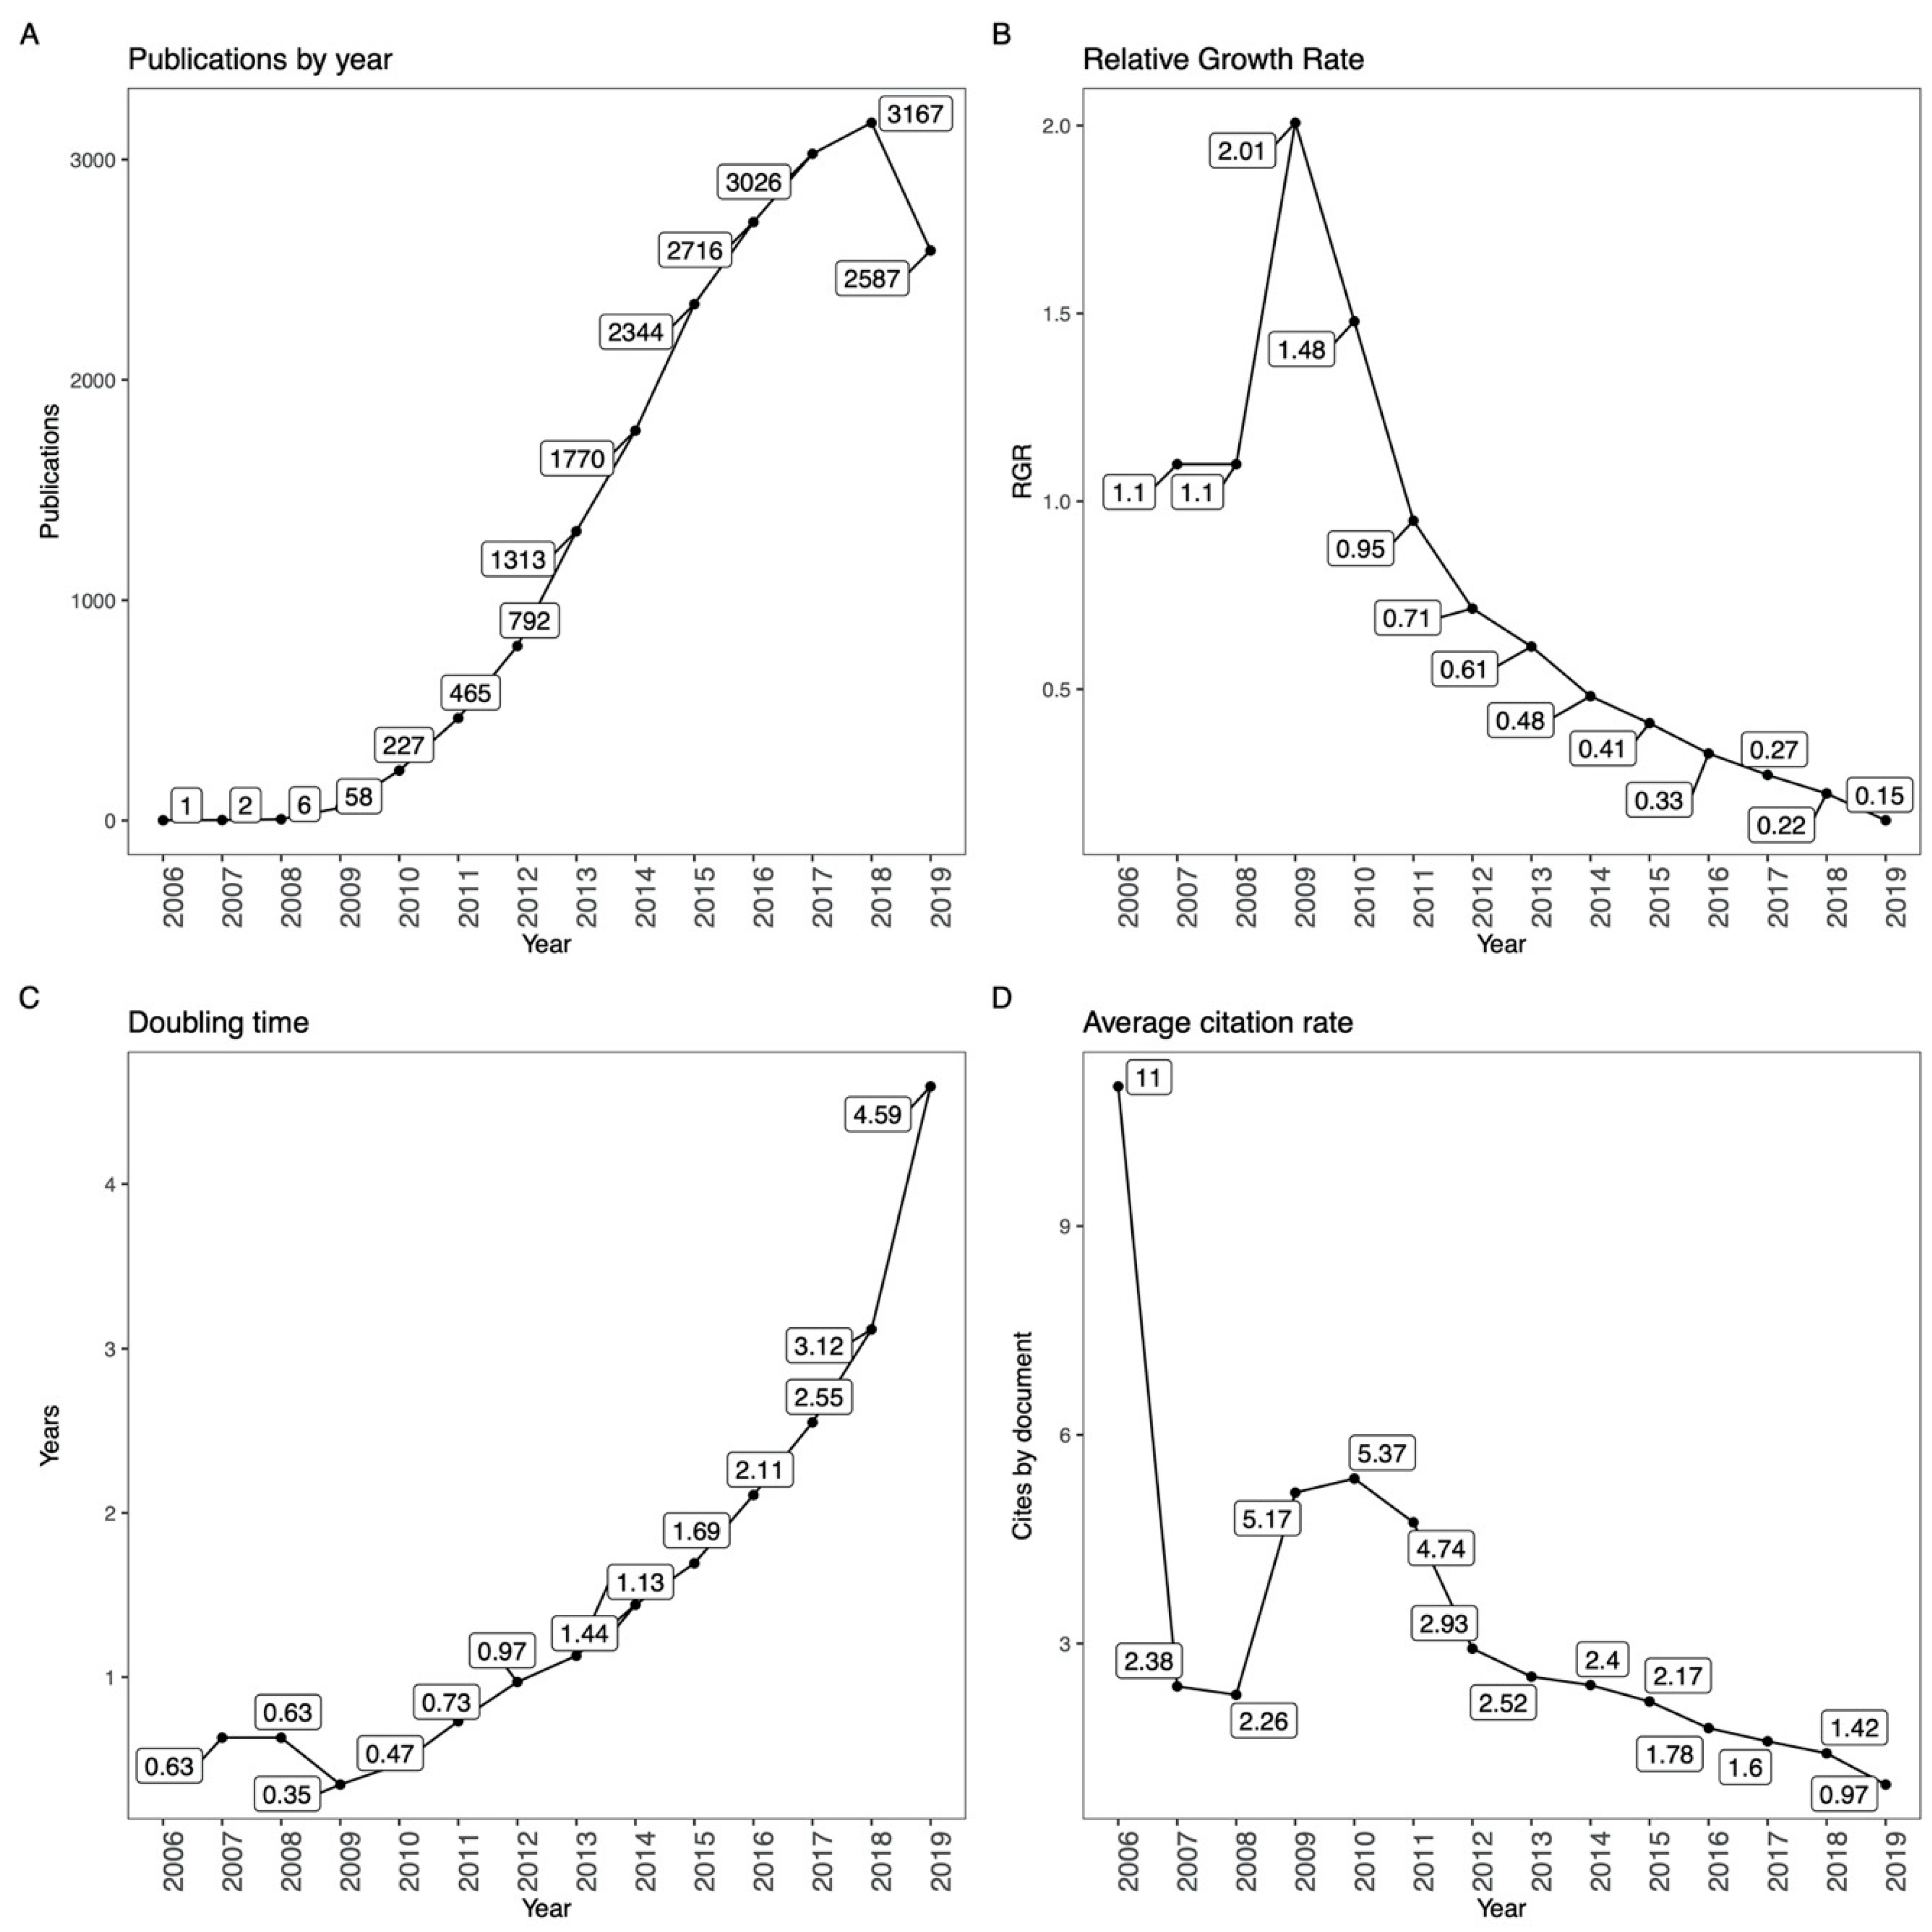
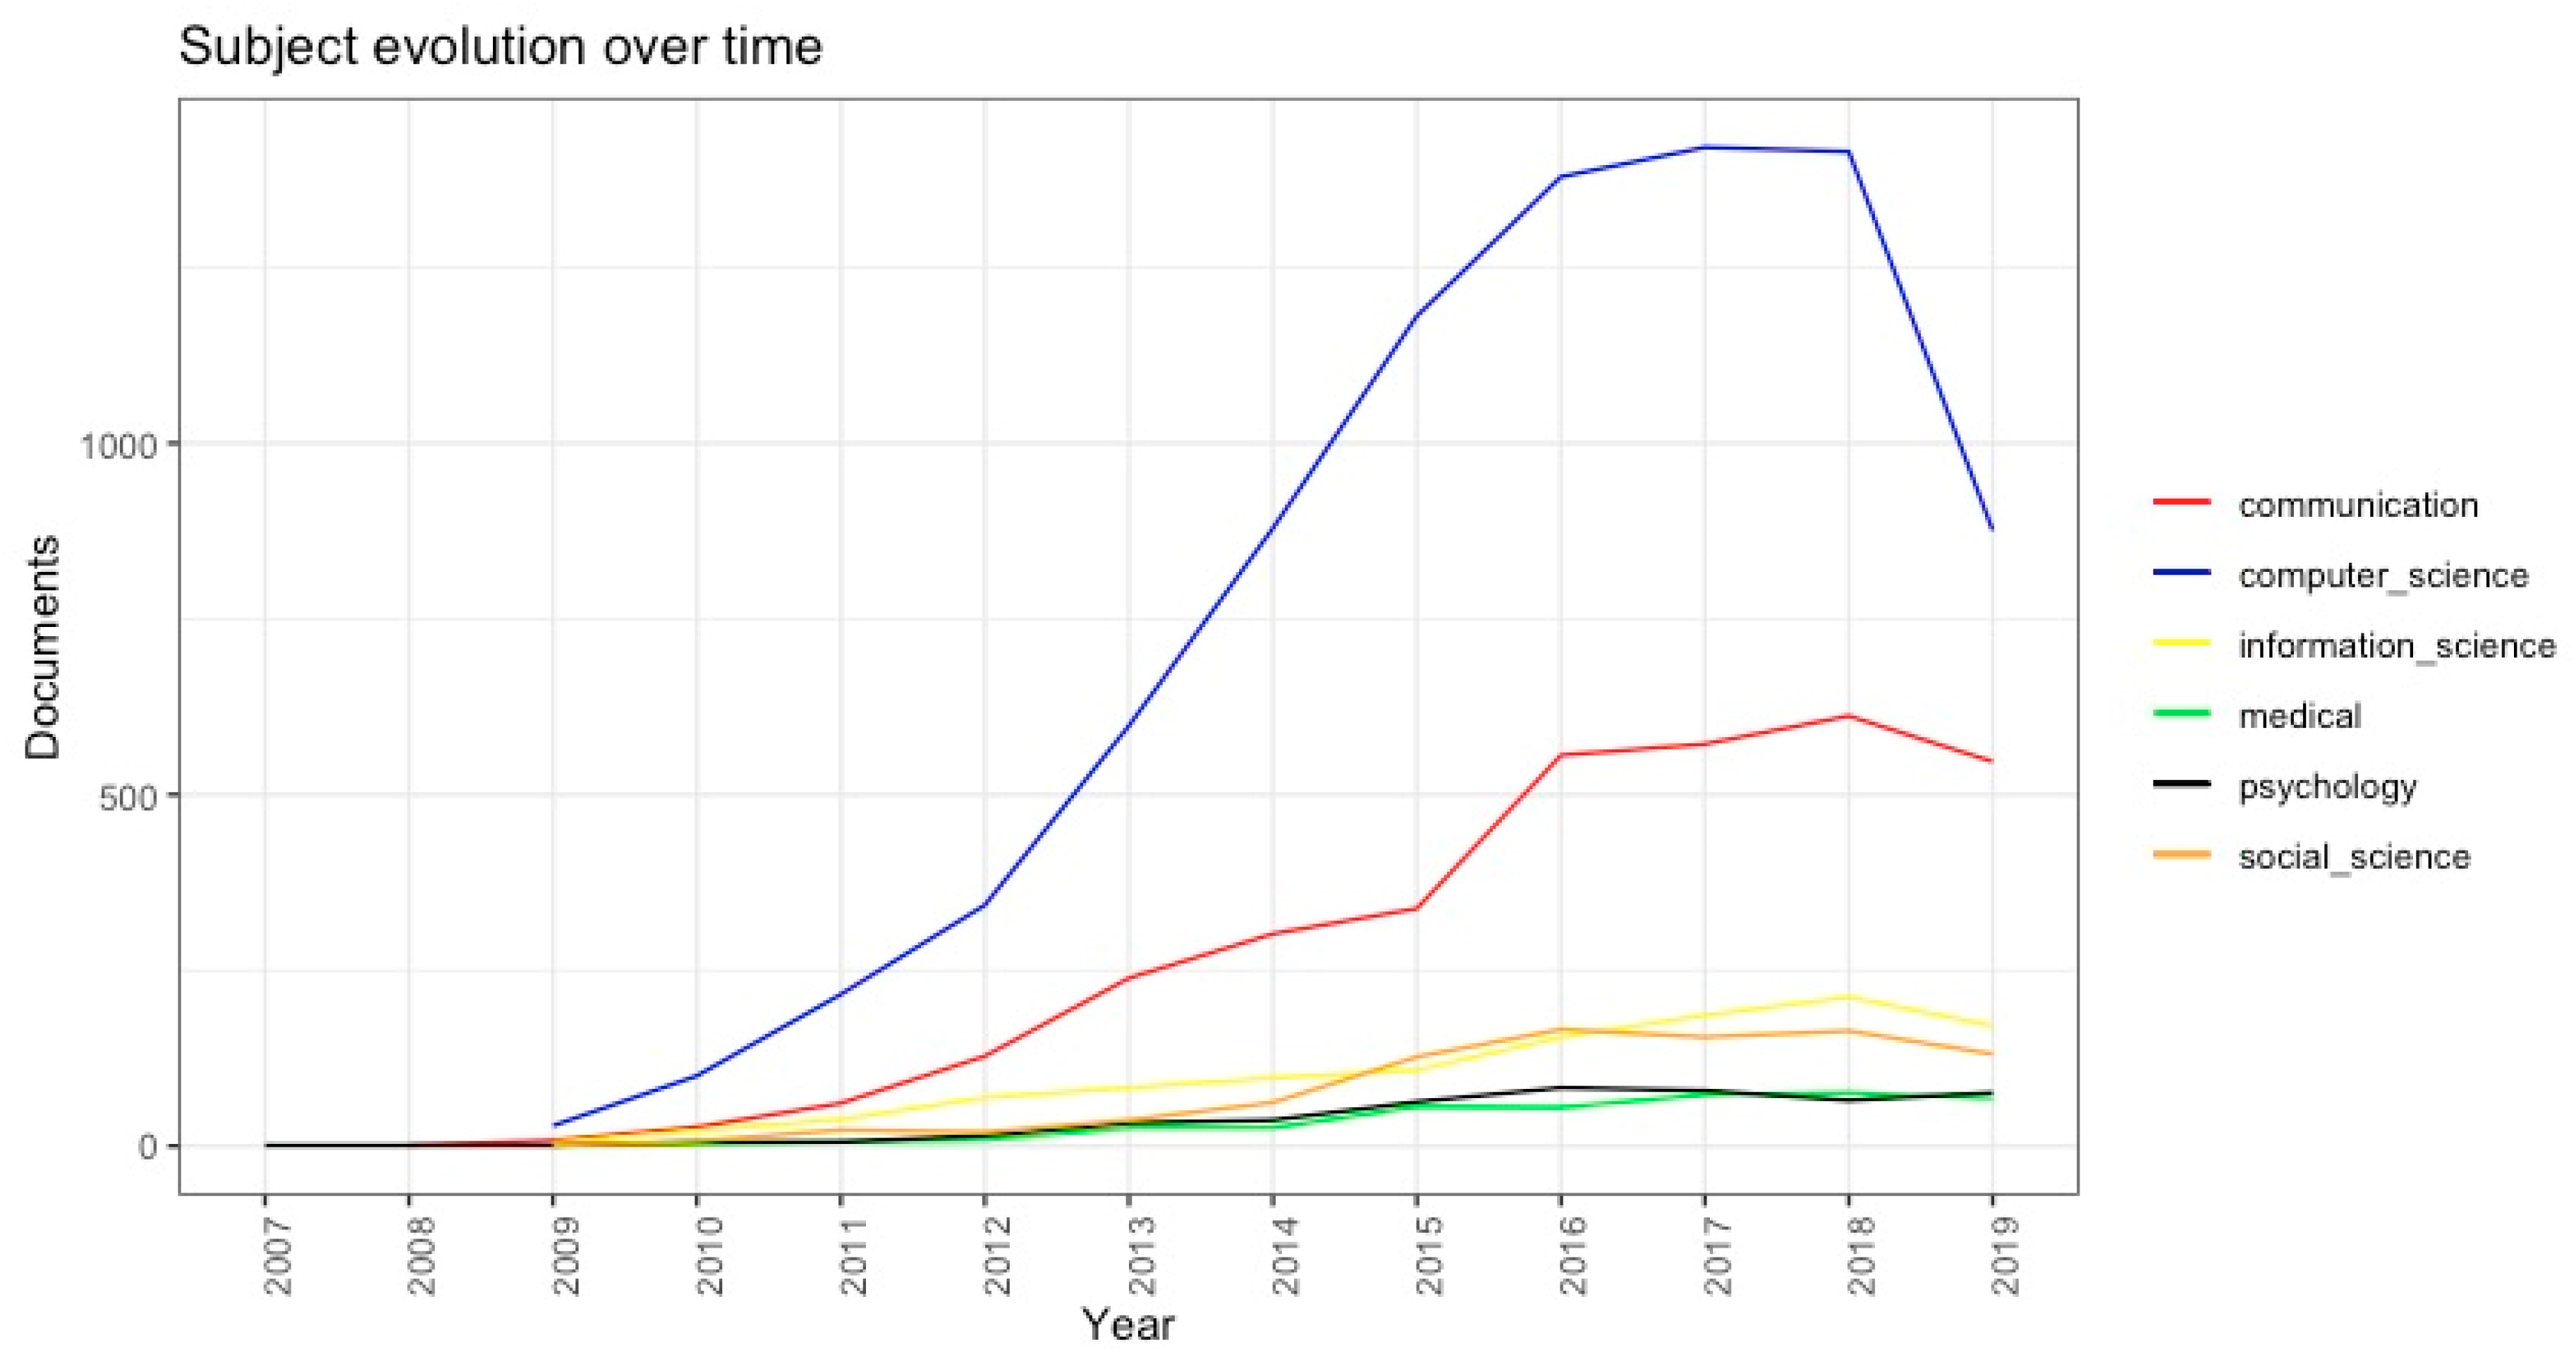
4.1.1. Annual Scientific Production

The annual scientific production (Figure 2) consists of four parts, productions by year, relative growth rate (RGR), doubling time (DT) and average citation rate (ACR). As we retrieved our bibliographic data in April 2020, the total number of scientific publications of 2020 is not complete, hence, we did not include the data of 2020 in this analysis. RGR represents the increase in the cumulative number of publications per unit of time (year), while DT refers to the required time for publications to become double the existing amount [40,41], and the ACR represents the normalized number of citations per document. It should be mentioned that in this section, only bibliographic data with year information can be calculated, in our retrieved dataset, there are 297 documents have no such information, so the total number of calculated documents in this section is 18,474 (with publications of the year 2020 excluded).
In general, the production of academic research kept increasing year by year, however, the number of Twitter-related publication of 2019 is less than 2018. The RGR and DT demonstrated that although the quantity of related research keeps growing, their growth rate and speed have been largely turned down in recent years. As for ACR, due to the very limited number of publications in the first three years, the ACR index in those years is considered meaningless, in general, the ACR presents a negative growth trending, it is understandable, because older articles tend to be more cited than new published articles [42].

4.1.2. Most Relevant Sources

PLOS ONE is the most popular journal in publishing academic works for studies on Twitter. A total number of 251 articles were published on this scientific journal. In addition to PLOS ONE, there are 7 journals (Computers in Human Behavior, Journal of Medical Internet Research, Information, Communication & Society, New Media & Society, Social Network Analysis and Mining, International Journal of Communication and Social Media + Society) that have published more than 100 articles with the theme ‘Twitter’. Table 2 shows our results in detail; the column ‘Subject’ refers to the journals’ domain according to the classification information of Web of Science.
Corresponding to the most relevant sources of academic publication, most of them belong to the subjects of communication and computer science. The rest of the subjects are mostly related to social sciences and informational science. Only a few journals dedicated to psychology and medical information. Figure 3 presents a year-by year evolution line chart of the fore-mentioned subjects: x-axis represents the year and the y-axis represents the number of publications under a certain subject. This line chart has proved our previous argument, that communication and computer science are the two main subjects in Twitter-related researches—both of the two disciplines have been largely developed since 2012. Twitter studies published in social science and information science journals are slightly more numerous than those in psychology and medical journals. All the four minor disciplines kept a relatively low increase rate.

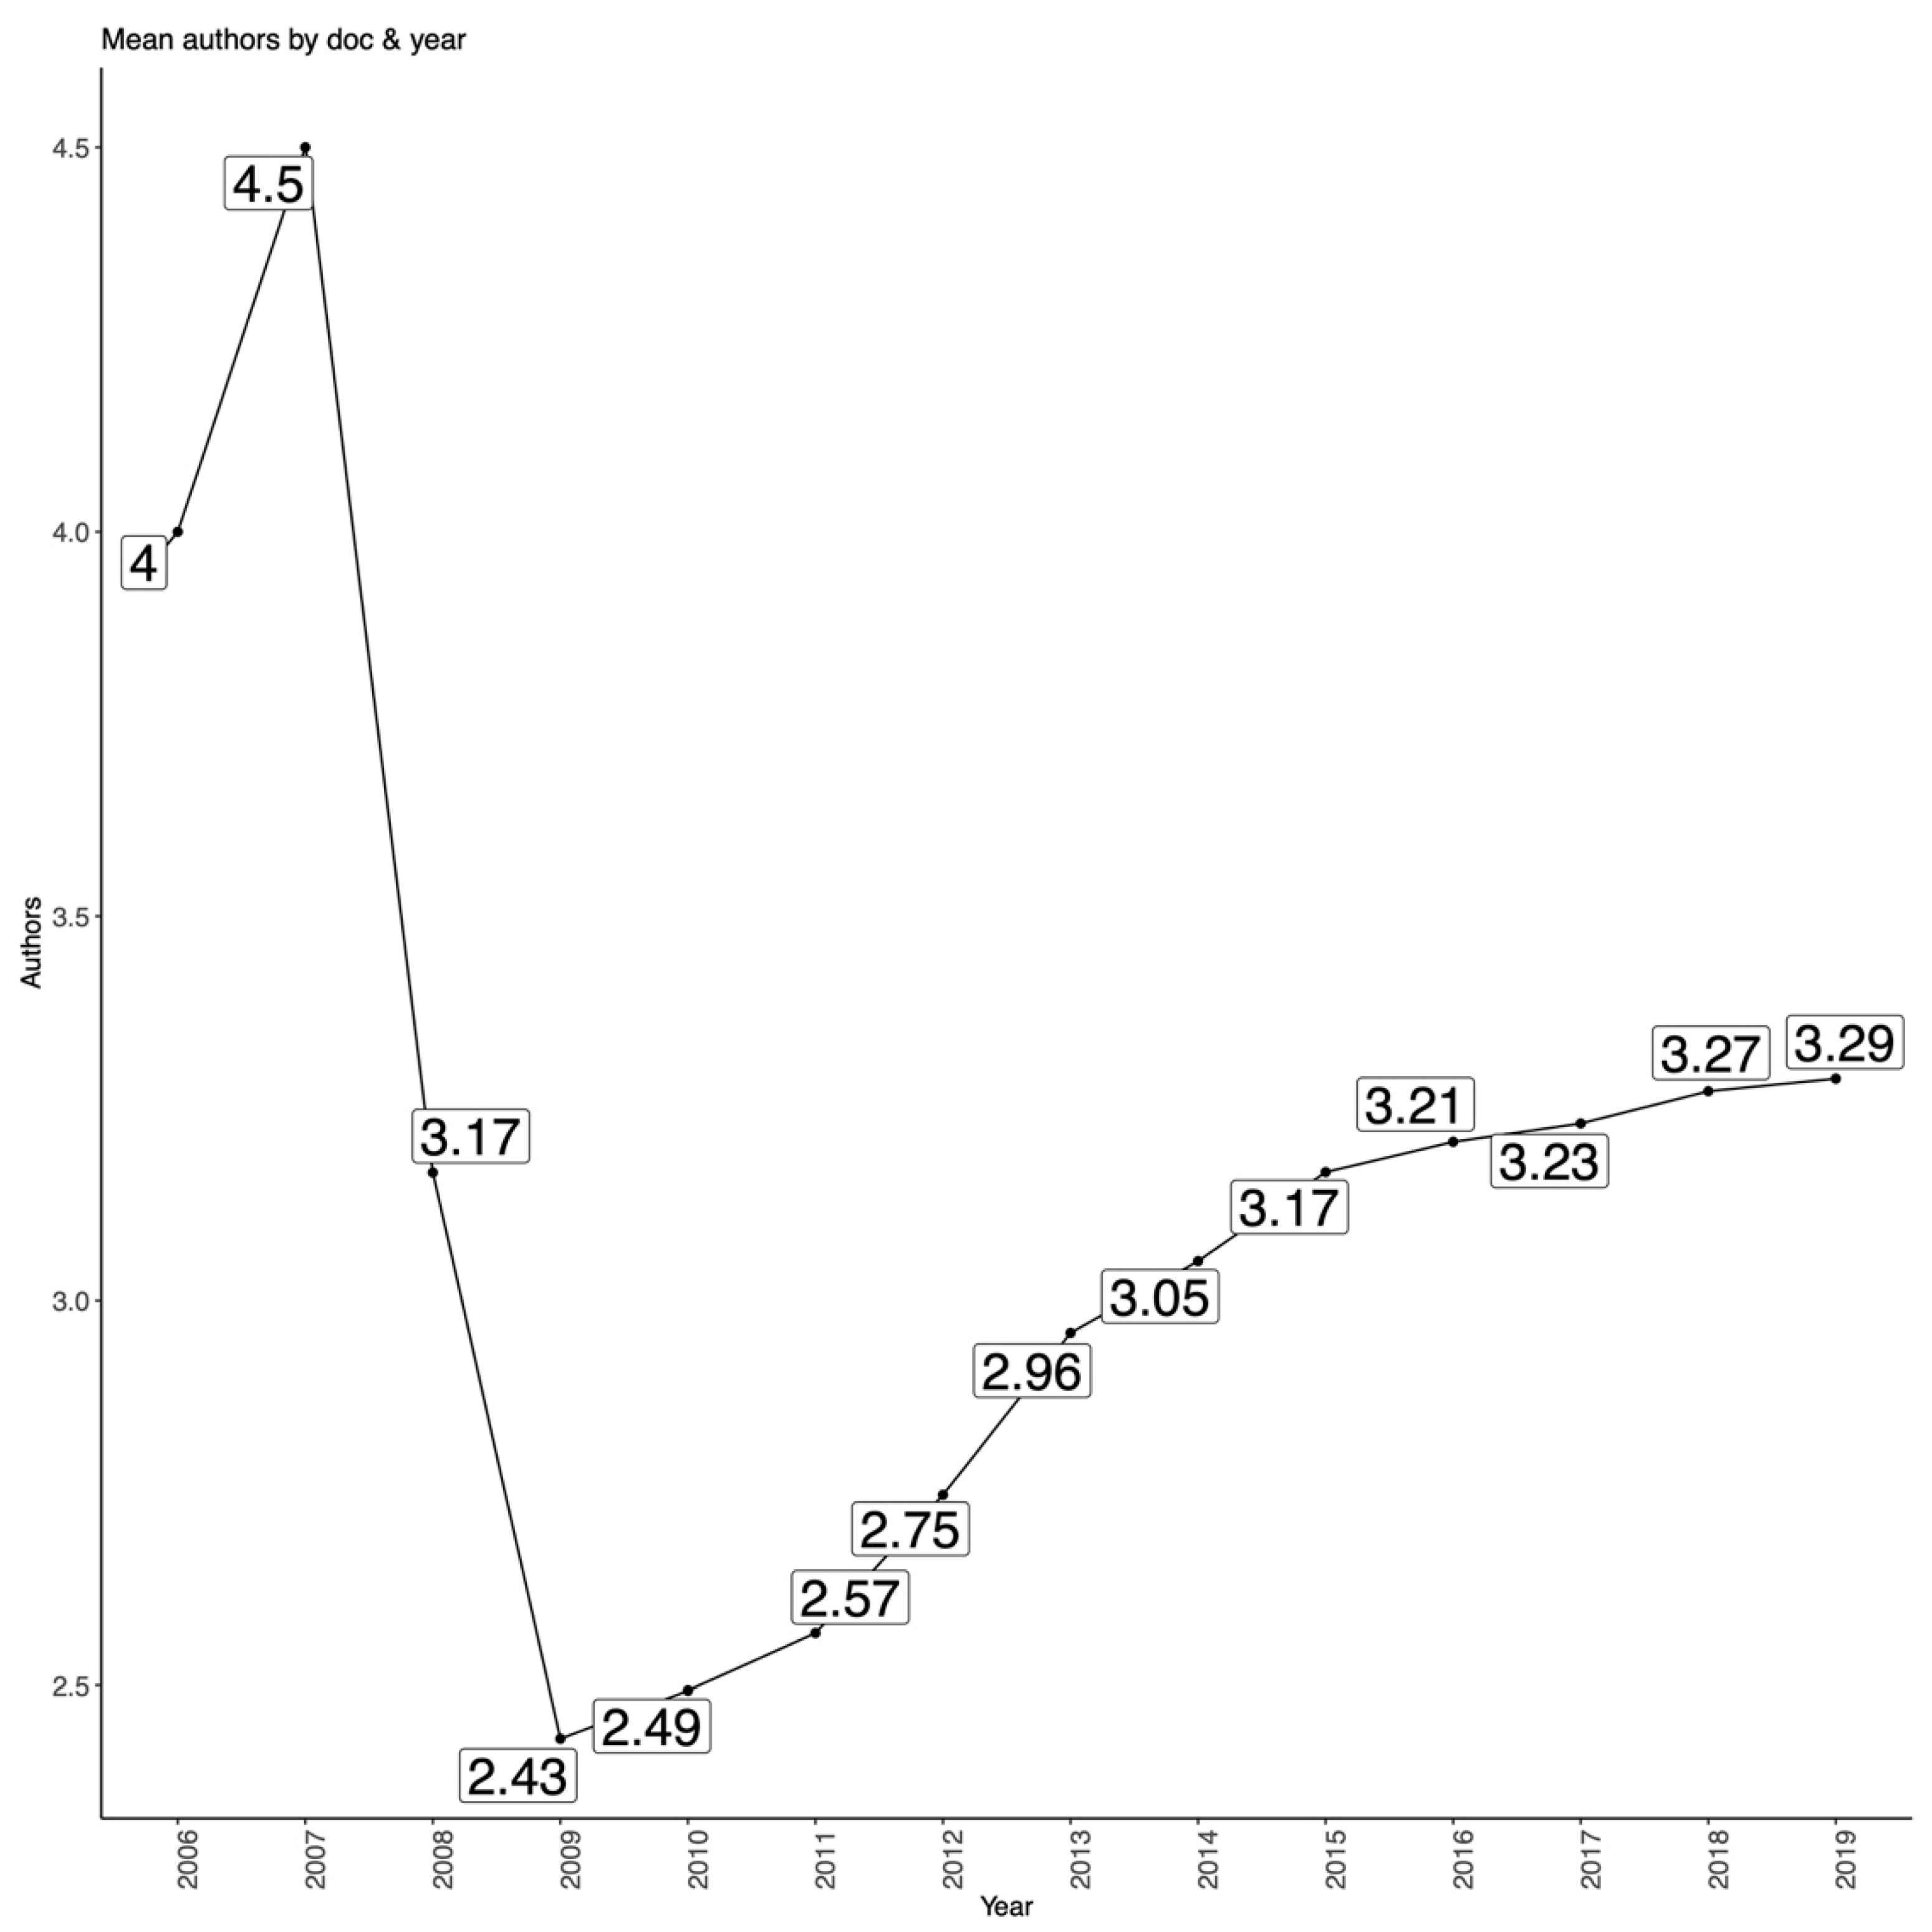
4.1.3. Author Statistics and Most Cited Publications

Table 3 shows the most productive authors and most cited publications (ranked by total citation) in Twitter-related studies. Different from previous results of most relevant sources, we find three highly cited papers were published in the journal Business Horizon: this proves the study of Twitter may have a high interdisciplinary impact. However, as row citation counts are not useful for comparison purpose because older articles tend to be more cited [42], here we are not going to further discuss about this ranking, the table of most cited publications is only intended to help researchers master the information in its entirety.
However, the table of top 10 most cited publications would be slightly changed if we rank the publications by their annual citation rate, another 4 papers would appear on this table, they are “Vosoughi S, 2018, Science” (218), “Isola P, 2017, Proc CVPR IEEE” (138), “Stephens ZD, 2015, Plos Biol” (77), “Huang JD, 2019, Tob Control” (76). The numbers inside the parenthesis are their average citation number per year.
Figure 4 presents a line chart of the average number of authors per year per document; for example, in 2019, there were 3.29 authors per publication in Twitter-related researches. Given the very limited number of publications in the year 2006(1), 2007(2) and 2008(6), the mean number of authors in these years is considered meaningless. From the year 2009, the average number of authors per document kept increasing, this implies that scholars are becoming more and more cooperative with each other in Twitter-related studies.

4.1.4. Most Relevant Keywords

Table 4 shows the most relevant author keywords and keyword plus. Both of the two kinds of keywords are mostly related to computer science and communication. On the whole, Author Keywords and Keywords Plus revealed similar research trends; both of the two types of keywords described equally the focus of Twitter-related studies. However, small differences can still be observed.
As presented, Author Keywords emphasized research methods and techniques, for example, there are terms like “sentiment analysis”, “machine learning”, “social network analysis”, “text mining”, whereas Keywork Plus tended to focus on specific research objects, like “media”, “news” etc. As Keywords Plus are words or phrases that frequently appear in the titles of the articles’ references [43], here we agree with the argument of Zhang et al, that Keywords Plus is less comprehensive in representing an article’s content [44].

4.2. Science Mapping

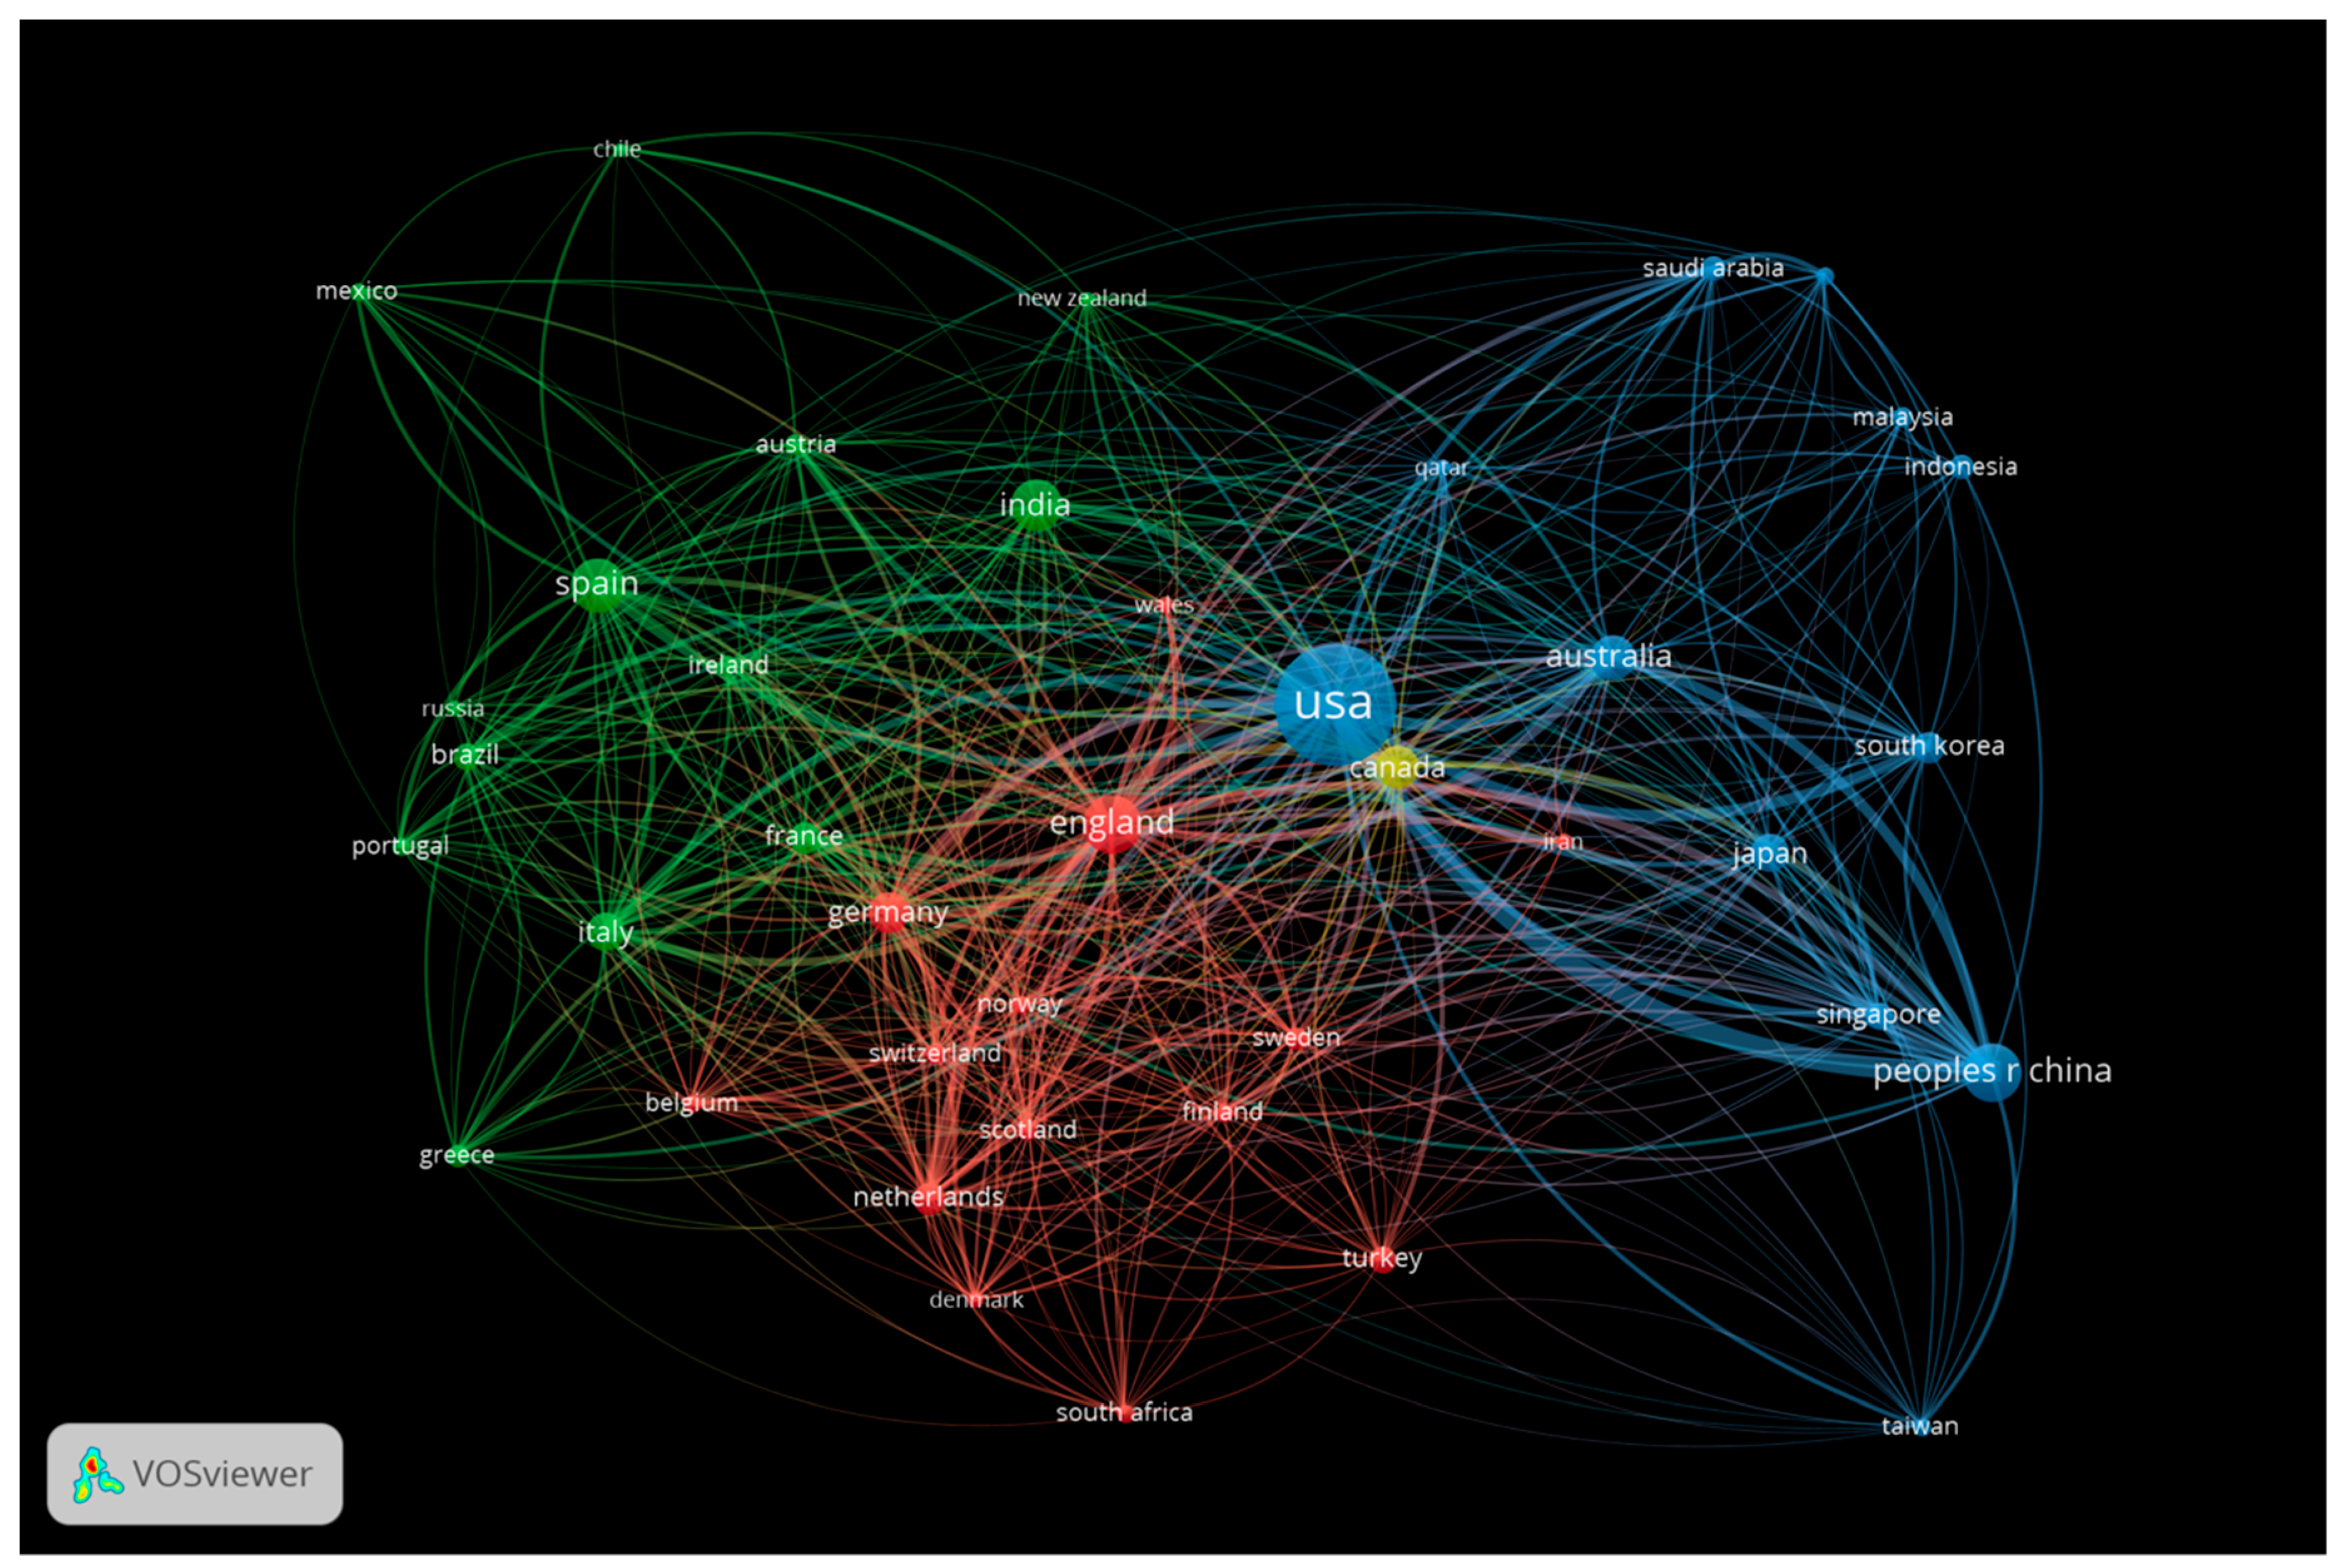
4.2.1. Country Collaboration Network

Vosviewer presents the country collaboration network based on co-occurrence frequencies. By default, the association strength is employed to normalize the network [45], this method has also been proved as one of the best [36]. The clustering algorithm is based on a weighted and parameterized variant of the well-known modularity function of Newman and Girvan [46].
Figure 5 shows the top 40 country collaboration network of our retrieved bibliographic data, it is able to reflect the degree of communication between countries as well as the influential countries in this field [47]. Three major communities (with different node colors) can be found from the network. The size of the nodes represents the impact of the country on Twitter-related studies (based on the number of publications). The edges between nodes represent strength of the cooperative relationships between countries.
It can be easily observed that European countries has a highly internal collaboration ties, while for Asian-Pacific countries, North American countries are their most frequent collaboration partners. However, for USA and Canada, they have strong ties with both European and Asian-Pacific countries. There are also close relations between Iberian countries and Latin American counties, naturally, we believe the common language usage among these countries are the main reason of their close ties.
Table 5 gives the detailed information about the top 10 most productive countries of Twitter-related studies, SCP is the abbreviation of Single Country Publications, and MCP is Multiple Country Publications, MCP Ratio is MCP as a proportion of total publication number. European countries like the UK, Spain, Germany and Italy share a relatively high degree of international collaboration. Despite the fact that China has the highest index, other Asian countries (India and Japan) hold the lowest ratio. From another perspective, English-speaking countries (USA, UK, Australia, Canada) hold a relatively high degree of international collaboration than other countries.

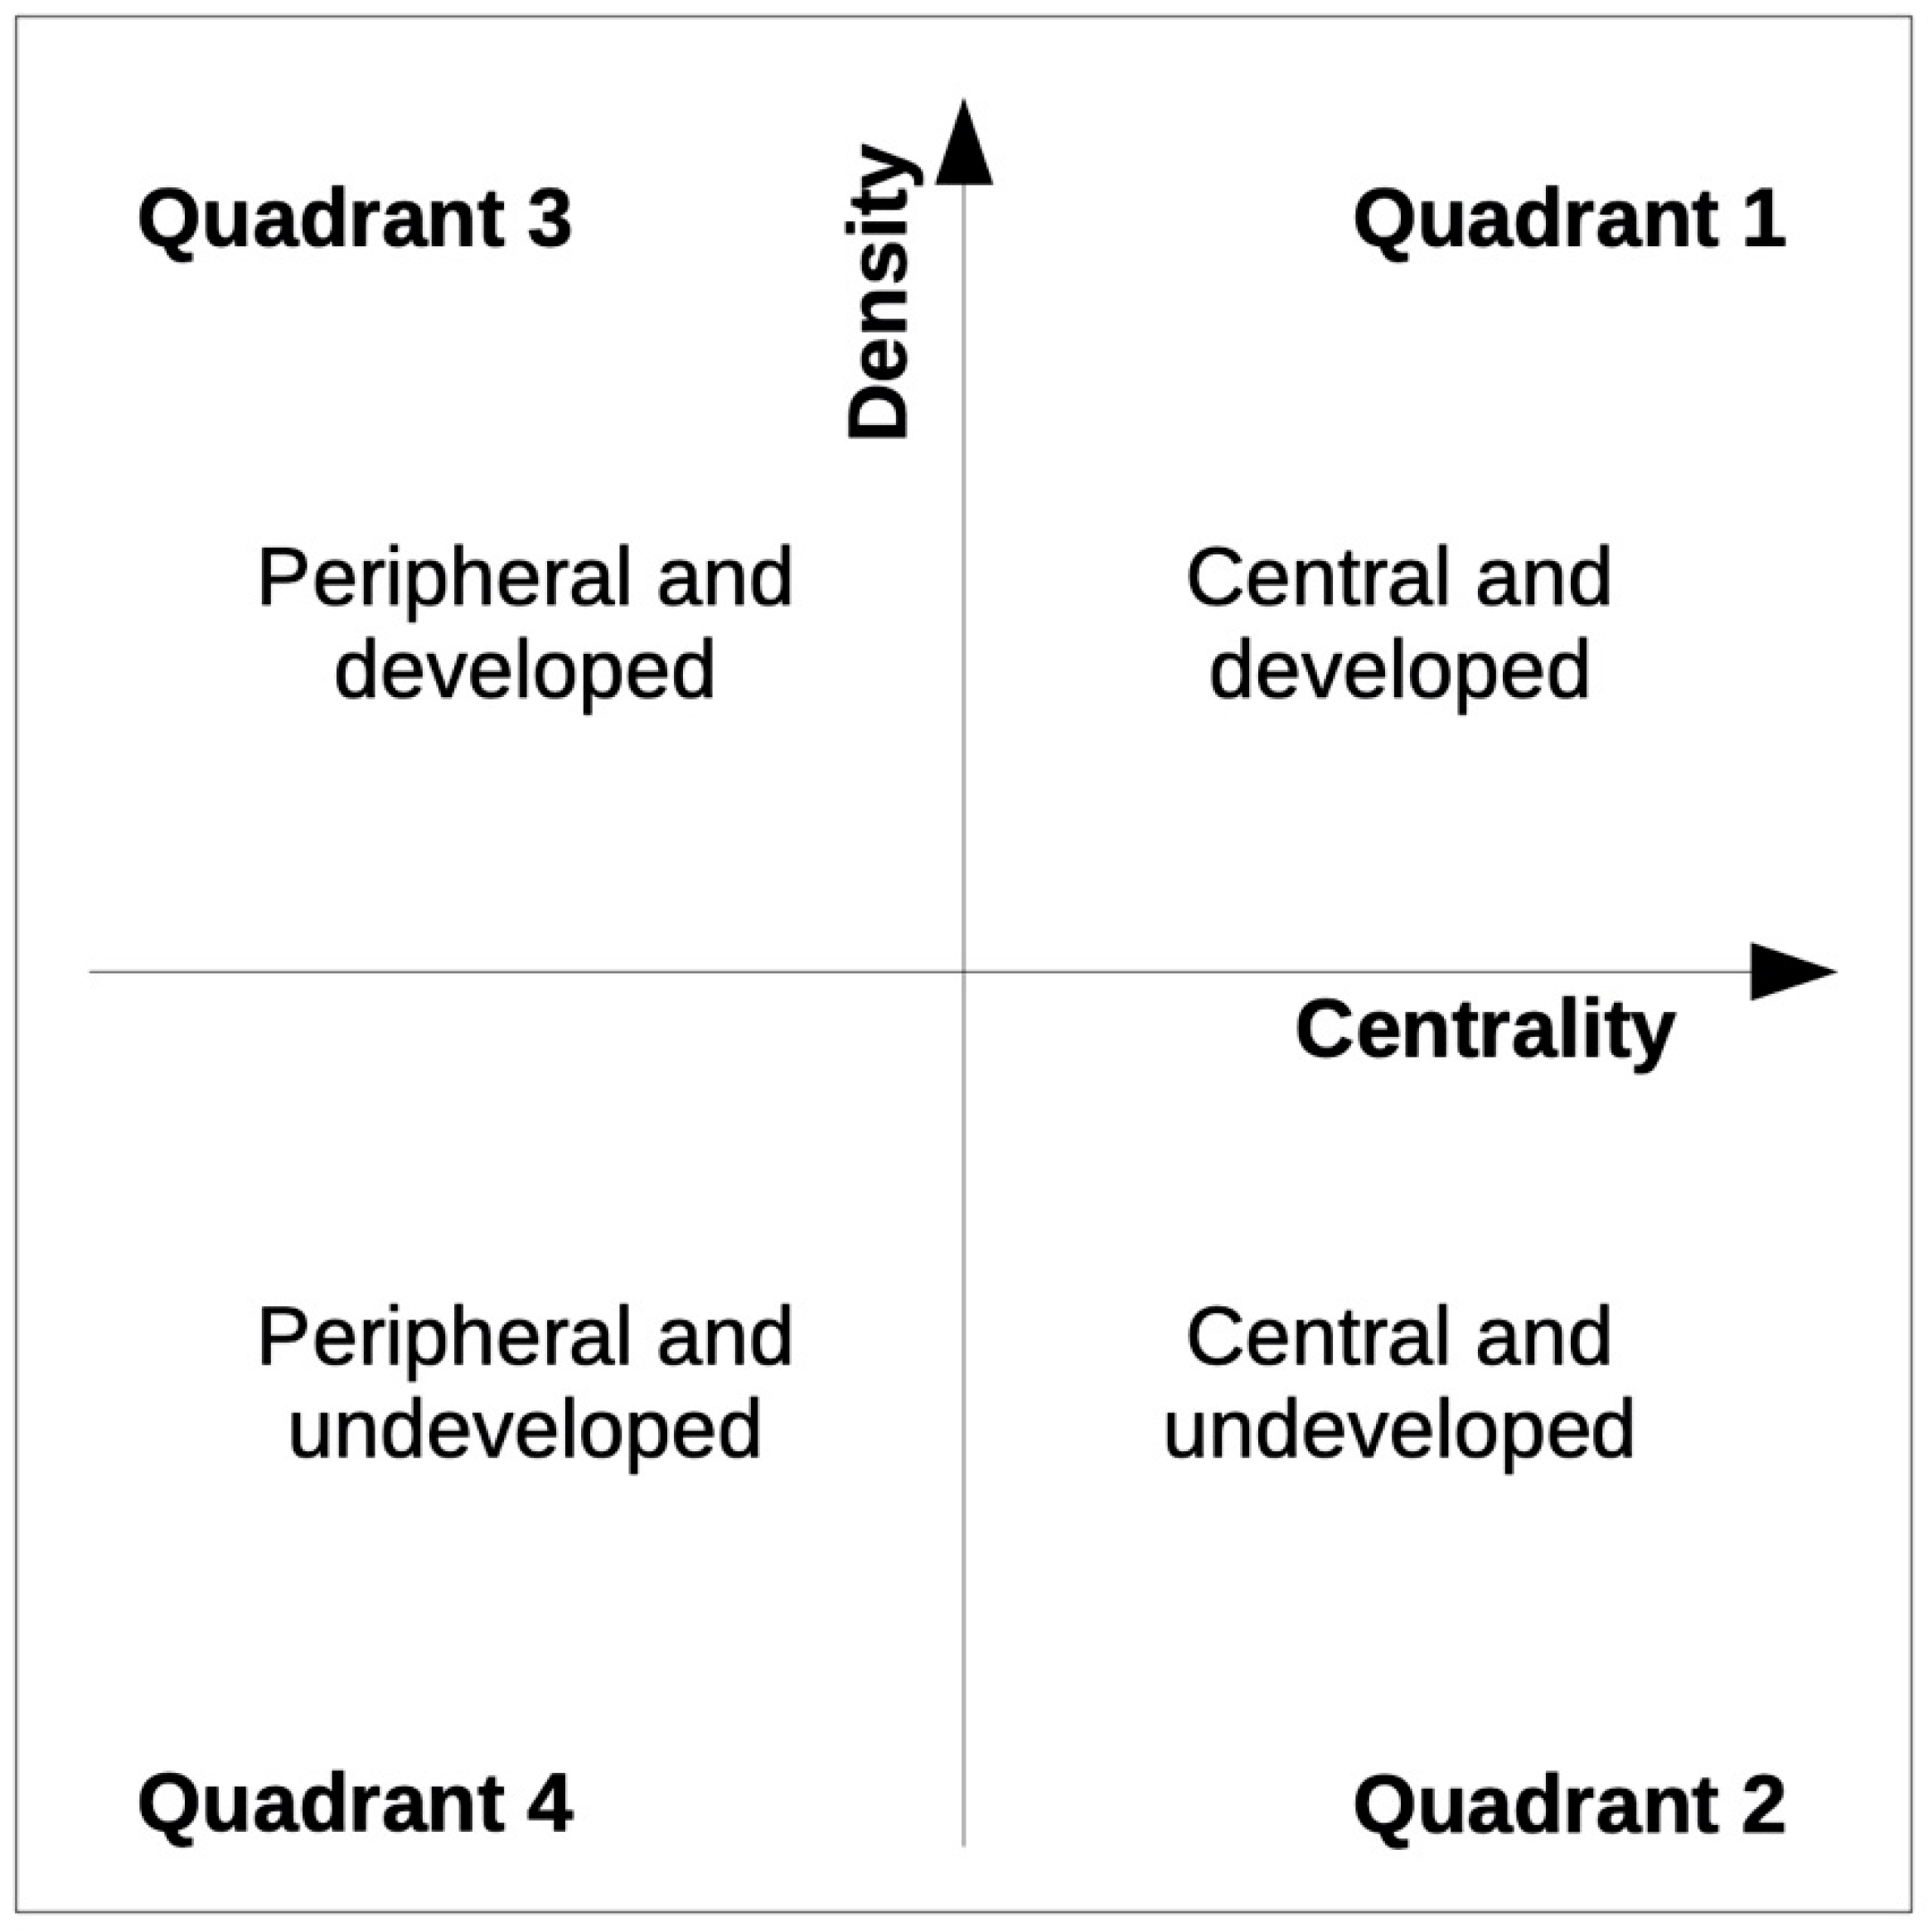
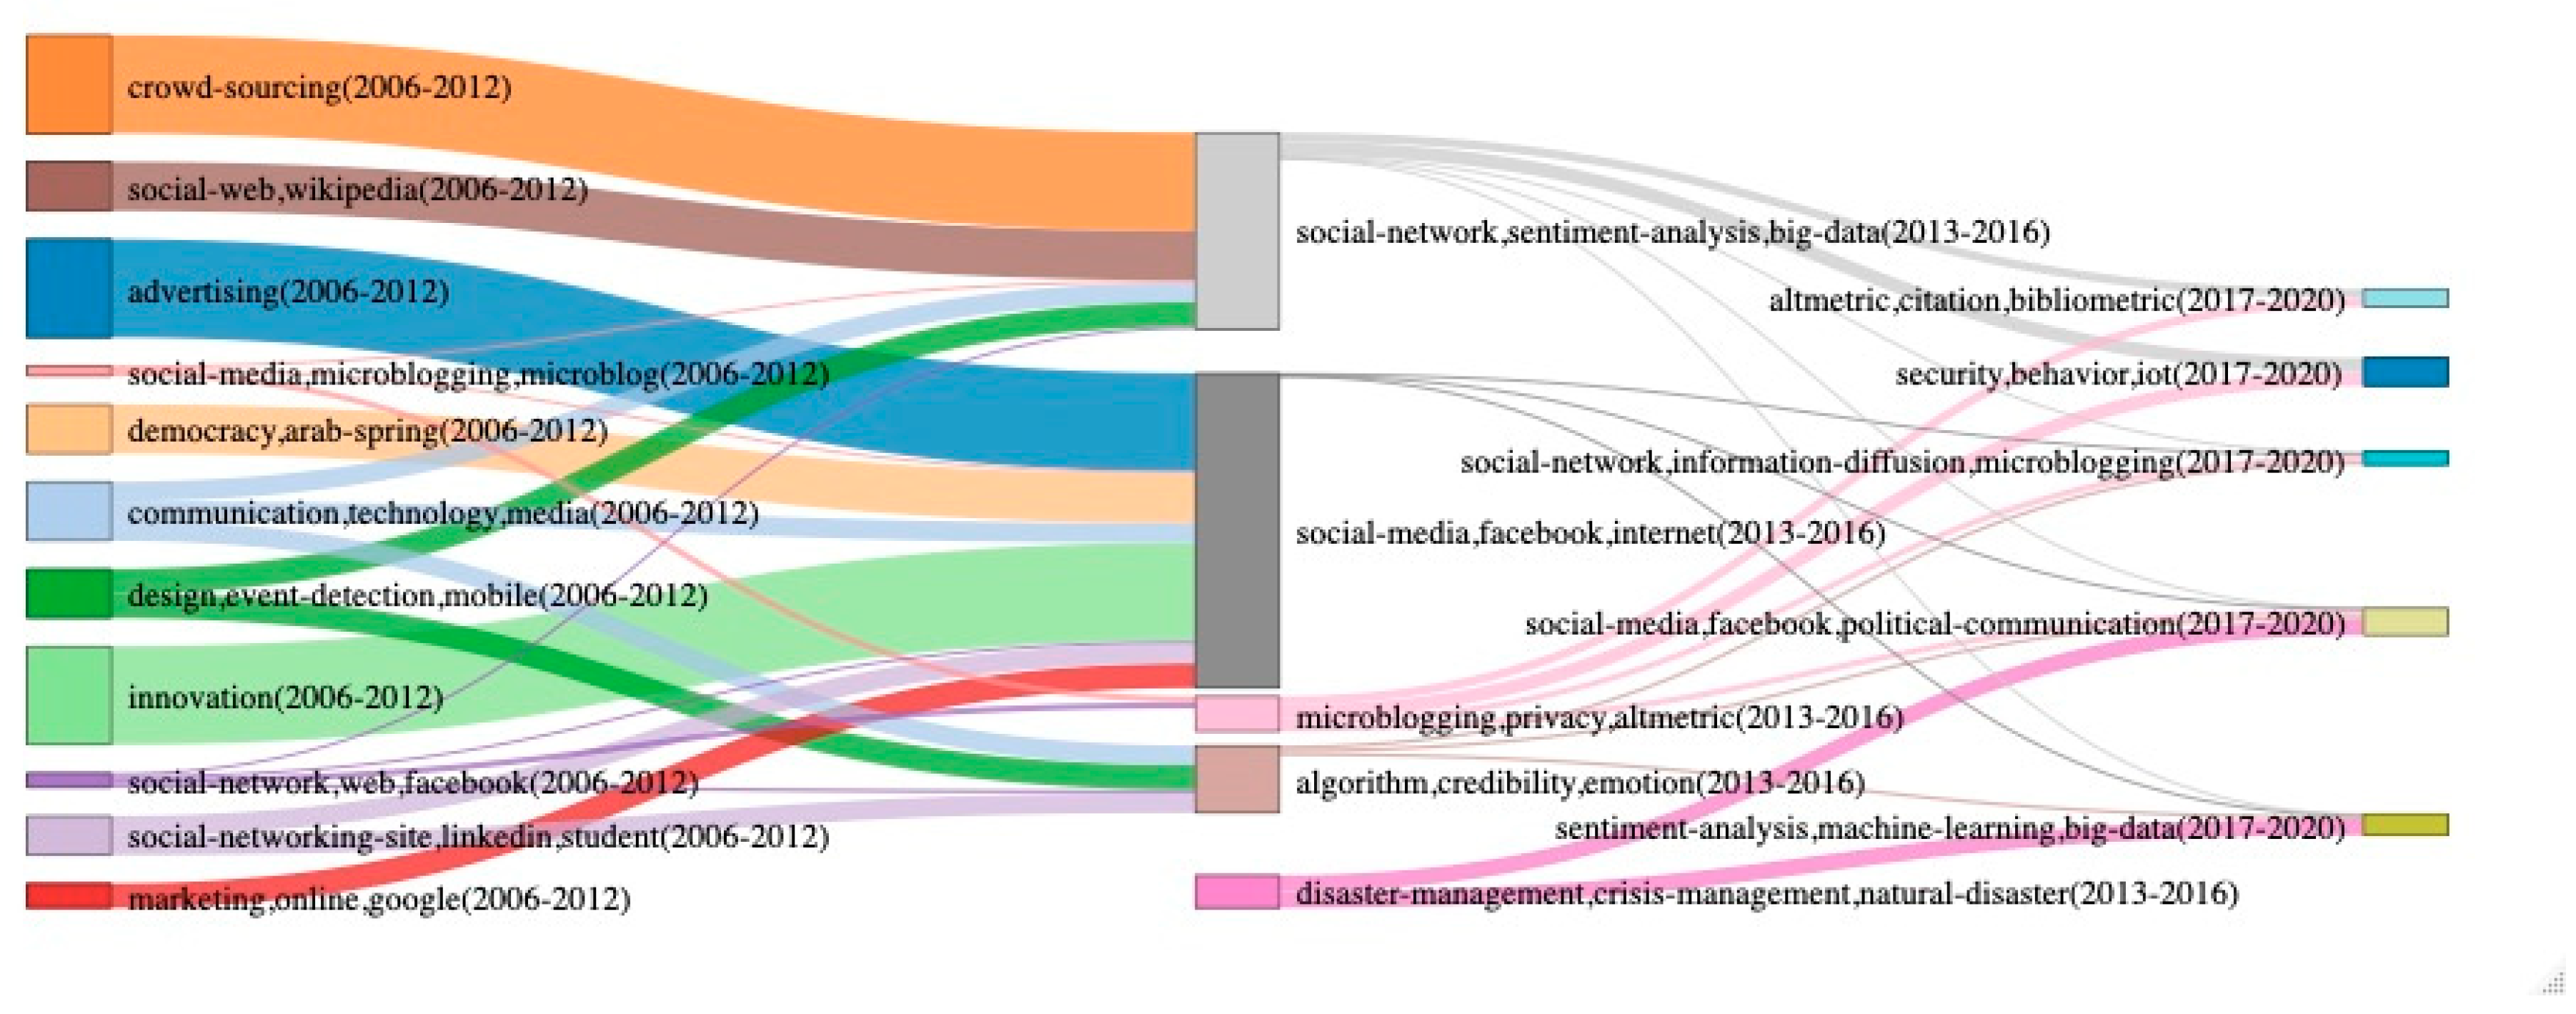
4.2.2. Thematic Analysis

For the analysis of topic evolution across time, a set of time slices is made. According to the Annual Scientific Production, we take three periods to segment the whole Twitter-related scientific development process into three phases: Initial period is from 2006 to 2012: in this period, the publication number is not so much as later years, but RGR is relatively high, DT kept steadily with mild changes. The developing period is from 2013 to 2016; in this period the number of publications increased rapidly, RGR slowed down while DT started to slightly grow. The advanced period is from 2017 to 2020; in this period the number of publications arrived peak, while RGR kept turning down, DT grew immensely.
Figure 6 presents the thematic maps of the three periods, each of the circles represents a cluster and the size of the circle represents the size of the cluster (the number of included terms/keywords). There are fewer clusters in developing and advanced period than the initial period, which implies that there are fewer research topics in last years than the first years.
For the initial period (2006–2012), there are two clusters on the first quadrant with high centrality and density, “marketing, online, google” and “social-web, wikipedia”, these clusters focused on Twitter and other well-known website and marketing, are the motor research themes of this period. The third quadrant mainly consists of three clusters, “innovation”, “crowd-sourcing” and “advertising”, all these three clusters can be considered as specific research topics for business subject, they are the highly developed and isolated themes of 2006–2012. While Twitter was a newly emerged social media in that time, business related topics revealed a high centrality in the initial period, they have been hugely developed in the first years since the foundation of Twitter.
“Democracy, arab-spring” and “design, event-detection, mobile” are the emerging or declining themes, they are independent from each other, “democracy, arab-spring” corresponds to 2010 arab-spring revolution, “design, event-detection, mobile” might related to the studies about smartphone and mobile application, such new electronic device and software also appeared after 2010, there are publications such as “Tweeting with the telly on! Mobile phones as second screen for TV”, “Mobile apps: innovative technology for globalization and inclusion of developing countries” can prove our assumption. It is more reasonable to classify these two clusters as emerging themes, compared to the foundation of Twitter (2006), from 2006 to 2012, such political events and technological innovation occurred in 2010 was even newer.
“Social-networking-site, linkedin, student”, “social-media, microblogging, microblog”, “social-network, web, facebook” are the three clusters that belong to basic and transversal themes; they are mainly focused on other virtual social networks, comparative studies about Twitter and other similar platforms are another important research line in the initial period. However, based on the previous argument, the “social-networking-site, linkedin, student” cluster may also refer to the studies of human resources, online employment and education, there are publications like “Using facebook, linkedin and Twitter for your career”, “Friend or foe? The promise and pitfalls of using social networking sites for HR decisions”, “Comparative survey of students’ behavior on social networks (in Czech perspective)” can prove our assumption.
For the developing period (2013–2016), in general, topics related to business, mobile and arab-spring disappeared from the map, contrarily, computer science related nouns emerged in this period (e.g., algorithm, sentiment-analysis). Cross-platform comparative studies (“social-media, facebook, internet” cluster) moved from basic and transversal themes to motor themes. “Algorithm, credibility, emotion” cluster locates between the first and second quadrant with a very high density, this cluster refers to using computational methods to detect online emotion, and is highly developed within this period. “Microblogging, privacy, altmetric” cluster locates between the third and fourth quadrant, as big data is gaining attention and popularity among researchers in this period, the usage of big data starts to be important, which have also caused people’s awareness about privacy. This cluster may contain two research lines, using Twitter metrics as a tool to measure research impact [48,49], and the privacy caution of using microblog service [50].
Disaster-management, crisis-management, natural-disaster” cluster is the emerging and declining theme of the developing period, apparently, this cluster refers to studies about crisis management and crisis communication during severe disasters, for example, earthquakes [51], tsunami [52], and epidemic crisis [53] etc. The last cluster of this period is “social-network, sentiment-analysis, big-data”—this cluster belongs to basic and transversal theme, data-driven sentiment analysis becomes a popular research method for social media studies in this period.
For the advanced period (2017–2020), there is no absolute motor theme, “social-media, facebook, political-communication” locates between the first and the second quadrant with a high centrality, this cluster refers to the study of political communication with social media. Two clusters are on the second quadrant, “security, behavior, iot (internet of things)” and “altmetric, citation, bibliometric”; they are highly developed and isolated research themes, and independent from each other. Alongside the rapid development of social network sites, the integration of social media and internet of things has formed a new concept, social internet of things (siot) [54], meanwhile, social network-based recommendation system emerges as a new research topic, for example, researchers used Twitter data to personalize movie recommendation system [55], but such advanced technologies also contain considerable security risk. We believe the cluster “security, behavior, iot” refers to use Twitter as an iot medium to study user’s online behavior and the potential cybersecurity concerns of siot. The cluster “altmetric, citation, bibliometric” is easier to interpret—it refers to Twitter-based scientometric studies, compared to the “altmetric” cluster in developing period, the study of scientometrics during 2017 to 2020 becomes an independent and developed research theme.
“Sentiment-analysis, machine-learning, big-data” was the only basic and transversal research theme, this implies computational methods and techniques are widely used in Twitter research from 2017 to 2020. The cluster “social-network, information-diffusion, microblogging” locates between the third and the fourth quadrant, with a low density, this means that although the study of information diffusion on Twitter and microblogs emerged in recent years, yet not fully developed.
Figure 7 presents the alluvial diagram of research thematic evolution across the three previously segmented periods; it provides us a global view of the changes. Each of the nodes represents a cluster, and is labeled by the first three words of the clusters, the edges are their temporal evolution track, generated by keyword co-occurrence of the topics between two time slices [33].
Overall, research topics in the initial period were more than in later periods; business-related research lines took an important place in that time. There are two major research topics in the developing period, “social-network” (social-network, sentiment-analysis, big-data) and “social-media” (social-media, facebook, internet). As we have discussed, they imply different research lines, the former represents Twitter study with computational methods, the latter represents cross-platform comparative studies. Most of the research themes of the initial period were lumped together under these two large topics. Furthermore, “disaster-management” (“disaster-management, crisis-management, natural-disaster”) emerged in the developing period, and it evolved to be an important component for the clusters with information diffusion (“social-network, information-diffusion, microblogging”) and big data (“sentiment-analysis, machine-learning, big-data”) in the advanced period. Scientometric study (“altmetric, citation, bibliometric”) was an important research topic in recent years—naturally, it is strongly associated with clusters containing altmetric (microblogging, privacy, altmetric) and big data (social-network, sentiment-analysis, big-data). Such clusters were also evolution sources for the cluster “security, behavior, iot”.

5. Conclusions

A general approach to analyze and visualize the basic status of Twitter-related studies has been presented in this paper. Compared to previous studies [9,56], our research has largely expanded the number of bibliographic data. With the general description of our bibliographic data, we have successfully illustrated the current twitter study environment. In a nutshell, Twitter is still a research hotspot for both social science and computer science scholars. 2019 was the first year with negative growth, this might be a signal that Twitter-related studies have surpassed the advanced period, but this assumption should be further confirmed by future research. Other descriptive results, for example, the most relevant sources and most relevant keywords have also revealed some of the main research interests regarding Twitter-related scientific literature.
In the science mapping section, we first presented a country collaboration network, in which a set of country collaboration patterns have been identified, Asian-Pacific countries are closely linked to North American countries, while European countries refer to collaborate within themselves, the 40 most important countries in Twitter research are presented as nodes on the network. The detailed information of the top 10 most productive countries has been further presented. Among them, European countries and English speaking countries have a relatively high international collaboration degree.
For the thematic analysis, we have successfully identified the most important research topics, they are mainly related to business (including marketing, advertising etc.), communication (including political communication, new media studies etc.), disaster management, scientometrics and computer science (including sentiment analysis, machine learning etc.). Although the research lines seem to become more homogenous over time, new research topics in Twitter-related studies emerged in recent years: while studies in the subject of business took an important place in the first years, individual research focuses like marketing, advertising and crowd-sourcing disappeared from the thematic map in later periods, they have been involved into larger interdisciplinary clusters.
Twitter research is highly associated with a real world timeline; the 2010 Arab spring revolution has been shown to be an emerging topic in the thematic map. While in the developing period (2013–2016), disaster management and crisis communication appeared to be an important research focus, as discussed, they have a strong tie with the natural disaster and epidemic crisis in those years. At last, computational methods (e.g., machine learning, sentiment analysis, etc.) were developed rapidly in later years; the above-mentioned research topics have shown a strong association with these new techniques. As Williams et al. [23] once indicated, Twitter-related studies are becoming quantitative research and we agree with their argument; however, quantitative research is a broad concept—it involves both traditional and new methods, and we would like to say Twitter-related studies are becoming computational research.

Author Contributions

Conceptualization, J.Y. and J.M.-J.; methodology, J.Y. and J.M.-J.; validation, J.Y. and J.M.-J.; formal analysis, J.Y.; investigation, J.Y; data curation, J.M.-J.; writing—original draft preparation, J.Y.; writing—review and editing, J.Y. and J.M.-J.; visualization, J.Y; supervision, J.M.-J. All authors have read and agreed to the published version of the manuscript.

Funding

The APC was funded by the Department of Social Psychology, Universitat Autònoma de Barcelona.

Acknowledgments

This work belongs to the framework of the doctoral programme in Person and Society in the Contemporary World of the Autonomous University of Barcelona.

Conflicts of Interest

The authors declare no conflicts of interest.

References

  1. Twitter. Twitter Annual Report 2018; Twitter: San Francisco, CA, USA, 2018. [Google Scholar]
  2. Fiegerman, S. Twitter Now Losing Users in the U.S. Available online: https://money.cnn.com/2017/07/27/technology/business/twitter-earnings/index.html?iid (accessed on 27 July 2018).
  3. Haque, U. The Reason Twitter’s Losing Active Users. Available online: https://hbr.org/2016/02/the-reason-twitters-losing-active-users (accessed on 27 July 2018).
  4. Statista Twitter: Number of Active Users 2010–2018|Statista. Available online: https://www.statista.com/statistics/282087/number-of-monthly-active-twitter-users/ (accessed on 27 July 2018).
  5. Ahmed, W.; Bath, P.A.; Demartini, G. Chapter 4: Using Twitter as a Data Source: An Overview of Ethical, Legal, and Methodological Challenges; Emerald Publishing Limited: Bingley, UK, 2017; pp. 79–107. [Google Scholar]
  6. Kwak, H.; Lee, C.; Park, H.; Moon, S. What is Twitter, a social network or a news media? In Proceedings of the 19th International Conference on World Wide Web—WWW ’10, Raleigh, CA, USA, 26–30 April 2010; ACM Press: New York, NY, USA, 2010; p. 591. [Google Scholar]
  7. Gupta, B.M.; Kumar, A.; Gupta, R.; Dhawan, S.M. A bibliometric assessment of Global Literature on “Twitter” during 2008–15. Int. J. Inf. Dissem. Technol. 2016, 6, 199–206. [Google Scholar]
  8. Yu, J.; Muñoz-Justicia, J. Free and Low-Cost Twitter Research Software Tools for Social Science. Soc. Sci. Comput. Rev. 2020. [Google Scholar] [CrossRef]
  9. Williams, S.A.; Terras, M.; Warwick, C. What do people study when they study Twitter? Classifying Twitter related academic papers. J. Doc. 2013, 69, 384–410. [Google Scholar] [CrossRef] [Green Version]
  10. Kang, B.; Lee, J.Y. A Bibliometric Analysis on Twitter Research. J. Korean Soc. Inf. Manag. 2014, 31, 293–311. [Google Scholar] [CrossRef] [Green Version]
  11. Peña-López, I.; Congosto, M.; Aragón, P. SpanishIndignadosand the evolution of the 15M movement on Twitter: Towards networked para-institutions. J. Span. Cult. Stud. 2014, 15, 189–216. [Google Scholar] [CrossRef]
  12. Isa, D.; Himelboim, I. A Social Networks Approach to Online Social Movement: Social Mediators and Mediated Content in #FreeAJStaff Twitter Network. Soc. Media Soc. 2018, 4, 4. [Google Scholar] [CrossRef] [Green Version]
  13. Jacobson, J.; Mascaro, C. Movember: Twitter Conversations of a Hairy Social Movement. Soc. Media Soc. 2016, 2. [Google Scholar] [CrossRef]
  14. Aragón, P.; Kappler, K.E.; Kaltenbrunner, A.; Laniado, D.; Volkovich, Y. Communication dynamics in twitter during political campaigns: The case of the 2011 Spanish national election. Policy Internet 2013, 5, 183–206. [Google Scholar] [CrossRef]
  15. Ceron, A.; D’Adda, G. E-campaigning on Twitter: The effectiveness of distributive promises and negative campaign in the 2013 Italian election. New Media Soc. 2016, 18, 1935–1955. [Google Scholar] [CrossRef]
  16. Jaharudin, M.H. The 13th General Elections: Changes in Malaysian Political Culture and Barsian Nasional’s Crisis of Moral Legitimacy. Kaji Malays. 2014, 32, 149–169. [Google Scholar]
  17. Hernandez-Suarez, A.; Sanchez-Perez, G.; Toscano-Medina, L.K.; Perez-Meana, H.M.; Portillo-Portillo, J.; Villalba, L.J.G.; Villalba, L.J.G. Using Twitter Data to Monitor Natural Disaster Social Dynamics: A Recurrent Neural Network Approach with Word Embeddings and Kernel Density Estimation. Sensors 2019, 19, 1746. [Google Scholar] [CrossRef] [PubMed] [Green Version]
  18. Gutierrez, C.; Figuerias, P.; Oliveira, P.; Costa, R.; Jardim-Goncalves, R. Twitter mining for traffic events detection. In Proceedings of the 2015 Science and Information Conference, SAI, London, UK, 28–30 July 2015; Institute of Electrical and Electronics Engineers Inc.: Piscataway, NJ, USA, 2015; pp. 371–378. [Google Scholar]
  19. Wang, L.; Gan, J.Q. Prediction of the 2017 French Election Based on Twitter Data Analysis. In Proceedings of the 2017 9th Computer Science and Electronic Engineering (CEEC), Colchester, UK, 27–29 September 2017. [Google Scholar]
  20. Bollen, J.; Mao, H.; Zeng, X.-J. Twitter mood predicts the stock market. J. Comput. Sci. 2011, 2, 1–8. [Google Scholar] [CrossRef] [Green Version]
  21. Zimmer, M.; Proferes, N. A topology of Twitter research: Disciplines, methods, and ethics. Aslib J. Inf. Manag. 2014, 66, 250–261. [Google Scholar] [CrossRef]
  22. Weller, K. What do we get from Twitter—and What Not? A Close Look at Twitter Research in the Social Sciences. Knowl. Organ. 2014, 41, 238–248. [Google Scholar] [CrossRef]
  23. Williams, S.A.; Terras, M.; Warwick, C.; McGowan, B.; Pedrana, A. How Twitter Is Studied in the Medical Professions: A Classification of Twitter Papers Indexed in PubMed. Med. 2.0 2013, 2, e2. [Google Scholar] [CrossRef] [Green Version]
  24. Van Raan, A.F.J. The use of bibliometric analysis in research performance assessment and monitoring of interdisciplinary scientific developments. Tech. Theor. Prax 2003, 1, 20–29. [Google Scholar] [CrossRef]
  25. Broadus, R.N. Toward a definition of “bibliometrics”. Scientometrics 1987, 12, 373–379. [Google Scholar] [CrossRef]
  26. Aria, M.; Cuccurullo, C. bibliometrix: An R-tool for comprehensive science mapping analysis. J. Inf. 2017, 11, 959–975. [Google Scholar] [CrossRef]
  27. Noyons, E.C.M.; Moed, H.F.; Luwel, M. Combining mapping and citation analysis for evaluative bibliometric purposes: A bibliometric study. J. Am. Soc. Inf. Sci. 1999, 50, 115–131. [Google Scholar] [CrossRef]
  28. van Raan, A.F.J. Measuring Science. In Handbook of Quantitative Science and Technology Research; Springer: Dordrecht, The Netherlands, 2005; pp. 19–50. [Google Scholar]
  29. Van Raan, A.F.J. Measurement of Central Aspects of Scientific Research: Performance, Interdisciplinarity, Structure. Meas. Interdiscip. Res. Perspect. 2005, 3, 1–19. [Google Scholar] [CrossRef]
  30. Gutierrez-Salcedo, M.; Martínez, M.Á.; Moral-Munoz, J.A.; Herrera, F.; Cobo, M.J. Some bibliometric procedures for analyzing and evaluating research fields. Appl. Intell. 2017, 48, 1275–1287. [Google Scholar] [CrossRef]
  31. Börner, K.; Chen, C.; Boyack, K. Visualizing knowledge domains. Annu. Rev. Inf. Sci. Technol. 2005, 37, 179–255. [Google Scholar] [CrossRef]
  32. Callon, M.; Courtial, J.P.; Laville, F. Co-word analysis as a tool for describing the network of interactions between basic and technological research: The case of polymer chemsitry. Scientometrics 1991, 22, 155–205. [Google Scholar] [CrossRef]
  33. Cobo, M.J.; López-Herrera, A.G.; Herrera-Viedma, E.; Herrera, F. An approach for detecting, quantifying, and visualizing the evolution of a research field: A practical application to the Fuzzy Sets Theory field. J. Inf. 2011, 5, 146–166. [Google Scholar] [CrossRef]
  34. Cobo, M.J.; Herrera-Viedma, E.; Herrera, F.; López-Herrera, A. SciMAT: A new science mapping analysis software tool. J. Am. Soc. Inf. Sci. Technol. 2012, 63, 1609–1630. [Google Scholar] [CrossRef]
  35. Leopold, E.; May, M.; Paaß, G. Data Mining and Text Mining for Science & Technology Research. In Handbook of Quantitative Science and Technology Research; Springer: Dordrecht, The Netherlands, 2004; pp. 187–213. [Google Scholar]
  36. Van Eck, N.J.; Waltman, L. How to normalize cooccurrence data? An analysis of some well-known similarity measures. J. Am. Soc. Inf. Sci. Technol. 2009, 60, 1635–1651. [Google Scholar] [CrossRef] [Green Version]
  37. Van Eck, N.J.; Waltman, L. Software survey: VOSviewer, a computer program for bibliometric mapping. Scientometrics 2009, 84, 523–538. [Google Scholar] [CrossRef] [Green Version]
  38. Waltman, L.; Van Eck, N.J.; Noyons, E. A unified approach to mapping and clustering of bibliometric networks. J. Inf. 2010, 4, 629–635. [Google Scholar] [CrossRef] [Green Version]
  39. Wang, M.; Chai, L. Three new bibliometric indicators/approaches derived from keyword analysis. Scientometrics 2018, 116, 721–750. [Google Scholar] [CrossRef]
  40. Waila, P.; Singh, V.K.; Singh, M.K. A Scientometric Analysis of Research in Recommender Systems. J. Sci. Res. 2016, 5, 71–84. [Google Scholar] [CrossRef] [Green Version]
  41. Sweileh, W.; Al-Jabi, S.W.; AbuTaha, A.S.; Zyoud, S.; Anayah, F.M.A.; Sawalha, A.F. Bibliometric analysis of worldwide scientific literature in mobile - health: 2006–2016. BMC Med. Inform. Decis. Mak. 2017, 17, 72. [Google Scholar] [CrossRef] [PubMed] [Green Version]
  42. Thelwall, M. Author gender differences in psychology citation impact 1996–2018. Int. J. Psychol. 2019, 12633. [Google Scholar] [CrossRef] [PubMed]
  43. Clarivate Analytics KeyWords Plus Generation, Creation, and Changes. Available online: https://support.clarivate.com/ScientificandAcademicResearch/s/article/KeyWords-Plus-generation-creation-and-changes?language=en_US (accessed on 12 May 2020).
  44. Zhang, J.; Yu, Q.; Zheng, F.; Long, C.; Lu, Z.; Duan, Z. Comparing keywords plus of WOS and author keywords: A case study of patient adherence research. J. Assoc. Inf. Sci. Technol. 2015, 67, 967–972. [Google Scholar] [CrossRef]
  45. Van Eck, N.J.; Waltman, L. BIBLIOMETRIC MAPPING OF THE COMPUTATIONAL INTELLIGENCE FIELD. Int. J. Uncertain. Fuzziness Knowl. Based Syst. 2007, 15, 625–645. [Google Scholar] [CrossRef]
  46. Newman, M.E.J.; Girvan, M. Finding and evaluating community structure in networks. Phys. Rev. E 2004, 69, 026113. [Google Scholar] [CrossRef] [PubMed] [Green Version]
  47. Liao, H.; Tang, M.; Luo, L.; Li, C.; Chiclana, F.; Zeng, X.-J. A Bibliometric Analysis and Visualization of Medical Big Data Research. Sustainability 2018, 10, 166. [Google Scholar] [CrossRef] [Green Version]
  48. Holmberg, K.; Thelwall, M. Disciplinary differences in Twitter scholarly communication. Scientometrics 2014, 101, 1027–1042. [Google Scholar] [CrossRef]
  49. Thelwall, M.; Haustein, S.; Larivière, V.; Sugimoto, C.R. Do Altmetrics Work? Twitter and Ten Other Social Web Services. PLoS ONE 2013, 8, e64841. [Google Scholar] [CrossRef]
  50. Buccafurri, F.; Lax, G.; Nicolazzo, S.; Nocera, A. Comparing Twitter and Facebook user behavior: Privacy and other aspects. Comput. Hum. Behav. 2015, 52, 87–95. [Google Scholar] [CrossRef]
  51. Lu, X.; Brelsford, C. Network Structure and Community Evolution on Twitter: Human Behavior Change in Response to the 2011 Japanese Earthquake and Tsunami. Sci. Rep. 2014, 4, 6773. [Google Scholar] [CrossRef]
  52. Chatfield, A.; Scholl, H.J.; Brajawidagda, U. Tsunami early warnings via Twitter in government: Net-savvy citizens’ co-production of time-critical public information services. Gov. Inf. Q. 2013, 30, 377–386. [Google Scholar] [CrossRef]
  53. Fung, I.C.-H.; Tse, Z.T.H.; Cheung, C.-N.; Miu, A.S.; Fu, K.-W. Ebola and the social media. Lancet 2014, 384, 2207. [Google Scholar] [CrossRef]
  54. Atzori, L.; Iera, A.; Morabito, G.; Nitti, M. The Social Internet of Things (SIoT)—When social networks meet the Internet of Things: Concept, architecture and network characterization. Comput. Netw. 2012, 56, 3594–3608. [Google Scholar] [CrossRef]
  55. Das, D.; Chidananda, H.T.; Sahoo, L. Personalized movie recommendation system using twitter data. In Progress in Computing, Analytics and Networking. Advances in Intelligent Systems and Computing; Pattnaik, P., Rautaray, S., Das, H., Nayak, J., Eds.; Springer: Singapore, 2018; Volume 710, pp. 339–347. [Google Scholar]
  56. Fausto, S.; Aventurier, P. Scientific Literature on Twitter as a Subject Research: Findings Based on Bibliometric Analysis; Handbook Twitter For Research 2015–2016; EMLYON Press: Lyon, France, 2016; p. 242. [Google Scholar]
Figure 1. Thematic map strategic diagram with 4 quadrants.
Futureinternet 12 00091 g001
Figure 2. Annual Scientific Production, RGR = (ln c2 – ln c1) / (t2 – t1), ln = natural logarithm, cl = cumulative number of publications in period one, c2 = cumulative number of publications in period two. DT = ((t2 – t1)* ln 2) / (ln c2 – ln c1). ACR = citations / documents / years_since_publication. (a) Publications by year, (b) relative growth rate, (c) doubling time, (d) average citation rate.
Futureinternet 12 00091 g002
Figure 3. Subject evolution over time.
Futureinternet 12 00091 g003
Figure 4. Average number of authors per document.
Futureinternet 12 00091 g004
Figure 5. Country collaboration network.
Futureinternet 12 00091 g005
Figure 6. Thematic maps of the three periods. (A) Initial period, (B) developing period and (C) advanced period.
Futureinternet 12 00091 g006
Figure 7. Alluvial diagram of thematic evolution.
Futureinternet 12 00091 g007
Table 1. Summary table of the reviewed scientific literature.
TitleAuthorYearDomain and Research FocusReference Pointer
A bibliometric analysis on Twitter ResearchKang, B.; Lee, J. Y.2014Bibliometric study. Argued that political issues are one of the core subjects in Twitter research.[10]
Spanish Indignados and the evolution of the 15 M movement on Twitter: towards networked para-institutionsPena-Lopez, I.; Congosto, M.; Aragon, P.2014Social dynamics. Using Twitter as a communication tool in regional social movements.[11]
A social networks approach to online social movement: social mediators and mediated content in #FreeAJStaff Twitter networkIsa, D.; Himelboim, I.2018Social dynamics. Twitter as a mediator in news freedom online movements.[12]
Movember: Twitter conversations of a hairy social movementJacobson, J.; Mascaro, C.2016Social dynamics. Twitter as a platform to engage individuals in social campaigns and sociotechnical social movements.[13]
Communication dynamics in Twitter during political campaignsAragon, P.; Kappler, K. E. et al.2013Politics. Political elites use Twitter as a campaign platform in general elections[14]
E-campaigning on Twitter: The effectiveness of distributive promises and negative campaign in the 2013 Italian election.Ceron, A.; d’Adda, G.2016Politics. Using Twitter content to evaluate the impact of different electoral strategies in political elections[15]
The 13th General Elections: Changes in Malaysian Political Culture And Barisan Nasional’s Crisis of Moral LegitimacyJaharudin, M.H.2014Politics. The role and importance that Twitter and other social media played in political elections.[16]
Using Twitter data to monitor natural disaster social dynamics: A recurrent neural network approach with word embeddings and kernel density estimation.Hernandez-Suarez, A.; Sanchez-Perez, G; et al.2019Geographical information system and disaster management. Using Twitter data to monitor natural disasters and to evaluate the post-effect of such catastrophe[17]
Twitter mining for traffic events detection.Gutierrez, C.; Figuerias, P et al.2015Traffic and management. Twitter as a monitor to detect traffic events[18]
Prediction of the 2017 French Election Based on Twitter Data AnalysisWang, L.; Gan, J.Q.2017Politics. Using Twitter content to predict political event[19]
Twitter mood predicts the stock market.Bollen, J.; Mao, H.; Zeng, X.2001Economics. Using Twitter content to predict stock market[20]
Table 2. Most Relevant Sources.
RankSourcesSubjectArticles
1PLOS OneMultidisciplinary Sciences251
2International Conference on Advances in Social Networks Analysis and Mining1Computer Science, Computer Networks and Communications, Information Systems239
3Computers in Human BehaviorPsychology, Experimental; Psychology, Multidisciplinary176
4IEEE International Conference on Big Data2Computer Science,
Software
145
5Journal of Medical Internet ResearchHealth Care Sciences & Services; Medical Informatics142
6Information Communication& SocietyCommunication; Sociology141
7New Media & SocietyCommunication118
8Social Network Analysis and MiningComputer Science; Information Systems118
9International Journal of CommunicationCommunication108
10Social Media + SocietyComputer Science Applications, Communication, Cultural Studies107
1 Different editions (years) have been grouped together; 2 Different editions (years) have been grouped together.
Table 3. Most productive authors and most cited publications.
RankMost Productive AuthorsMost Cited Publications
NameN. ArticlesCorresponding AuthorYearJournalTotal CitationCitation per Year
1Wang Y55Kaplan AM2010Bus Horizons4169417
2Kim J45Boyd D2012Inform Commun Soc1624203
3Kim Y44Bollen J2011J Comput Sci-Neth1414157
4Zhang Y44Kietzmann JH2011Bus Horizons1248139
5Liu H43Marwick AE2011New Media Soc1126125
6Liu Y42Jansen BJ2009J Am Soc Inf Sci Tec82875
7Wang D36Casler K2013Comput Hum Behav57782
8Park HW35O’Keefe GS2011Pediatrics54961
9Lee J34Chew C2010Plos One50450
10Bruns A33Hanna R2011Bus Horizons49255
Table 4. Most relevant keywords.
RankAuthor KeywordsDocumentsKeyword PlusDocuments
1Social media4699Social media1408
2Sentiment analysis1148Media776
3Social networks1015Communication680
4Facebook753Facebook672
5Machine learning508Internet613
6Big data482Impact540
7Social network428Online534
8Social network analysis390News444
9Internet353Networks412
10Text mining327Model 405
Table 5. Top 10 most productive countries.
CountryPublicationsSCPMCPMCP Ratio
USA5340462671413.37%
United Kingdom130099730323.31%
China125182043134.45%
Spain109893416414.94%
India10861001857.83%
Australia70752318426.03%
Canada62044817227.74%
Japan6105476310.33%
Germany51837214628.19%
Italy51038112925.29%

