Article

An Environmentally Aware Scheme of Wireless Sensor Networks for Forest Fire Monitoring and Detection

College of Information Science and Technology, Nanjing Forestry University, Nanjing 210037, China
*
Author to whom correspondence should be addressed.
Future Internet 2018, 10(10), 102; https://doi.org/10.3390/fi10100102
Submission received: 11 September 2018 / Revised: 3 October 2018 / Accepted: 17 October 2018 / Published: 19 October 2018

Abstract

:
Forest fires are a fatal threat to environmental degradation. Wireless sensor networks (WSNs) are regarded as a promising candidate for forest fire monitoring and detection since they enable real-time monitoring and early detection of fire threats in an efficient way. However, compared to conventional surveillance systems, WSNs operate under a set of unique resource constraints, including limitations with respect to transmission range, energy supply and computational capability. Considering that long transmission distance is inevitable in harsh geographical features such as woodland and shrubland, energy-efficient designs of WSNs are crucial for effective forest fire monitoring and detection systems. In this paper, we propose a novel framework that harnesses the benefits of WSNs for forest fire monitoring and detection. The framework employs random deployment, clustered hierarchy network architecture and environmentally aware protocols. The goal is to accurately detect a fire threat as early as possible while maintaining a reasonable energy consumption level. ns-2-based simulation validates that the proposed framework outperforms the conventional schemes in terms of detection delay and energy consumption.

1. Introduction

Forest fires are one of the main disasters that have multi-dimensional negative effects in ecological, economic, and social areas throughout the world. It is reported that there are on average more than 100,000 wildfires every year in the US, which destroy about 9 million acres of forest [1]. Due to the spread features of forest fires (forest fires move at speeds of up to 23 km per hour), the firefighter should be aware of this threat within 6 min once the fire starts. Hence, early detection is significantly important in firefighting, especially for regions which have a high frequency of forest fire such as North Africa, China, and the US. Estimating the spread direction and the speed of fires is also critical in extinguishing fires. To ensure firefighters are aware of the forest fires as early as possible, some important technologies have been developed to monitor and detect forest fires. For instance, there are charge-coupled device (CCD) cameras [2] and infrared (IR) detectors [3], satellite systems and images [4], wireless sensor networks (WSNs) [5] and UAV-based forest fire detection and tracking technology [6]. In CCD cameras and IR detectors-based systems, CCD cameras and IR detectors are installed on the top of towers to sense any abnormal events such as fire and smoke and report to a control center [7]. However, the accuracy of such a system is highly dependent on the effects of terrain, time of day and other environmental conditions. For satellite systems and images, it takes 1–2 days to retrieve a complete earth’s image, which is infeasible for early fire detection. As a promising alternative, WSNs could be deployed for forest fire detection effectively [8]. WSNs are the networks characterized by being self-organizing and infrastructure-less, and consisting of several small, energy-limited, and low-cost sensor nodes. Several wireless sensor nodes can be pre-deployed in a forest to collect different types of data such as temperature, humidity, pressure, and solar radiation, and deliver these raw or processed data wirelessly in an ad hoc fashion to a sink station, where the collected data can be further analyzed and be used to make a decision if fires happen. However, the deployment of WSNs is restricted by some major issues and challenges owing to the nature of this type of network. For example, energy consumption of power-limited WSNs becomes a major concern when targeting a long-term continuous surveillance of the entire forest area.
In this paper, we propose a novel framework for the use of WSNs in forest fire monitoring and detection with the following modules. First, we propose hierarchical network architecture coupled with intra-cluster and inter-cluster protocols to enable early detection with reasonable energy consumption. Second, the operating modes of WSNs are based on the level of fire risk, which is derived from changing climate conditions such as high temperatures, strong winds and a lack of rainfall. Third, we propose a distributed protocol which runs in each sensor node. In this way, the information regarding possible detected fire events can be disseminated to a sink station rapidly.
The remainder of this paper is organized as follows. Section 2 gives a detailed literature survey on the most relevant related works. Section 3 provides a high-level description of the proposed framework that includes deployment scheme, clustered hierarchy network architecture and environment-aware protocols. Performance evaluation using ns-2 and results analysis is presented in Section 4. Finally, Section 5 concludes this paper and provides a discussion on future work.

2. Related Works

In this section, we review several previous research activities related to the issues and enabling technologies for WSNs in forest fires monitoring and detection. Traditionally, forest fires are detected by using conventional techniques such as guard towers [9] and Osborne Fire Finder [10] which is a system comprising a topographic map of the area oriented and centered on a horizontal table with a circular rim graduated in degrees. However, these techniques cannot meet the requirement of early and accurate detection of forest fires due to the unreliability of human observation towers and difficult life conditions [11]. Therefore, some countries use satellite and image processing to detect forest fires, e.g., Moderate Resolution Imaging Spectroradiometer (MODIS) used in Canada [12] and Advanced Very High Resolution Radiometer (AVHRR) used in China [13]. However, the satellite-based monitoring systems are limited by terrain, time of day and other environmental conditions [11]. Recently, quite extensive research has been done on WSNs including protocols, algorithms, and applications [14,15,16,17,18,19]. Although these works may not involve specifically forest fire monitoring and detection, they are adaptive to various applications which include forest fire monitoring and detection. For fire monitoring and detection application of WSNs, several important design goals and features must be considered such as energy efficiency, accurate localization, early detection, forecast capability and adaptivity to harsh environment [9]. There is a considerable amount of research works from literature related to forest fires using WSNs [20,21,22,23,24,25,26]. The authors of [27] implemented a real-world forest fire monitoring and detection system in the San Francisco area. The system is composed of ten sensor nodes which are deployed with ranges up to 1 km. Each sensor node is equipped with a GPS interface and they sense and forward temperature, humidity, and pressure values to a base station. However, due to the long distance between each node in this system, the sensory data is not valuable enough when it arrives at the sink station. Moreover, with the aggravation of fires, some sensor nodes may be destroyed which may cause failure in delivering the data from the sensor node to the sink station. A South Korean forest fire surveillance system was proposed in [20]. In this system, an experimental approach based on a dynamic minimum cost path forwarding protocol was developed. After gathering sensory data, the sink station uses relative humidity, precipitation, and solar radiation to calculate forest fire risk level. However, there is no evaluation on the proposed approach which has been made by authors. Different from this work, our proposed scheme processes the data not only at the sink station, but also at the cluster header. Meanwhile, we apply a low and fair energy consumption strategy by using the proposed intra-cluster and inter-cluster protocols rather than the approach in [20], which did not consider the energy constraints of sensor node. The authors of [21] proposed a general reliability-centric framework in which event reporting in WSNs also can be used in forest fire monitoring and detection. There is also a data aggregation algorithm for filtering important data and delay-aware data transmission for rapidly delivery. Works have been done [9] to detect forest fires early by means of Fire Weather Index (FWI) system which is one of the most comprehensive forest fire danger rating systems in US. In this work, authors used both simulation and test-bed approaches to validate their approach. Reference [22] presented a simulation environment which relies on sensory data and geographical information about the coverage to build a model for a fire. The estimation of the spread of a fire is sent to firefighters to help them fight fires. The authors of [23] surveyed fires detection research from three perspectives: residual fires, forest fires and contributions of WSNs applied in early fire detection. The authors of [24] proposed a novel algorithm for smoke detection and designed a power-efficient smart imager tailored to the proposed algorithm. Reference [25] analyzed the spectral of forest fire noise to the wireless sensor networks. Through the early detection and analysis on the noise power spectrum of forest fires, a proper strategy can be adopted to fight the fire. Reference [26] proposed a technique which is based on static and dynamic analysis of chromatic changes between images and using different sensors to reduce or eliminate the false alarm rate. To enhance the conventional approach of WSNs in monitoring and detection, authors of [28] propose an image-based real-time fire detection technique.
Unfortunately, all the studies described above considered a single aspect of forest fire monitoring and detection. In our proposed framework, we consider both energy efficiency and early detection. Meanwhile, we also consider environmental conditions and features in our framework.

3. Proposed Fires Monitoring and Detection Framework

In this section, we describe the proposed WSN-based fire monitoring and detection system. After reviewing the literature, we summarize that the WSNs should have the following features to be able to successfully monitor and detect forest fires:
  • A WSN deployed in forest environment should consume energy very efficiently and energy consumption also should be balanced fairly among nodes.
  • It should have the capability to detect a forest fire as early as possible and to estimate the fire location accurately.
  • It is important for firefighting to be able to forecast the spread direction and speed of forest fires.
We aim to design a framework that incorporates the aforementioned features. Besides that, there may be some other crucial requirements for WSNs for forest fire monitoring and detection such as self-healing, self-organization and security issues. However, they are out of scope of this work. In this paper, the proposed framework involves three main parts: (i) sensor deployment scheme; (ii) a clustered hierarchy network architecture; and (iii) intra-cluster and inter-cluster protocols.

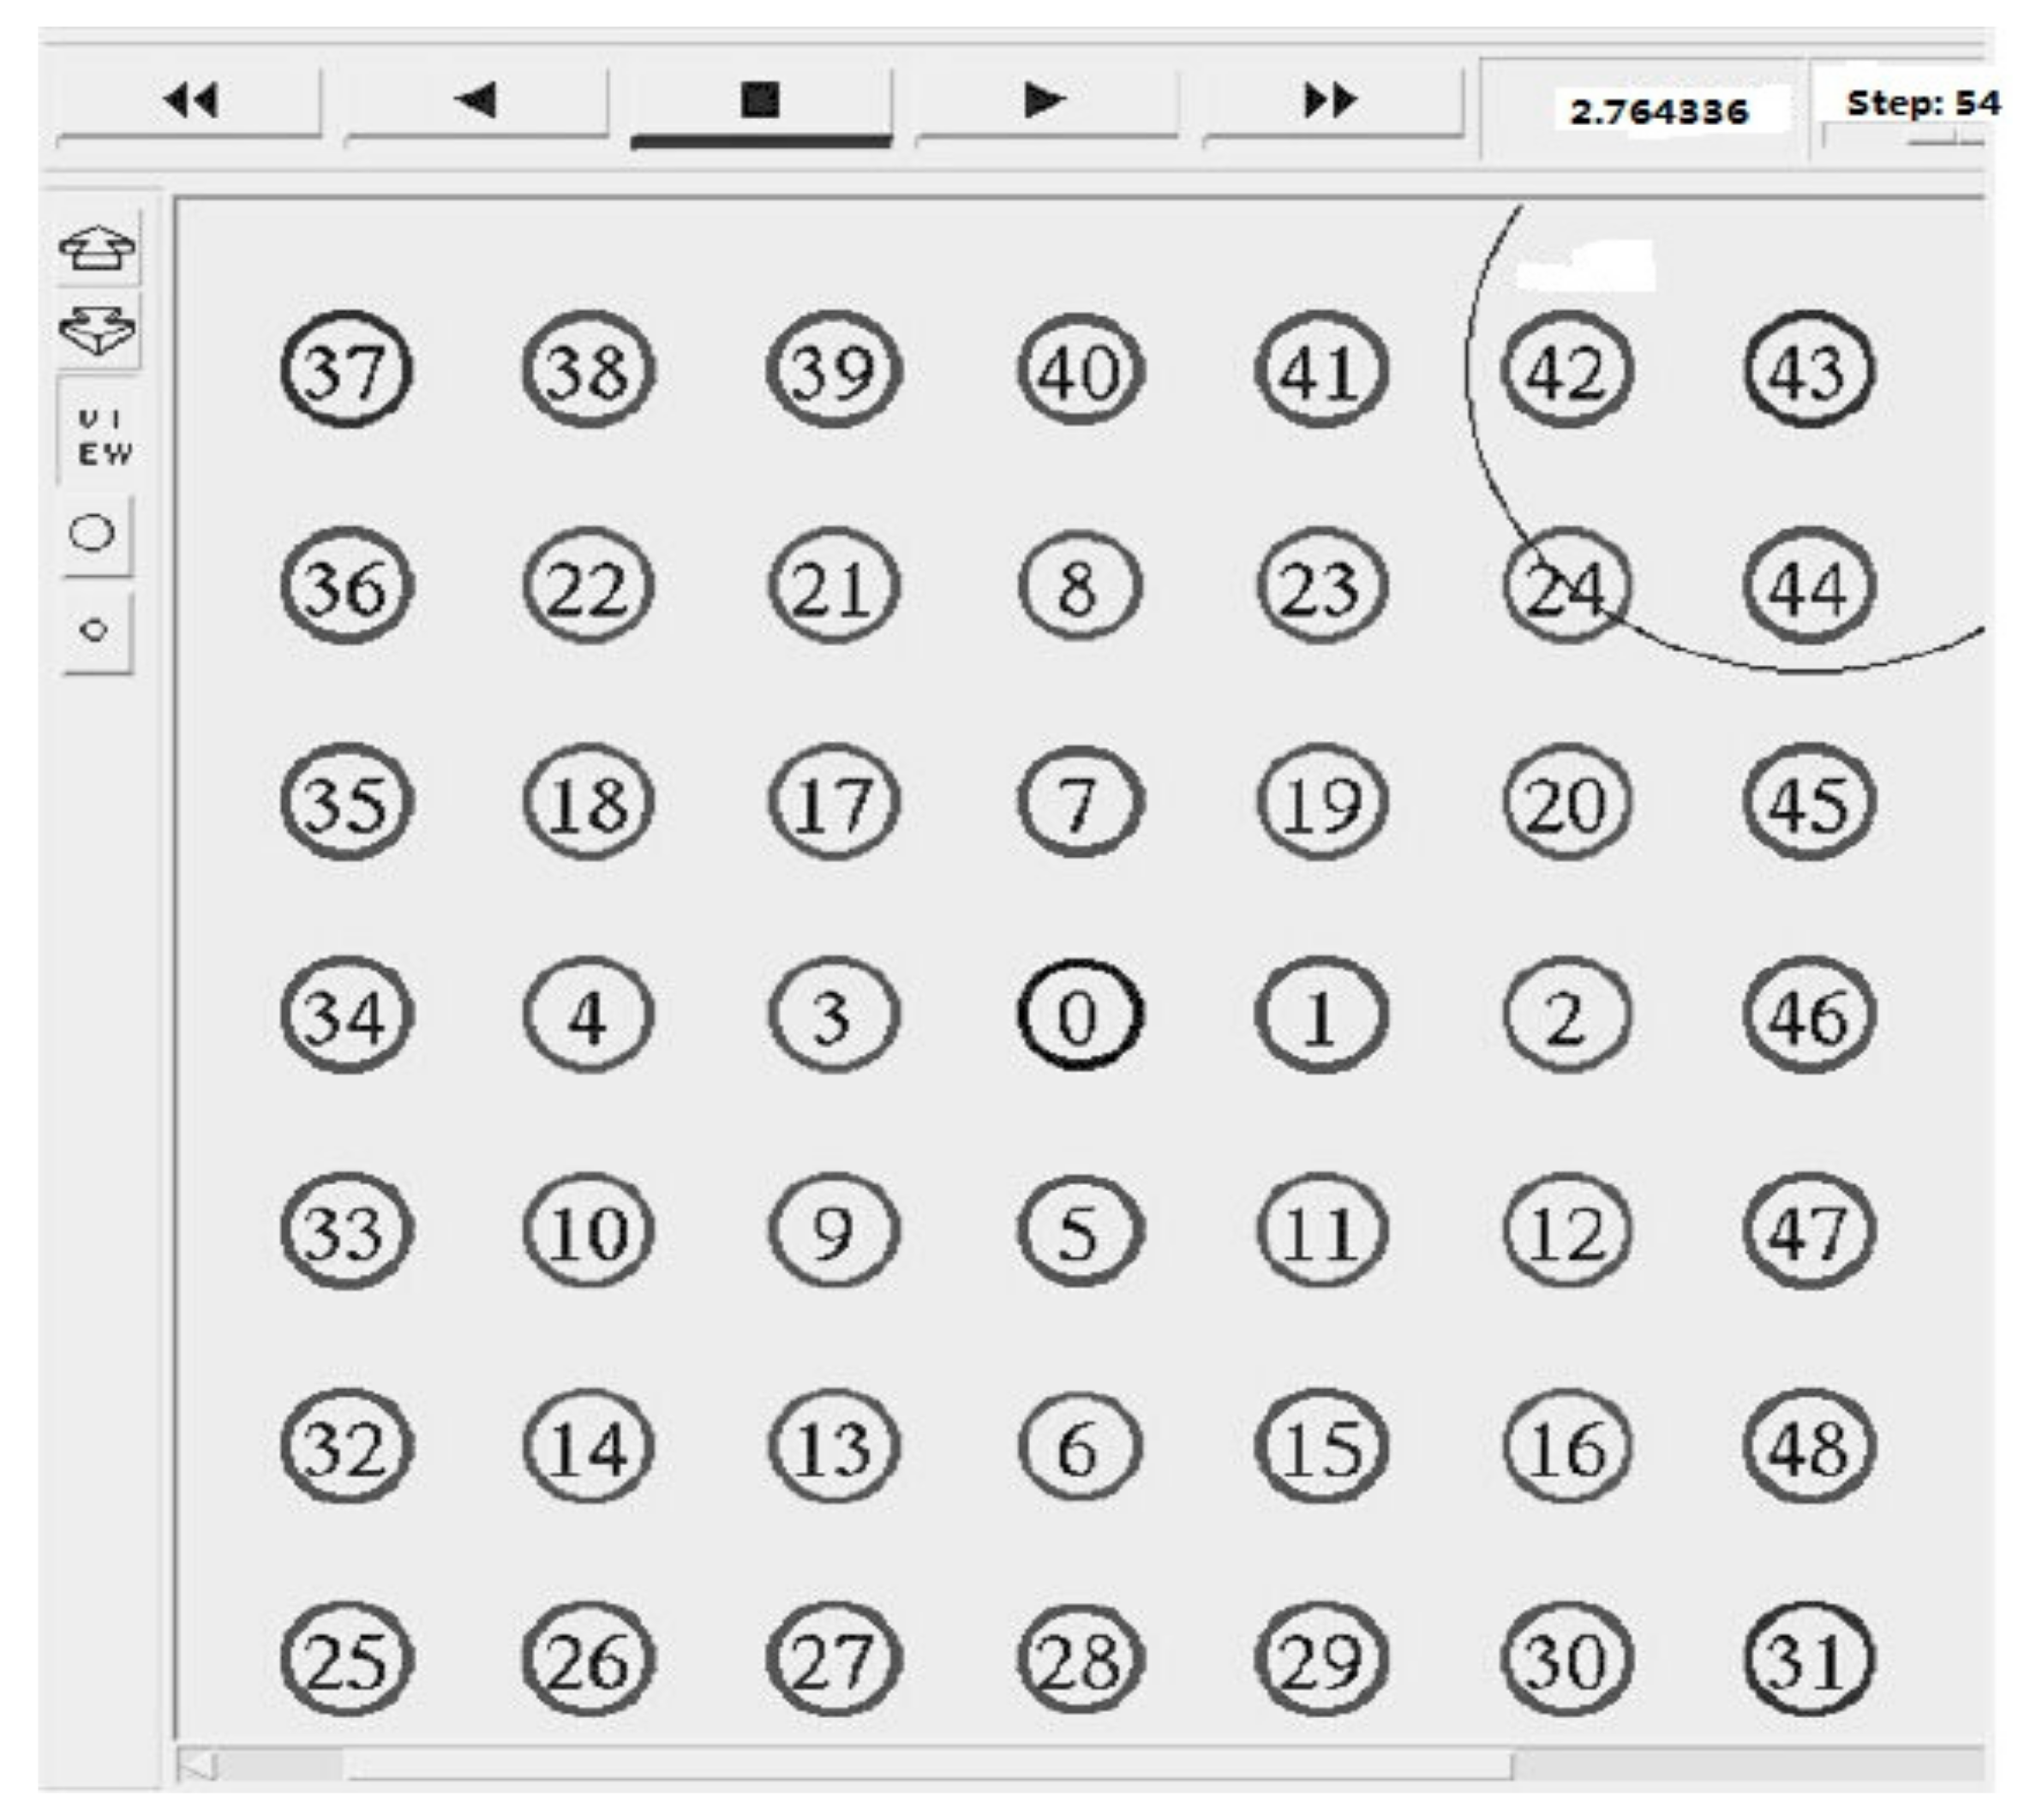
3.1. The Proposed Sensor Deployment Scheme

There are usually requirements that need to be met when deploying a WSN. Two such requirements are (1) the average distance between neighboring sensor nodes, and (2) deployment pattern (random or a regular pattern). For forest fire monitoring and detection applications, a deployment scheme with features of low and balanced energy consumption, early detection and low channel contention should be proposed. Moreover, the scheme should also consider some other features of the forest.
The average distance between neighboring sensor nodes is significant to the performance of a WSN applied in forest fire monitoring and detection. The detection time of temperature at a node increases as the distance between node and fire ignition location increases. Therefore, to reduce the detection time of a forest fire, the average distance between neighboring sensor nodes should be shortened. However, this requires the deployment of more sensor nodes in a certain area and may cause channel collision issues. Hence, this is a tradeoff between reducing the detection time and collision probability. The study of [29] shows that the detection time of a sensor node to forest fire depends also on environmental conditions such as the fuel type of the forest, the slope of the location and wind power. Meanwhile, these environmental factors’ effects on forest fires are investigated by the National Fire Danger Rating System (NFDRS) [30]. NFDRS calculates a fire spread component value for a forest and this value indicates the forward spreading rate of a fire. In our proposed system, we propose a new parameter called fire occur degree (FOD), the value of which in a forest represents the probability of a fire taking place at a particular location. Furthermore, we consider some other parameters that may affect the decision of the average distance between neighboring sensor nodes such as the required maximum detection time (DT), the initial energy resource (E) and the required network lifetime (LT). Therefore, we propose the following formula to obtain the average distance (D) between neighboring sensor nodes:
D = ε · E · DT LT · FOD 2
where, ε is a normalization factor.
In this formula, we propose the initial energy resource and required maximum DT are proportional to average distance, whereas the required network lifetime and the square of the FOD are inversely proportional to average distance. It is worth noting that we propose squaring the FOD value to have more effect on the result as compared to the other factors. The calculation of FOD in this work is based on the method proposed in [31]. Algorithm 1 gives the pseudo-code of the algorithm used to calculate the value of FOD.
Algorithm 1. The pseudo-code of the algorithm to calculate FOD.
1
FOD calculation
2
Begin
3
Write (‘give the value of temperature, humidity, rain, wind, season and solar radiation’);
4
Read (temperature, ‘T’);
5
Read (humidity, ‘H’);
6
Read (rain, ‘R’);
7
Read (wind, ‘W’);
8
Read (season, ‘S’);
9
Read (solar radiation, ‘SR’);
10
FOD (T, H, R, W, S, SR) // calculate the fire occur degree
11
if (FOD ≥ 0 and FOD < 10) then
12
Write (‘the danger level is low’);
13
if (FOD ≥ 10 and FOD < 20) then
14
Write (‘the danger level is medium’);
15
if (FOD ≥ 20 and FOD < 30) then
16
Write (‘the danger level is high’);
17
if (FOD ≥ 30 and FOD < 50) then
18
Write (‘the danger level is extreme’);
19
end if
20
end if
21
end if
22
end if
23
end
Another important factor that affects the performance of WSN-based forest fire monitoring and detection is the deployment pattern of sensor nodes. Two general deployment schemes can be considered: (1) random deployment, and (2) regular deployment. In regular deployment, nodes are deployed based on a regular pattern and the distances between neighboring nodes are nearly equal. Therefore, this has the benefit of balanced energy consumption among sensor nodes in the overall networks. In the case of random deployment, nodes are deployed randomly, hence the distance between each neighboring node is a random value. In such a case, since the nodes are not uniformly distributed, some sensor nodes which must transmit longer distances may consume much more energy and therefore will run out of energy earlier. Even through regular deployment is more preferential compared to random deployment as it can guarantee the overall network performance, in this paper, we adopt random deployment. This is because in the forest environment, it is highly possible that we cannot deploy all sensor nodes with a regular pattern. Some nodes have to be placed at distant locations from other sensor nodes due to geographic constraints. For example, there is a lake inside the forest. Therefore, in this case, a forest environmentally oriented communication protocol should be proposed. Before we discuss our proposed forest environmentally oriented communication protocol, we will describe our proposed clustered hierarchy network architecture.

3.2. The Proposed Clustered Hierarchy Network Architecture

In this subsection, we describe the network architecture and topology adopted in the proposed framework with goals of efficient and effective forest fire monitoring and detection and the limitations of WSNs. In the proposed framework, a hierarchical clustered topology is used. Therefore, some nodes are designated as cluster heads, while others are designated as common nodes. The reason for choosing hierarchical clustered network architecture and topology is that from several simulations, it is observed that the hierarchical clustered network architecture and topology brings benefits in terms of achieving effective control of nodes depending on changing conditions, fast DT to the fire threat and energy and bandwidth efficiency. These are especially useful for fast forest fire monitoring and detection. Moreover, we also propose an enhanced version of the LEACH protocol called E-LEACH in the proposed hierarchical clustered network architecture. In the proposed E-LEACH, each node maintains its own features table. Table 1 shows the contents of each node.
This table includes six parts: node ID, Alive, Sleep, Head, Active and Cluster. Node ID represents the unique number of the node; the node is randomly assigned in the network initialization. Alive indicates whether the node is a viable node, with a value of 0 (death) or 1 (survival). Sleep indicates whether the node is in the sleep mode, with a value of 0 (sleep) or 1 (active). Head indicates whether the node is a cluster head, with a value of 0 (no) or 1 (yes); the default value of the property is 0. The active represents whether the node participates the cluster head selection procedure. Three cases may cause active value to become 0: (1) the node is not elected as cluster head in current round; (2) the node did not receive the cluster head broadcast message; (3) the node received at least two cluster head broadcast messages and becomes a free node. Otherwise, if the value of active is 1, it means the node is elected as cluster head, or only received one cluster head broadcast message within the reference range. The default value of the property is 0. Cluster indicates that whether the node is in a cluster, with a value of 0 (not in the cluster) or 1 (already in the cluster), the default value of the property is 0.
To avoid the situation of the node being unevenly distributed in random deployment, the proposed E-LEACH protocol selects the cluster head by comprehensively considering the residual energy of cluster head and the relative position among cluster heads. For the WSNs with the number of node N, we assume that the percentage of cluster head is P. After the initialization of the network, BS uses Formula (2) to assign reference distance Rre for each node by broadcasting. Those nodes whose active value is 0 will generate a random number between 0 and 1. If the generated number is less than the threshold in Formula (2) will be selected as cluster head. The first node that is selected as the cluster head becomes the first cluster head, and this node broadcasts a message to the surrounding nodes and set its head value to 1. Sink station records the number of cluster head and after those nodes which are located within the radius of Rre received the message sent by cluster head, they will set own active value to 1. That is, these nodes will not be involved in the cluster head selection. According to this process, we can generate other cluster heads in turn, and the number of cluster heads is controlled by sink station. After the number of cluster head reaches N × P, it ends the cluster head selection.
R r e = S N × P × π
where, S is the area of WSN, N is the number of sensor node in the network, and P is the percentage of cluster head.
In the process of cluster head selection, we follow the rule that no other cluster heads exist within the reference radius of a cluster head, which may cause a case where within the reference radius of some common nodes, there is no selected cluster head, or having multiple cluster heads in a certain reference radius. For those common nodes with the active value 1, they choose the closest cluster head within its reference radius to attach; the shortest distance is represented by d . For the common nodes with active value 0, at this stage, the clustering threshold T c l u should be calculated based on Formula (3) and we choose the cluster head with the maximum T c l u to attach. That is, to choose the cluster head which has the higher residual energy and shorter distance to join.
T c l u =   {   d   ;   A c t i v e = 1 d m a x d + E c u r E i n i t   ;   A c t i v e = 0
where, d is the distance between current node and cluster head, d m a x is the maximum distance between any node of the network, E i n i t is the initial energy of the node, and E c u r is the residual energy of the node.

3.3. The Proposed Intra-Cluster and Inter-Cluster Protocols

In clustered network architecture, it is necessary to specifically design the intra-cluster and inter-cluster communication protocols, especially for our forest-oriented application. In a forest environment, WSN protocols should be designed with cognition capability for environmental conditions such as current season, daily temperature and the level of fire threat at the moment. In the case that there is no fire, or the risk of fire is low, the network should decrease the packet overhead throughout the network and data should be delivered to the sink station along with the path that has less energy consumed. Inversely, in the case that fire spreads time or the probability of a fire happening is high, an energy-efficient scheme will be a less critical target, but the reaction delay to the fire and delivering data to the sink station rapidly is more critical. Therefore, in this subsection, we are going to describe our proposed forest-oriented WSN protocol which can react to the changes of environment and weather conditions.
As mentioned earlier in Section 3.2, our proposed network architecture is hierarchical and clustered. Therefore, the proposed protocols in this subsection are targeted at hierarchical clustered WSNs. The proposed clustering protocols are different from the clustering works in the literature. This is because our proposed clustering protocols are designed exclusively for forest fire monitoring and detection systems. Our works are more concentrating on how a hierarchical clustered topology should be employed, operated and used to react to fires as early as possible while maintaining acceptable energy consumption. The proposed clustering protocols can be divided into two parts: (1) intra-cluster protocol, and (2) inter-cluster protocol.
The intra-cluster protocol provides the communication within a cluster between common nodes and cluster head. It consists of four phases: (1) initialization phase, (2) non-fire phase, (3) fire threat phase, and (4) damage phase. In each phase, we implemented a set of exchangeable messages and signaling between cluster head and its common nodes in our framework.
We assume that sensor nodes are in the initialization phase after powering on. In this phase, common nodes set up the connections with the cluster head. The selection and formation of clusters are described in Section 3.2. After the completion of clustering, each common node sends its Node ID and time slot information to the cluster head. The time slot of each common node is a dynamic parameter that is controlled by a cluster head depending on the current FOD. The current FOD value indicates the risk degree of fire at the moment and the location. A higher FOD will cause common node sensing and sending data to cluster more frequently. Additionally, a cluster head sends the FOD to each common node. By using this information, common nodes can determine if it should go to the non-fire phase or fire threat phase.
The non-fire phase indicates that the FOD is low. At this time, the network self-adapts to decrease its activity level by putting common nodes into sleep mode for a while, so that it can improve energy efficiency without compromising the fire reaction time. In sleep mode, the frequency of sensing and sending data to the cluster head is set to be very low.
However, when the FOD value exceeds the configured threshold, the network will go to the fire threat phase. In this phase, common nodes immediately and aggressively send warning messages to its cluster head. After the cluster head hears the warming message from one of its common nodes, it assigns more time slots to the node that has sent warming message. Additionally, besides temperature, more information such as humidity, solar radiation and wind power is sent by the cluster head to the sink station for further analysis.
The damage phase indicates that there are some sensor nodes already destroyed by fires. When a common node is destroyed by the fire, it can be detected by the cluster head and appropriate action can be taken. However, if the death of the cluster head happens, the network topology will handle this situation. There are two cases that should be considered: (1) a cluster head enables the pre-sensing of the fire threat and takes actions to avoid becoming a non-functional cluster head; (2) a cluster head suddenly becomes non-functional due to the fire.
In the first case, while the cluster head discerns the potential threat from fires, it will select the most suitable candidate cluster head based on Suitable Index (SI) which can be calculated by using below Formula (4):
SI i = T m a x T c Δ T c h a n g e × e r
where, SI i is the suitable level of candidate node i to become a cluster head. T m a x is the maximum temperature that a node can withstand. T c is the current temperature of the node. Δ T c h a n g e is the changes in the temperature of the node in the last period. e r is the remaining energy of the node.
In the second phase, to cope with the cluster head suddenly dying, at the beginning of the fire threat phase, the cluster head will send the information about the cluster to its common nodes so that this information will be replicated by common node. When the cluster head suddenly dies, the node first detects the death of the cluster head and will inform all the other members in the cluster and exchange some parameters among to decide on the next cluster head based on Formula (4). After that, the new cluster head informs the other nodes of the result of the selection.
In the aspect of the proposed inter-cluster protocol, the inter-cluster protocol provides the communication among cluster heads and delivers the data gathered by the cluster head to the sink station via multi-hop forwarding. According to the requirement of forest fire monitoring and detection, the proposed inter-cluster protocol has two main goals: balancing the energy consumption among the cluster heads and forwarding the fire information to the sink station as soon as possible. The proposed inter-cluster protocol consists of three phases: (1) initialization phase, (2) non-fire phase, and (3) fire threat phase.
In the initialization phase, cluster heads first determine the paths to the sink station. After that, a message forwarding time is recorded in a schedule table by using these paths. The table provides the time when each cluster head sends its data to the upstream cluster head. It is possible that in a given time, multiple cluster heads transmit their data to their upstream cluster head. In this way, we have concurrency in the network to carry data towards the sink station, which can reduce the overall collection time. After the initialization phase completes, the network enters a non-fire phase.
In the non-fire phase, the cluster head receives data from its common node and the other cluster head and forwards the data to the upstream cluster head on the way to the sink station. However, when a cluster head receives a warming message from one of its common nodes, it will go to the fire threat phase.
In the fire threat phase, the cluster head tries to deliver this warming message to the sink station as soon as possible. If the cluster head is the node that first detects the fires occurring, it will inform all the cluster heads about the fire threat by network-wide broadcasting.

4. Simulation Setting and Results Analysis

4.1. Simulation Model

In this study, a simulation of a wireless sensor network for forest fire monitoring and detection was carried out using modified ns-2 (version 2.31). For performance evaluation, we measured the energy consumption and fire reaction delay affected by our proposed framework from three perspectives: the proposed sensor deployment scheme, the proposed clustered hierarchy network architecture, and the proposed intra-cluster and inter-cluster protocols. Additionally, there are two main modifications that have been made in ns-2.31: fire-sim-lib and ctrl-center are added to ns-2.31. The function of fire-sim-lib is to use and process the output of a fire simulation library called FireLib [32] in our simulation. FireLib is an open source and it is used to estimate and model the spread behavior of forest fires. Our added fire-sim-lib processes the output data of FireLib to certain information which only contains ignition time and location. Additionally, fire-sim-lib is used to calculate the temperature information by using another two parameters: initial temperature of fires and temperature increment with a fixed time interval. In this way, the temperature value of each area in our scenario is dependent on time. Ctrl-center is used to manage the sensor nodes and exchangeable messages. Its basic role is to distribute some necessary messages or values between each component. Table 2 gives the network parameters that were used to configure the wireless sensor node and network topology in ns-2. In all simulations, a many-to-one traffic pattern was used, and the simulation topology consists of 121 sensor nodes which are randomly distributed and follow Gaussian distribution, and the value of standard variation is set to 1. The network and topology parameters are summarized in Figure 1.

4.2. Results and Discussion

The parameters used in performance evaluation are the energy consumption and fire reaction delay. Because our framework consists of three proposed schemes, we first evaluate each scheme separately and then we give the evaluation on the overall framework.

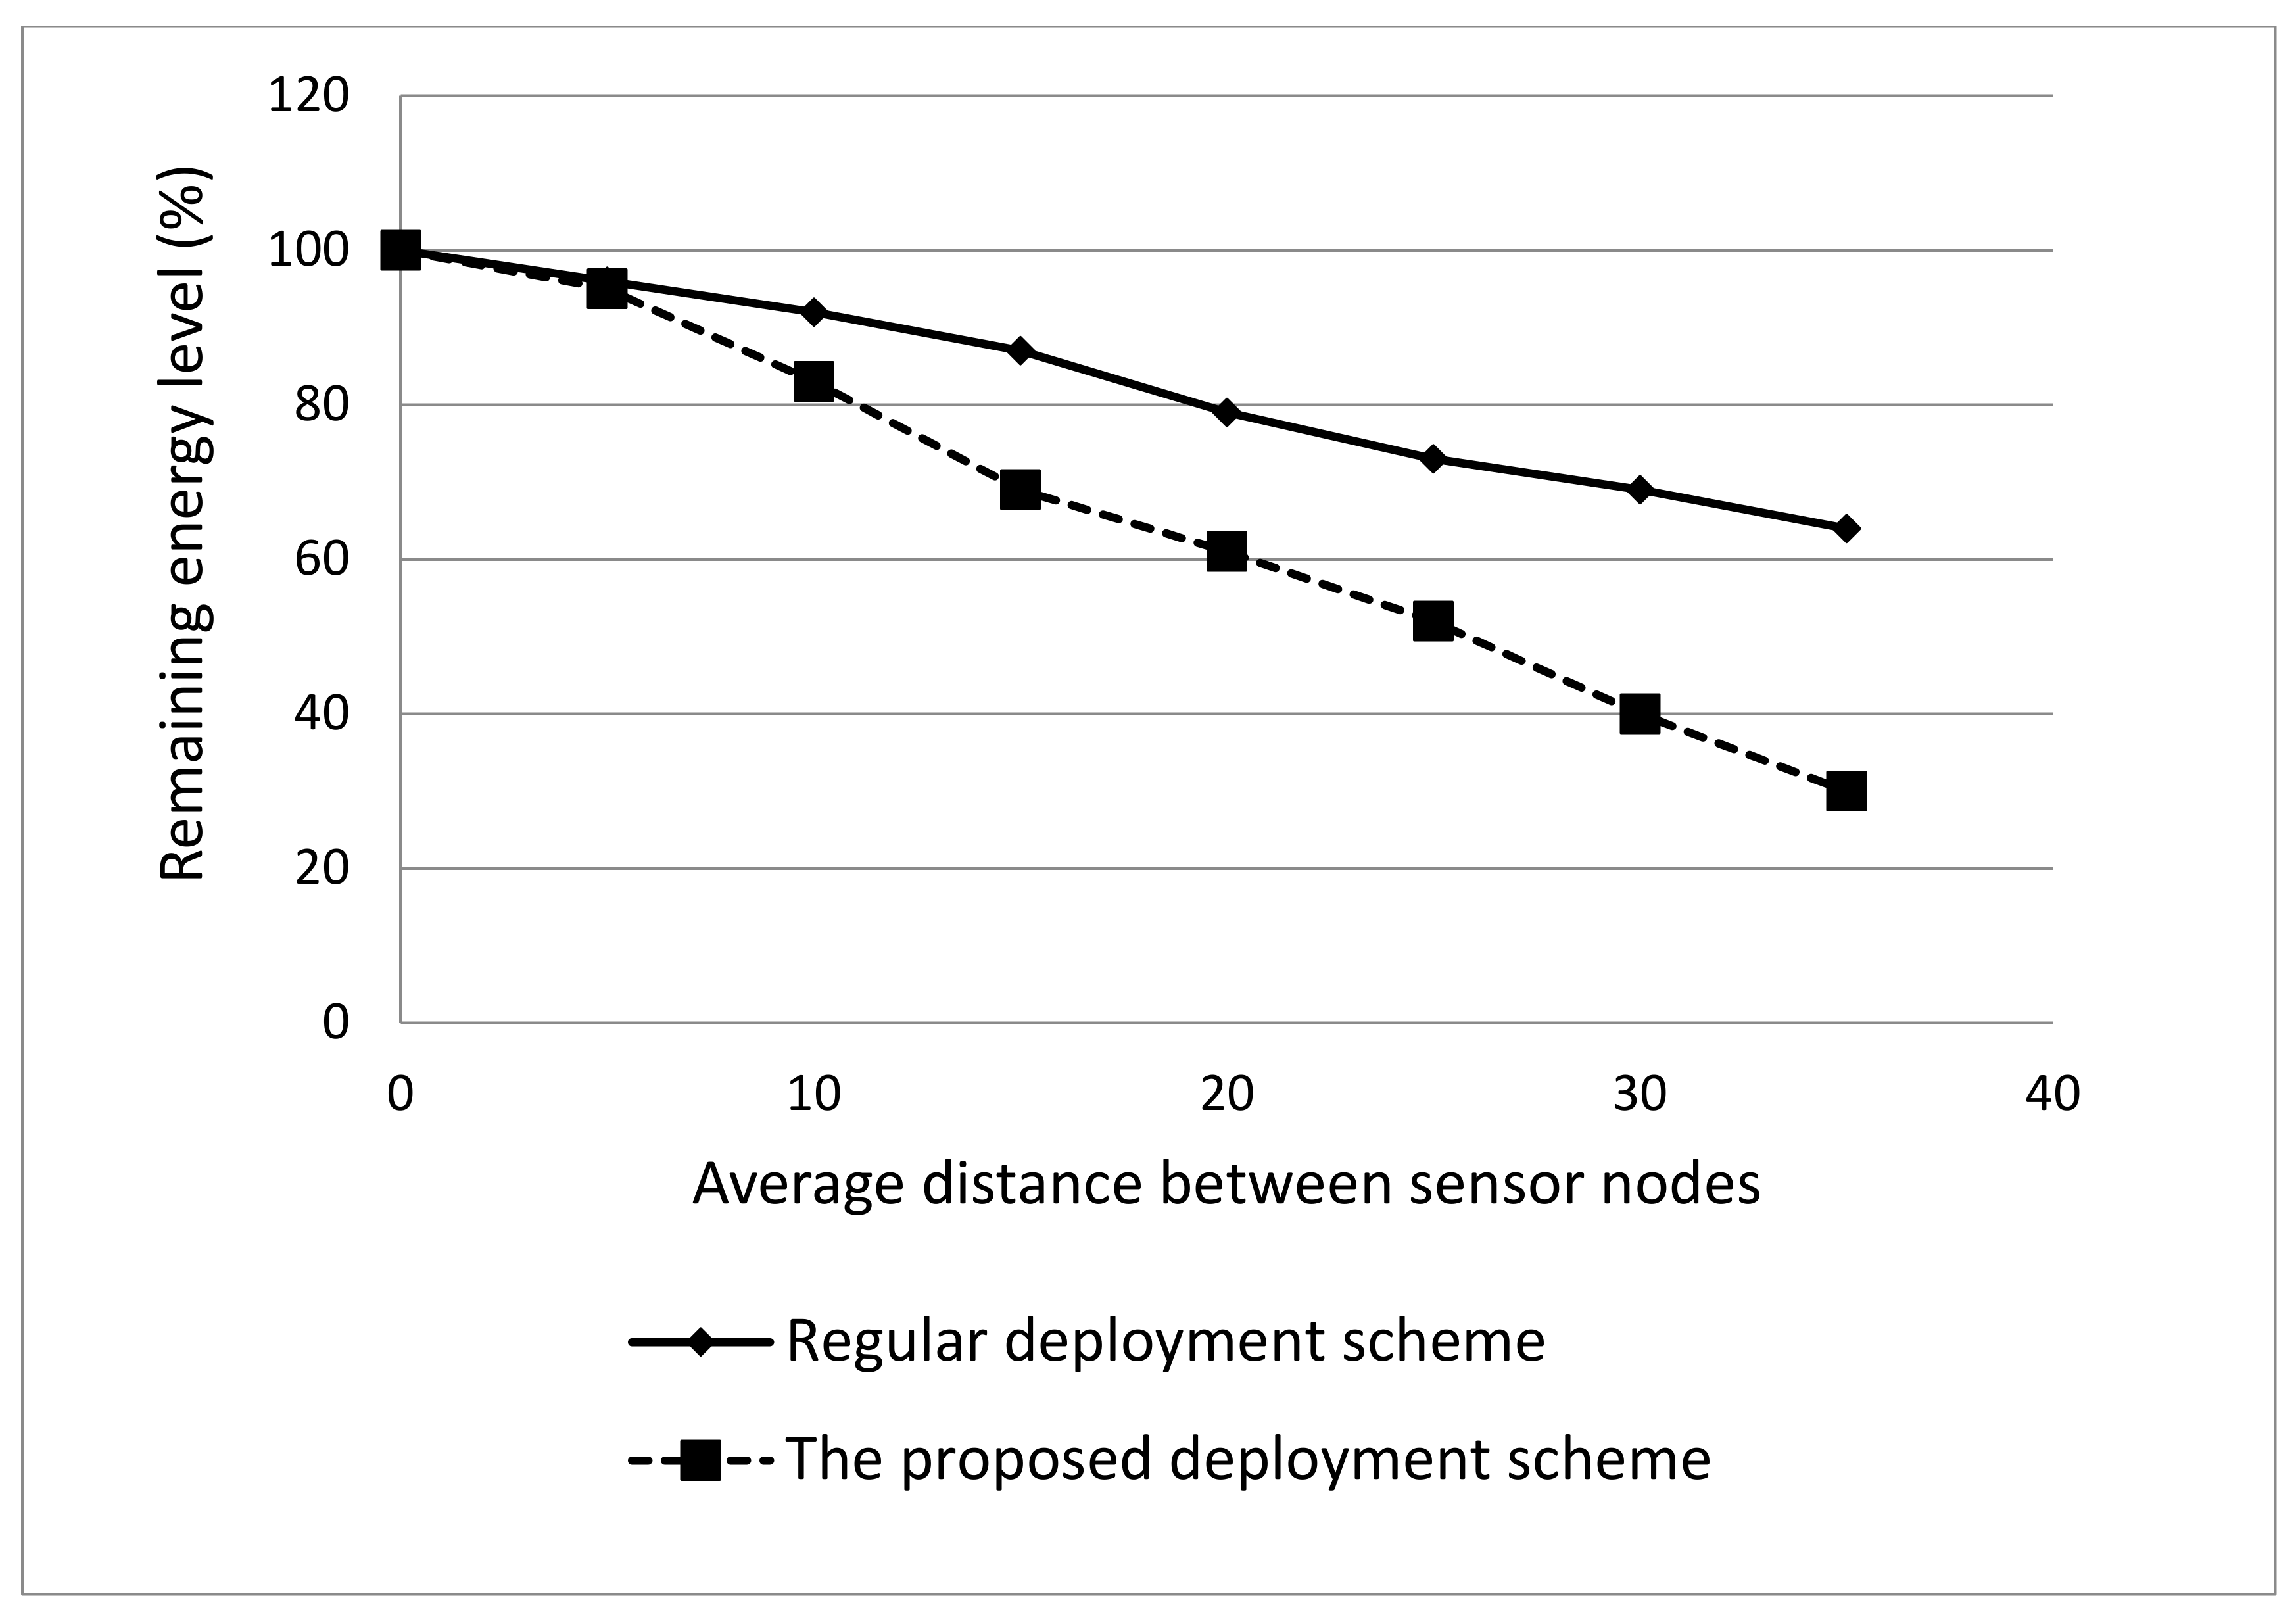
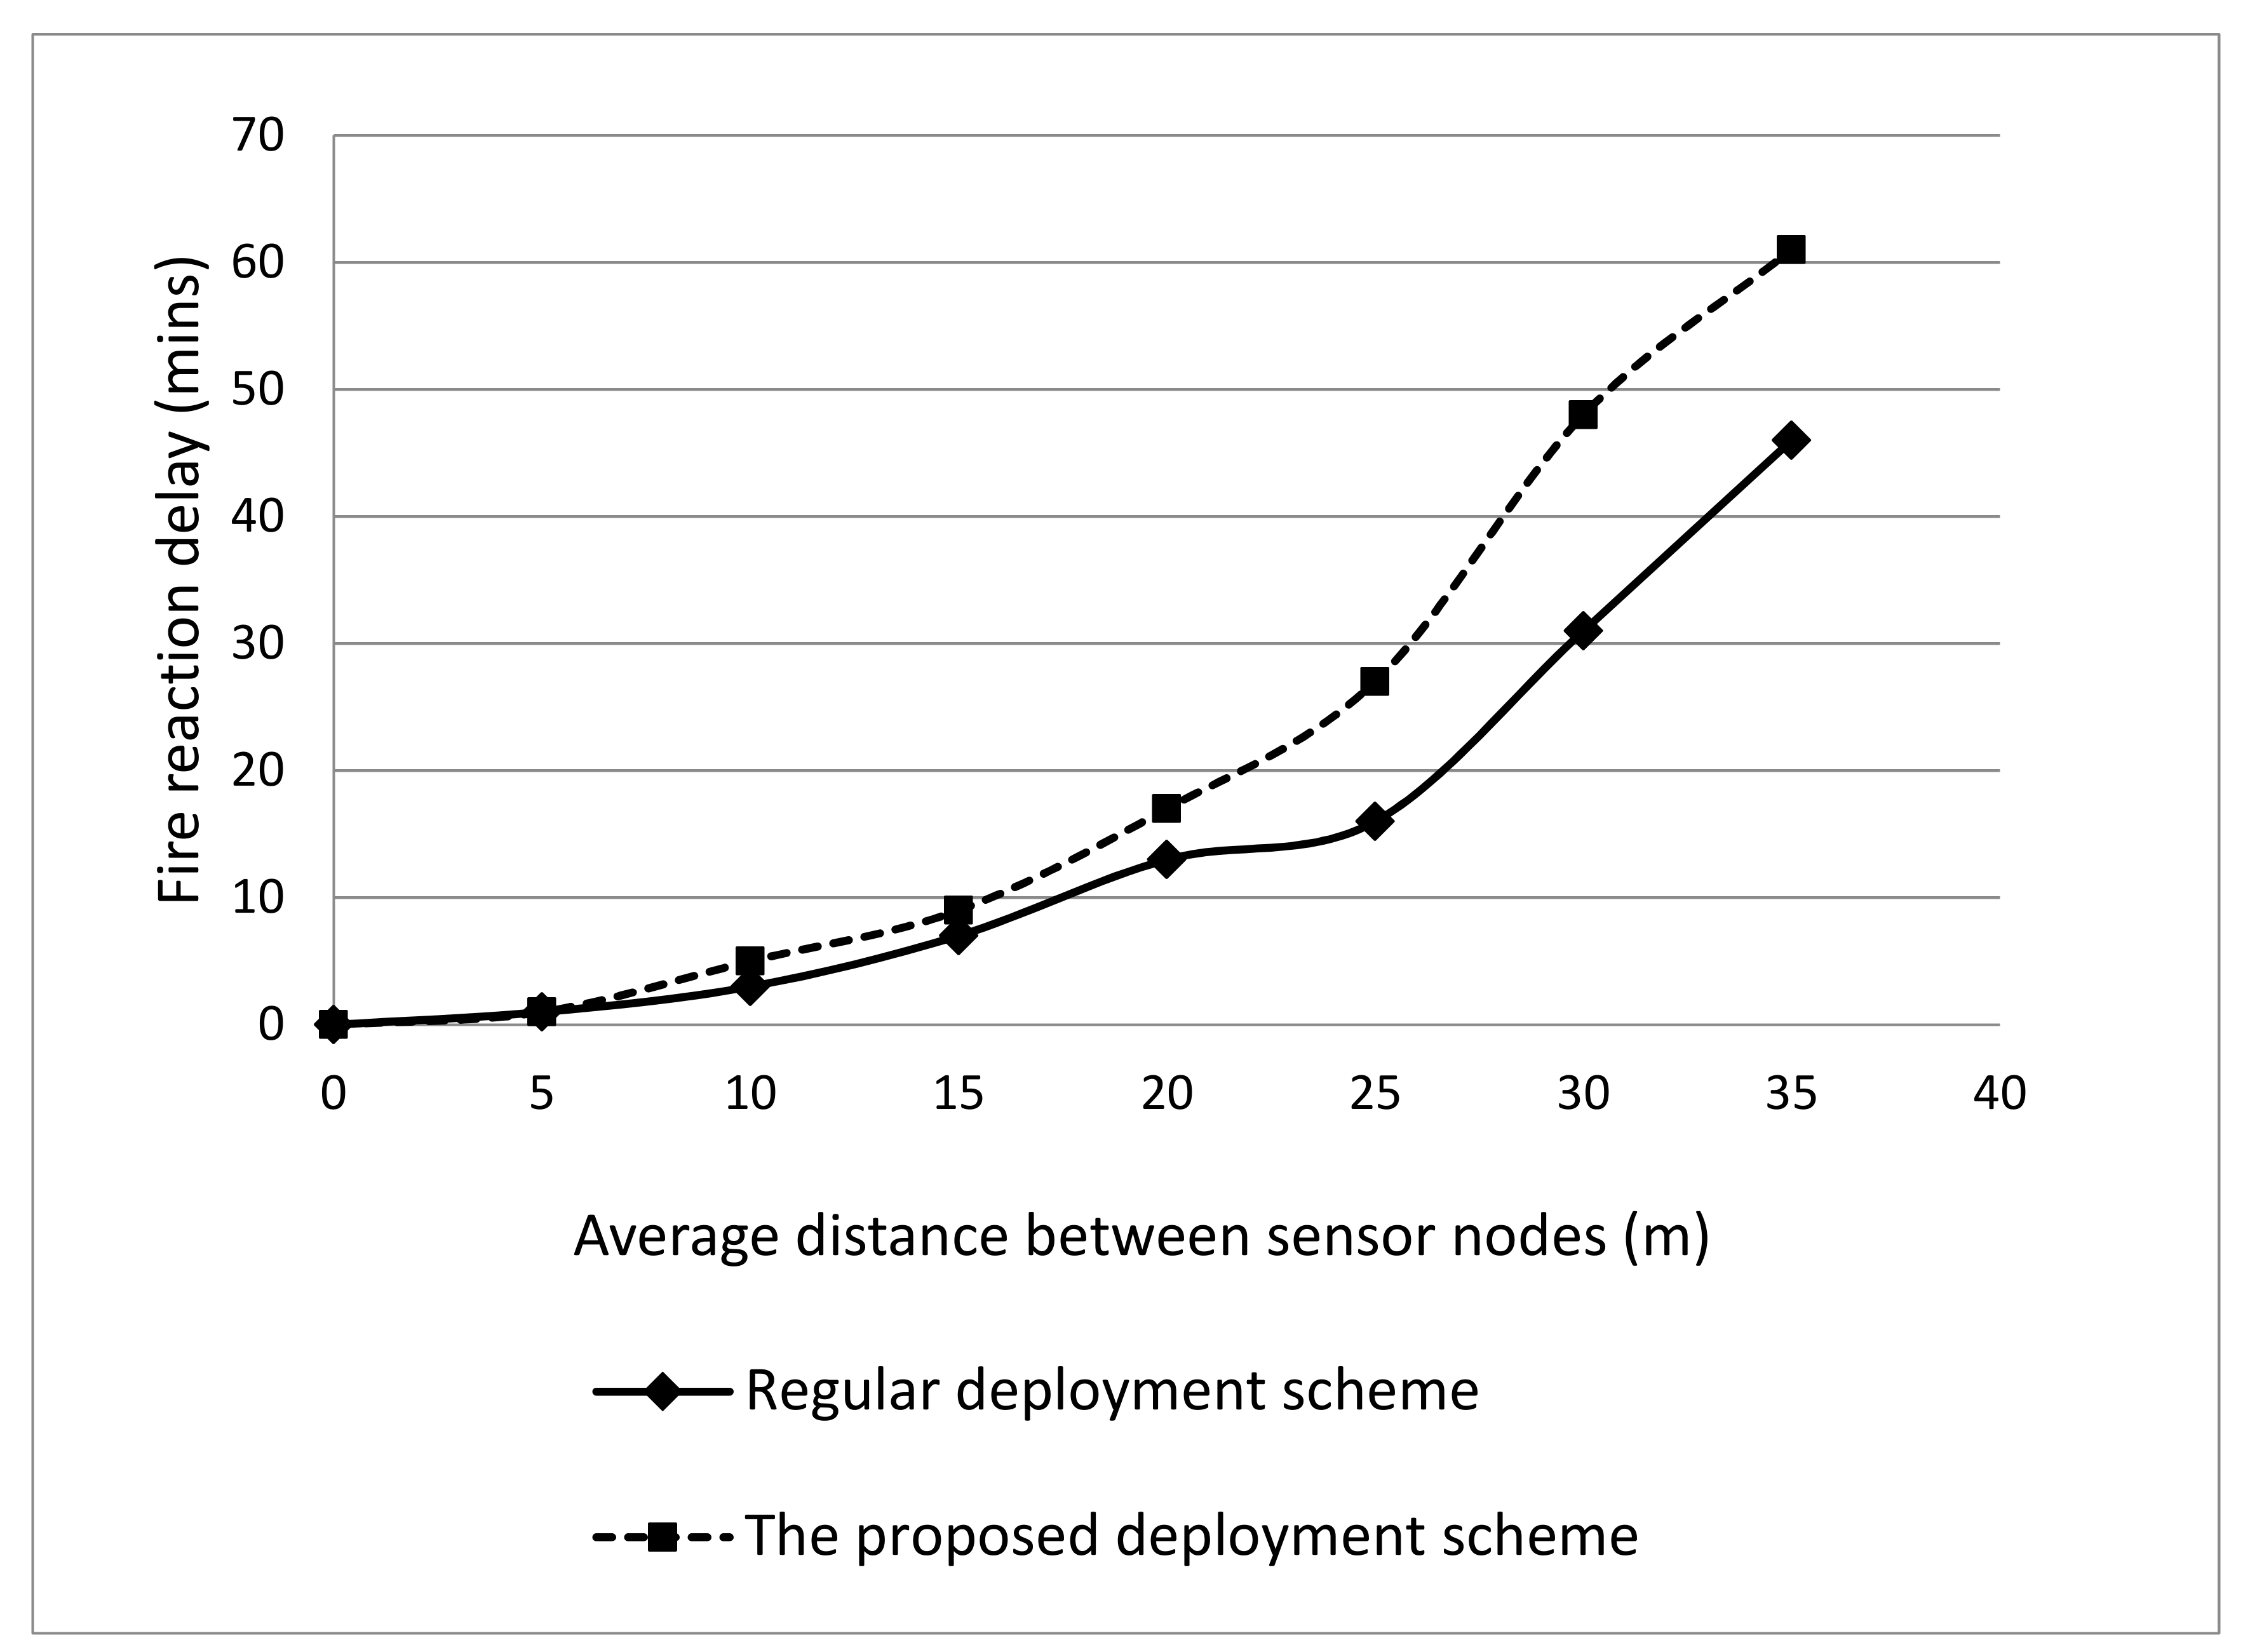
4.2.1. Performance Evaluation on the Proposed Sensor Deployment Scheme

In this subsection, we describe the effects of our proposed sensor deployment scheme on energy consumption and fire reaction delay. To validate that the proposed sensor deployment scheme has a good performance, we compare the proposed scheme with regular deployment. Figure 2 presents the relationship between remaining energy level and the average distance between sensor nodes. Simulation results show that regular deployment performs a better performance compared to the proposed deployment at each different average distance between sensors. This is because even though some sensor nodes in our proposed deployment may be closer to a cluster head than in regular deployment and will consume less energy, there are usually some distant nodes which will consume high energy and hence outweigh the advantage obtained from close-by nodes. As expected, we can see that as the average distance between neighboring nodes increases, both schemes increase the energy consumption.
Figure 3 gives the relationship of average distance between a fire ignition location and the nearest sensor node against the average distance between sensor nodes. It is obvious that the average distance between a fire ignition location and the nearest sensor node is larger in the proposed deployment scheme. This suggests that the proposed scheme has the longer fire reaction delay. This is because the proposed scheme adopts the random deployment in which the distances among nodes are distributed non-uniformly. Additionally, with the increases of average distance between sensor nodes, the average distance between fire ignition location and nearest sensor node increases as well in both schemes. This indicates that in a certain area, the number of sensor nodes deployed has important effects on the fire reaction delay.
Figure 4 provides the relationship between required fire reaction time and the distance between fire ignition location and the node position. We define fire reaction time as the time between a fire starting and the sink station receiving a fire warming message. It can be observed from Figure 4 that it takes more than 13 min for fire reaction time when the average distance between sensors is larger than 20 m. It also suggests that, to react to a fire within 6 min, the sensor nodes should be deployed in such a manner that the average distance among each node should be less than 10 m. Again, the proposed scheme has a little bit longer fire reaction delay than the regular deployment scheme.
Overall, Figure 2, Figure 3 and Figure 4 indicate that the proposed deployment scheme has less contribution to the performance of energy efficiency and fire reaction delay compared to the regular deployment scheme due to its inherent natures. However, in the forest environment, it is impossible to deploy all sensor nodes with a regular grid pattern in large scale. Hence, to improve the performance of energy efficiency and fire reaction delay, we require some extra facilitation.

4.2.2. Performance Evaluation on the Proposed Clustered Hierarchy Network Architecture

In this subsection, we compared our proposed E-LEACH with the flat topology applied in forest fire monitoring and detection application in terms of total data throughput and energy consumption. Figure 5 depicts the relationship between the number of sensors in a cluster and the total data throughput carried in the network which adopts our proposed scheme. Initially, the number of nodes in a cluster is small, and the total data throughput in the network is relatively higher. This is because at this moment, each sensor node should sense the environmental condition more frequently and generate more sensory data and control messages to guarantee the accuracy of the system. As the number of nodes in a cluster increases, the throughput of the network is reduced. Another important finding in this simulation is that the most suitable number of sensor nodes in a cluster for reducing data throughput is 20. If we set more than 20 nodes in a cluster, the data throughput is going to increase again. This may be caused by the increased intra-cluster throughput and control messages.
Figure 6 gives the data throughput of the network varying with simulation time when flat topology is adopted. The average throughput of the network in this case is 0.013 Mbit/s. As compared to Figure 5, we can see that the proposed clustered hierarchy topology has less average data throughput. Furthermore, less data throughput involved in the network will reduce energy consumption.
Figure 7 presents the comparison of the total consumed energy by the networks that adopt the proposed clustered hierarchy topology and flat topology, respectively. From the results we can observe that the proposed topology consumes less energy compared to flat topology. There are two reasons contributing to this superior performance. First, the proposed topology is clustered and hierarchical, which involves less data throughput in the network and further reduced the energy consumption. Second, less energy consumption is due to the unnecessary sensor nodes in a certain cluster, and should always sense the environmental condition. The cluster head schedules each node to be active. Meanwhile, we can find that initially the proposed topology consumes more energy than the flat topology. This is because at the moment, the proposed topology is in the process of clustering, which will consume more energy.

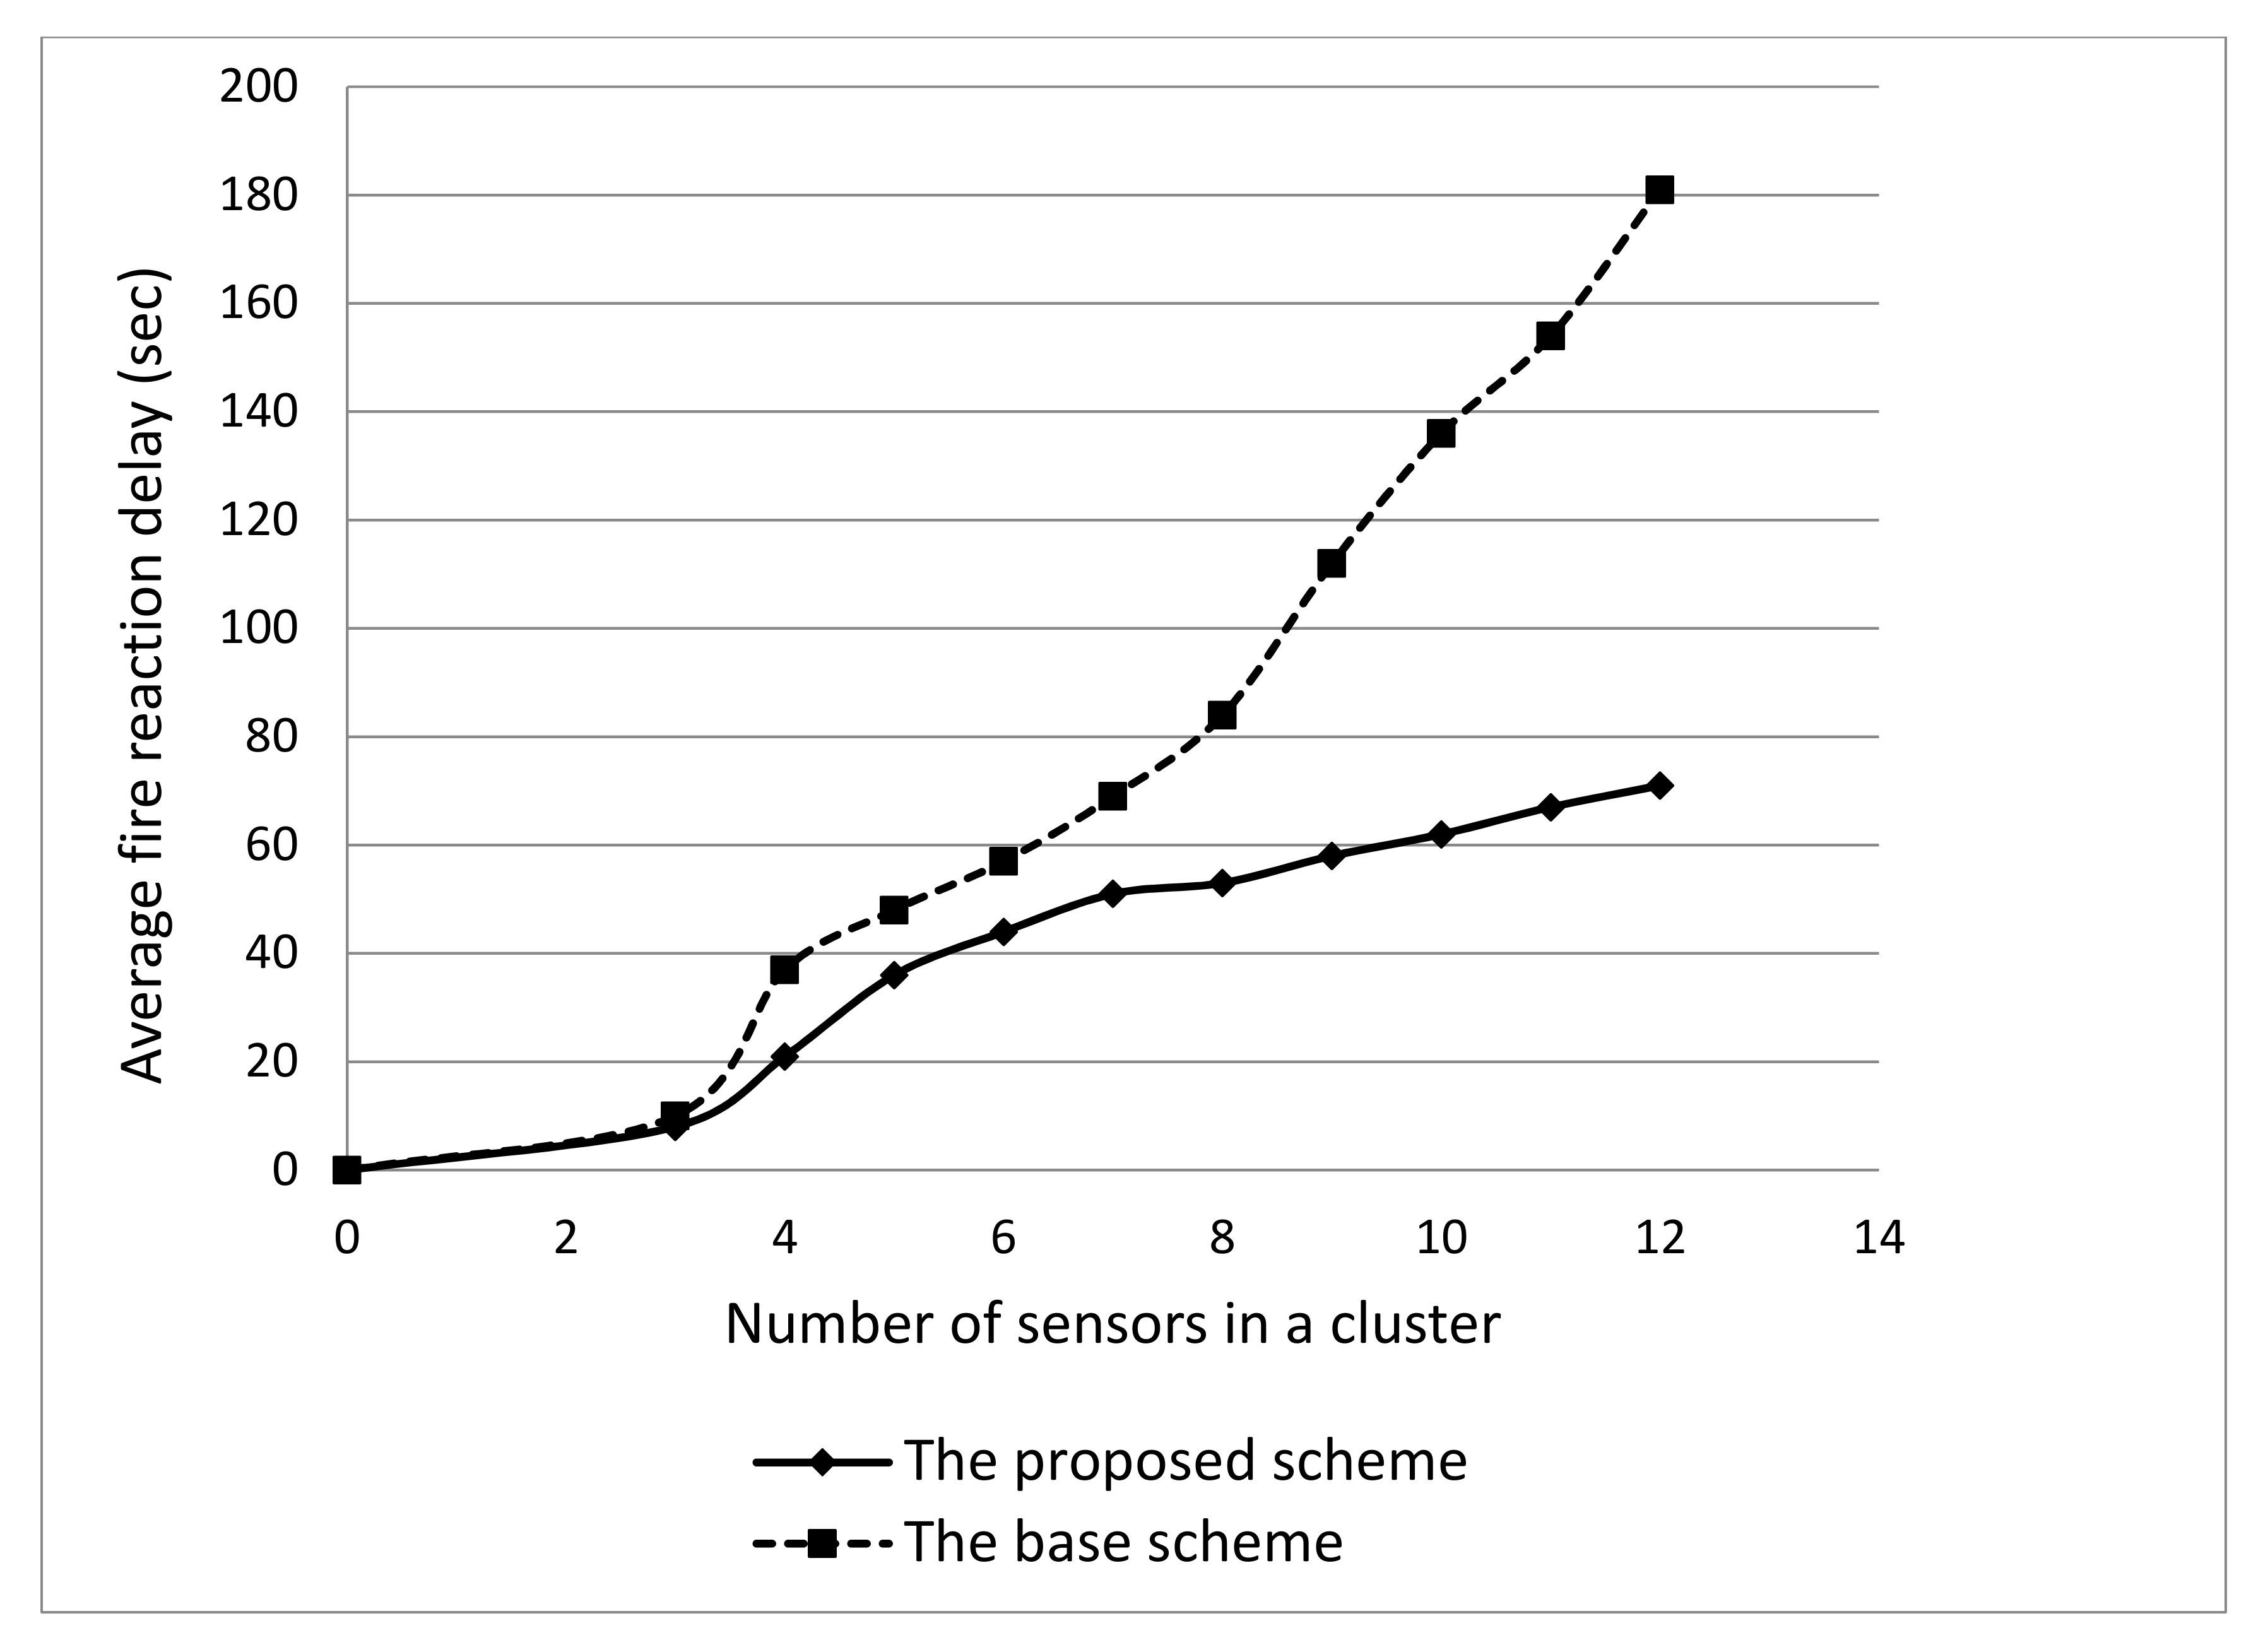
4.2.3. Performance Evaluation on the Proposed Intra-Cluster and Inter-Cluster Protocols

As discussed earlier, our proposed protocols are environmentally aware. That is, the protocol actions include both intra- and inter-clusters and how frequently the data are sensed is determined by multiple factors such as the location of the forest, the climate, and the season etc. In this subsection, we are going to evaluate the performance of the proposed environmentally aware protocol in terms of energy consumption and fire reaction delay. For evaluation purpose, we compare the proposed scheme against a base scheme which does not consider the current environment conditions while making decisions and actions. Figure 8 gives the energy consumption of the proposed scheme and base scheme. As the figure shows, the energy consumed in the base scheme is constant throughout the simulation time. Here, in fact, we can define the simulation time as months of year. This is because our proposed protocol takes into consideration the influence from the seasons. On the other hand, the energy consumption of the proposed scheme depends on the season. In the months when the risk of fire is low, such as winter, our proposed scheme keeps the activity of sensor nodes low and therefore the energy consumed is less. Inversely, in the months when the risk of fire is high, such as autumn, our proposed scheme consumes more energy.
Figure 9 compares the average fire reaction delay of the proposed scheme against the base scheme for various numbers of nodes in a cluster. Again, the proposed scheme performs much better as the cluster size increases. This is because in the case of a fire, in the proposed scheme, a cluster head immediately broadcasts the warming message without any delay. Therefore, the sink station can handle this threat as quickly as possible. More importantly, we can find that the fire reaction delay of our proposed environmentally aware protocols is less than 1 min if the number of nodes in a cluster is less than 10. This indicates that our proposed protocols have the capability to fulfill the minimum requirement of fire early detection within 6 min.

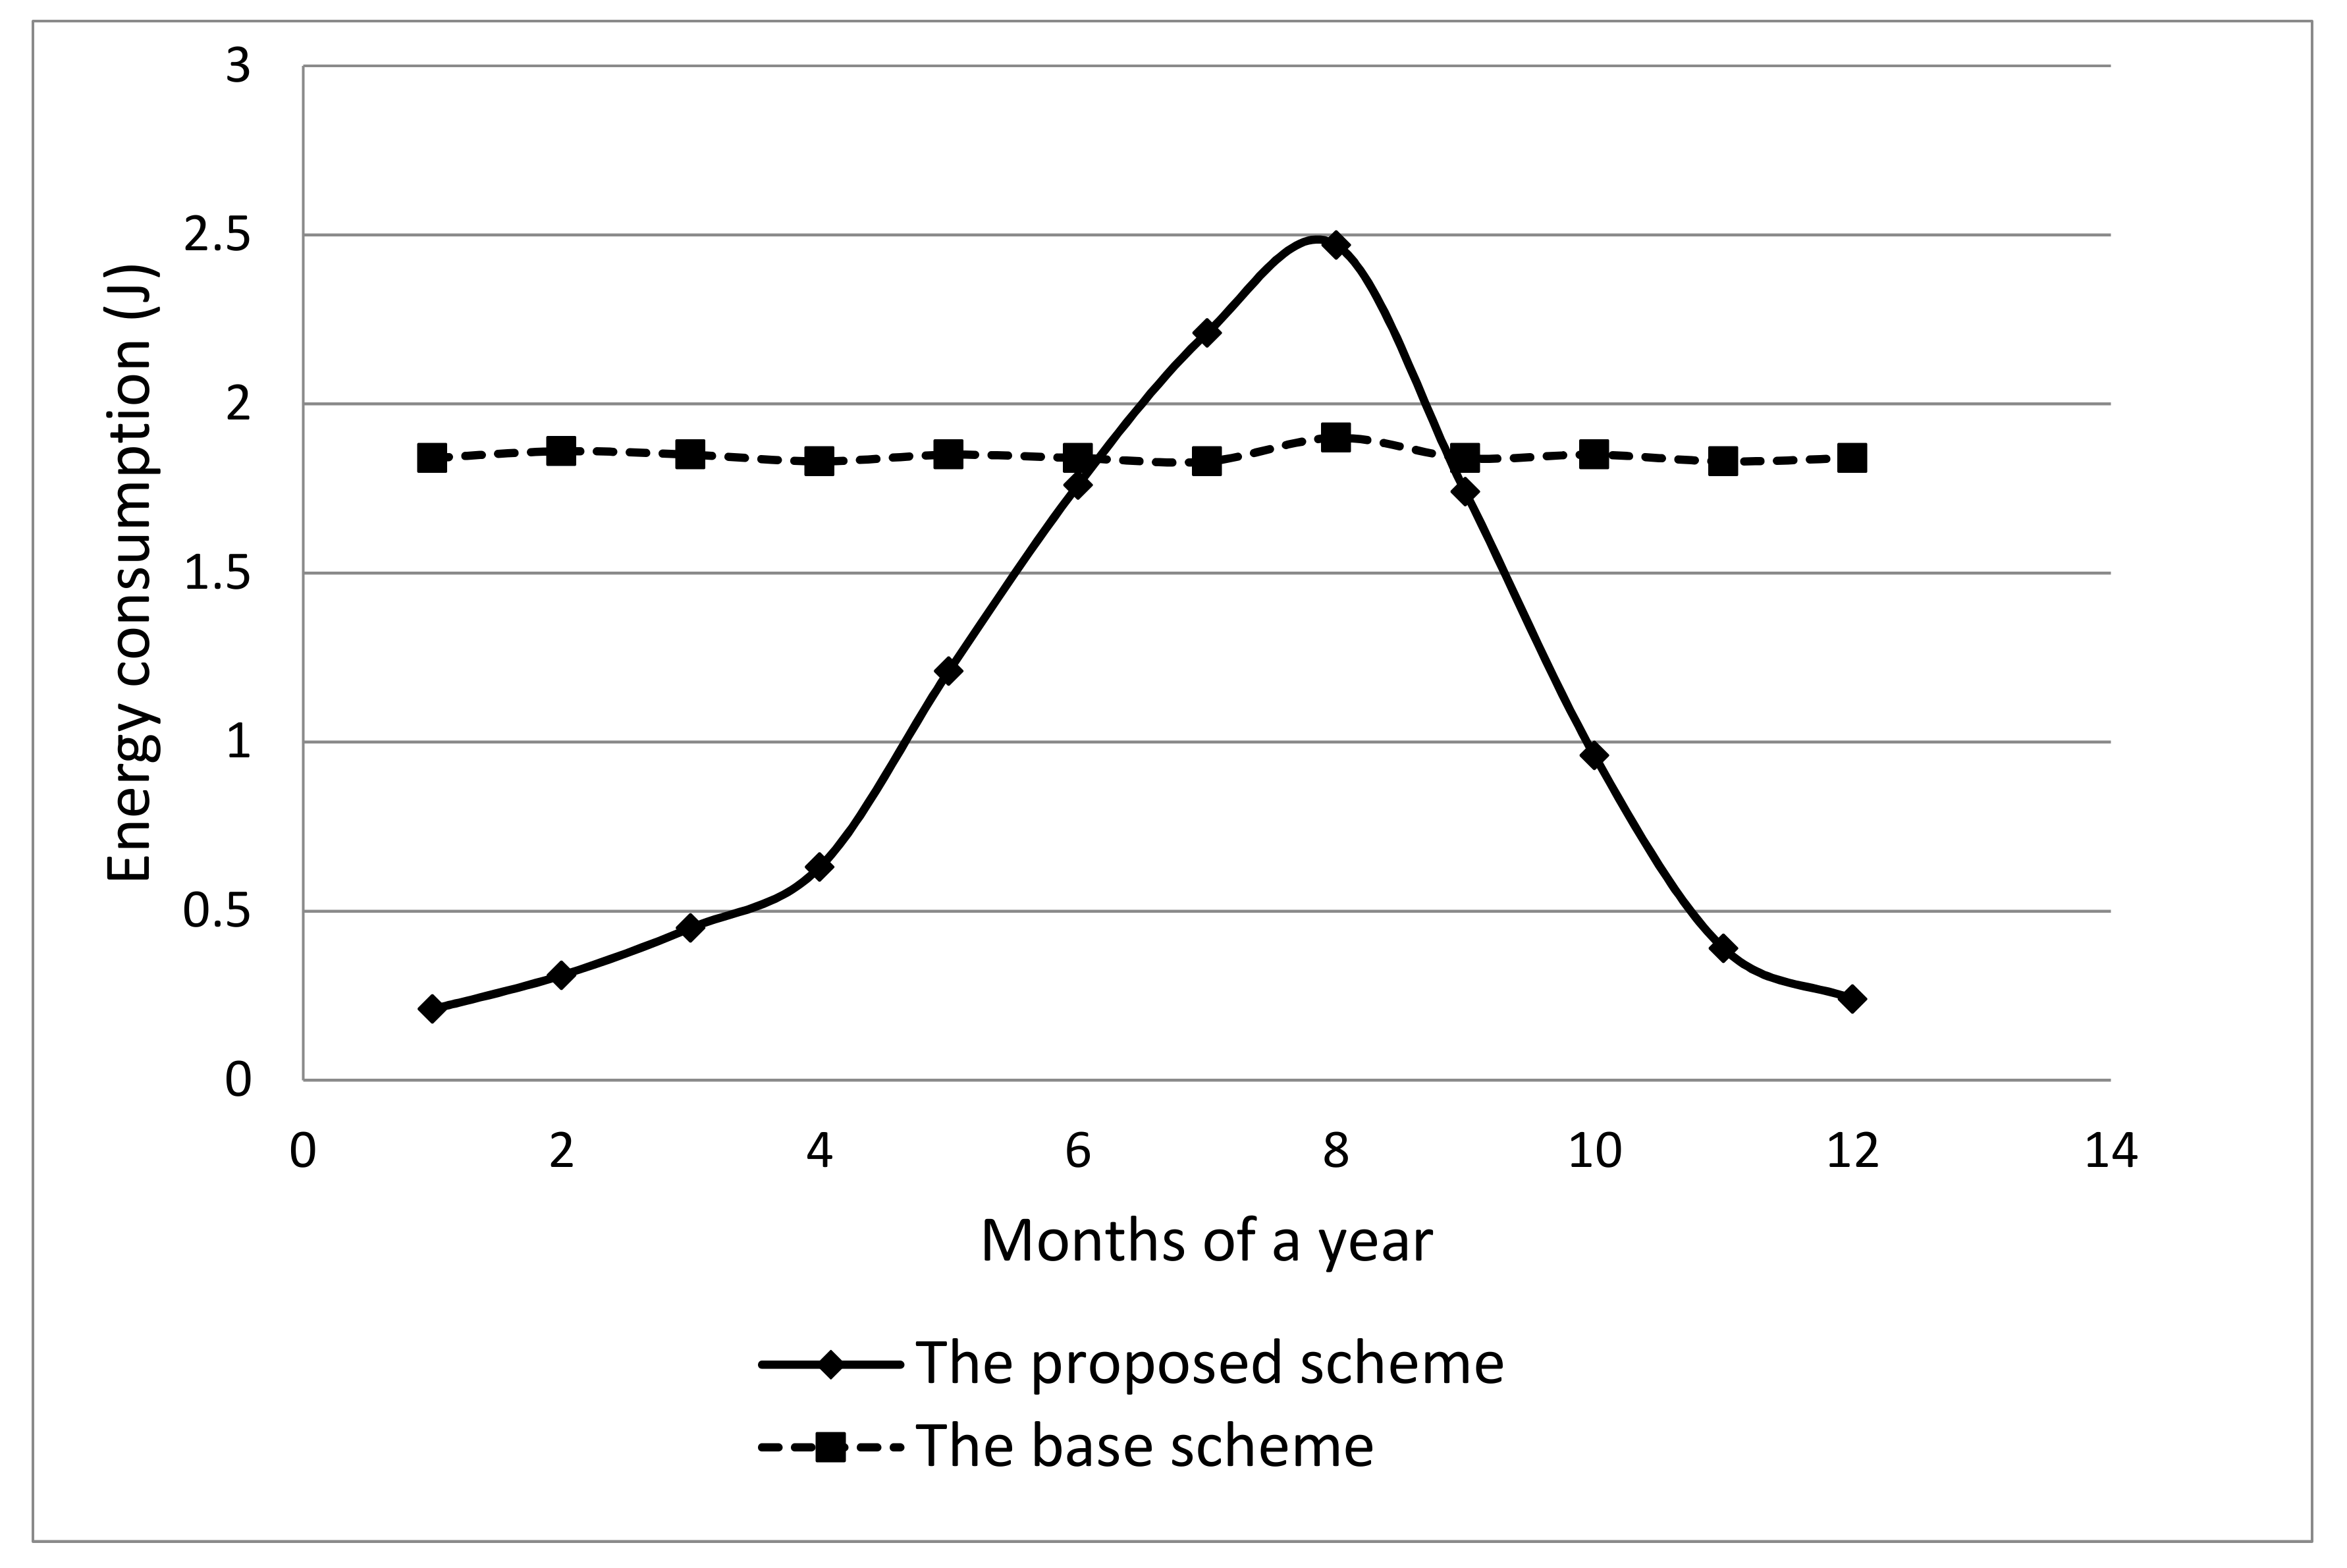
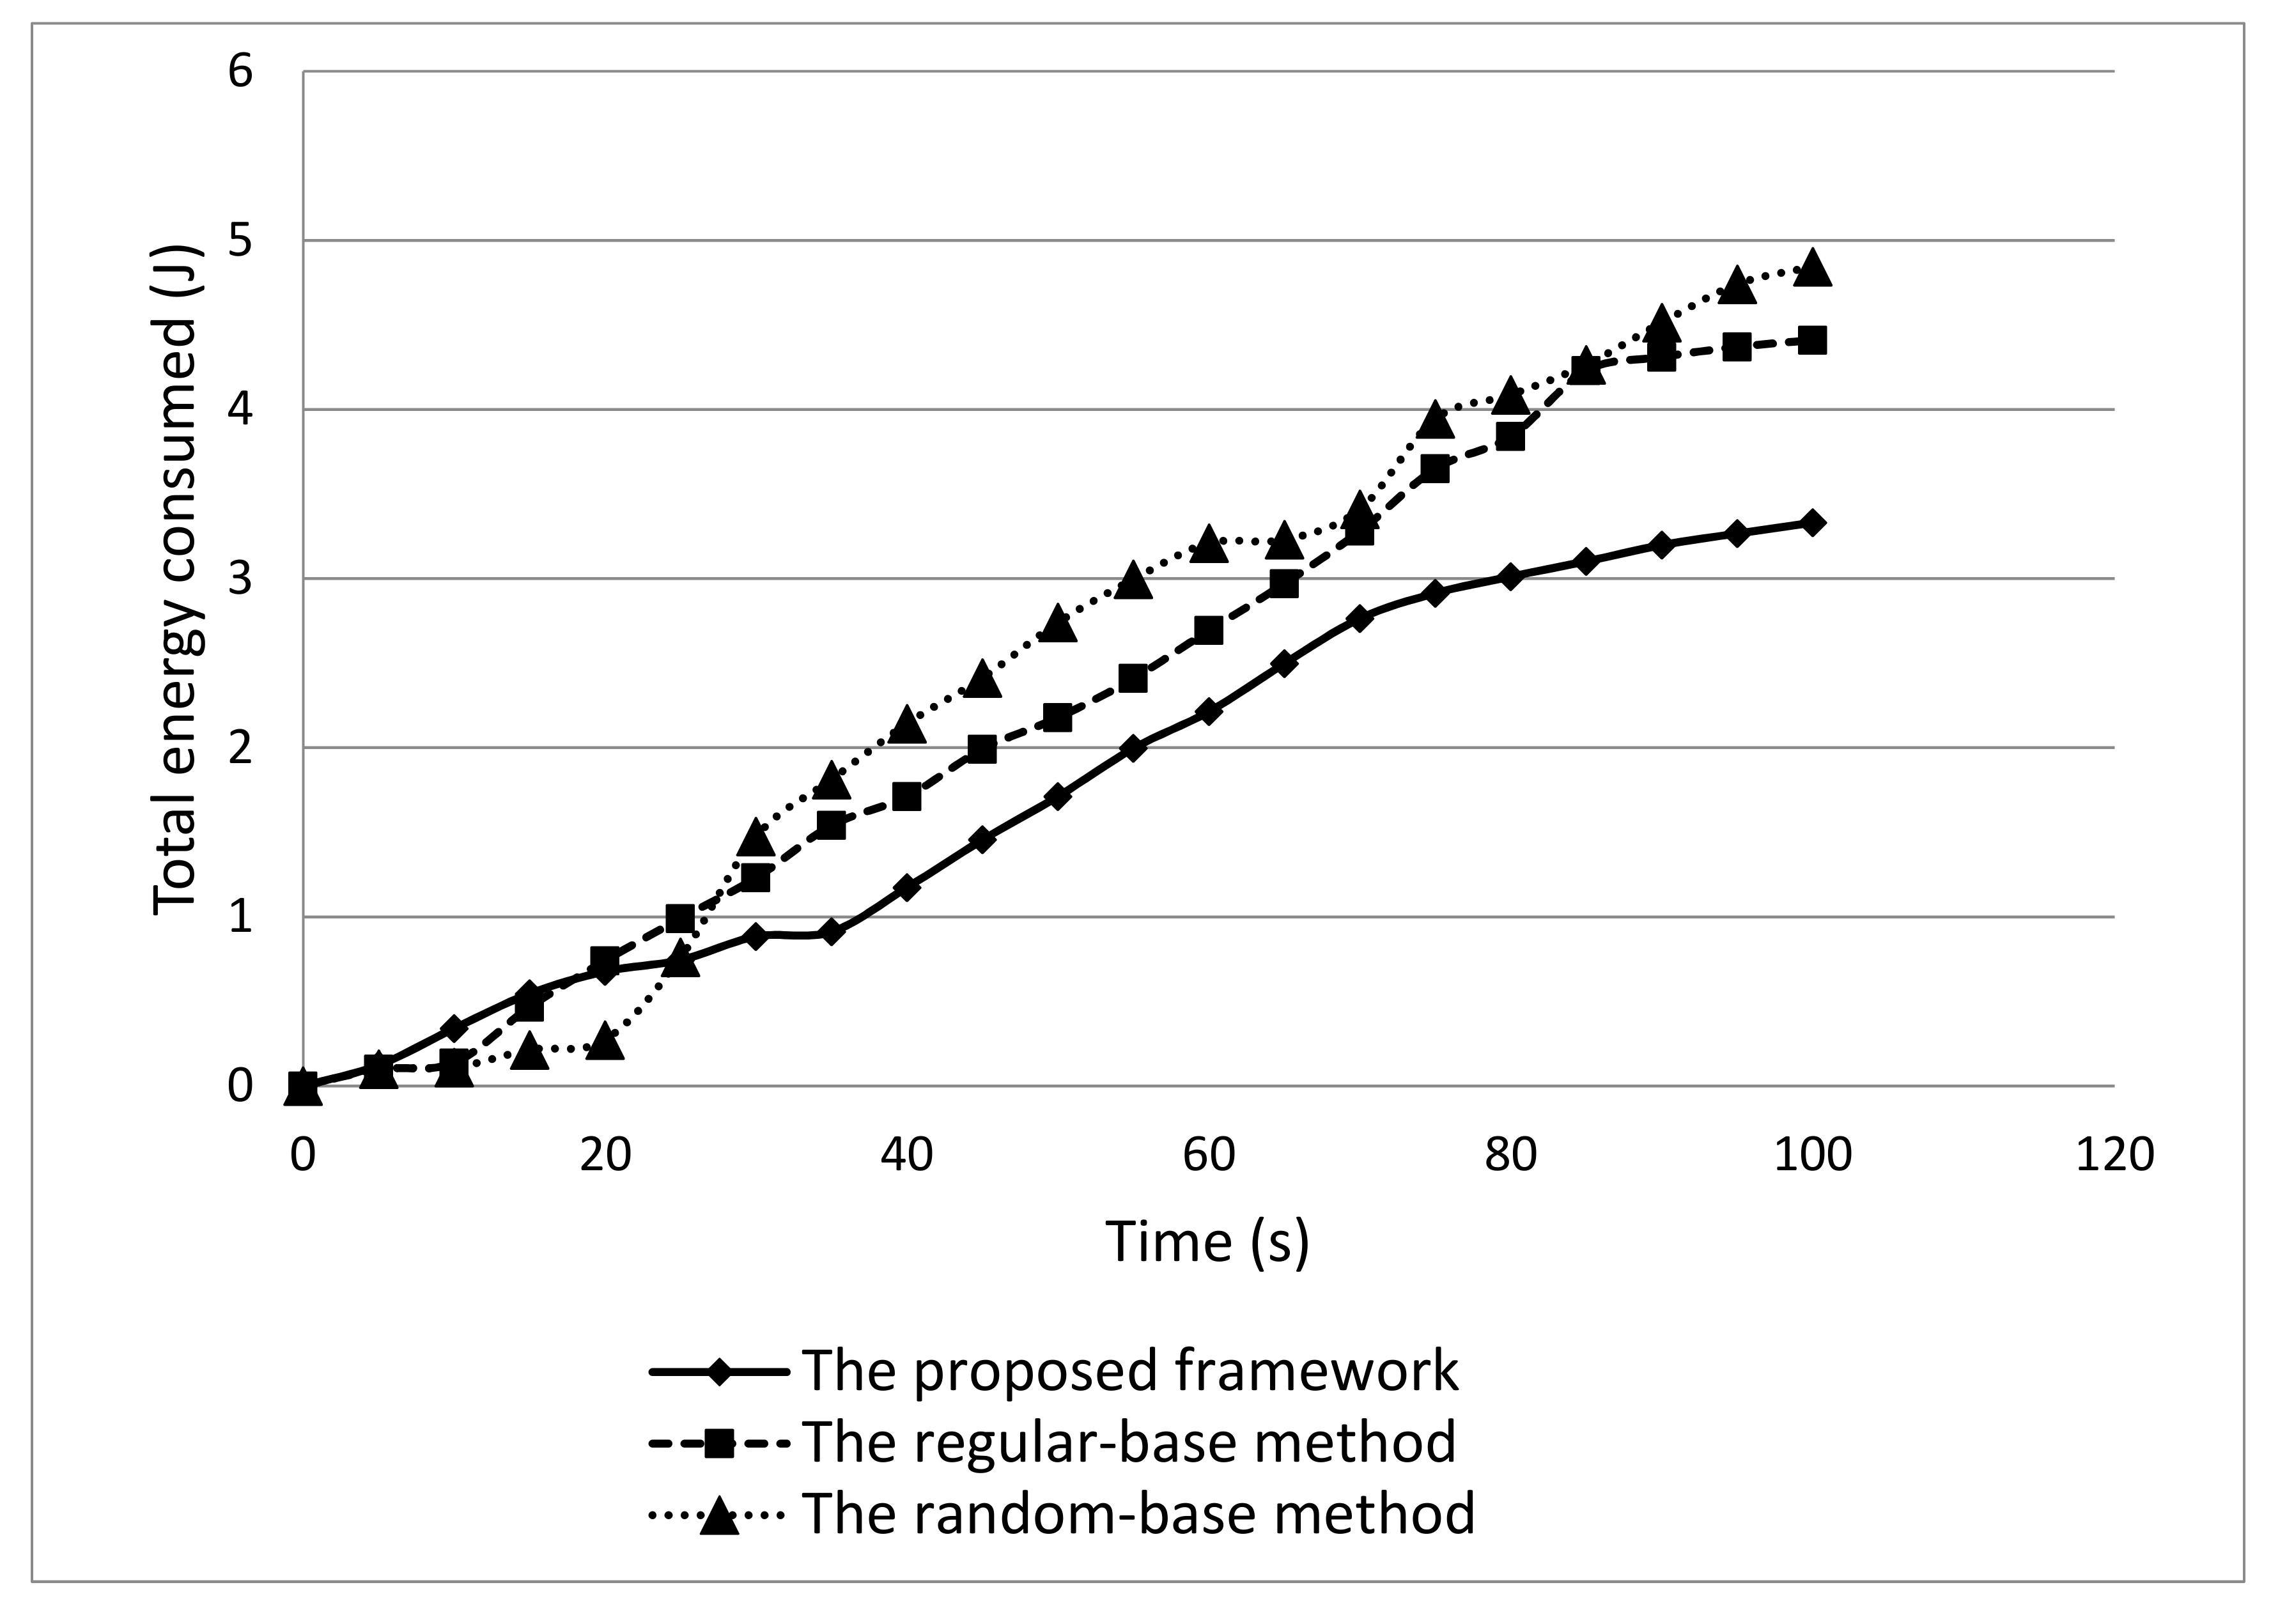
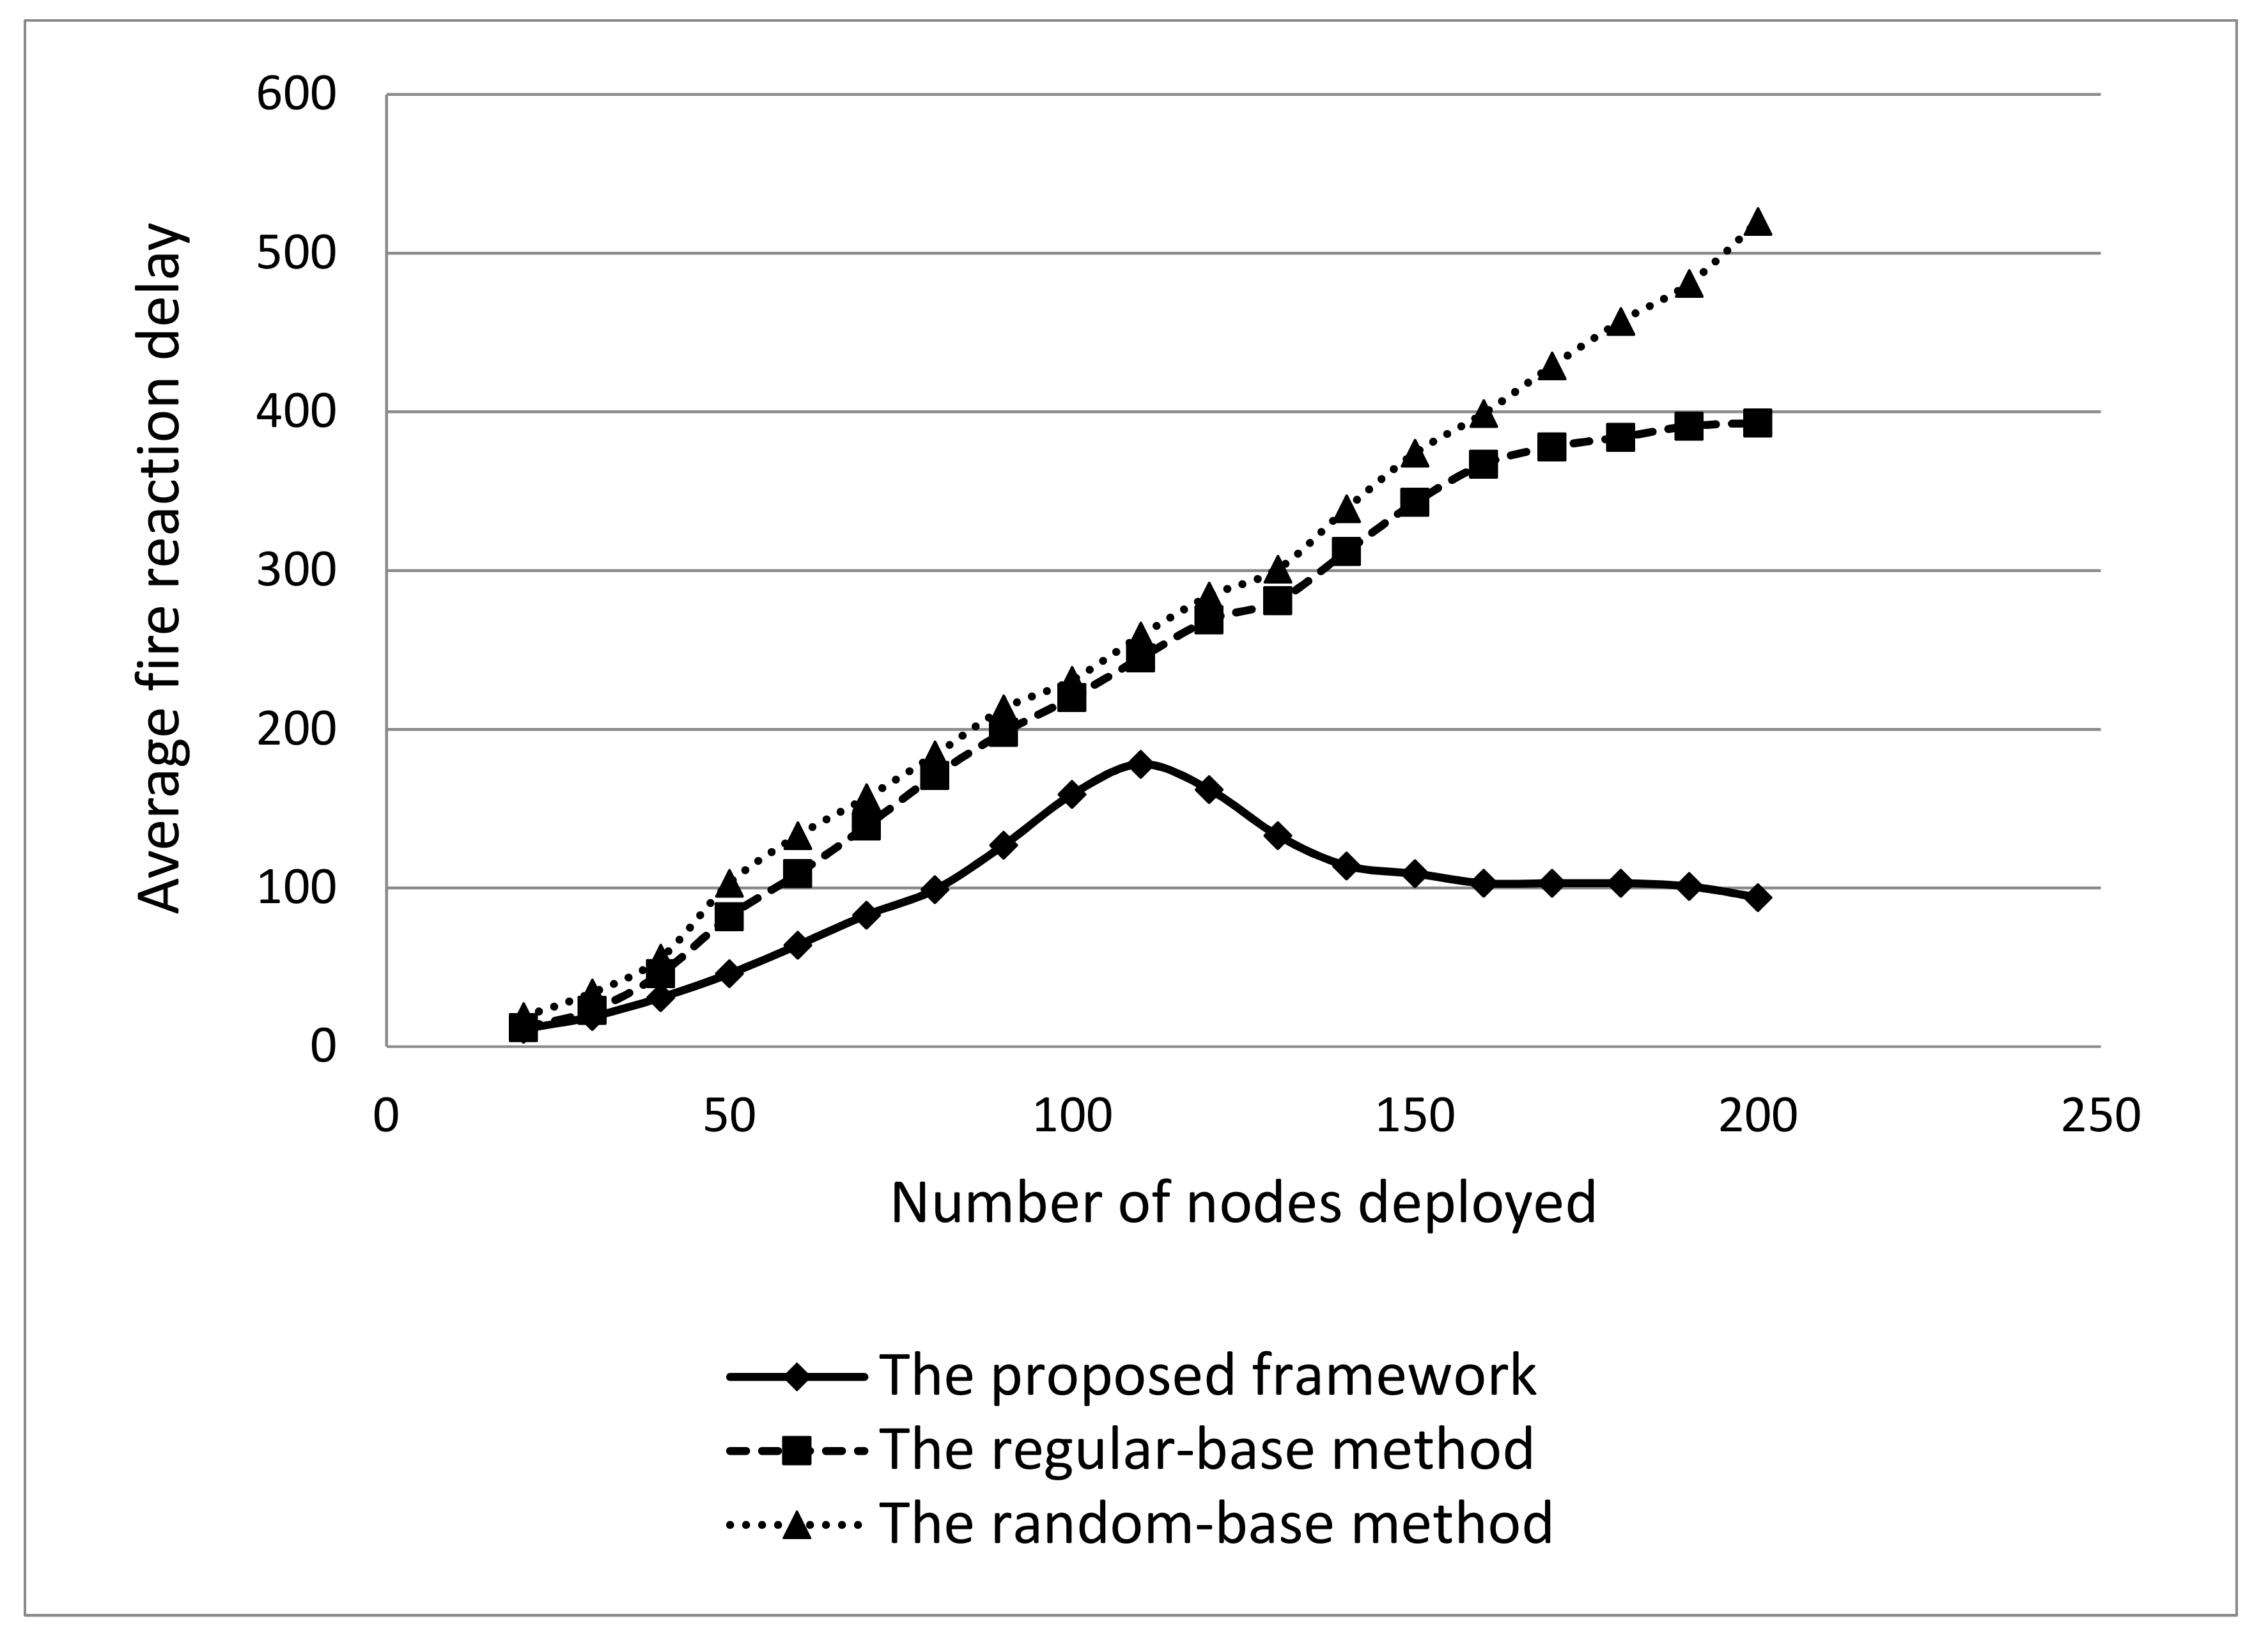
4.2.4. Performance Evaluation on the Proposed Overall Framework

Previously, we evaluated each proposed scheme separately. In this subsection, we evaluate the performance of the proposed overall framework, which includes all the three aspects as mentioned earlier. Again, the indicators of the performance of our proposed framework are energy consumption and fire reaction delay. Therefore, we are mainly concentrating on the evaluation of energy consumption and fire reaction delay of our proposed forest fire monitoring and detection system. We compared our framework with two other methods: One is the random-base method which adopts random deployment, flat topology and is without environmentally aware protocols. Another one is regular-base method, which adopts regular deployment, flat topology and is without environmentally aware protocols.
Figure 10 gives the comparison of the total energy consumption of the three methods. The proposed framework consumes less energy with the maximum of 3.3 J and the random-base method gives the worst performance with the maximum of 4.8 J. Similar to Figure 7, initially the proposed framework consumes most energy due to the process of clustering. The completion time of clustering is around 10 s after the simulation start. Another interesting finding is that at the beginning of simulation, the random-base method has better performance than the regular-base method. This advantage may be contributed from the non-uniform distribution of the sensor nodes.
Figure 11 presents the fires reaction delay of the three methods against different numbers of nodes deployed. It is observed that our proposed framework outperforms another two compared methods. This is because our proposed framework adopted broadcasting mechanisms when a warming message is generated, while the other two methods are without this mechanism. Moreover, initially as the increases of numbers of nodes are deployed, the fire reaction delay is increased. However, when the number of deployed nodes increases to around 110, the average fire reaction delay achieves maximum value at around 178 s. After that, the average fire reaction delays will decrease and trend to smooth, due to the contribution of more sensor nodes being deployed. This result also indicates that our proposed framework has scalability and can be implemented practically. Meanwhile, the regular-base method has a little better performance than the random-base method due to its features of topology architecture, but in fact, in the forest environment, it is very difficult to deploy a topology in a regular pattern. Most importantly, we can obtain the result that the proposed framework enables a guarantee of the minimum requirement of reaction to a fire within 6 min.

5. Conclusions

The main motivation of this paper is to propose a general framework for WSNs to be used in forest fire surveillance and detection. Our framework considers the aspects of sensor node deployment, clustered hierarchy network architecture and environmentally aware intra- and inter- cluster protocols to facilitate performance in terms of energy consumption and fire reaction delay. The major goal of our proposed forest fire monitoring and detection system is the early detection of forest fire while consuming less energy. From the ns-2-based simulation results, we observed that our system can be used to monitor and detect forest fires effectively and efficiently. Moreover, we conclude that seasonal and environmental conditions are significant factors for designing a WSN-based forest fire monitoring and detection system. This paper also opens several directions which should be investigated in future studies on WSN-based forest fires monitoring and detection systems. For example, data synchronization, localization of the nodes with or without GPS, and dynamic routing among cluster heads etc.

Author Contributions

The research design is completed by Y.-H.X. The data analysis is completed by Y.-H.X. and Q.-Y.S. The document retrieval and icon production are completed by Y.-H.X. and Y.-T.X. The data collection is completed Q.-Y.S. and Y.-T.X. The manuscript is written by Y.-H.X.

Funding

This project was supported by Introduction of high-level talents and overseas returnees scientific fund in Nanjing Forestry University (Grant No.: GXL015) and the Natural science foundation of the Jiangsu higher education institutions of China (Grant No.: 16KJB510016).

Conflicts of Interest

The authors declare no conflicts of interest.

References

  1. Botts, H.; Thomas, J.; Kolk, S.; McCabe, S.; Stueck, B.; Suhr, L. CoreLogic Wildfire Hazard Risk Report: Residential Wildfire Exposure Estimates for the Western United States; CoreLogic: Irvine, CA, USA, 2013. [Google Scholar]
  2. Ohdaira, T.; Endo, K.; Abe, N.; Yasuda, Y. Usefulness in notes of an intra-abdominal antifogging wireless charge-coupled device (ccd) camera with pantograph-type needle unit for placement to the intra-abdominal wall. Surg. Endos. 2010, 24, 198–209. [Google Scholar] [CrossRef] [PubMed]
  3. Schmitz, H.; Bleckmann, H. The photomechanic infrared receptor for the detection of forest fires in the beetle melanophila acuminata (coleoptera: Buprestidae). J. Comp. Physiol. A 1998, 182, 647–657. [Google Scholar] [CrossRef]
  4. Domenikiotis, C.; Loukas, A.; Dalezios, N.R. The use of noaa/avhrr satellite data for monitoring and assessment of forest fires and floods. Nat. Hazards Earth Syst. Sci. 2003, 3, 115–128. [Google Scholar] [CrossRef]
  5. Zhu, D.X.; Wang, X.D.; Wu, W.B. Research on the forest fire survey system based on wireless sensor network. Adv. Mater. Res. 2012, 518–523, 1597–1602. [Google Scholar] [CrossRef]
  6. Yuan, C.; Liu, Z.; Zhang, Y. UAV-based forest fire detection and tracking using image processing techniques. In Proceedings of the International Conference on Unmanned Aircraft Systems, Denver, CO, USA, 9–12 June 2015; pp. 639–643. [Google Scholar]
  7. Töreyin, B.U.; Dedeoğlu, Y.; Güdükbay, U.; Çetin, A.E. Computer vision based method for real-time fire and flame detection. Pattern Recognit. Lett. 2006, 27, 49–58. [Google Scholar] [CrossRef] [Green Version]
  8. Yick, J.; Mukherjee, B.; Ghosal, D. Wireless sensor network survey. Comput. Netw. Int. J. Comput. Telecommun. Netw. 2008, 52, 2292–2330. [Google Scholar] [CrossRef]
  9. Hefeeda, M.; Bagheri, M. Forest fire modeling and early detection using wireless sensor networks. Ad Hoc Sens. Wirel. Netw. 2009, 7, 169–224. [Google Scholar]
  10. Bahrepour, M.; Meratnia, N.; Havinga, P.J.M. Automatic Fire Detection: A Survey from Wireless Sensor Network Perspective; University of Twente Centre for Telematics & Information Technology: Enschede, The Netherlands, 2008. [Google Scholar]
  11. Aslan, Y.E.; Korpeoglu, I.; Ulusoy, Ö. A framework for use of wireless sensor networks in forest fire detection and monitoring. Comput. Environ. Urban Syst. 2012, 36, 614–625. [Google Scholar] [CrossRef] [Green Version]
  12. MODIS Web Page. Available online: http://MODIS.gsfc.nasa.gov (accessed on 17 October 2018).
  13. AVHRR Web Page. Available online: http://noaasis.noaa.gov/noaasis (accessed on 17 October 2018).
  14. Wang, C.; Guo, S.; Yang, Y. An optimization framework for mobile data collection in energy-harvesting wireless sensor networks. IEEE Trans. Mob. Comput. 2016, 15, 2969–2986. [Google Scholar] [CrossRef]
  15. Ahmadi, Y.; Neda, N.; Ghazizadeh, R. Range free localization in wireless sensor networks for homogeneous and non-homogeneous environment. IEEE Sens. J. 2016, 16, 8018–8026. [Google Scholar] [CrossRef]
  16. Lin, C.C.; Deng, D.J.; Chen, Z.Y.; Chen, K.C. Key design of driving industry 4.0: Joint energy-efficient deployment and scheduling in group-based industrial wireless sensor networks. IEEE Commun. Mag. 2016, 54, 46–52. [Google Scholar] [CrossRef]
  17. Ye, M.; Wang, Y.; Dai, C.; Wang, X. A hybrid genetic algorithm for the minimum exposure path problem of wireless sensor networks based on a numerical functional extreme model. IEEE Trans. Veh. Technol. 2015, 65, 8644–8657. [Google Scholar] [CrossRef]
  18. Guo, J.; Jafarkhani, H. Sensor deployment with limited communication range in homogeneous and heterogeneous wireless sensor networks. IEEE Trans. Wirel. Commun. 2016, 15, 6771–6784. [Google Scholar] [CrossRef]
  19. Zhang, L.; Zhang, Y. Energy-efficient cross-layer protocol of channel-aware geographic-informed forwarding in wireless sensor networks. IEEE Trans. Veh. Technol. 2009, 58, 3041–3052. [Google Scholar] [CrossRef]
  20. Son, B.; Her, Y.S. A design and implementation of forest-fires surveillance system based on wireless sensor networks for south korea mountains. Int. J. Comput. Sci. Netw. Secur. 2005, 6, 124–130. [Google Scholar]
  21. Ngai, E.; Zhou, Y.; Lyu, M.R.; Liu, J. A delay-aware reliable event reporting framework for wireless sensor–actuator networks. Ad Hoc Netw. 2010, 8, 694–707. [Google Scholar] [CrossRef]
  22. García, E.M.; Serna, M.Á.; Bermúdez, A.; Casado, R. Simulating a WSN-Based Wildfire Fighting Support System. In Proceedings of the IEEE International Symposium on Parallel and Distributed Processing with Applications, Sydney, NSW, Australia, 10–12 December 2008; pp. 896–902. [Google Scholar]
  23. Bahrepour, M.; Meratnia, N.; Havinga, P.J.M. Fast and accurate residential fire detection using wireless sensor networks. Environ. Eng. Manag. J. 2010, 9, 215–221. [Google Scholar] [CrossRef]
  24. Fernández-Berni, J.; Carmona-Galán, R.; Martínez-Carmona, J.F.; Rodríguez-Vázquez, Á. Early forest fire detection by vision-enabled wireless sensor networks. Int. J. Wildl. Fire 2012, 21, 938–949. [Google Scholar] [CrossRef]
  25. Khamukhin, A.A.; Bertoldo, S. Spectral analysis of forest fire noise for early detection using wireless sensor networks. In Proceedings of the 2016 International Siberian Conference on Control and Communications (SIBCON), Moscow, Russia, 12–14 May 2016; pp. 1–4. [Google Scholar]
  26. Losso, A.; Corgnati, L.; Bertoldo, S.; Allegretti, M.; Notarpietro, R.; Perona, G. SIRIO: An integrated forest fire monitoring, detection and decision support system—Performance and results of the installation in Sanremo (Italy). WIT Trans. Ecol. Environ. 2012, 158, 79–90. [Google Scholar]
  27. Doolin, D.M. Wireless Sensors for Wildfire Monitoring. Available online: http://spie.org/Publications/Proceedings/Paper/10.1117/12.605655 (accessed on 17 October 2018).
  28. Celik, T. Fast and efficient method for fire detection using image processing. ETRI J. 2010, 32, 881–890. [Google Scholar] [CrossRef]
  29. Washington State University. Department of Natural Resource Sciences. Available online: http://www.ruraltech.org/ (accessed on 17 October 2018).
  30. National Fire Danger Rating System (NFDRS). Available online: http://www.wrh.noaa.gov/sew/fire/olm/nfdrs.htm/ (accessed on 17 October 2018).
  31. Documentation Sent by the Meteorological Service of Canada [Obtained by Post, March 2010]. Available online: https://www.canada.ca/en/services/environment (accessed on 17 October 2018).
  32. FireLib Public Domain Software for the Wildland Fire Community. Available online: http://fire.org/ (accessed on 17 October 2018).
Figure 1. Simulation topology.
Futureinternet 10 00102 g001
Figure 2. Remaining energy level of regular deployment and the proposed deployment schemes.
Futureinternet 10 00102 g002
Figure 3. Average distance between fire ignition and nearest sensor node of regular deployment and the proposed deployment schemes.
Futureinternet 10 00102 g003
Figure 4. Fire reaction delay for various average distances between sensor nodes.
Futureinternet 10 00102 g004
Figure 5. Relationship between the number of sensors in a cluster and the total data throughput in network.
Futureinternet 10 00102 g005
Figure 6. Data throughput of the network which adopts flat topology.
Futureinternet 10 00102 g006
Figure 7. Total energy consumption.
Futureinternet 10 00102 g007
Figure 8. Energy Consumption of the proposed and base schemes.
Futureinternet 10 00102 g008
Figure 9. Average fire reaction delay of the proposed and base schemes with the various cluster size.
Futureinternet 10 00102 g009
Figure 10. The total energy consumption of the three compared methods.
Futureinternet 10 00102 g010
Figure 11. Fires reaction delays of the three compared methods.
Futureinternet 10 00102 g011
Table 1. Contents of each node.
Node IDAliveSleepHeadActiveCluster
intbytebytebytebyteint
Table 2. Network parameters used in simulation.
ParametersValue
Number of node121
Channel typeChannel/WirelessChannel
Radio propagationPropagation/TwoRayGround
Physical typePhy/WirelessPhy/802_15_4
MAC typeMac/802_15_4
Interface queue typeQueue/DropTail/PriQueue
Link layer typeLL
Antenna patternAntenna/OmniAntenna
Frequency2.4 GHz
Interface queue length50
Initial energy of node5J
Transmission Energy (TXE)1 mW
Receiving Energy (RXE)1 mW
CSThresh_1.10765 × 10−11 Hz
RXThresh_1.10765 × 10−11 Hz
Packet size70 bytes
Transport layer protocolUser Datagram Protocol (UDP)
Data traffic typeConstant Bit Rate (CBR)
The topology width1000
The topology length1000
Simulation duration100 s

