3.1. Outlier Batch Identification
Figure 3a displays the average NIR spectra for all 14 batches of the samples that contain LOD measurements (in further text, LOD-batches). It can be observed that some batches ‘1020’, ‘1214’, and ‘1213’, severely deviate from others.
Figure 3b presents a plot of the first two principal components (PCs), which account for 90% of the data variance. From here, it can be seen that all the ‘1214’ batch spectra are separated from other batch spectra, and almost all from the ‘1020’ batch. On the other hand, most of the ‘1213’ batches fall within the range of other batch spectra. According to
Supplementary Figure S1a, all the samples from the ‘1020’ and ‘1214’ batches are classified into two separate clusters from the rest of the NIR SNV spectra using the first three PCs. By using a combination of the plot of the explained variance number for each PC and also referring in part to the Kaiser rule (selection of the number of components with eigenvalues > 1) [
23], the optimum number of PCs was determined to be five for the NIR spectra. The strict Kaiser rule would give seven, but Kaiser scores (obtained as wavelength variables (256) times the fraction of explained variance) for the sixth and seventh equal only 1.1 and 1.03 and are smaller when compared to the fourth (4.77) and fifth (3.44). As the Kaiser rule in the literature mostly overestimates the number of PCs [
24], five components were selected to be significant. This is well illustrated in
Figure S1b, displaying a ln(Eigenvalue) vs. the number of components scree plot, from which it is obvious why five components is the optimal choice.
From
Figure 4a, it can be observed that all the NIR spectra from both the ‘1020’ and ‘1214’ batches are obvious outliers. To be more objective, from the squared Mahalanobis distances (using a
t-test), soft independent modeling of class analogy (SIMCA) [
20] revealed the
p-values for all the non-outlier batches (i.e., all the samples below the red line in
Figure 4a). The closest sample below the red line (for batch ‘0920’) had
p < 0.001, and the next four closest samples had
p < 0.01. This means that all the samples above the red line (with Mahalanobis threshold = 3) have a
p-value far below 0.001 and should be classified as outliers. Also, if less than five PCs were considered, e.g., according to the scree plot, three PCs, then
Figure S2 represents the Mahalanobis distance metric of the first three PCs applied to all the NIR spectra, making the outlier batches even more separated from the rest (see
Figure S2).
Figure 4b presents the results of the probability-based outlier-detection method [
18], and the two highest jump degrees were considered, as they differ negligibly in size. From the figure, it can be seen that all the ‘1214’ spectra are clear outliers, while depending on the jump degree selected, either one or five outliers are present in batch ‘1020’. No samples from other batches are determined to significantly deviate from the rest.
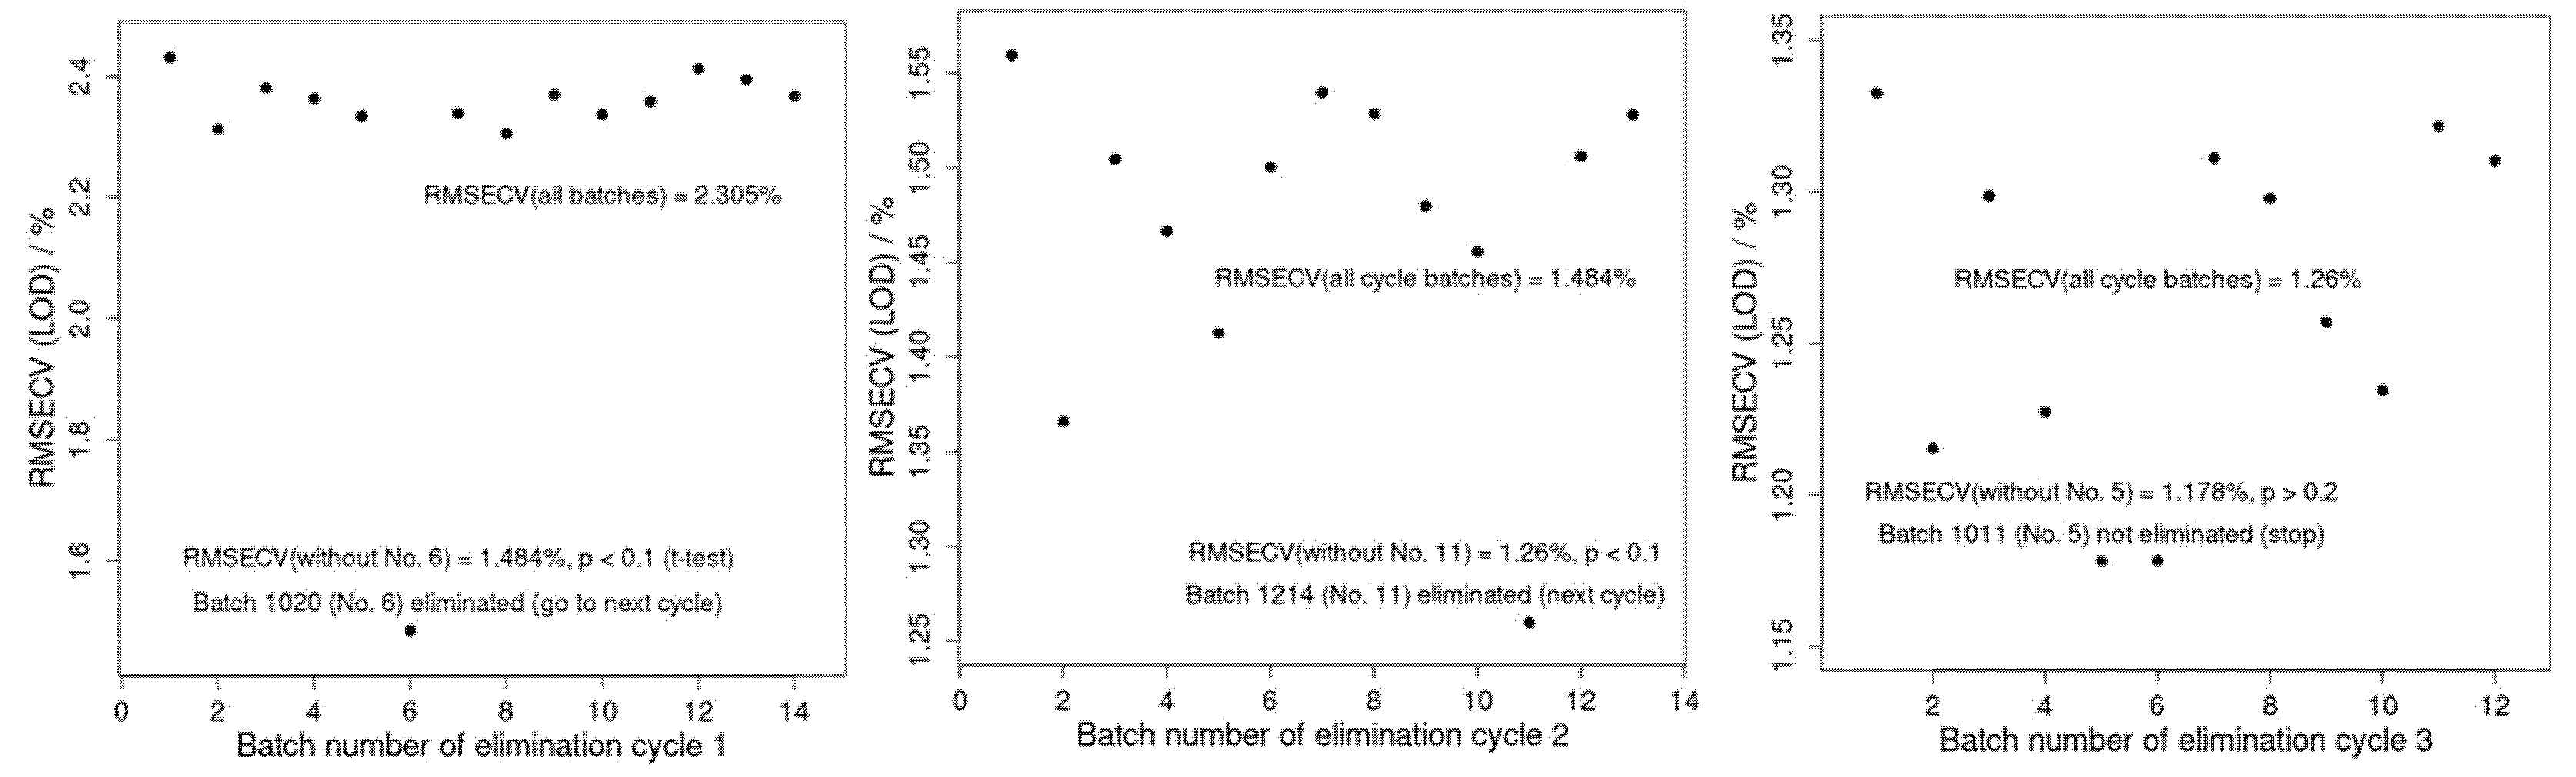
To further prove the outlier batches, the BBE-PLS procedure for predicting LOD values was carried out as described in
Section 2. The results of the BBE-PLS are presented in
Figure 5. It reveals that, based on lower and significant
p-values, both ‘1020’ (
p < 0.1) and ‘1214’ (
p < 0.1) are outlier batches, while other batches are not (
p > 0.2).
As LOD prediction is very important for the FBG process and already well elaborated in many published articles [
6,
7,
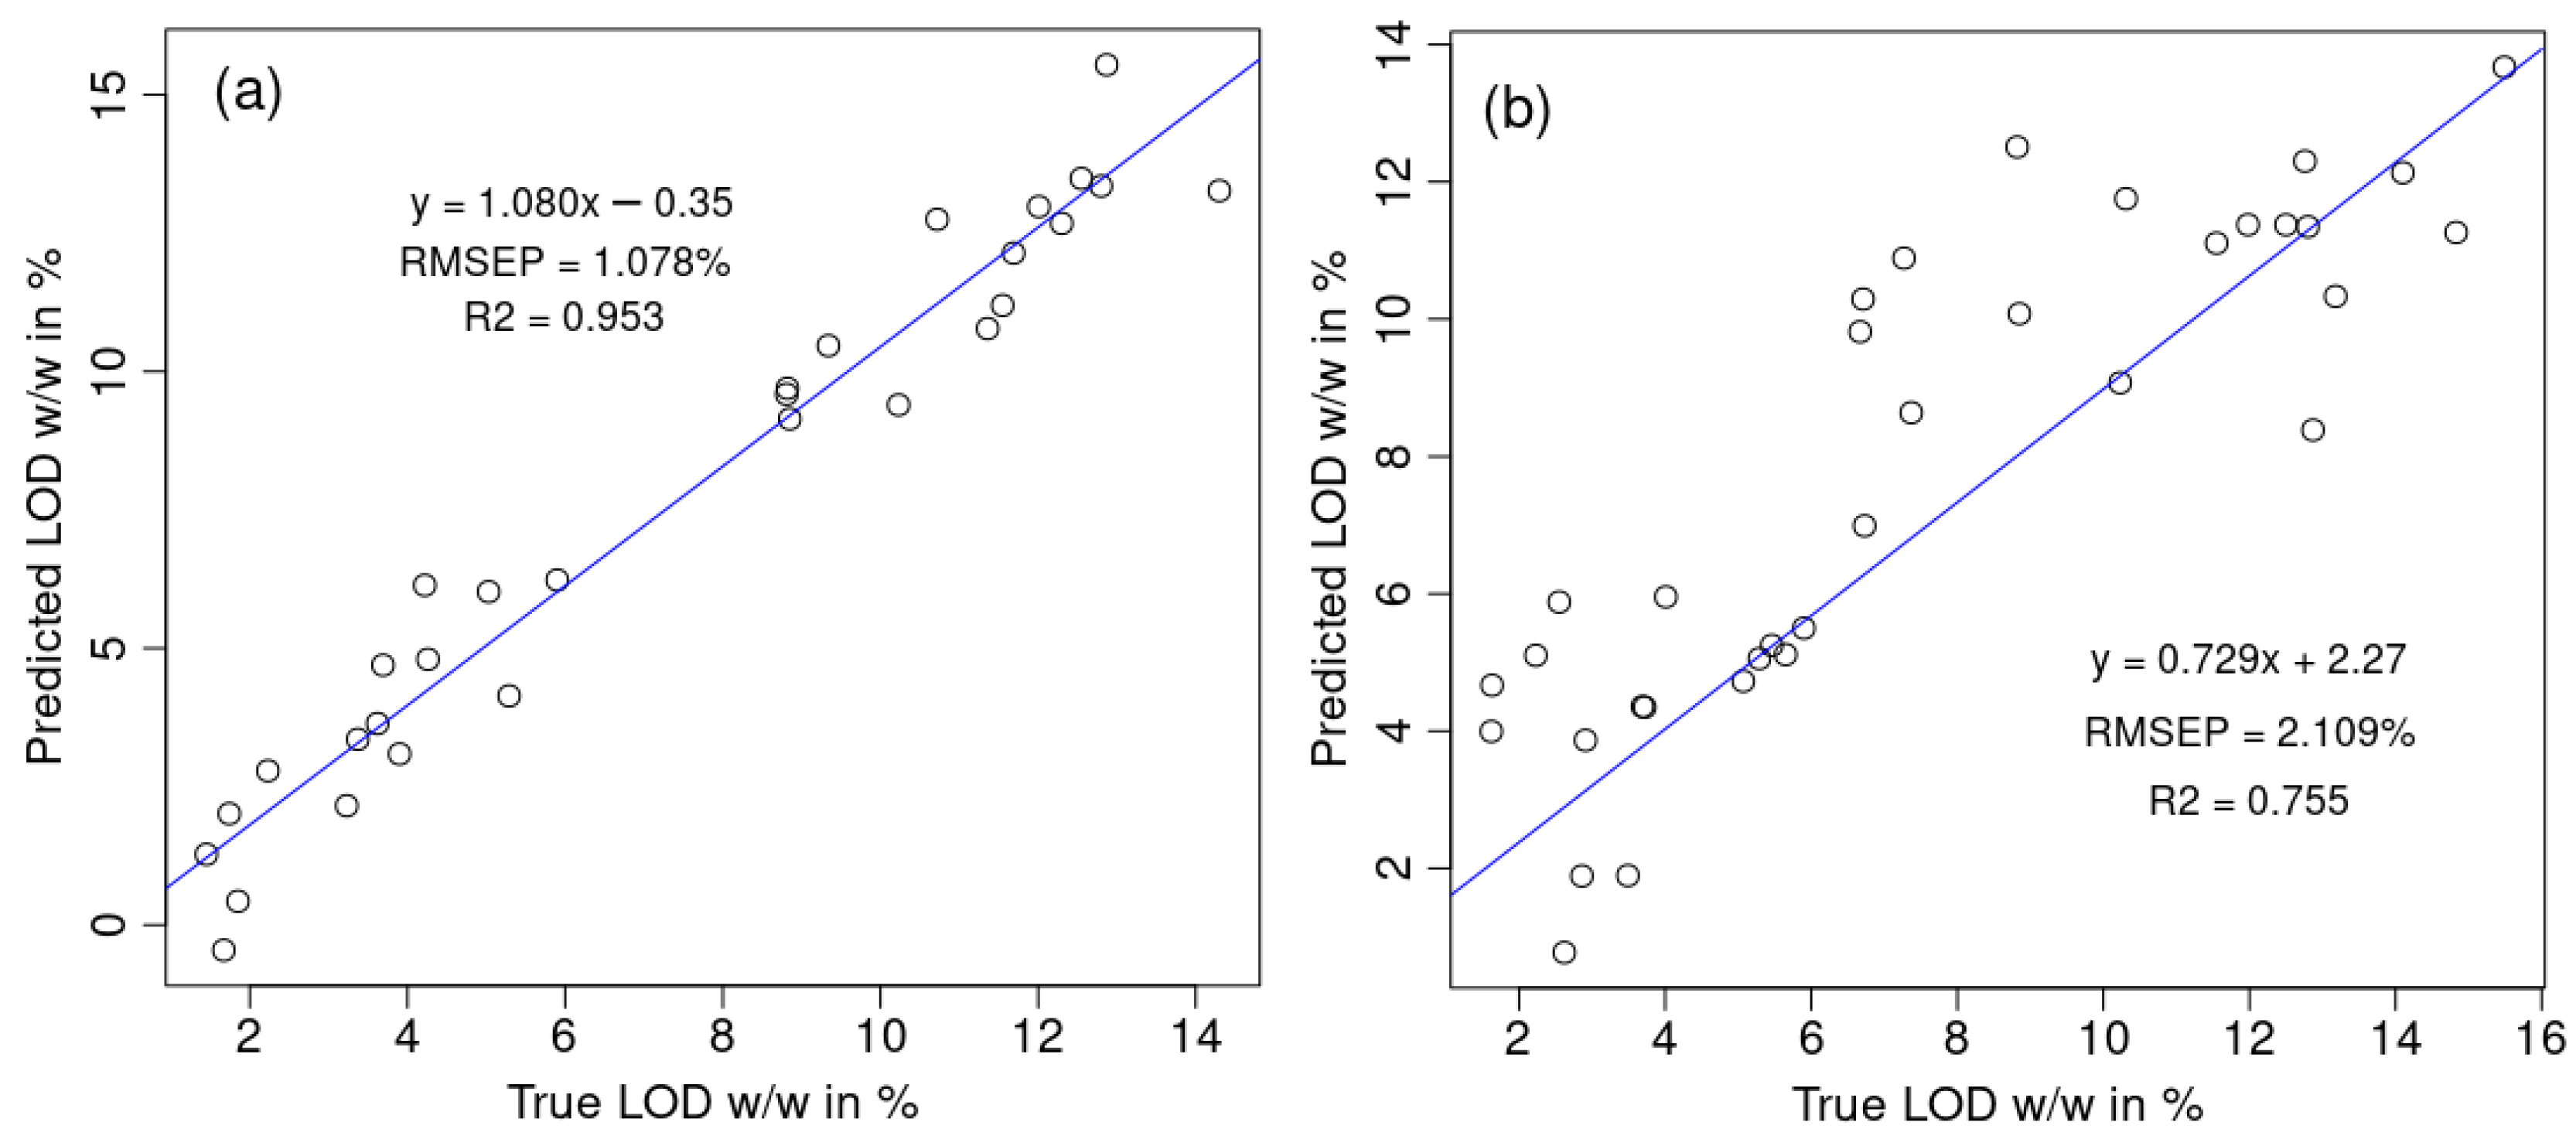
25], this confirms the prior SIMCA-based analyses on outlier/non-outlier batches. Since the moisture level is calculated from the NIR spectra, outlier batches have lower capability for estimating LOD. When the outlier batches are removed, the obtained model performance of the 30 test spectra, RMSEP (LOD) = 1.078% (
Figure 6a), is comparable with the one already obtained in the FBG literature on moisture quantification, RMSEP = 0.877%, of the 13 displayed data points in Figure 5b in Ref. [
3]. Our obtained calibration results for 120 spectra are R2(cal) = 0.936, RMSEC = 1.064, and RMSECV = 1.347, which are again comparable with the calibration results of Ref. [
3]: R2 = 0.943, SEC = 0.999, and SECV = 1.090 for only 28 displayed points in Figure 5a in Ref. [
3]. Our model without outlier batches (
Figure 6a) significantly outperforms the model containing outliers (
Figure 6b).
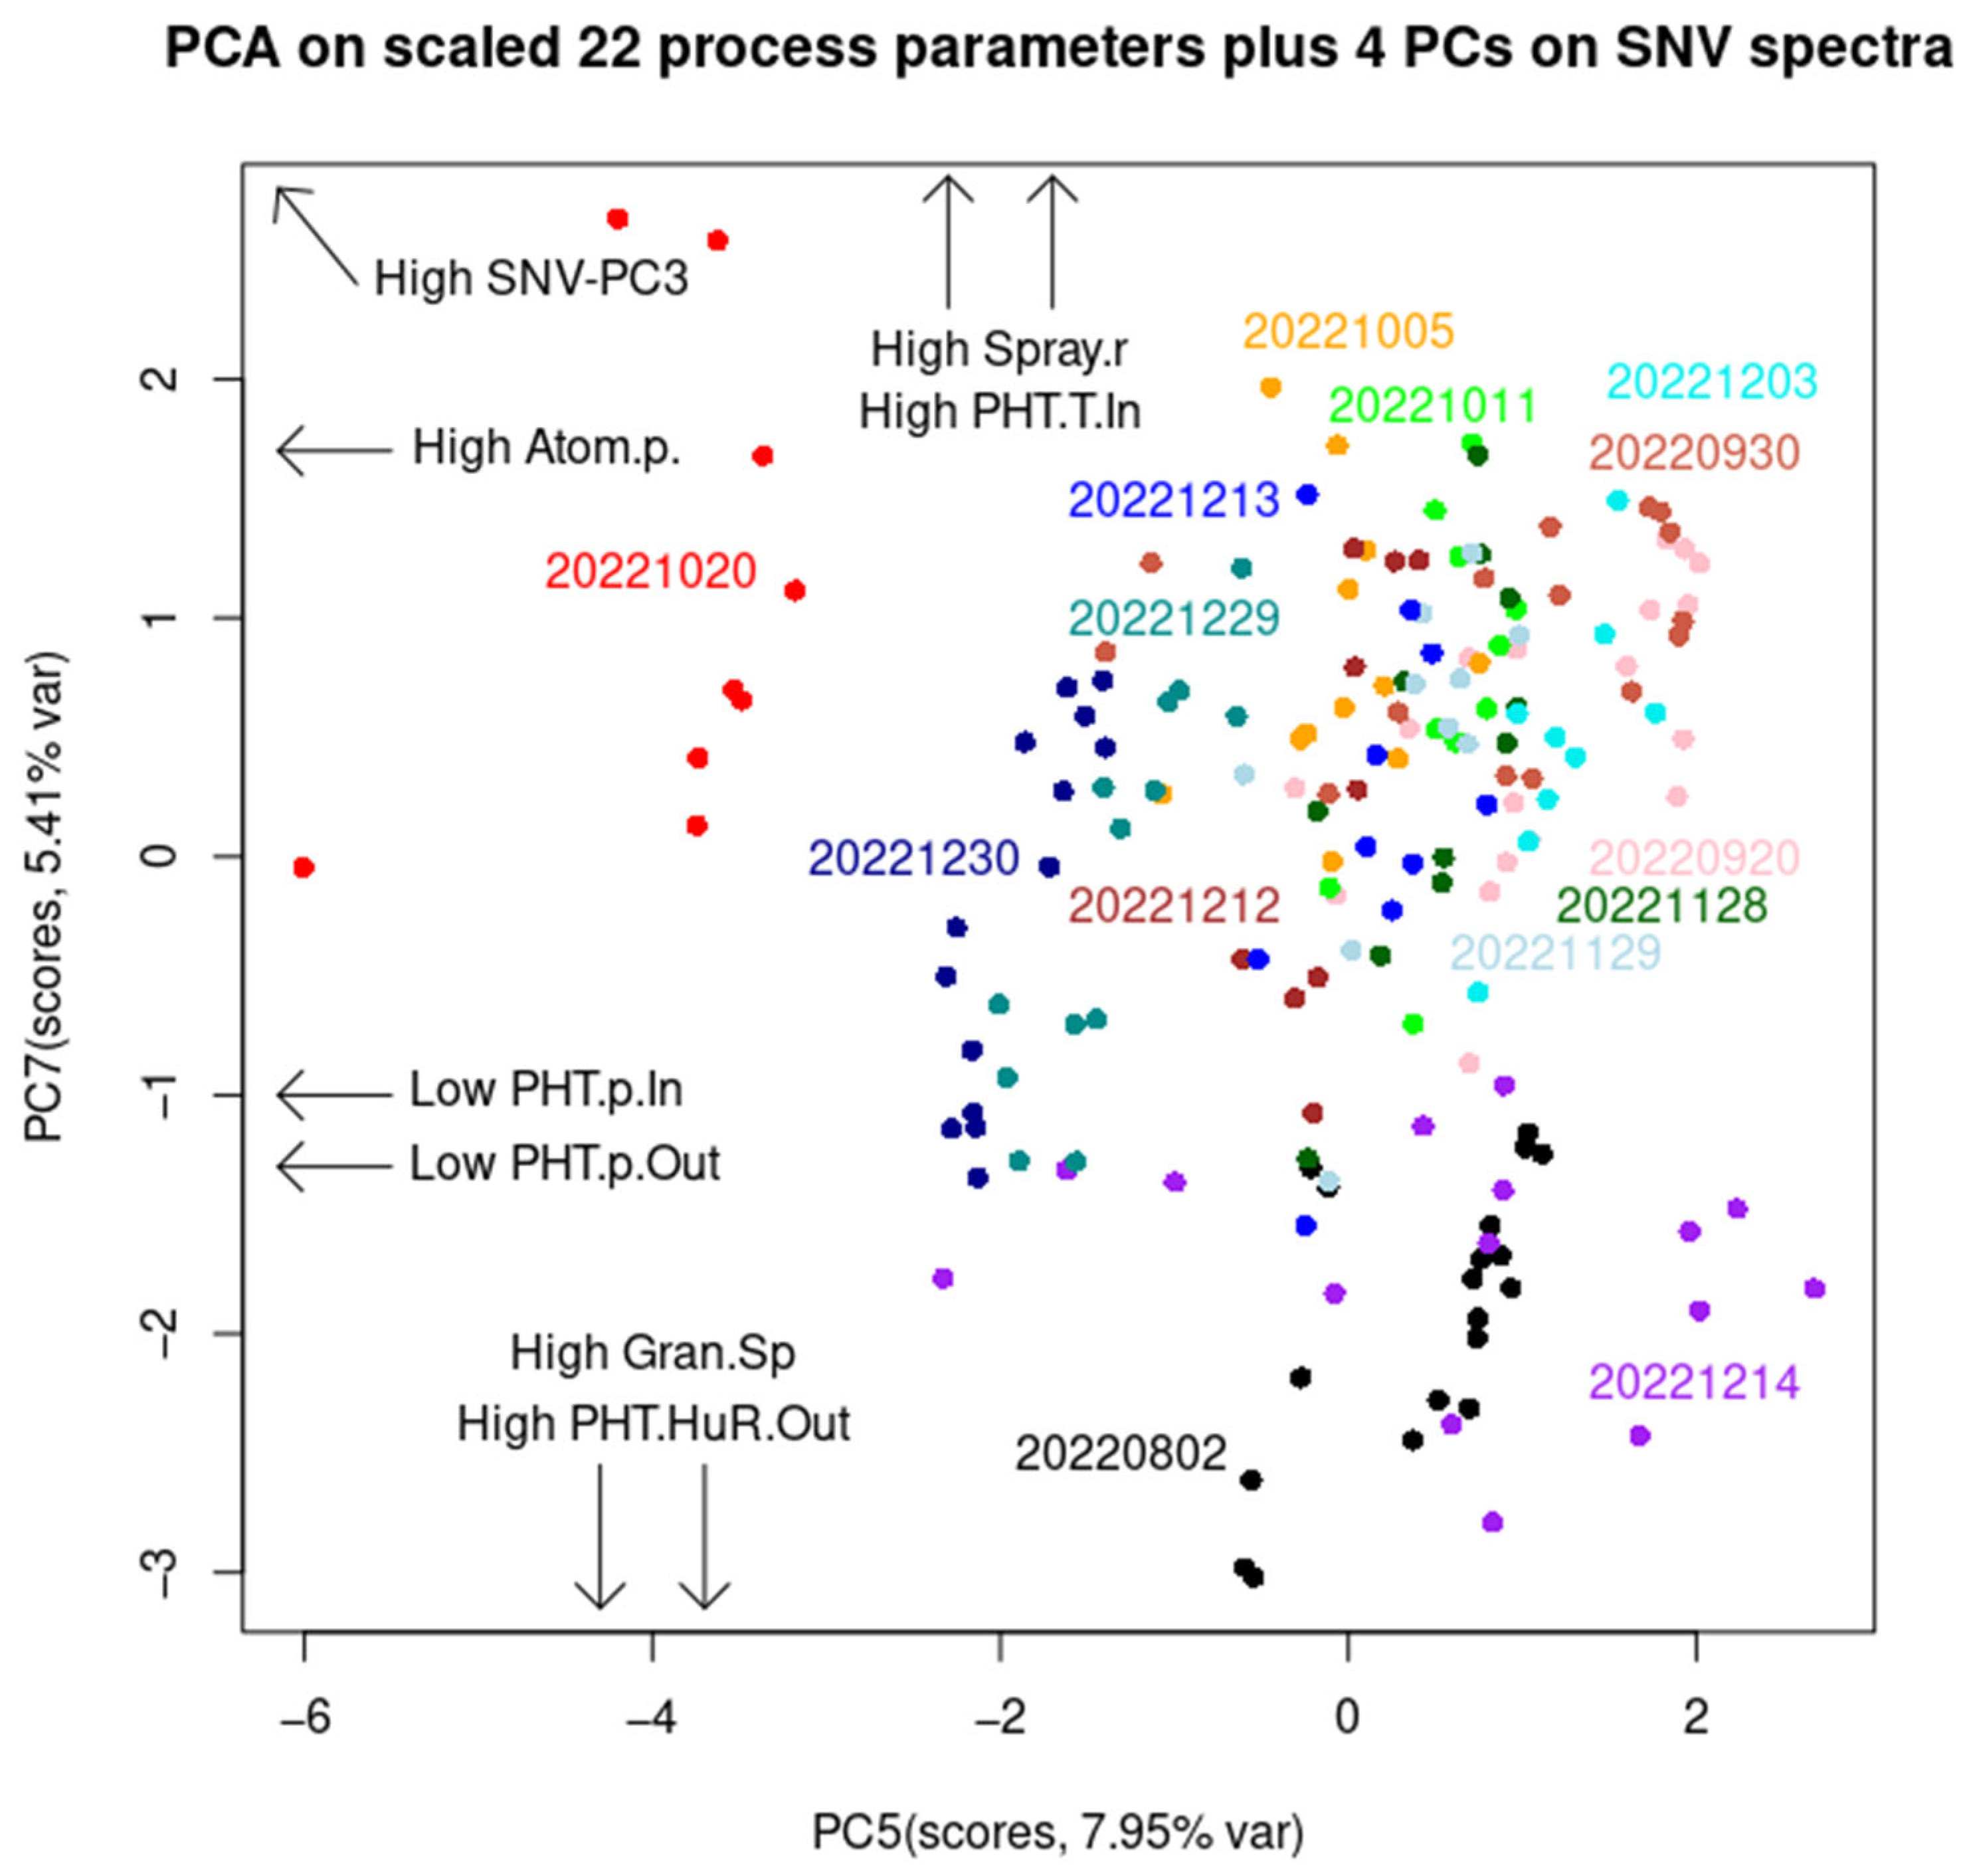
Figure 7 displays a score plot with arrows denoting the direction of certain process parameters. Here, PC5 and PC7, although with only a 13.1% total variance, contribute to discriminating between the batches ‘1020’ and ‘1214’. This is not too unusual, as these two batches contain 24 out of the total 174 LOD measurements, and 24 divided by 174 equals 13.7%. These two batches differ from other batches in many different process parameters and in the opposite way. Concretely (
Figures S3–S7,
Tables S1–S4), batch ‘1020’ has the highest average values for the following process parameters among other batches: LOD, airflow rate, atomization pressure, exhaust air temperature, inlet air temperature, plenum air temperature, product temperature, spray rate, and PHT pressure inlet. All ‘1020’ batch samples have a higher atomization pressure than the rest of the samples in all the other batches. The ‘1020’ batch samples also have the lowest PHT pressure inlet and outlet and the lowest endpoint Dv50 granule size of only 75 μm. On the other hand, batch ‘1214’ has the highest endpoint Dv50 granule size of 511.7 μm, in conjunction with other process parameters of opposite extremes to those in batch ‘1020’ (
Figure 7). For batch ‘1020’, there is no significant correlation between the SNV-PC1, SNV-PC2, and SNV-PC3 scores and any process parameter. In contrast, batch ‘1214’ has a very high positive correlation between SNV-PC1 and the PHT humidity inlet (r = +0.93) and outlet (r = +0.96). SNV-PC1 represents water content, while high SNV-PC3 is followed by a high atomization pressure and spray rate, and a low PHT pressure inlet and outlet. Nevertheless, it is interesting to note that if SPP-PCA is carried out alone (i.e., without the NIR spectra), this analysis would barely classify batch ‘1020’ (
Figure S6) and would not discriminate ‘1214’ from other batches (
Figure S8). However, the PCA on 12 non-outlier batches was able to classify them into four groups: I. batch 0802, II. batch 0930, III. batches 1212, 1213, 1229, and 1230, and IV. the other six batches (
Figures S9 and S10). This is because batch 0802 has the highest average PHT absolute humidity inlet and outlet, and PHT relative humidity inlet, while batch 0930 has the lowest average product temperature and spray rate and the highest average PHT relative humidity outlet. The simple analysis based on airflow rate, inlet air temperature, atomization pressure, and pump speed could not discriminate outliers from non-outlier batches (see
Figure S11). More batch classification information is in the
Supplementary Materials.
3.2. Prediction of Granule Sizes, NIR-PLS vs. NIR + par-PLS Comparison
Table 1 displays the Dv50 parameters for two outlier batches and the average of all non-outlier batches. From the table, it can be seen that the laboratory standard deviation equals 138.6 μm. From that, the residual predictive deviation as the ratio of that deviation to the RMSEP can be easily calculated; this is referred to as RPD (st. dev/RMSEP) in the literature and is expected to be at least 1.75, although excellent models achieve RPD > 3 [
5,
26]. The next observation is that the range between the max and min of Dv50 equals 824.7 − 52.4 = 772.3 μm. This, when divided by the RMSEP, is called the range ratio error (RER, RER = range/RMSEP), which is expected to be >10 [
5]. The laboratory error for the 12 non-outlier batches was calculated as a standard deviation of 12 endpoint Dv50 granule sizes. This was determined to be 70.3 μm. The ratio of RMSEP to that laboratory error (i.e., RMSEP/Lab. error) is called the ratio of the prediction error to the laboratory error (PRL) and is expected to be ≤2 for good models [
5]. Finally, the interquartile distance (difference between the third and the first quartile) was also calculated, and the ratio of that to the RMSEP (i.e., (Q3-Q1)/RMSEP) is called the ratio of performance to the interquartile distance (RPIQ), and very good models have RPIQ > 3 [
26]. In contrast to the Residual Prediction Deviation (RPD), the RPIQ makes no assumptions about the observed value distribution [
27]. RPD, RER, PRL, and RPIQ are important chemometric attributes that standardize the estimate of the model’s prediction performance, contrary to the simple RMSEP value [
27,
28].
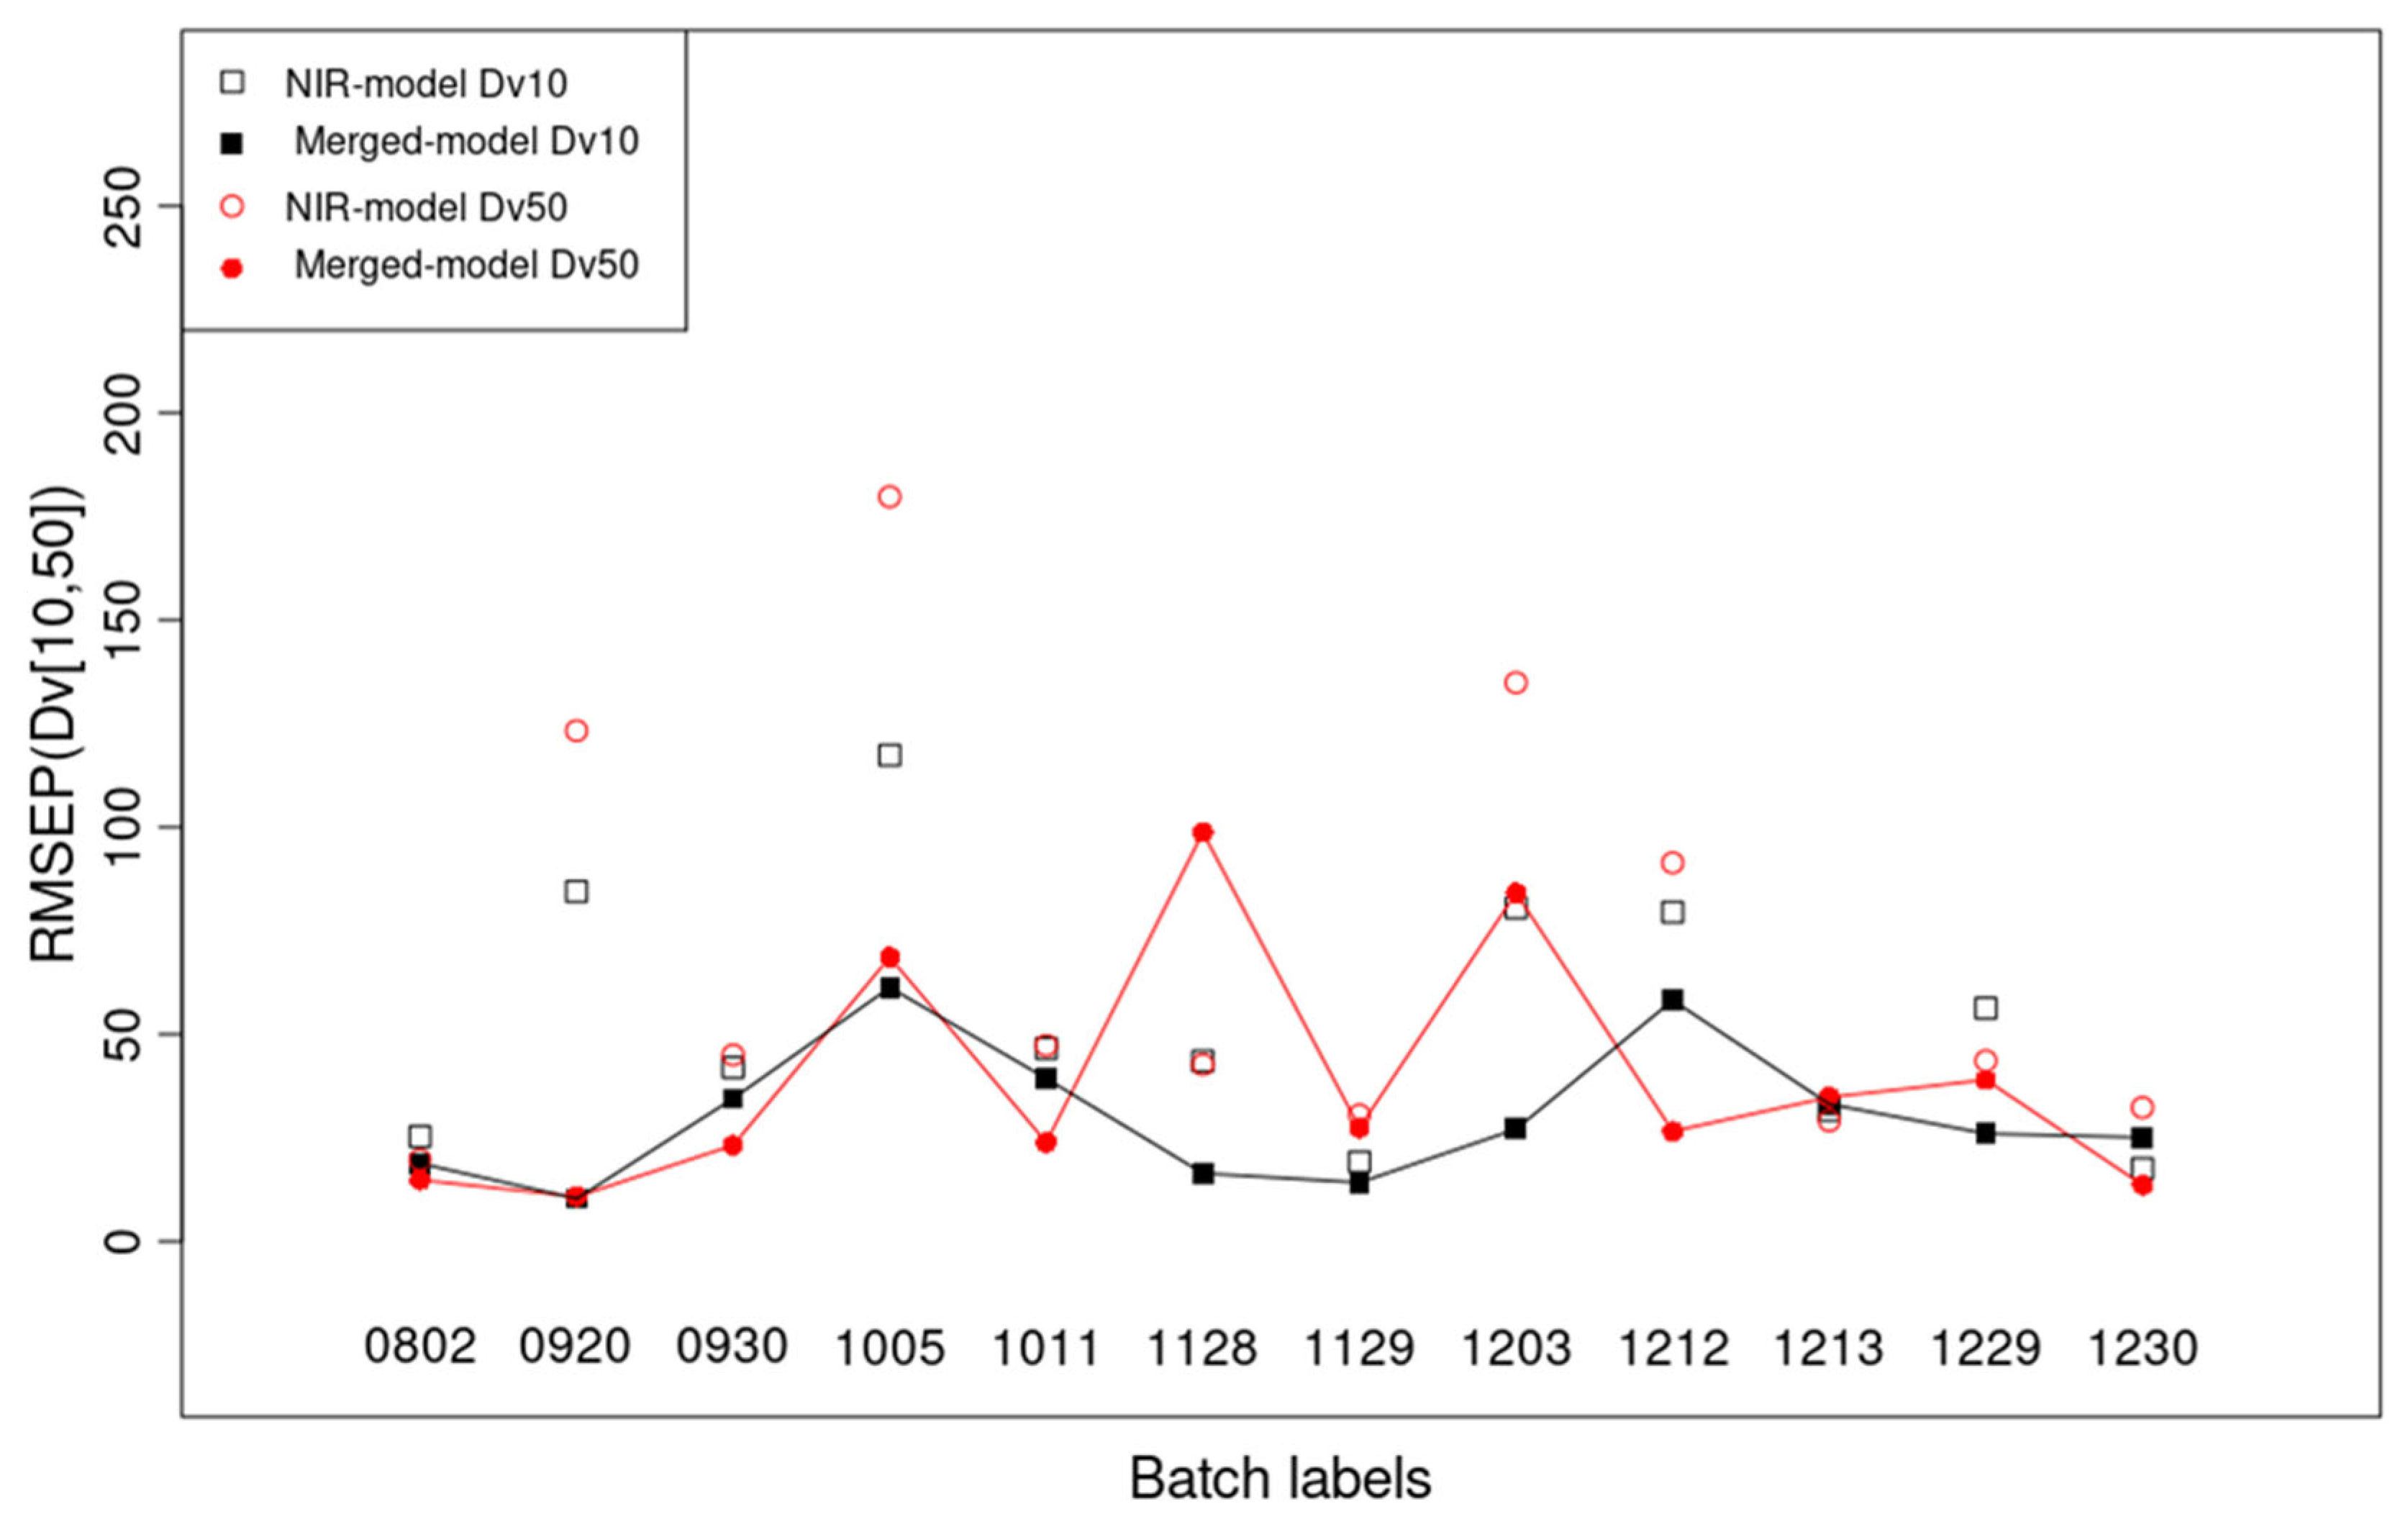
Table 2 and
Table S6 present the results for MA 1, described in
Section 2, regarding the external test set RMSEP. From
Table 2, it can be seen that all three granule-size NIR + pars models outperform the NIR (only) models. The difference between these two models is significant for granule sizes Dv10, Dv25, and Dv50 (
p < 0.05, 1-tailed paired
t-test) (
Table S6). Moreover, if outlier batches ‘1020’ and ‘1214’ are neglected, for all the 12 non-outlier batches, the non-equality RMSEP (Dv50) < 100 μm rules for the NIR + pars model (
Figure 8,
Table S6). For the outlier batches, in almost all cases (except for D10 and Dv25 of the NIR + pars model), RMSEP > 100 μm, with RMSEP > 200 μm for Dv75 and Dv90. This means that using Dv50, Dv75, and Dv90 prediction statistics, outlier batches can be recognized during the inline recording of the last 10% of data, using the first 90% of data in MA 1, without the necessity of using any other batches for prediction. Worse prediction statistics for outlier batches coincide with the batch outlier detection detailed in the prior subsection. This novel information is important for future inline batch outlier detection in the FBG.
When the external test results in
Table 2 and
Table S6 are compared with those of the internal test (
Table S7,
Figure 2), the difference is prominent. The validation of 1/10 of the internal test data revealed much lower RMSEP values (
Table S7), and the internal RMSEP highly agrees with the RMSECV of the training data (e.g., for NIR + pars-PLS with outliers, RMSECV (Dv50) = 19.7 μm, RMSEP (Dv50, internal test) = 19.3 μm). At the same time, there are no signs of overfitting, as the RMSECV/RMSEC ratio is 1.0 (
Tables S8 and S9). This means that RMSEP for the internal test set cannot be simply used as an estimate of error for the endpoint granule size prediction (i.e., the last 10% data), as obviously, such an internal test set is too different from an external test set. This must be emphasized, as the internal and external test sets defined in
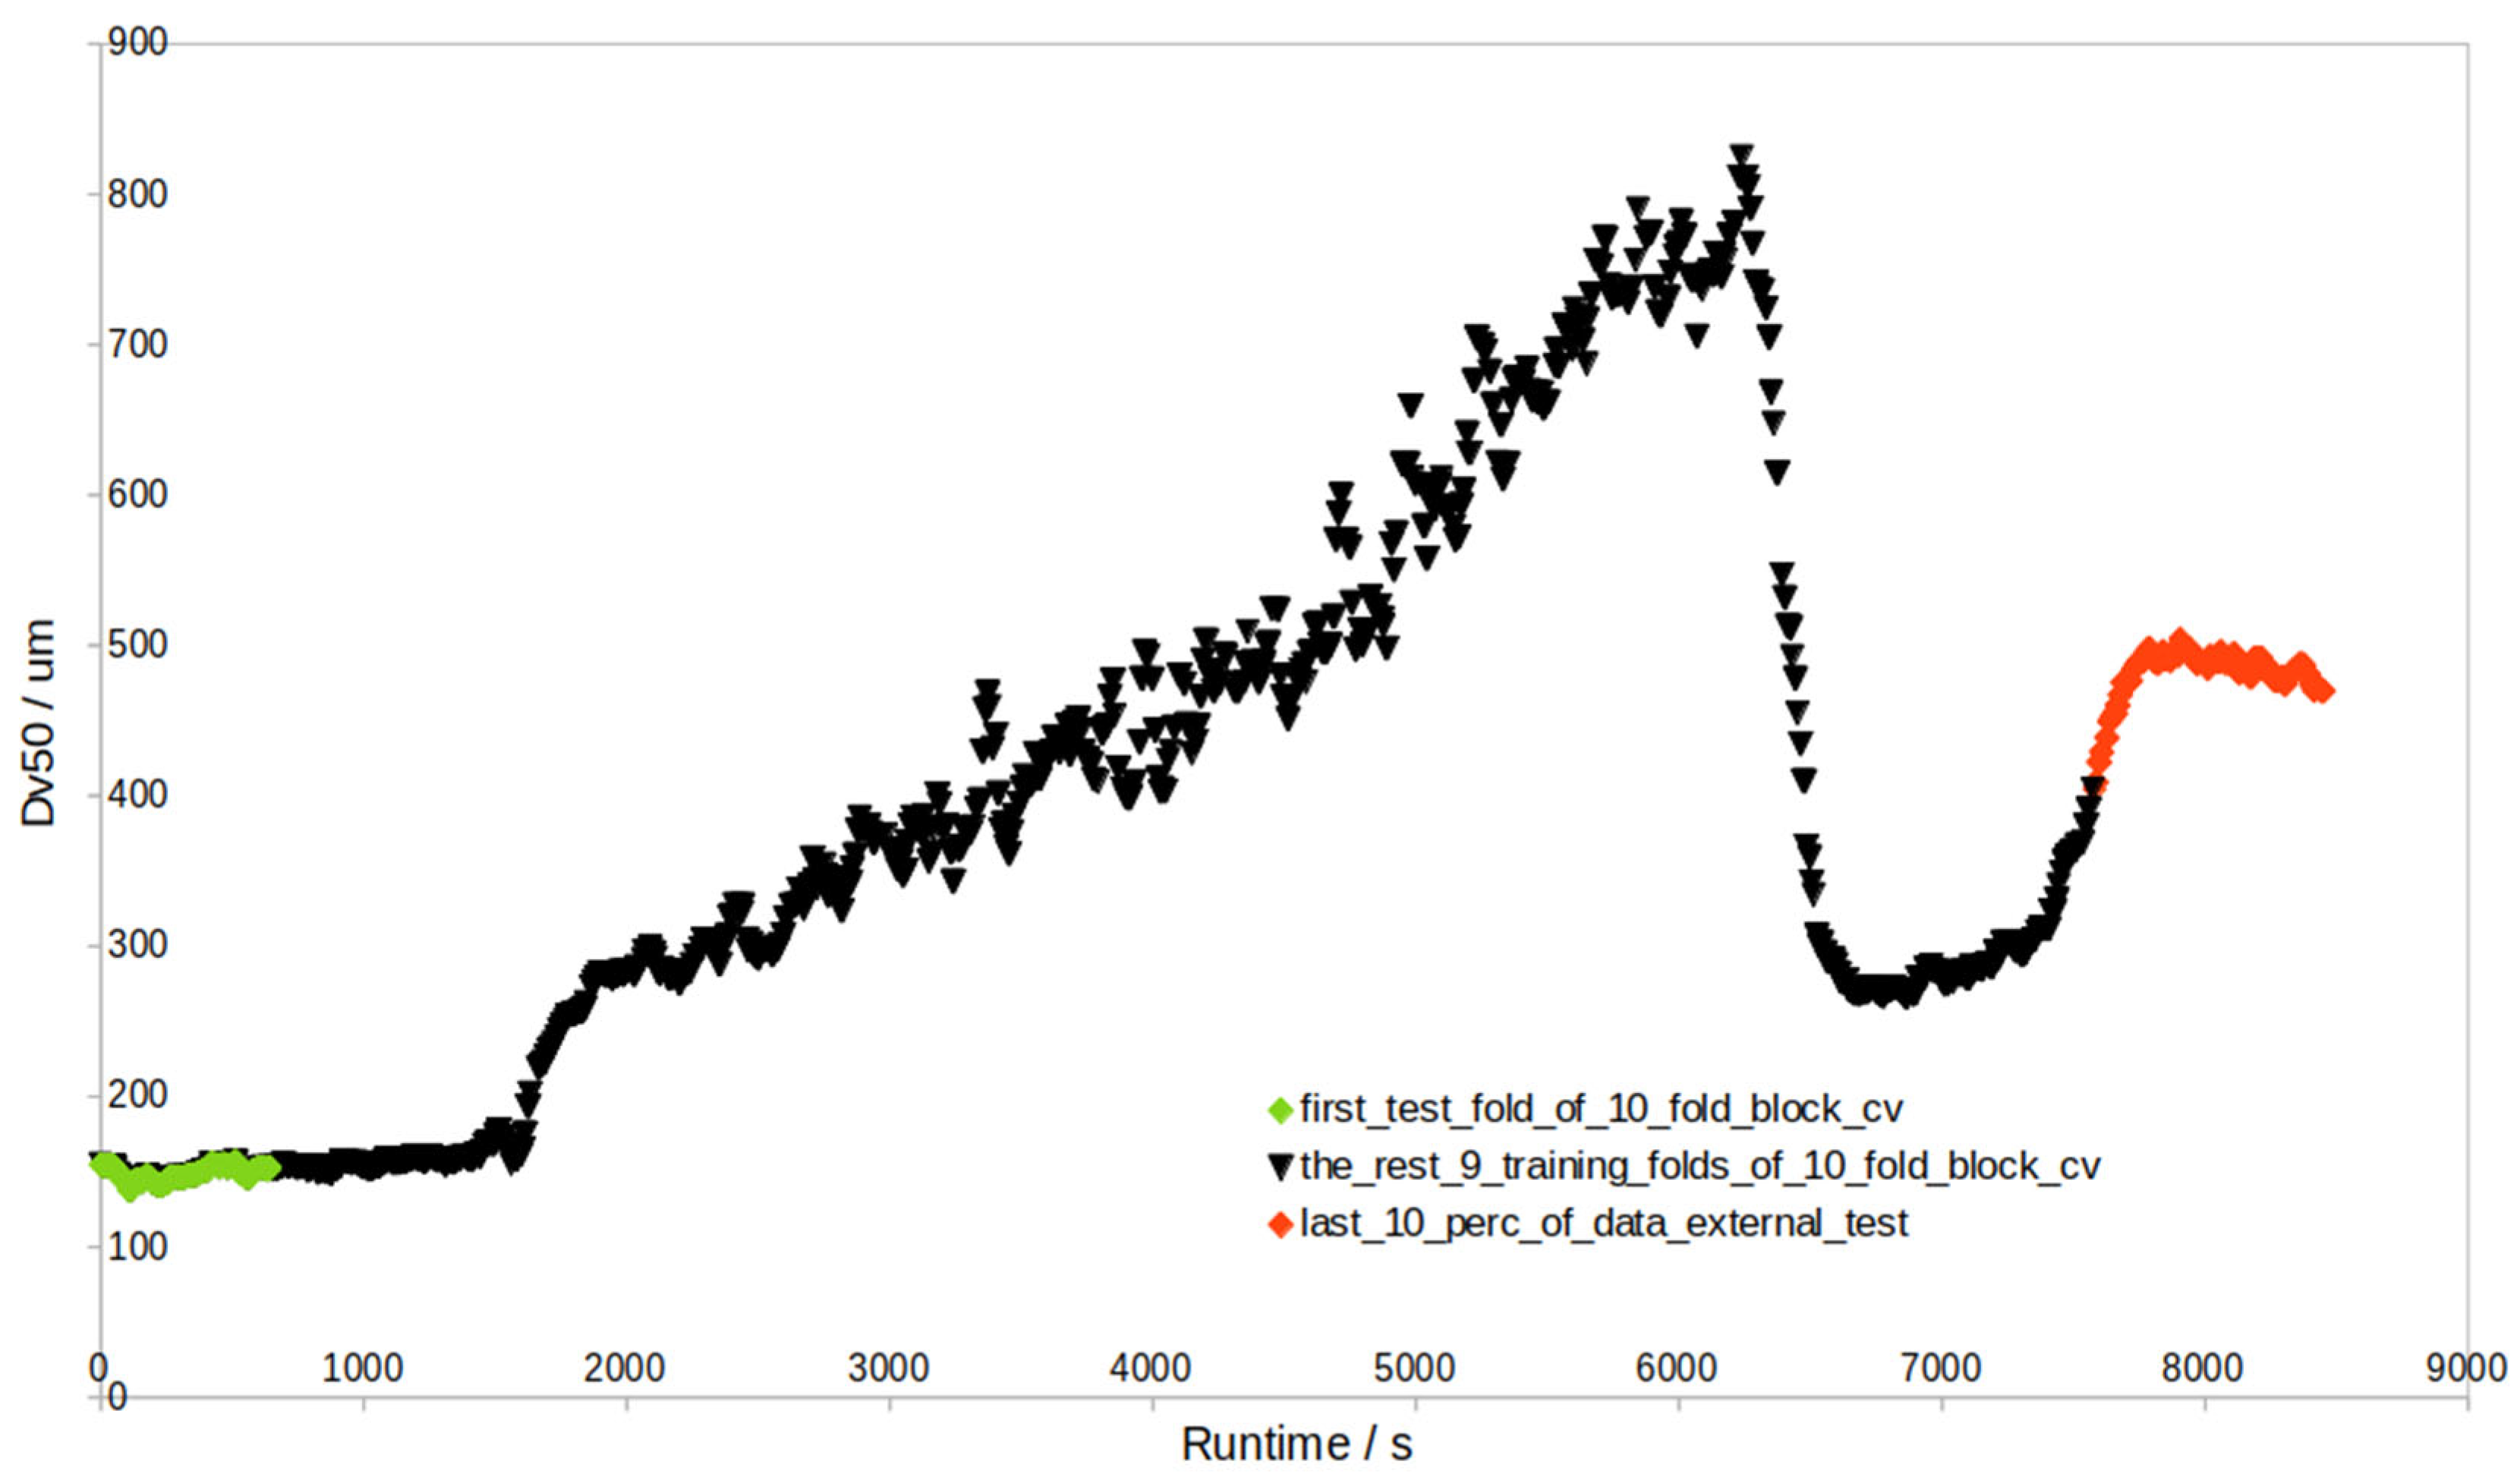
Figure 2 have different levels of prediction difficulty. The literature on granule size prediction has not yet made any such clear distinction. This issue can be resolved by replacing the sequential-CV approach (
Figure 2) with a block-CV approach (
Figure 9,
Table S10), as the obtained RMSECV (average Dv50 = 34.7 μm) with block-CV can roughly estimate the average RMSEP of the external test set (average Dv50 = 38.8 μm). However, the block-CV approach yields RMSECV vs. the number of component plots where either too few or too many PLS components are selected, which leads to PLS models of even worse external RMSEP (average Dv50 = 44.1 μm). This is why sequential-CV, yielding RMSECV plots with a more accurate selection of the number of components, was used most of the time in this study.
With respect to
Table 2, additional prediction models were built that included the spray rate as the 18th independent process parameter variable (see NIR + pars columns in
Table S11). But on average, inclusion of the spray rate slightly worsened the prediction performance for MA 1 and did not have a significant effect for MA 2, which is surprising, as one might expect the opposite, at least in relation to already published articles [
12,
13].
Regarding MA 1-add, which predicted the last 50% of the spray-rate data that equals zero instead of predicting the last 10% of the overall data (see columns labeled ‘50%-l.s.’ in
Table S11), the results show that such an approach might only be recommended if the 50% of the zero spray-rate data comprises less than 10% of the overall data; otherwise, it is better to build prediction models with 90% of the overall data. In short, spray-rate data do not help to improve granule size model prediction performance. The same conclusion is obtained with MA 2, where the results are almost entirely the same as those without the spray-rate variable. The spray rate, in the form of the seven-point moving average, obviously does not contain beneficial information in relation to other process parameters.
Table 3 displays the results of the prediction accuracy for MA 2a, in which three batches are predicted from the nine batches. The presented results once again strongly favor the NIR + pars-PLS model rather than the NIR-PLS model. Here, it can be added that the average Dv50 RMSEP values in
Table 2 and
Table 3 (90.6 μm and 94.8 μm) for the NIR-PLS model seem to roughly coincide with those already published in the literature (Dv50 RMSEP = 97 μm [
5] with a slightly wider Dv50 range, 98–1017 μm). Also, the average CV error obtained here, CV = 71.95 μm, appears to coincide with Ref. [
10] (Dv50 RMSECV = 70.4 μm, with a slightly wider Dv50 range, 48–1052 μm). This means that our benchmark NIR (only) model realistically follows the already published literature on NIR (only) models. The NIR + pars-PLS model, being significantly more accurate, contributes to granule size prediction.
Table 4 presents the final results for MA 2b, which again significantly favor the NIR + pars-PLS model. For the NIR + pars-PLS model, RMSECV = 40.92 μm was obtained, which is also a significant improvement compared to both our results and the literature results. The obtained RMSEP values outperform those in the literature [
5]. The obtained average RMSEP (80.1 μm) for the NIR spectra is also not far from the literature (96 μm) value. However, the literature RMSEP of 96 μm was based on internal batch analysis, where all batches were part of both training and test sets. Although Ref. [
5] considered external inline validation, it did not present the corresponding RMSEP for such predictions, only a fragmentary visual relationship between NIR-predicted and some reference PSD values. Ref. [
10] also did not state that the whole independent test batch was NIR-predicted from different training batches.
In that context,
Table 5 presents the final statistics in terms of important standardized attributes (RPD, RER, PRL, and RPIQ—already presented and defined in the first paragraph of
Section 2.6) of our NIR-PLS and NIR + pars-PLS models. These statistical parameters confirm the efficiency of the obtained models in granule size predictions (as is already explained in the first paragraph of this section). For NIR-PLS RPD > 1.75, our study only confirms the results of Ref. [
5], which also obtained RPD > 1.75. However, the NIR-PLS model performed poorly in MA 2 (RPD < 1.75). A similarly weak result for NIR was obtained regarding the RER statistic (<10) for MA 2, while again, our study reconfirms successful inline granule size predictions (RER > 10) for MA 1 [
5]. RPIQ was obtained for NIR-PLS < 3, but for MA 1, there have already been reported values close to 3 for acceptable prediction models [
26]. The NIR + pars-PLS model is a novel methodology, and it obtained very accurate models for MA 1 (RPD > 3, RER > 10, PRL < 2, RPIQ > 3), contrary to NIR-PLS. For MA 2a and 2b, contrary to NIR-PLS, NIR + pars-PLS obtained satisfactory prediction models (RPD > 1.75, RER > 10, and RPIQ > 3 for MA 2a and RPIQ close to 3 for MA 2b). This means that, for the first time, NIR + pars-PLS is capable of predicting whole-batch granule sizes in the potential absence of Eyecon, should all process parameters be provided, and if the batch is determined to be a non-outlier batch.
That the addition of 17 process parameters improves granule size prediction performance was also confirmed by MA 2c (
Table S12). However, the importance of these 17 process parameters is not the same when improving the prediction model. The higher the absolute value of the regression coefficient is, the higher the variable importance. The overall mean for the SNV NIR wavelengths equals 1.86, and the standard deviation (STDEV) is 1.51; so, mean + 2 STDEV = 4.88 margin. Only six wavelengths have an average absolute regression coefficient above that (4.88) margin for MA 2a. These are NIR absorbances at 1934 nm, 2066 nm, 2109 nm, 1896 nm, 1740 nm, and 2069 nm. On the other hand,
Table 6 displays average absolute regression coefficients for 17 process parameters sorted in decreasing order. These process parameter coefficients are much larger than the average wavelength coefficients. The most dominant is the airflow rate. However, one should recall that many NIR wavelengths are mutually highly correlated, so these higher absolute values for the 17 process parameter regression coefficients compared with the average of 256 NIR wavelengths are not so unexpected. But the highest weighting for the airflow rate in the PSD of Dv50 prediction has not yet been reported in the records for FBG processing.
Except for the airflow rate, other important process parameters given in
Table 6 in decreasing order are from runtime to PHT outlet pressure. A significant contribution to the prediction performance from the runtime variable was not an expected result [
15]. The effect of runtime, by repeating MA 1 and MA 2 without the runtime variable (i.e., now with 16 process variables), was further investigated, and the results can be found in
Tables S13–S15. From these
supplementary tables, a short conclusion can be made that it is better to omit runtime in MA1 and include it in MA2. This means that independent batches are better predicted if runtime is incorporated in the prediction model, but for the prediction of the end of the runtime of the granulation process, it is completely redundant within the one-batch MA. The last four process parameters have absolute regression coefficients below the set margin and are less important, but there are only four of them. These are product temperature, PHT inlet pressure, product and filter difference in pressure, and PHT inlet pressure. This is also a surprising result, as product temperature has already been successfully regressed vs. granule size, but in conjunction with process time and without the NIR variables for batch control in the SFV experiments [
15]. The other 13 process parameters are determined to be important for the prediction of granule sizes, with airflow rate, atomizing pressure, and running time being the most important. This information has been previously unknown in literature to the best of our knowledge.
Granule size prediction models built with process parameters only (Pars-only) are already known [
17], so we predicted granule sizes (Dv10, Dv25, Dv50, Dv75, and Dv90) with Pars-only-PLS (17 process parameters) using MA 1 (
Tables S16–S19) and compared the prediction performances with those of the NIR + pars-PLS model (
Tables S6–S9). Except for Dv10, where the difference was insignificant, for all other granule sizes (Dv25-Dv90), NIR + pars significantly outperformed the Pars-only model (
p < 0.05). Regarding MA 2, the comparison in
Tables S20–S22 reveals that for MA 2b, the difference in model performance is, on average, negligible (3.7% relative difference in RMSEP in favor of Pars-only). However, in the case of MA 2a and MA 2c, the average difference is significantly in favor of the NIR + Pars model (in both cases, 12.7% rel. diff. (RMSEP) in favor of NIR + pars). In summary, NIR + pars improves granule size prediction when compared to the Pars-only model.
Apart from (ordinary) PLS, uninformative-variable elimination PLS (UVE-PLS) [
29,
30] was considered, and the selection of the most important and least important variables with UVE-PLS coincided with those of PLS. Regarding accuracy, for UVE-PLS, the obtained RMSEP values in MA 2a are the following for the experiments: RMSEP = 64.03 μm (Exp 1), 81.05 μm (Exp 2), 53.95 (Exp 3), 64.64 μm (Exp 4). The average RMSEP for UVE-PLS = 65.92 μm, which is negligibly better than that of the PLS results (67.21 μm, see
Table 3). UVE-PLS selected fewer variables, instead of 273 (of which 17 were process parameters), for each experiment: 68 variables for Exp. 1 (14 proc. param.), 123 for Exp. 2 (12 proc. param.), 102 for Exp. 3 (13 proc. param.), and 159 for Exp. 4 (15 proc. param.). On average, among the 273 variables, 113 (i.e., (68 + 123 + 102 + 159)/4 = 113) were determined to be important, which is 41%, but among which, on average, 13.5 ((14 + 12 + 13 + 15)/4 = 13.5) process parameters were found to be important, which is 79%. This UVE-PLS procedure on MA 2a therefore confirms the importance of including 17 process parameters when predicting granule sizes, as a larger fraction of spectral (NIR) variables are determined to be unimportant compared with a fraction of the included process parameters in the merged-PLS model. Finally, and on the other hand, relying only on process parameters (by excluding NIR variables) would not build optimal granule size prediction models, as our results also suggest.


 ,
, 
