Article

Quality by Design (QbD)-Based Development of a Self-Nanoemulsifying Drug Delivery System for the Ocular Delivery of Flurbiprofen

Department of Pharmaceutical Engineering, Gyeongsang National University, 33 Dongjin-ro, Jinju 52725, Republic of Korea
*
Author to whom correspondence should be addressed.
Pharmaceutics 2025, 17(5), 629; https://doi.org/10.3390/pharmaceutics17050629
Submission received: 14 April 2025 / Revised: 3 May 2025 / Accepted: 4 May 2025 / Published: 9 May 2025

Abstract

:
Objectives: In this study, Quality by Design (QbD) was used to develop an optimized self-nanoemulsifying drug delivery system (SNEDDS) as an ophthalmic formulation of flurbiprofen (FLU). Using a Box–Behnken design (BBD), an optimal SNEDDS composition was crafted, targeting enhanced corneal permeability and increased bioavailability of the drug. Methods: The levels of each factor(X) were established using a pseudo-ternary diagram, and the Box-Behnken design (BBD) was used to evaluate the components of oil (18.9 mg), surfactant (70.7 mg), and co-surfactant (10.0 mg) to optimize the SNEDDS formulation. The response(Y) considered were particle size, polydispersity index (PDI), transmittance, and stability. Transmission electron microscopy (TEM) and dynamic light scattering (DLS) were used to analyze the particle size and morphology. In vitro and ex vivo diffusion tests were conducted to assess drug flux and permeability. Result: Using a response optimization tool, the values of each X factor were optimized to achieve a small particle size (nm), a low polydispersity index (PDI), and high transmittance (%), resulting in a formulation prepared with 18.9 mg of oil, 70.7 mg of surfactant, and 10.0 mg of co-surfactant. The optimized SNEDDS exhibited a small particle size of 24.89 nm, a minimal PDI of 0.068, and a high transmittance of 74.85%. A transmission electron microscopy (TEM) analysis confirmed the presence of uniform spherical nanoemulsion droplets with an observed mean diameter of less than 25 nm, corroborating the dynamic light scattering (DLS) measurements. Furthermore, the SNEDDS demonstrated improved stability under the stress conditions of heating–cooling cycles, with no phase separation, creaming, or caking observed and no differences in its particle size, PDI, or transmittance. In vitro and ex vivo diffusion tests demonstrated that the flux of the optimized SNEDDS (2.723 ± 0.133 mg/cm2, 5.446 ± 0.390 μg/cm2) was about 2.5 and 4 times higher than that of the drug dispersion, and the initial diffusion was faster, which is suitable for the characteristics of eye drops. Conclusions: Therefore, the formulation of a flurbiprofen-loaded SNEDDS (FLU-SNE) was successfully optimized using the QbD approach. The optimized FLU-SNE exhibited excellent stability and enhanced permeability, suggesting its potential effectiveness in treating various ocular inflammations, including uveitis and cystoid macular edema.

1. Introduction

The role of the uvea in human vision is essential because it provides numerous blood vessels that nourish various parts of the eye. Postoperative inflammation is usually characterized by severe inflammation affecting the uvea, and any inflammatory disease that damages the uvea can lead to visual impairments [1]. The topically applied nonsteroidal anti-inflammatory drug (NSAID) flurbiprofen is used as an ocular therapeutic agent for conditions such as acute cystoid macular edema (CME) or uveitis following cataract surgery [2,3,4]. It can also help reduce ocular surgery times by preventing the release of inflammatory mediators in the anterior segment [5]. A significant challenge in delivering therapeutics for ocular diseases is the limited topical absorption of the applied drug, which is primarily because of the impermeable cornea [6,7]. Although poorly water-soluble drugs formulated as eye drops have the advantage of being able to cross the lipophilic cornea, their limited aqueous solubility is a major factor limiting their therapeutic potential because of their low ocular bioavailability [8]. Self-nanoemulsifying drug delivery systems (SNEDDSs) with uniform preconcentrations of oil, surfactants, and co-surfactants have been employed to enhance the solubility of poorly water-soluble drugs by forming o/w nanoemulsions upon dilution [9,10,11,12]. SNEDDSs represent a novel approach that warrants more attention in the ocular field as an advanced in situ generator of a nanoemulsion [13]. An SNEDDS can spontaneously undergo a fine emulsification process in aqueous environments, such as the gastrointestinal tract, even with mild agitation, forming a nano-sized emulsion with a dispersed particle size generally remaining below 200 nm [14]. This small particle size increases the interfacial surface area for drug absorption, which enhances drug permeability [12,15,16]. FLU, a poorly water-soluble anti-inflammatory drug with a carboxyl functional group and a pKa of 4.23, belongs to Class II of the Biopharmaceutics Classification System (BCS) and is characterized by poor water solubility [17]. The objective of this study was to develop an optimal ophthalmic SNEDDS formulation containing FLU with a small particle size, a low PDI, and high transmittance using a Quality by Design (QbD) approach. The levels of oil, surfactant, and co-surfactant were established using a pseudo-ternary phase diagram, and the final formulation was optimized using a Box–Behnken response surface design [9]. SNEDDSs are non-irritating to the eyes, and FLU, Kollisolv MCT 70, Solutol HS 15, and Labrafil M1944 CS, used in FLU-SNE, are safe for the body, are non-irritating, and exhibit low toxicity [18,19,20,21,22,23]. The optimized formulation was subjected to characterization, including particle size, PDI, zeta potential, transmittance, pH, heating–cooling cycle, transmission electron microscopy (TEM), and Franz diffusion cell analyses. The membrane permeabilities of FLU-SNE and a drug dispersion were confirmed through in vitro membrane permeability experiments using cellulose membranes and ex vivo membrane permeability experiments using bovine corneas. To the best of our knowledge, there have been only a few studies on FLU-loaded SNEDDSs, and none of them reported an optimized formulation using QbD. Therefore, this work can be considered a novel contribution to the field of nanotechnological applications. We effectively optimized ophthalmic FLU-SNE by applying a BBD to develop a formulation with enhanced solubility, stability, and bioavailability, demonstrating the reproducibility, stability, and high permeability of the optimal formulation [12,16,24].

2. Materials and Methods

2.1. Materials

FLU was provided by Hanmi Pharmaceutical (Seoul, Republic of Korea). A phosphate-buffered saline (PBS) solution (pH 7.4) (WELGENE; Precision Solution, Gyeongsan, Republic of Korea), MCT oil, linseed oil, olive oil, castor oil, cotton seed oil, glycerol, mineral oil, and polysorbate 80 (Tween® 80) were obtained from SAMCHUN GROUP (Daegu, Republic of Korea). Propylene glycol dicaprylate/dicaprate (Labrafac PG), oleoyl macrogolglycerides (Labrafil M2125CS), oleoyl polyoxyl-6 glycerides (Labrafil M1944CS), and propylene glycol monocaprylate (Capryol® 90) were acquired from Gattefosse (St. Priest, France). Sunflower seed oil, polysorbate 20 (Tween® 20), potassium phosphate monobasic, phosphoric acid, and sodium lauryl sulfate (SLS) were acquired from Daejung Chemicals (Siheung, Republic of Korea). Polyoxyl 15 hydroxystearate (Solutol HS 15), polyethoxylated castor oil (Cremophor EL), D-α-tocopheryl polyethylene glycol 1000 succinate (TPGS), polyoxyl 40 hydrogenated castor oil (Cremophor RH 40), Poloxamer 124 (Kollisolv P124), Poloxamer 407 (Kolliphor P407), and Poloxamer 188 (Kolliphor P188) were acquired from BASF (Ludwigshafen, Germany). Acetonitrile was purchased from Thermo Fisher Scientific (Waltham, MA, USA). A 12,400 Da cellulose membrane for a Franz diffusion cell (DHC-6TD, LOGAN Inc., Huntington, WV, USA) dialysis tube was purchased from Spectrum Life Sciences, LLC (SL Science, Hanam, Republic of Korea). The other chemicals used were of the appropriate class for the analysis.

2.2. HPLC Conditions

The HPLC analysis of the FLU samples was conducted using an Agilent 1260 Infinity HPLC system (Agilent Technologies, Santa Clara, CA, USA) equipped with a UV–Vis detector (Aglient G1314 1260, Agilent Technologies, Santa Clara, CA, USA). FLU was separated using a reversed-phase column (VDSpher PUR 100 C18 M-E; 5 μm; 4.6 × 150 mm; VDS optilab, Berlin, Germany). The mobile phase was composed of a solution containing mobile phase A (0.05 M potassium phosphate monobasic solution) and mobile phase B (acetonitrile) in a ratio of 60:40 (v/v). The HPLC analysis was performed at a flow rate of 1.0 mL/min. The injection volume was 10 μL, and UV detection was monitored at 222 nm [15]. Data acquisition and processing were performed using Agilent OpenLAB CDS Chemstation software LC software (Product Version: 2.18.18).

2.3. Solubility Test

We measured the solubility of FLU in various excipients such as oils, 10% (w/v) surfactants, and 10% co-surfactants. We added 10 mg of the drug to 1 mL of each surfactant, co-surfactant, and oil [25,26]. The solution containing the drug was mixed using a vortex mixer (VORTEX-2 GENIE, Scientific industries, New York, NY, USA) and stored in a shaking water bath (LSB-045S, Daehan Labtech, Namyangju, Republic of Korea) for 5 days at 37 °C and 50 rpm. The sample was centrifuged at 13,500 rpm for 15 min using a centrifuge (1730R, Gyrozen, Gimpo, Republic of Korea). The supernatant solution was obtained from the mixture, passed through a 0.45 μm syringe filter, and diluted with a mixture of mobile phases A and B. The amount of FLU was analyzed using the HPLC system conditions as described in Section 2.2. The experiments were repeated three times.

2.4. Pseudo-Ternary Phase Diagrams

Solubility test results were obtained to identify self-emulsifying areas under stirring conditions using a pseudo-ternary phase diagram. Based on the solubility test results for FLU, Kollisolv MCT 70, Solutol HS 15, and Labrafil M1944CS were selected as the oil, surfactant, and co-surfactant, respectively. A solution containing 0.2 mL of each composition was added to a beaker containing 200 mL D.W. at a temperature of 37 °C and magnetically stirred [27]. When these mixtures were visually observed, the region forming a nearly transparent and homogeneous emulsion without phase separation was classified as the ‘good’ region, whereas the region forming a turbid emulsion was classified as the ‘bad’ region [28,29,30]. We added 24.2 mg of FLU, equivalent to the commercially available B&L Flurbiprofen Sodium Ophthalmic solution 0.03%®, to the SNEDDS formulation corresponding to the ‘good’ region. The mixture was then stirred to verify the dissolution. We added 0.2 mL of the drug-dissolved SNEDDS to 200 mL of distilled water at a temperature of 37 °C. The nanoemulsion was judged to be a failure if we observed a turbid mixture or no emulsification progress. A pseudo-ternary phase diagram was generated using SigmaPlot v10 (Systat Software Inc., San Jose, CA, USA) and constructed based on the obtained self-emulsification observations.

2.5. Optimization of the FLU-SNE Formulation Using a Box–Behnken Design (BBD) Approach

Based on the ‘good’ area identified in the pseudo-ternary phase diagram described in Section 2.4, the FLU-SNE formulation was optimized using a Box–Behnken design and Minitab19® (Minitab Inc., State College, PA, USA). The X factors were defined as X1 for oil, X2 for surfactant, and X3 for co-surfactant, with each concentration set at three levels: low (−1), medium (0), and high (+1) (Table 1). In total, 15 runs were performed by the software to estimate the error values, including three center points. The amount of FLU was constantly maintained at 2.4 mg for all 15 runs. The types of oil (Kollisolv MCT 70), surfactant (Solutol HS 15), and co-surfactant (Labrafil M1944CS) were consistent for all experiments. Based on the values selected as the good region in the pseudo-ternary phase diagram, the concentration of Kollisolv MCT 70 was set to 10–20 mg, that of Solutol HS 15 to 40–80 mg, and that of Labrafil M1944CS to 10–50 mg. The main effects and interaction effects were checked to confirm the particle size (nm) (Y1), PDI (Y2), zeta potential (mV) (Y3), and transmittance (%) (Y4). An ANOVA was used to assess the significance of each factor and determine the p-values for all responses. The most appropriate models were then selected based on the significant p-values obtained from the R2 analysis for each response variable.

2.6. Response Optimization and Design Space Development

Using the Box–Behnken Design (BBD) of the Response Surface Methodology (RSM), the relationships between the response and multiple X factors were identified. To determine the optimal conditions for the input variables, all responses must be considered simultaneously, which is referred to as a multiresponse problem. To develop the FLU-SNE formulation with the smallest particle size, the lowest PDI, and the highest transmittance, the multiresponse optimization tool in Minitab was used to determine the appropriate values of the X factors. Subsequently, the design space for optimizing the formulation variables was established, defining the range that provides the optimal product characteristics.

2.7. Particle Size and Zeta Potential Analyses

A sample of the optimized FLU-SNE formulation was diluted 10-fold in PBS. The particle size and PDI were determined using a Zetasizer Nano ZS (Malvern Inc., Malvern, UK) at a wavelength of 633 nm and a scattering angle of 173° [10]. The temperature was set to 37 °C. The hydrodynamic diameter was measured in triplicate. Zeta potential measurements were performed using a capillary cell (DTS 1070) and phase analysis light scattering (PALS), and the zeta potential was calculated using Smoluchowski’s equation. Measurements were conducted in triplicate.

2.8. pH Test

A sample of the optimized FLU-SNE formulation was diluted 10-fold in PBS. The pH of the sample was measured at 25 ± 0.5 °C using a pH meter (pH meter S210, Mettler-Toledo, Columbus, OH, USA) with a glass electrode.

2.9. Transmission Electron Microscopy

The morphology and particle size of the dispersed particles of FLU-SNE in a pH 6.8 buffer were analyzed using a transmission electron microscope (Talos L120C, Thermo Fisher Scientific Inc., Waltham, MA, USA). FLU-SNE was diluted 10-fold in PBS, dispensed dropwise onto a carbon-coated TEM grid (FCF200-CU-50, Electron Microscopy Sciences, Inc., Hatfield, PA, USA), and dried for 30 min in a desiccator. The prepared sample was then scanned at an accelerating voltage of 300 kV [26].

2.10. Heating and Cooling Cycles

FLU-SNE was subjected to six cycles of storage at 4 °C (refrigerated) and 40 °C (dry oven) for 48 h [31,32]. The samples were then visually inspected for phase separation, creaming, caking, and aggregation. Changes in the particle size (nm) and PDI were measured using a Zetasizer, and the transmittance (%) was measured using a UV–visible spectrophotometer (UV-1800, SHIMADZU, Kyoto, Japan).

2.11. In Vitro and Ex Vivo Diffusion Tests

The membrane used in the in vitro test was a 12,400 Da cellulose membrane for a Franz diffusion cell dialysis tube [18,29]. The membrane used in the ex vivo test was a bovine cornea [30]. Bovine eyes were collected immediately after slaughter from a local slaughterhouse and transported to the laboratory in PBS at 4 °C. Bovine corneas were carefully excised from the surrounding sclera, washed with 0.9% sodium chloride, and immediately inserted into Franz diffusion cells with the epithelial surface facing the donor and the endothelium facing the receptor [33]. Each membrane was positioned between the two compartments of the individual Franz cells (with spherical joints) so that the corneal epithelium faced the donor compartment containing either the test or control formulation. A drug dispersion was prepared by dispersing FLU in 0.5% carboxymethyl cellulose to a concentration of 242 µg/mL. A drug dispersion of 0.35 mL was used as the control group, whereas the experimental groups used FLU-SNE at a concentration of 242 µg/mL. The receptor compartment was filled with 15 mL of freshly prepared PBS (pH 7.4), and the system was maintained at 32 ± 0.2 °C with continuous stirring. The available diffusion area was 1.77 cm2. Samples were collected from the receptor compartment and replaced with an equal volume of fresh medium at specific time intervals. Samples from the 12,400 Da cellulose membrane were collected at 5-, 15-, 30-, 45-, 60-, 90-, and 120-min intervals, and samples from the bovine cornea were collected at 5-, 20-, 40-, 60-, 90-, 120-, 180-, 240-, 300-, and 360-min intervals [29]. The sample analysis was conducted using an HPLC system. The cumulative drug permeation (Qn) and steady-state flux (Jss) were calculated.
Q n = C n V n
Cumulative drug permeation represents the cumulative amount of a drug transported over time. In the equation, n is the sampling time point, Cn is the drug concentration at that time point, and Vn is the volume of the solution (15.0 mL in this study) at the corresponding time point.
J s s = d Q d t / A
The steady-state flux was calculated using the rate of change in the cumulative drug transport per unit surface area. In the equation, dQ/dt represents the rate of change in the cumulative drug transport per unit of time. A is the effective area for drug permeation (1.77 cm2).

3. Results

3.1. Solubility of FLU

The solubility of FLU was measured in an oil, a surfactant, and a co-surfactant. FLU showed the highest solubility in Kollisolv MCT 70 (8886.3 ± 281.1 μg/mL) (Figure 1). The stability of an emulsion can be increased using surfactants with high HLB values that have a strong affinity for hydrophilic parts and surfactants with low HLB values that have a strong affinity for hydrophobic parts [34]. In this study, we categorized the surfactants according to their HLB values. Solutol HS 15 (9558.7 ± 125.5 μg/mL), which has the highest solubility among surfactants with HLB values above 10, was used as the surfactant. Labrafil M1944CS (39.4 ± 9.6 μg/mL), which has good miscibility among surfactants with HLB values below 10, was used as the co-surfactant.

3.2. Pseudo-Ternary Phase Diagrams

Based on the solubility results in Section 3.1, the selected oil (Kollisolv MCT 70), surfactant (Solutol HS 15), and co-surfactant (Labrafil M1944CS) were used in a pseudo-ternary diagram to visually identify liquid SNEDDS formulations that could spontaneously form in water without phase separation or droplet aggregation. The shaded area in the diagram highlights the formulations with good self-nanoemulsification ability. Regions that displayed effective dispersion and emulsion formation were labeled as ‘good’ and colored gray, whereas regions that showed poor dispersion, agglomeration, or cream formation in oil were labeled as ‘bad’ and colored white (Figure 2) [35]. An analysis of the pseudo-ternary phase diagram showed that improved emulsions were generated when a higher ratio of Solutol HS 15 was used as a surfactant compared with Kollisolv MCT 70. This effect is mentioned in several studies. As the proportion of surfactant increases, the interface of the emulsion becomes more stabilized and condensed [36].

3.3. Optimization of the FLU-SNE Formulation Using a Box–Behnken Design (BBD)

FLU-SNE was optimized using Minitab 19® and a BBD as the DoE (Design of Experiments). The 15 experimental designs included a center point and were used to understand the influence of the independent variables on dependent variables such as the particle size (Y1), PDI (Y2), zeta potential (Y3), and transmittance (Y4) [37]. A smaller particle size increases the interfacial surface area for drug absorption, and a lower PDI value indicates greater uniformity in the particle size distribution of the SNEDDS. The zeta potential represents the absence of globule aggregation in the continuous phase and serves as an indicator of non-coagulation efficiency, and higher transmittance indicates the formation of a transparent microemulsion. Therefore, the four factors are all critical characteristics of an SNEDDS and have a significant impact on ocular permeability [38,39]. Each response was selected to analyze the particle size (Y1), PDI (Y2), zeta potential (Y3), and transmittance (Y4), which are important factors in an SNEDDS. The models were selected based on significant p-values obtained from the ANOVA for each response variable [22,40]. The results obtained from all experiments are presented in Table 2.

3.3.1. Effect of Variables on Particle Size (Y1)

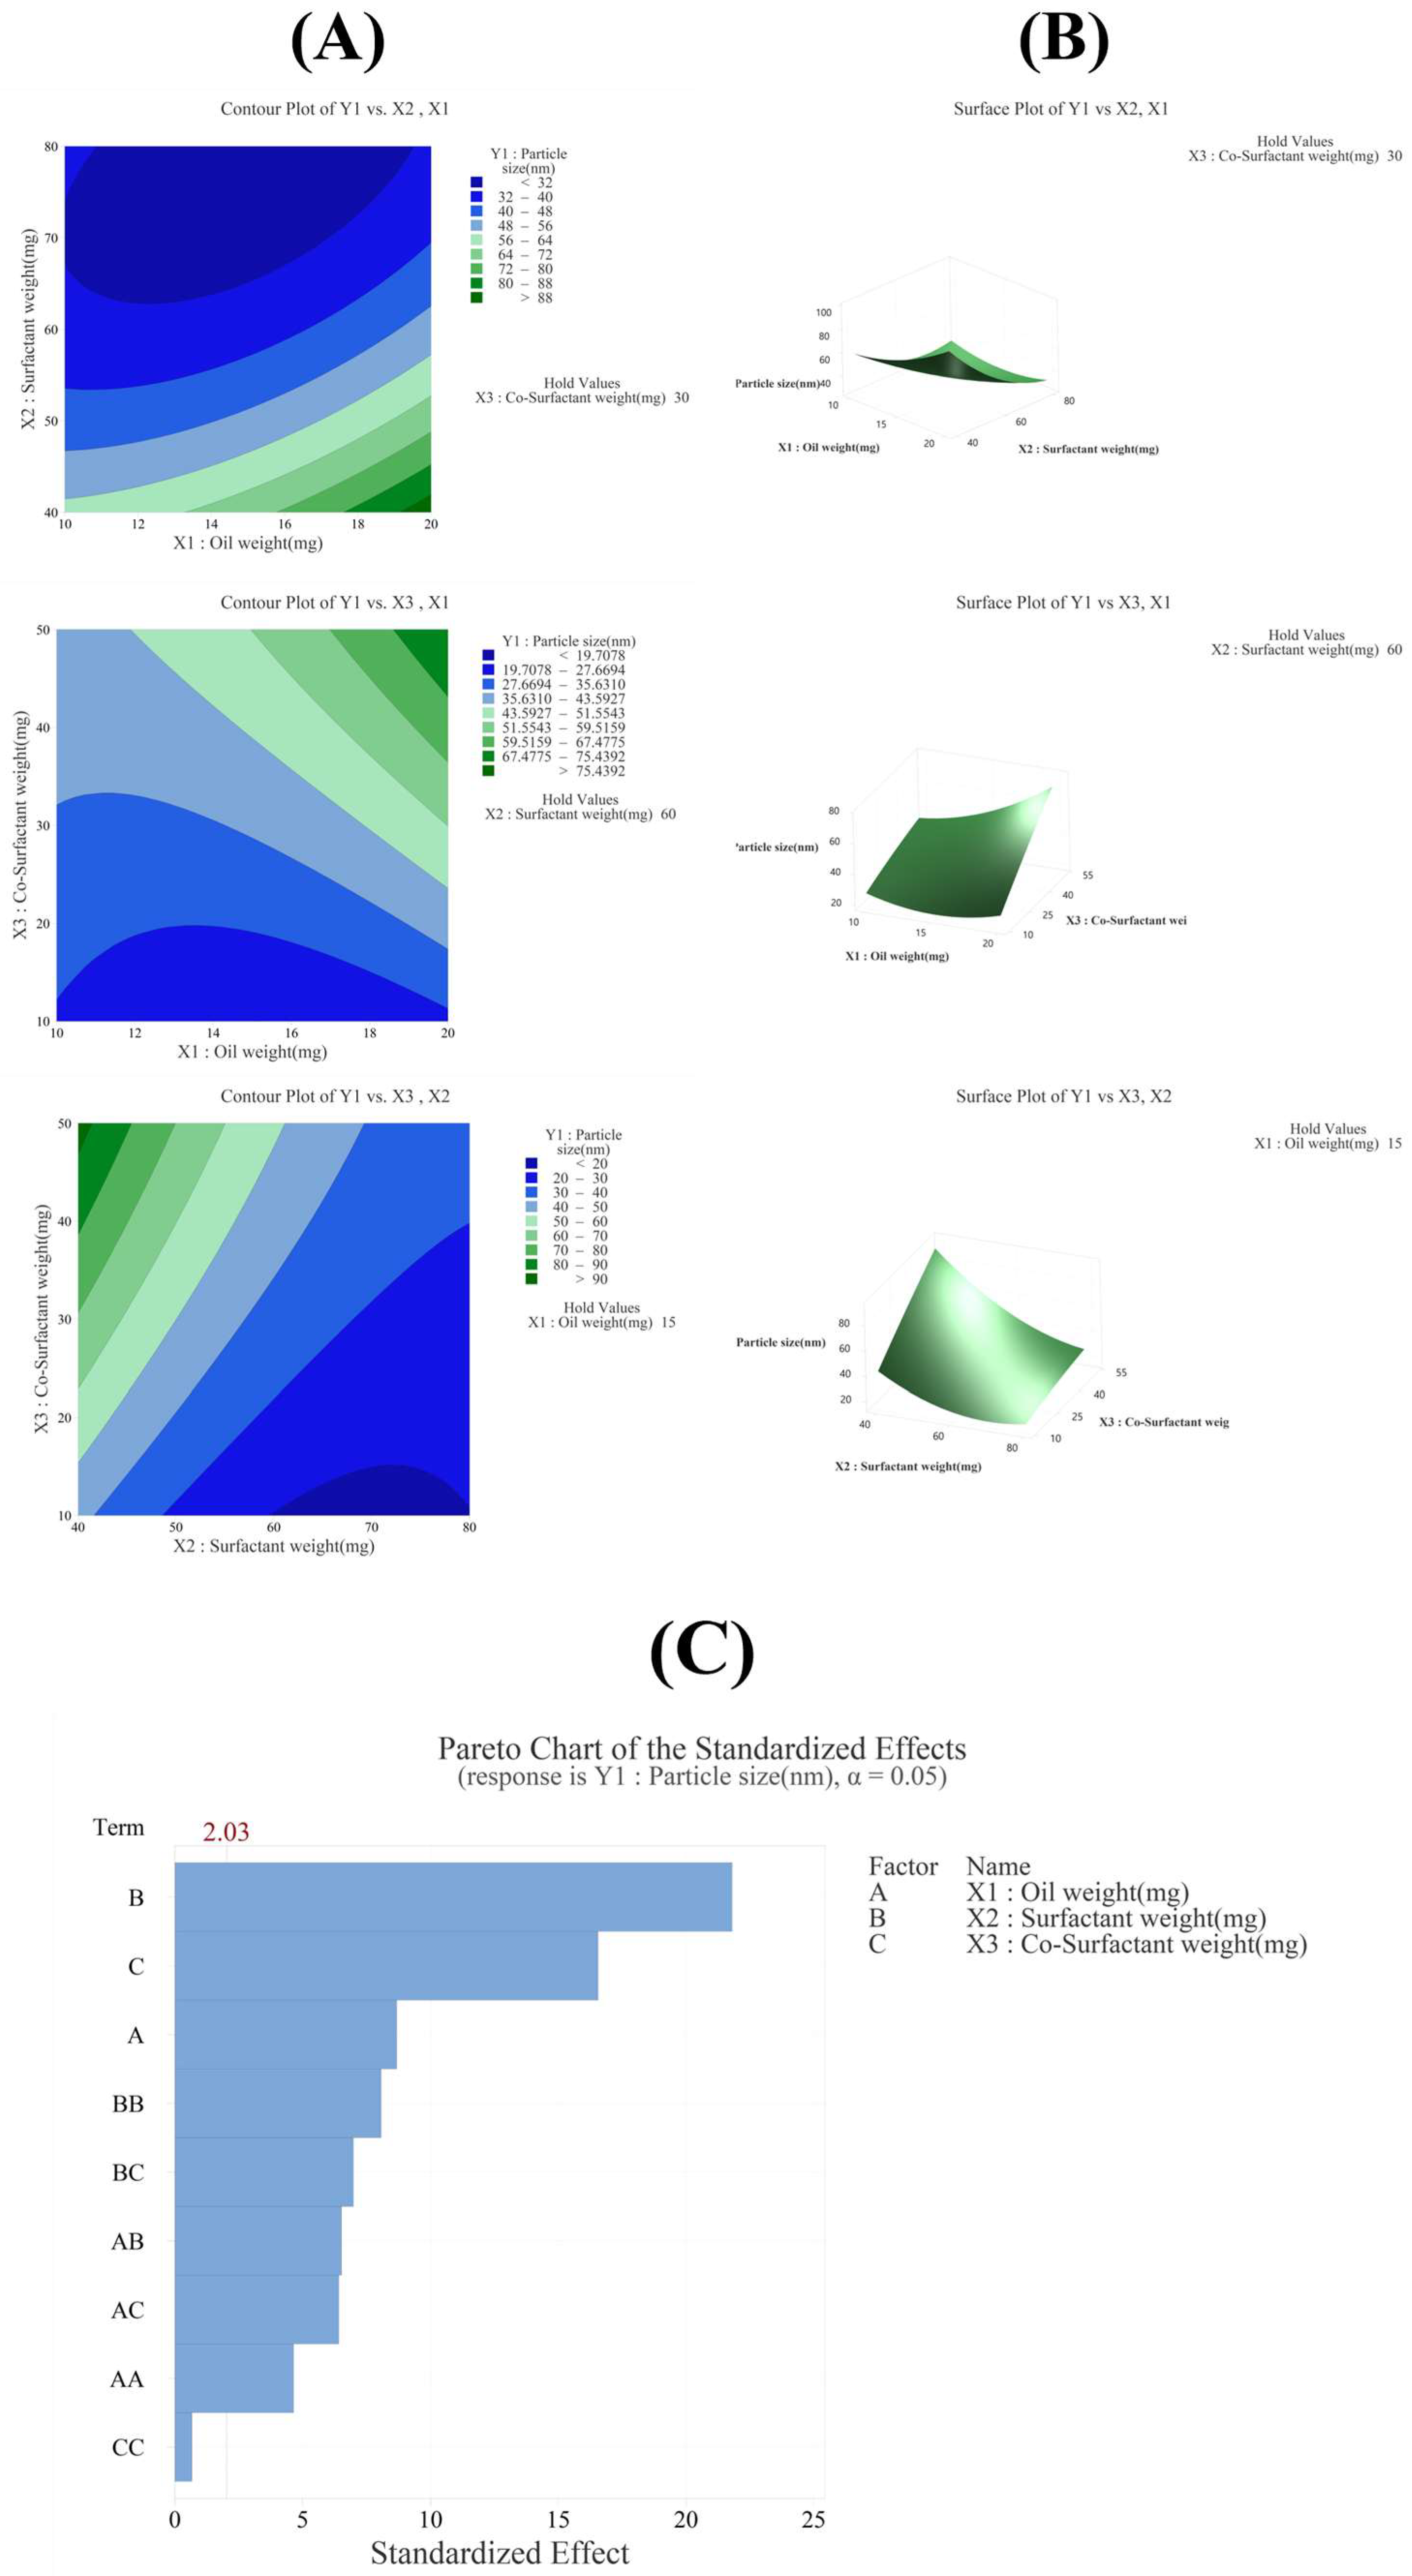
The R2 value in the analysis of variance for particle size (Y1) was 96.75%, indicating a high explanatory power (Table 3). All linear model terms (X1, X2, X3) were significant as their p-values were below 0.05. In the quadratic model, X12 and X22 were also significant with p-values below 0.05, whereas X32 was not significant with a p-value of 0.506. In the 2FI model, all interaction terms (X1X2, X1X3, X2X3) were significant as their p-values were below 0.05. The equation of the model in coded terms is presented as follows:
Y1 (particle size) = 36.66 + 8.38X1 − 21.07X2 + 16.00X3 + 6.60X12 + 11.47X22 − 0.96X32 − 8.91X1X2 + 8.76X1X3 − 9.54X2X3
The X2 factor had the greatest influence on particle size, as confirmed by the Pareto chart in Figure 3C, contour plot and surface plot in Figure 3B, and p-value in Table 3. In addition, the Pareto chart in Figure 3C indicated that factors X2, X3, and X1 influenced particle size, in that order, demonstrating that these three factors contributed significantly to determining the particle size of the SNEDDS [22,23,35,40,41].

3.3.2. Effect of Variables on PDI (Y2)

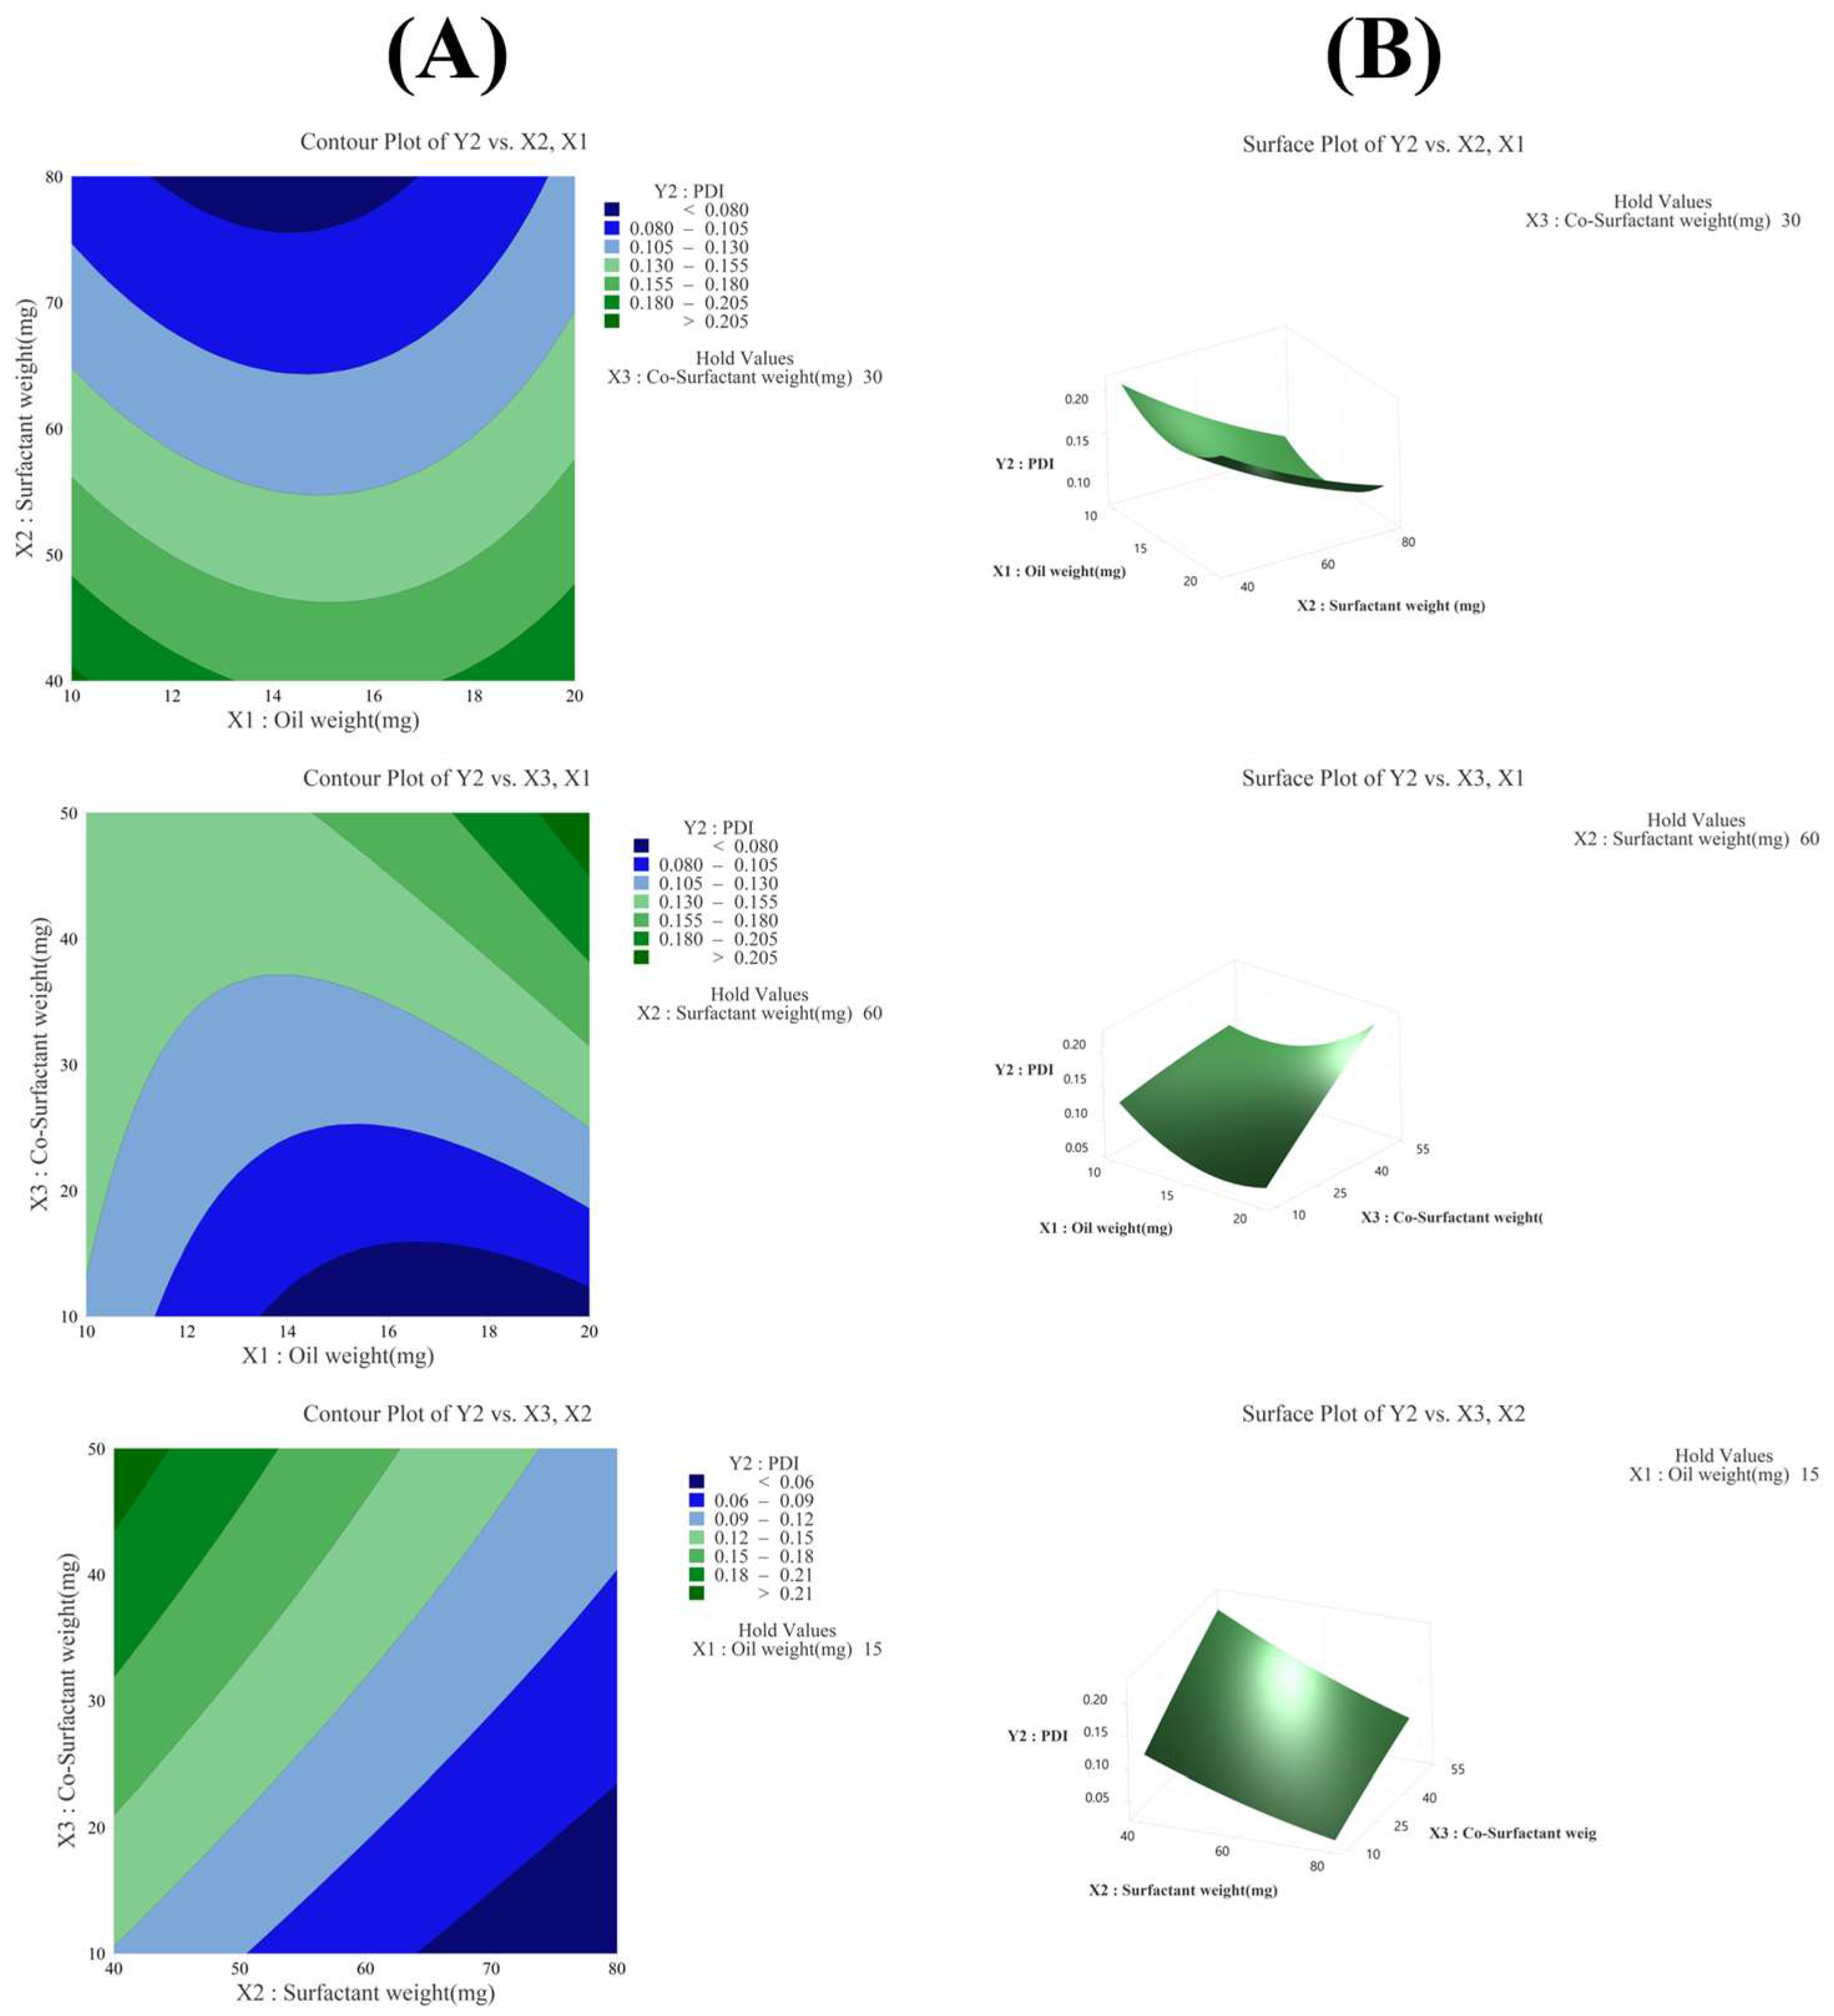
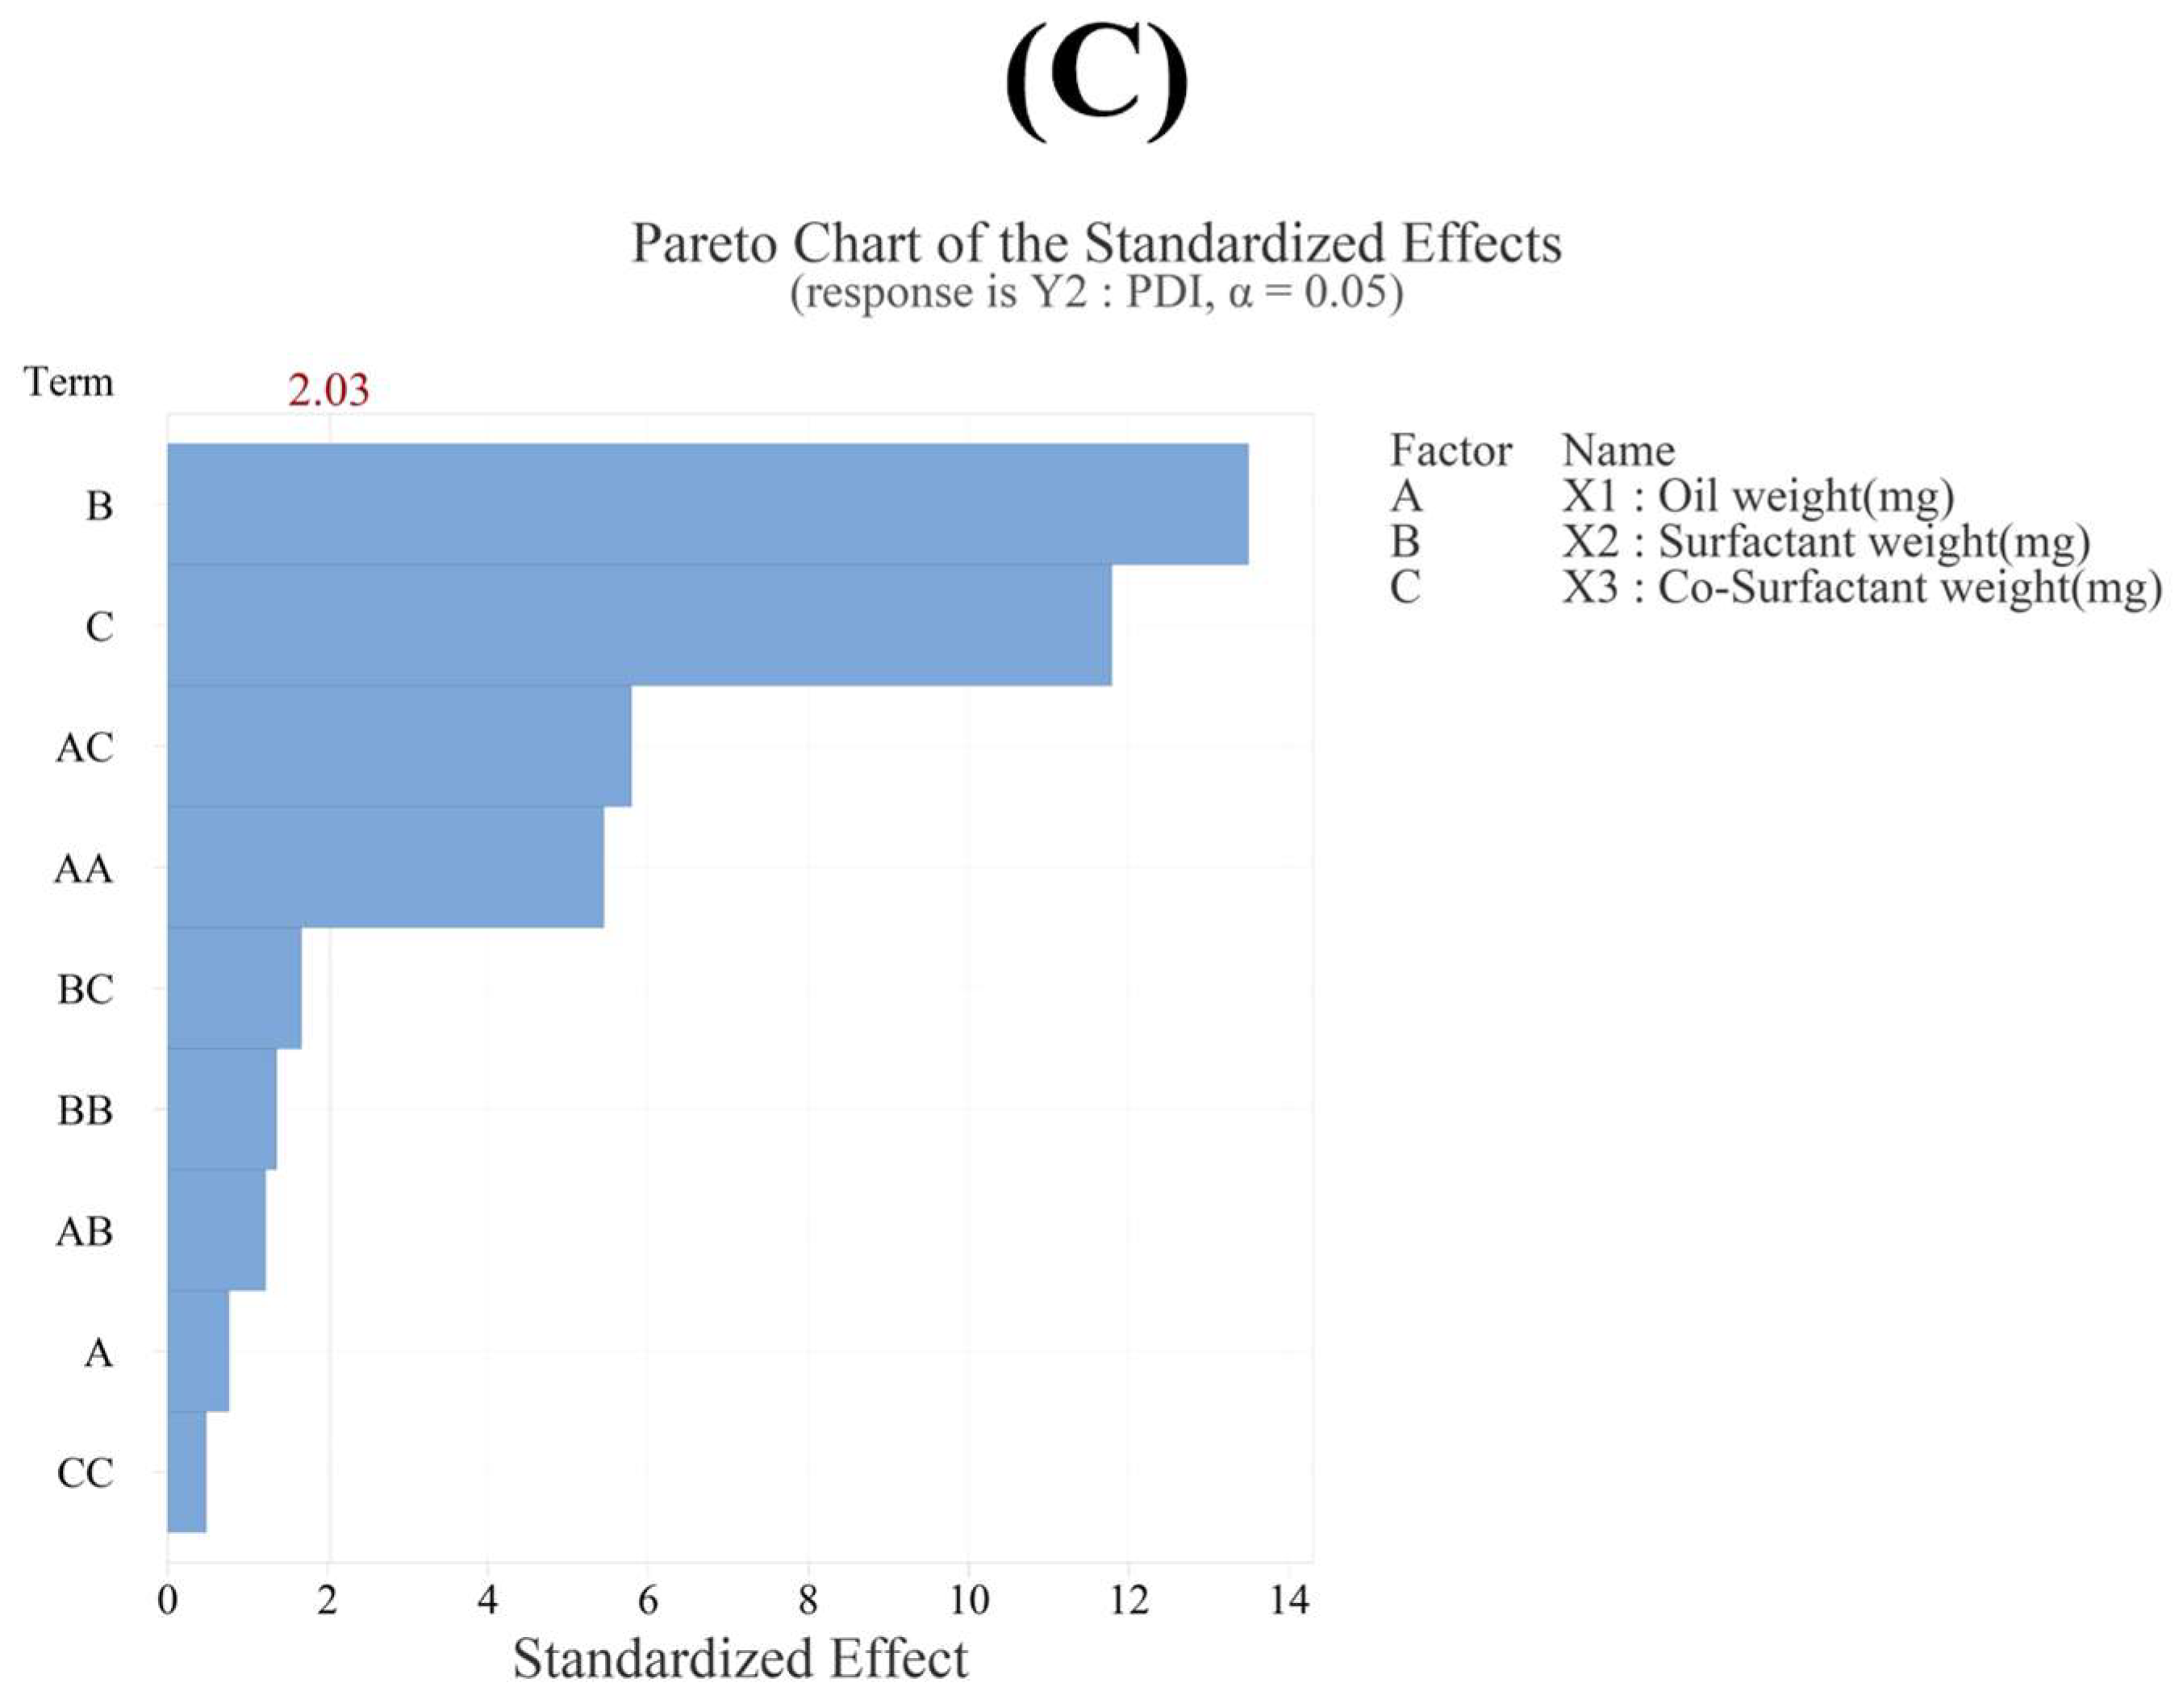
The R2 value in the analysis of variance for the PDI (Y2) was 91.78%, indicating a high explanatory power. In the linear model, X1 was not significant as its p-value was 0.450, whereas X2 and X3 were significant with p-values below 0.05. In the quadratic model, X12 was significant with a p-value below 0.05, but X22 and X32 were not significant, with p-values of 0.182 and 0.634, respectively. In the 2FI model, X1X2 and X2X3 were not significant, with p-values of 0.230 and 0.104, respectively, whereas X1X3 was significant with a p-value below 0.05. The equation of the model in coded terms is presented as follows:
Y2 (PDI) = 0.12 + 0.00X1 − 0.05X2 + 0.04X3 + 0.03X12 + 0.01X22 − 0.00X32 + 0.01X1X2 + 0.03X1X3 − 0.01X2X3
The X2 factor had the greatest influence on the PDI, as confirmed by the Pareto chart in Figure 4C, contour plot and surface plot in Figure 4B, and p-value in Table 4. As shown in the Pareto chart in Figure 4C, it was statistically confirmed that only the factors X2, X3, X1X3, and X12 significantly affected the PDI.

3.3.3. Effect of Variables on Zeta Potential (Y3)

The selected X factors did not have a significant effect on the zeta potential (Y3) values, resulting in a low R2 value of 35.53% in the analysis of variance. Therefore, the zeta potential (Y3) was excluded when optimization tools were used to select the optimized formulation.

3.3.4. Effect of Variables on Transmittance (Y4)

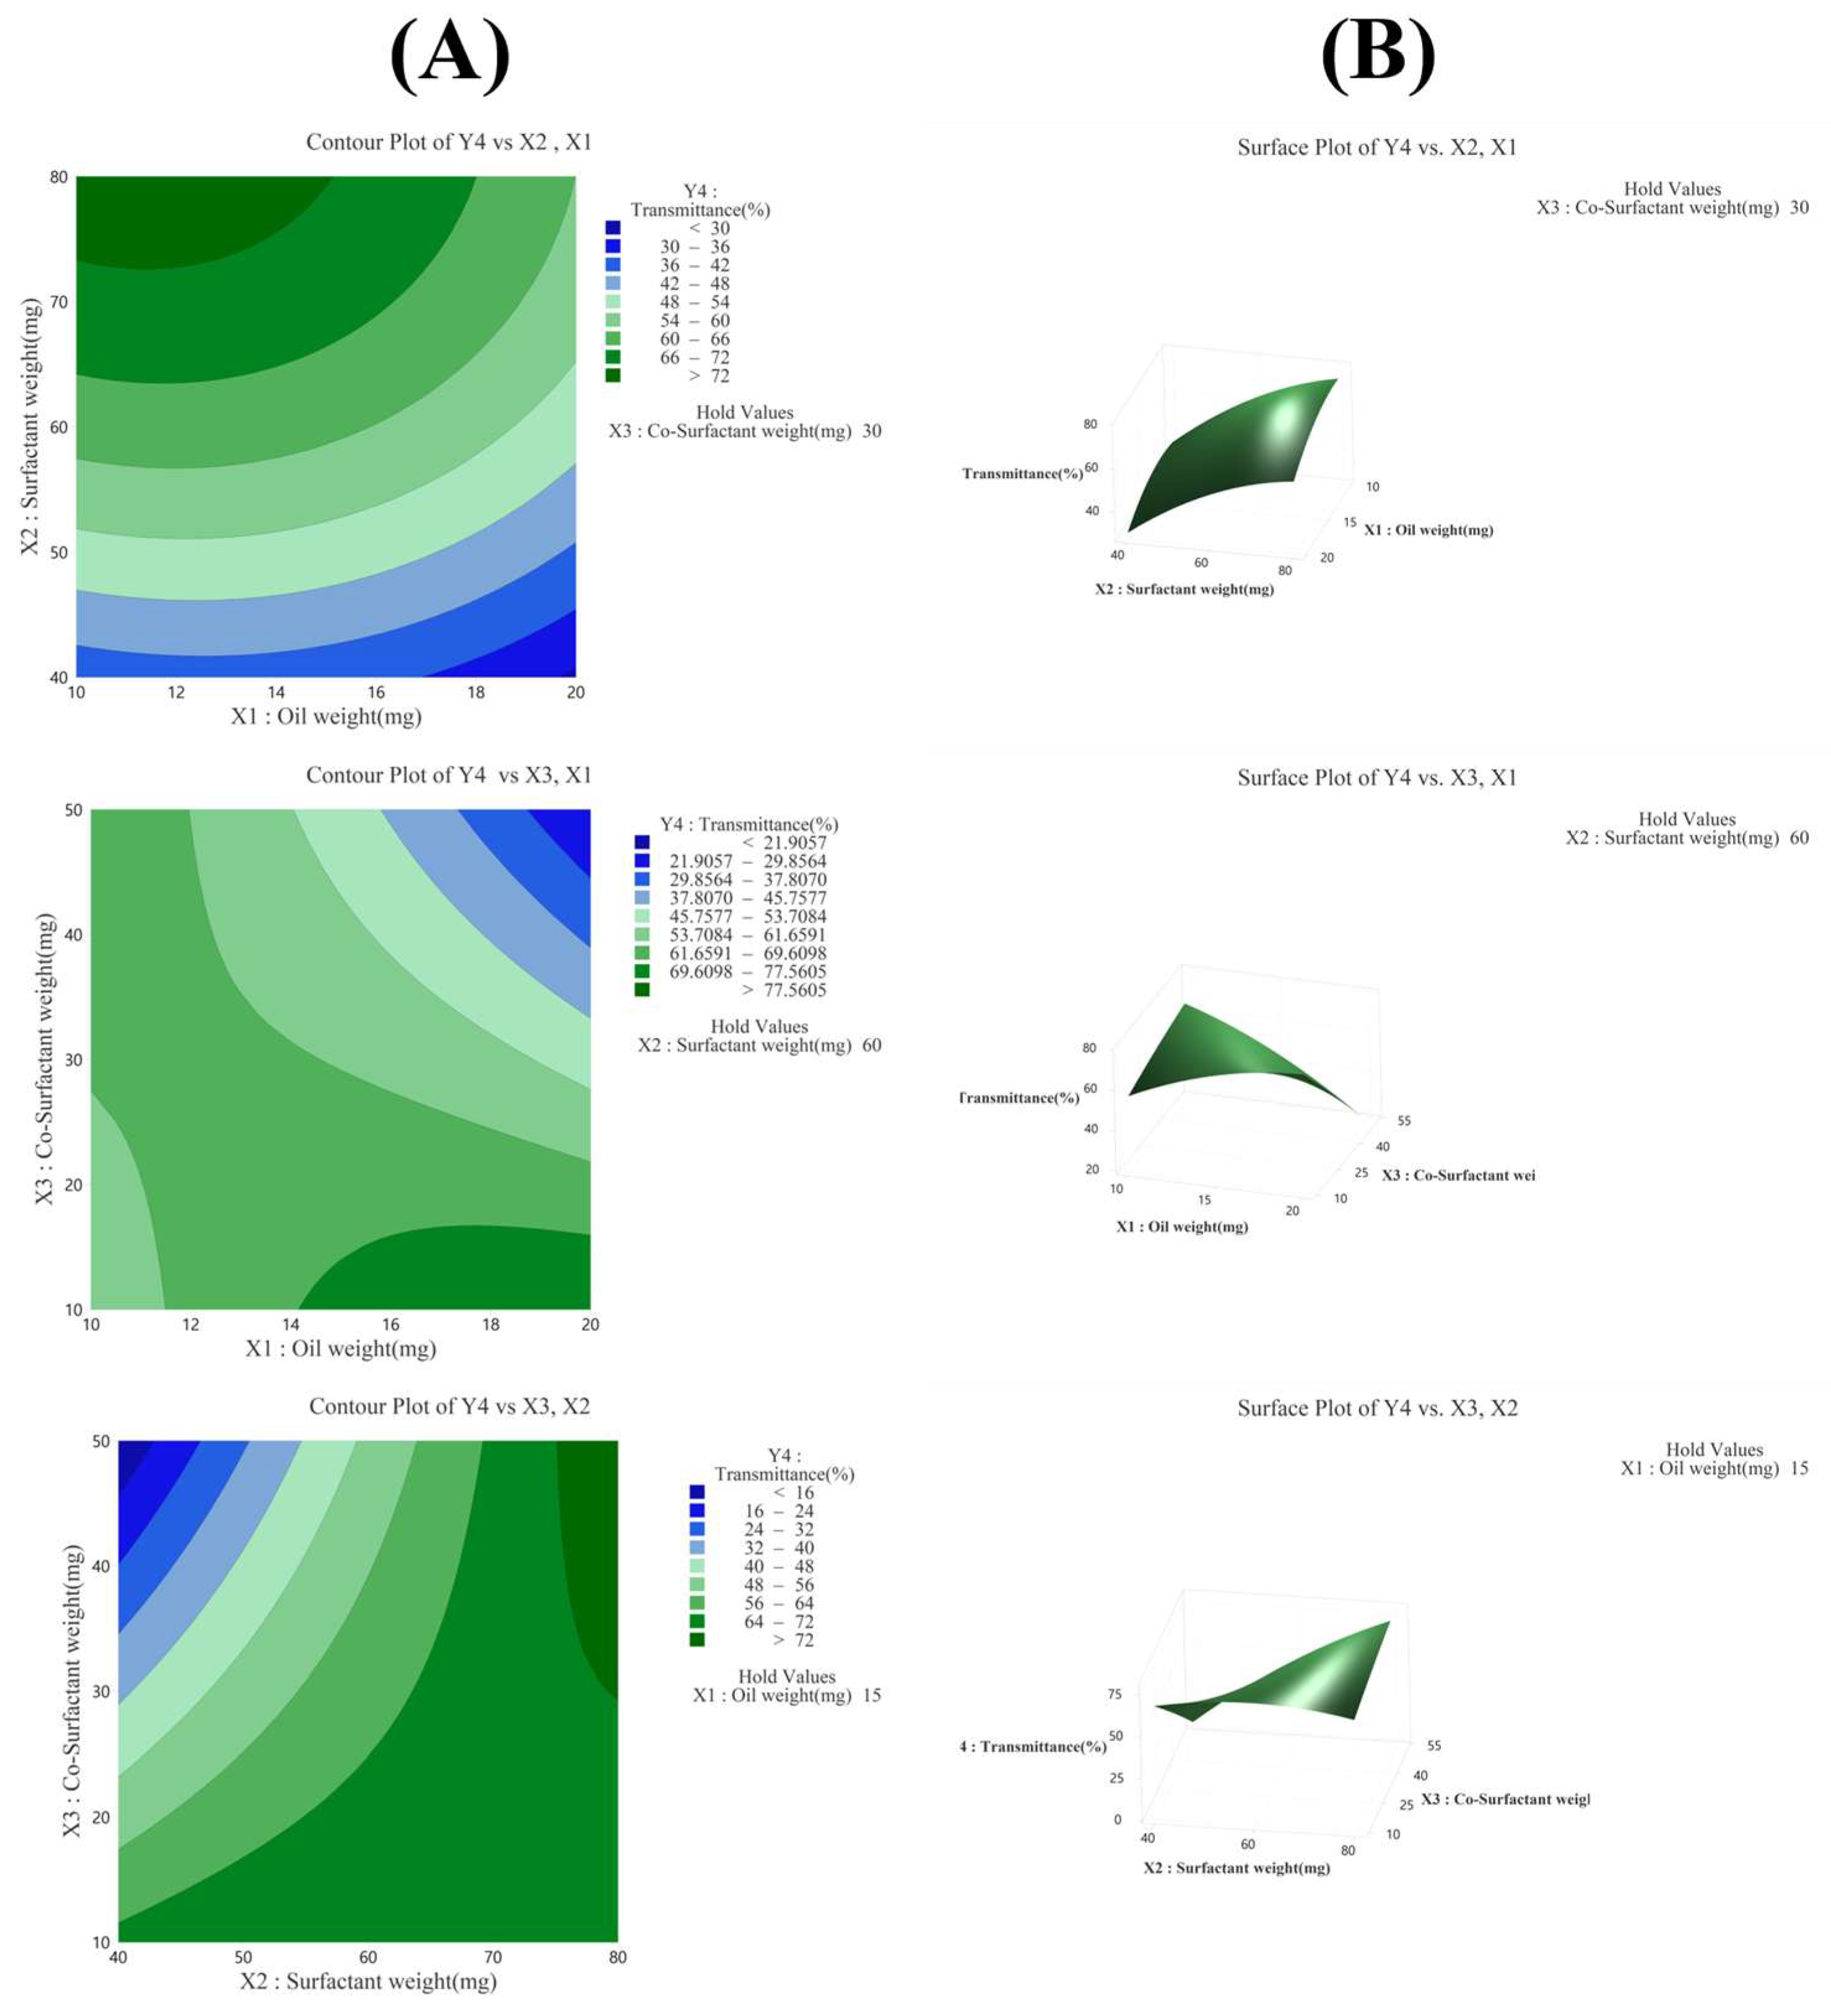
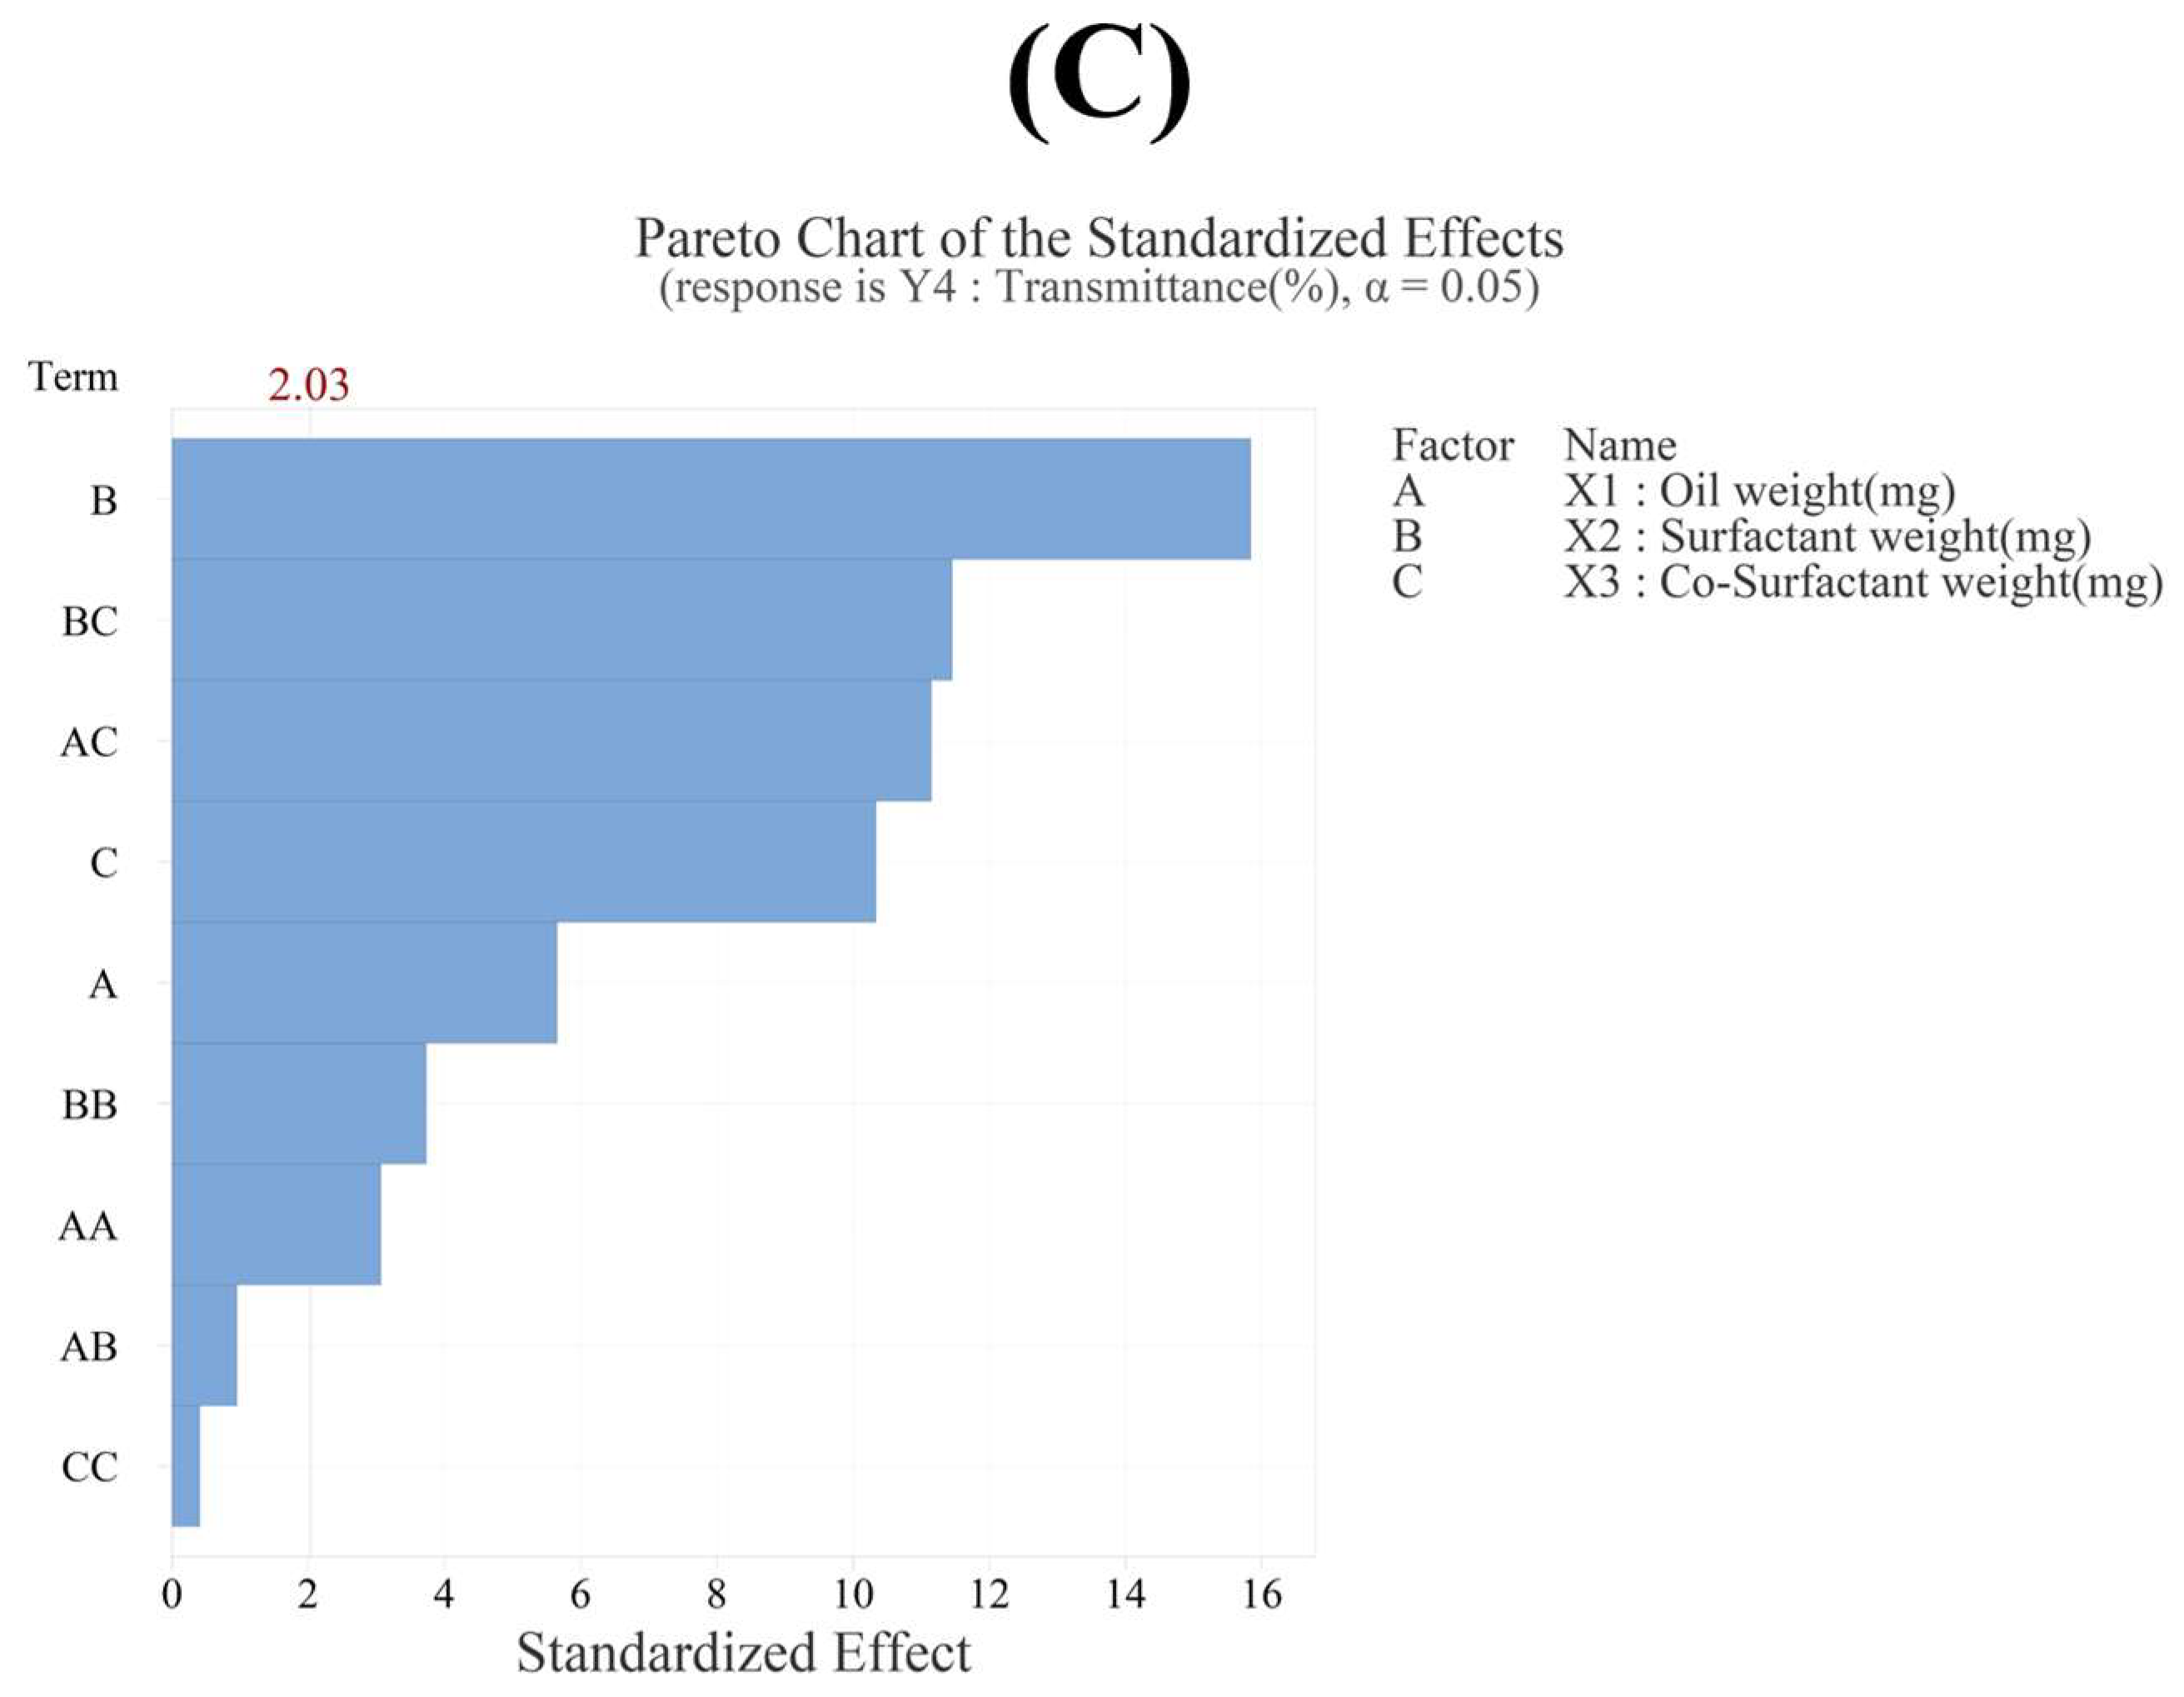
The R2 value in the analysis of variance for transmittance (Y4) was 95.02%, indicating a high explanatory power (Table 5). All linear model terms (X1, X2, X3) were significant as their p-values were below 0.05. In the quadratic model, X12 and X22 were significant with p-values below 0.05, whereas X32 was not significant with a p-value of 0.687. In the 2FI model, X1X2 was not significant with a p-value of 0.348, whereas X2X3 and X1X3 were significant with p-values below 0.05. The equation of the model in coded terms is presented as follows:
Y4 (transmittance) = 61.20 − 6.02X1 + 16.88X2 − 11.02X3 − 4.81X12 − 5.85X22 − 0.64X32 − 1.43X1X2 − 16.81X1X3 + 17.26X2X3
The X2 factor had the greatest influence on transmittance, as confirmed by the Pareto chart in Figure 5C, contour plot and surface plot in Figure 5B, and p-value in Table 5. In addition, the Pareto chart in Figure 5C indicated that factors X2, X2X3, X1X3, and X3 influenced the particle size, in that order, demonstrating that these four factors contributed significantly to determining the particle size of the SNEDDS [22,23,35,40,41].

3.4. Characterization of Optimized FLU-SNE

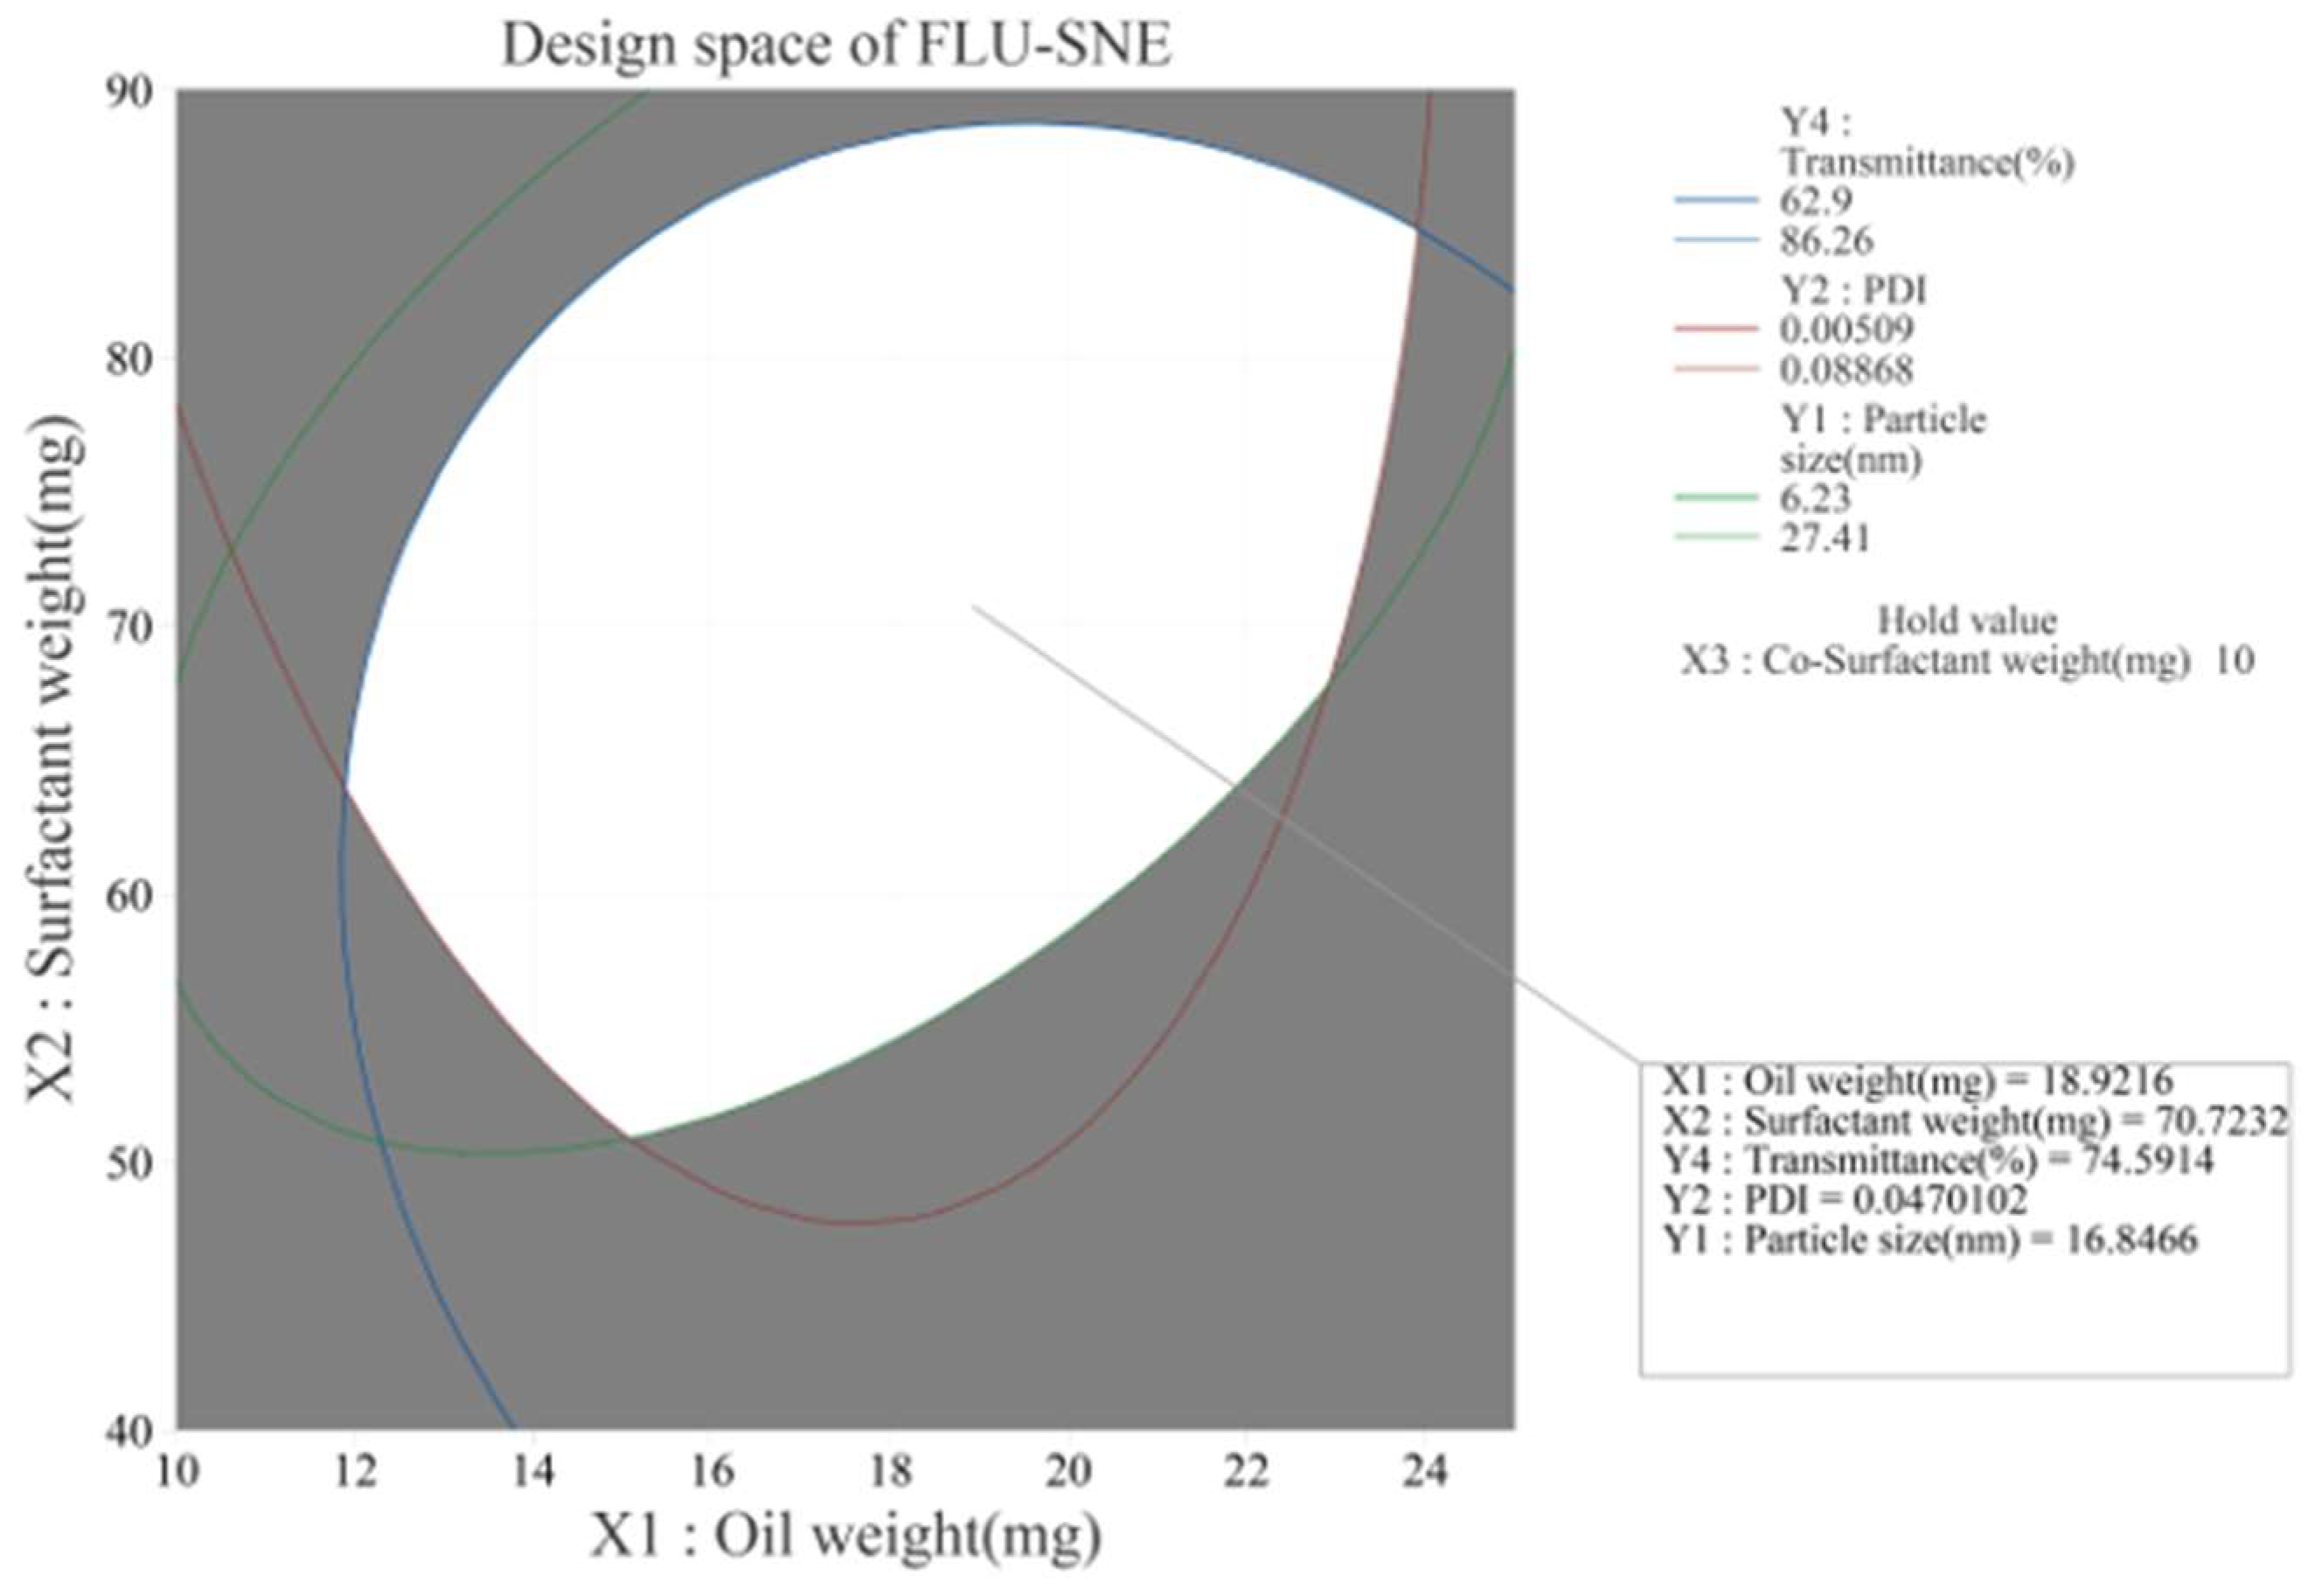
In multiple-response optimization, the desirability function approach is commonly used. To optimize multiple responses simultaneously, it is desirable to consider conflicting criteria and incorporate the decision maker’s preferences. Generally, the overall desirability D-value (D) is considered higher when it is closer to 1 [42,43]. A response optimization tool was used to optimize the factors analyzed in the BBD. The optimization process aimed to identify the highest transmittance, lowest PDI, and smallest particle size [37]. Optimization was conducted using an optimization tool, and the optimization results were as follows: X1: oil weight 18.9 mg, X2: surfactant weight 70.7 mg, and X3: co-surfactant weight 10.0 mg (Table 6; Figure 6). In the BBD study of formulation optimization, the derived response surface model elucidated the interplay among three critical formulation parameters. These were the oil weight (X1), surfactant weight (X2), and co-surfactant weight (X3) (Figure 6). The D-value of composite preference was 0.9785, close to 1, which represented the optimal combination of factors within the studied parameter space (Figure 6) [43,44]. The design space is a multidimensional region that includes all independent and dependent variables [26,27]. The design space plot represents the effects of X1 (oil) and X2 (surfactant) on the responses of Y1 (particle size), Y2 (PDI), and Y3 (transmittance) when factor X3 (co-surfactant) was fixed at 10 mg (Figure 7) [29]. The design space was represented by a white area on the plot, which signified the range of variable levels that conformed to the optimal product characteristics (Figure 7).

3.5. Evaluation of Optimized FLU-SNE

3.5.1. Evaluation of Reproducibility of Optimized FLU-SNE

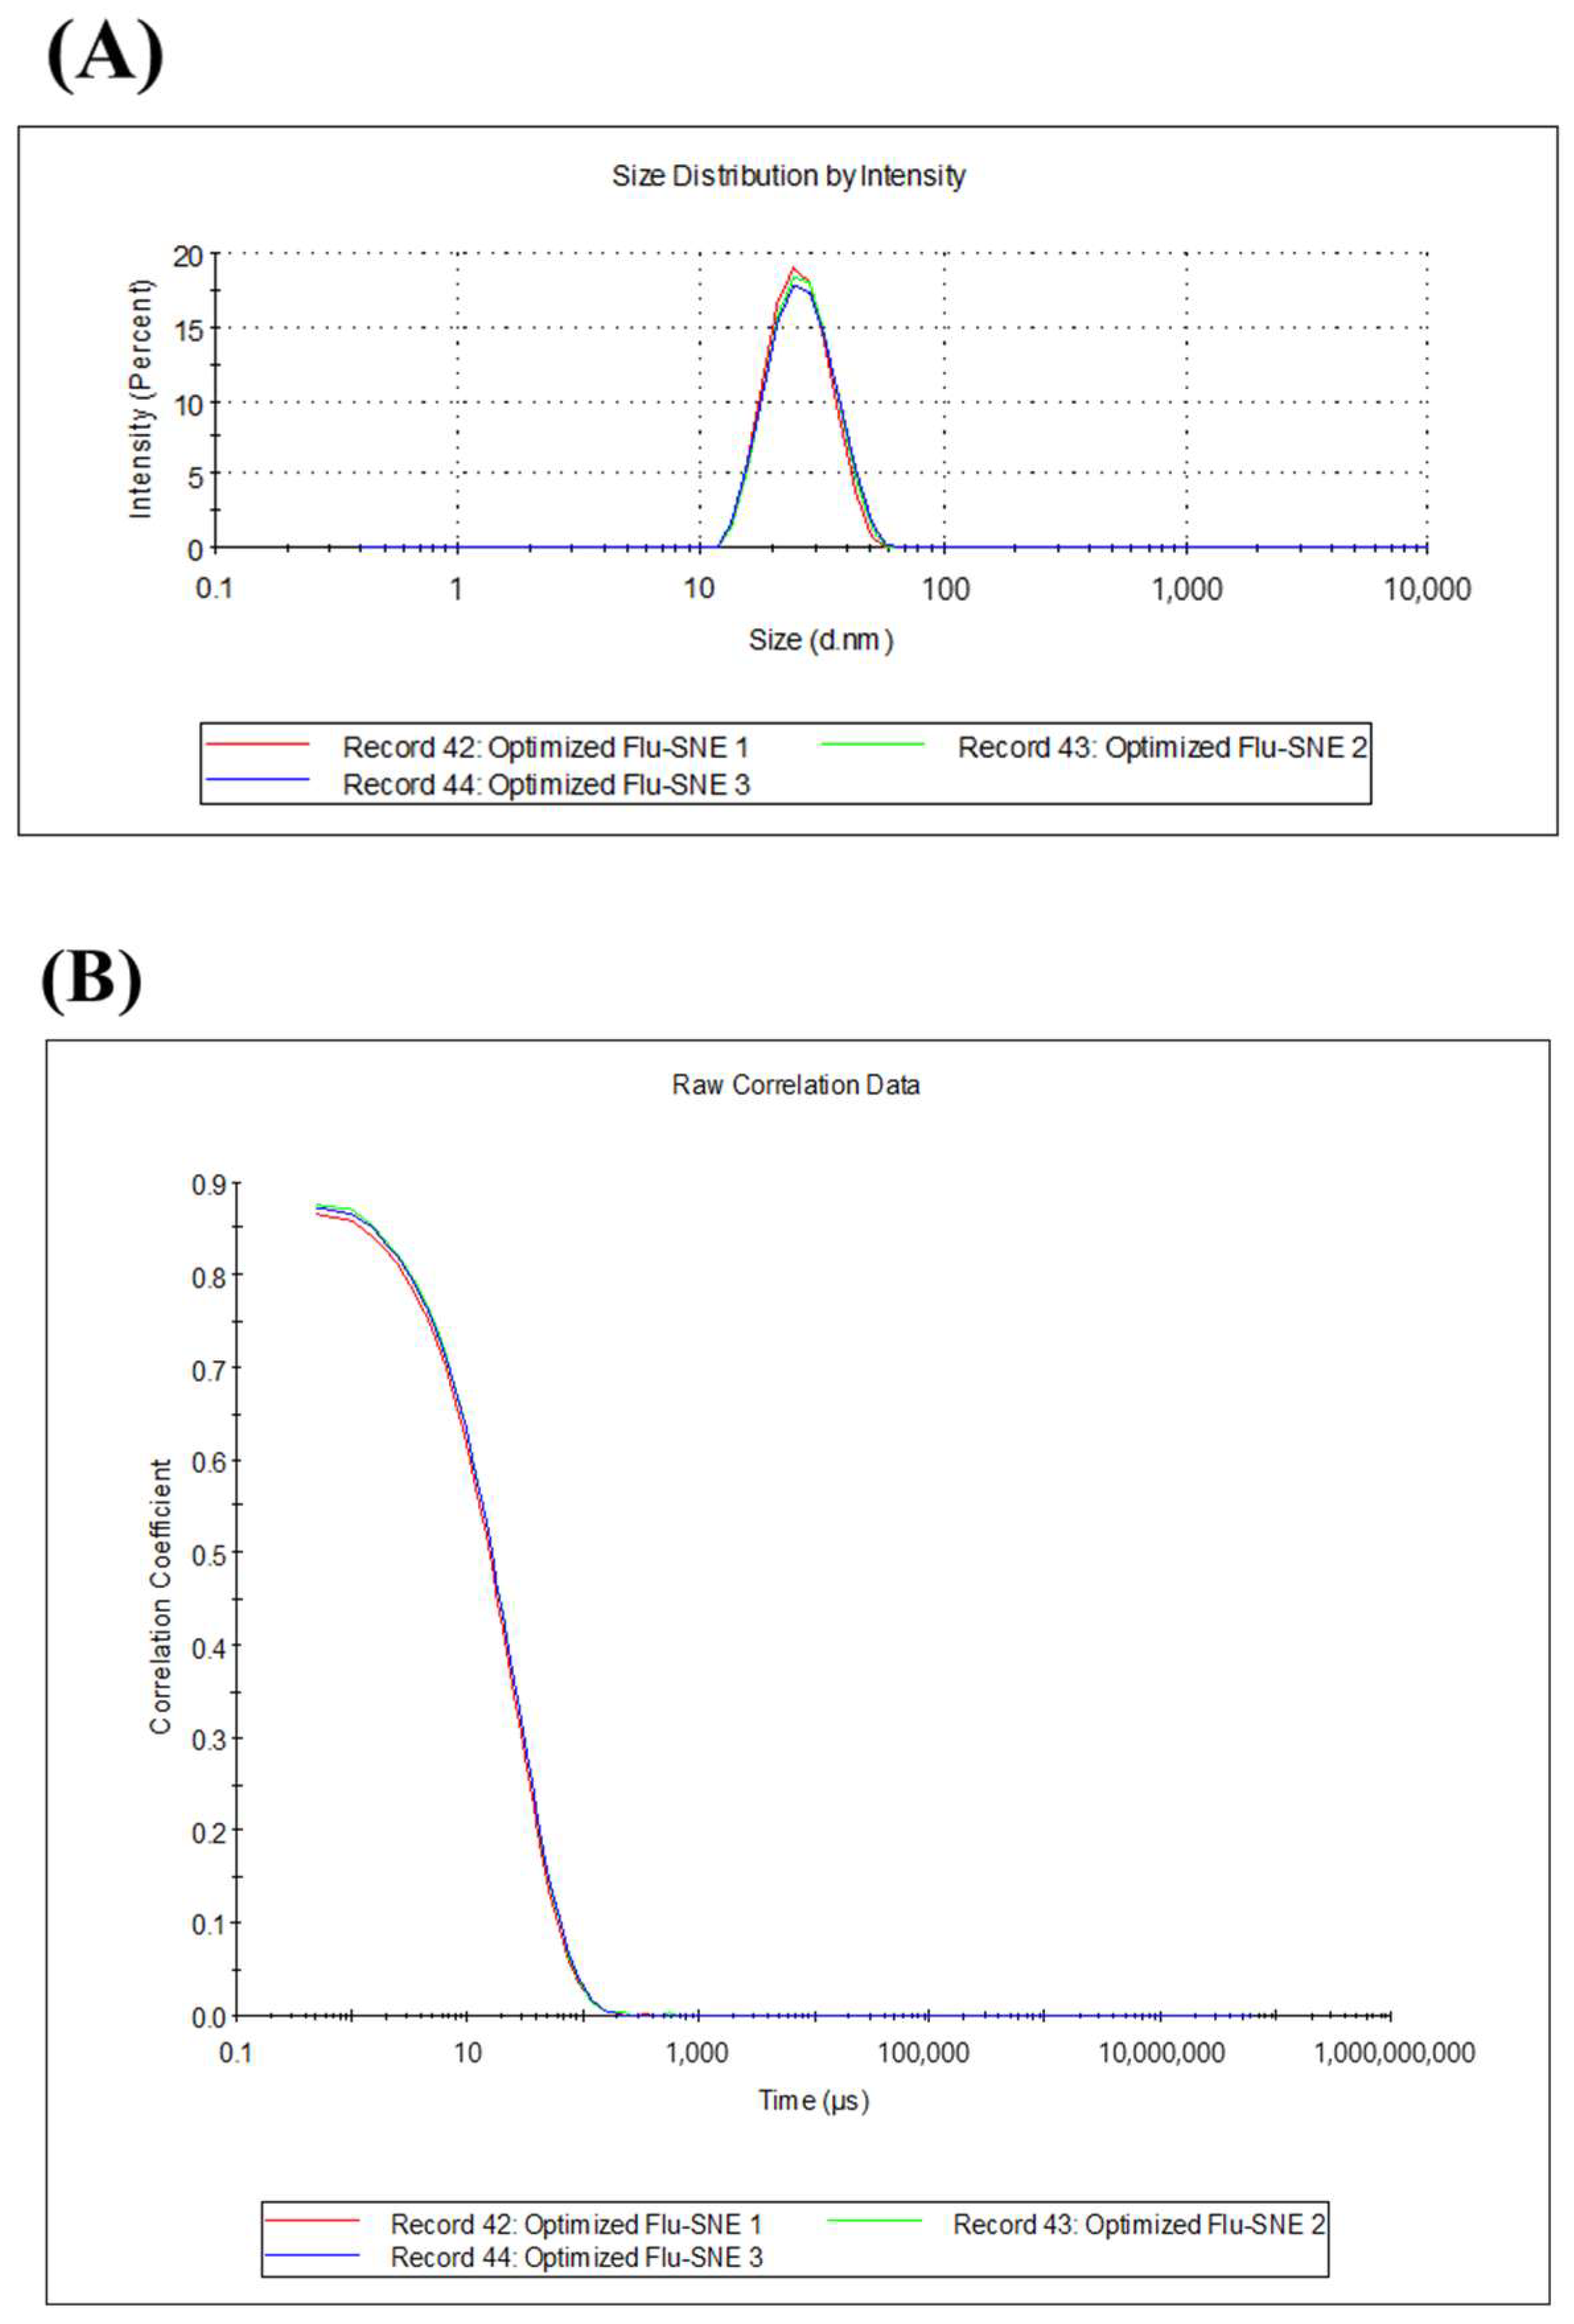
The reproducibility results for the optimized FLU-SNE were 24.89 nm for Y1 (particle size), 0.068 for Y2 (PDI), and 74.85% for Y4 (transmittance) (Table 7). The optimized FLU-SNE was used after 10-fold dilution with PBS. The results indicated that Y1 was 24.89 nm, which was within the 95% prediction interval (PI) of the fitted value shown in the response optimizer results. Y2 was 0.068, which was also within the 95% PI of the fitted value. Y3 was 74.85%, which was within the 95% PI of the fitted value [45]. FLU-SNE met the manufacturing target quality because all measurements were within the 95% prediction intervals. Figure 8 depicts the dynamic light scattering measurement results for the optimized formulation, where (A) illustrates the measurement results in the form of monodispersity, and (B) depicts the SNEDDS sample as a stable nanoemulsion with a uniformly distributed particle size and consistent behavior across multiple measurements [46].

3.5.2. Thermodynamic Stability of FLU-SNE

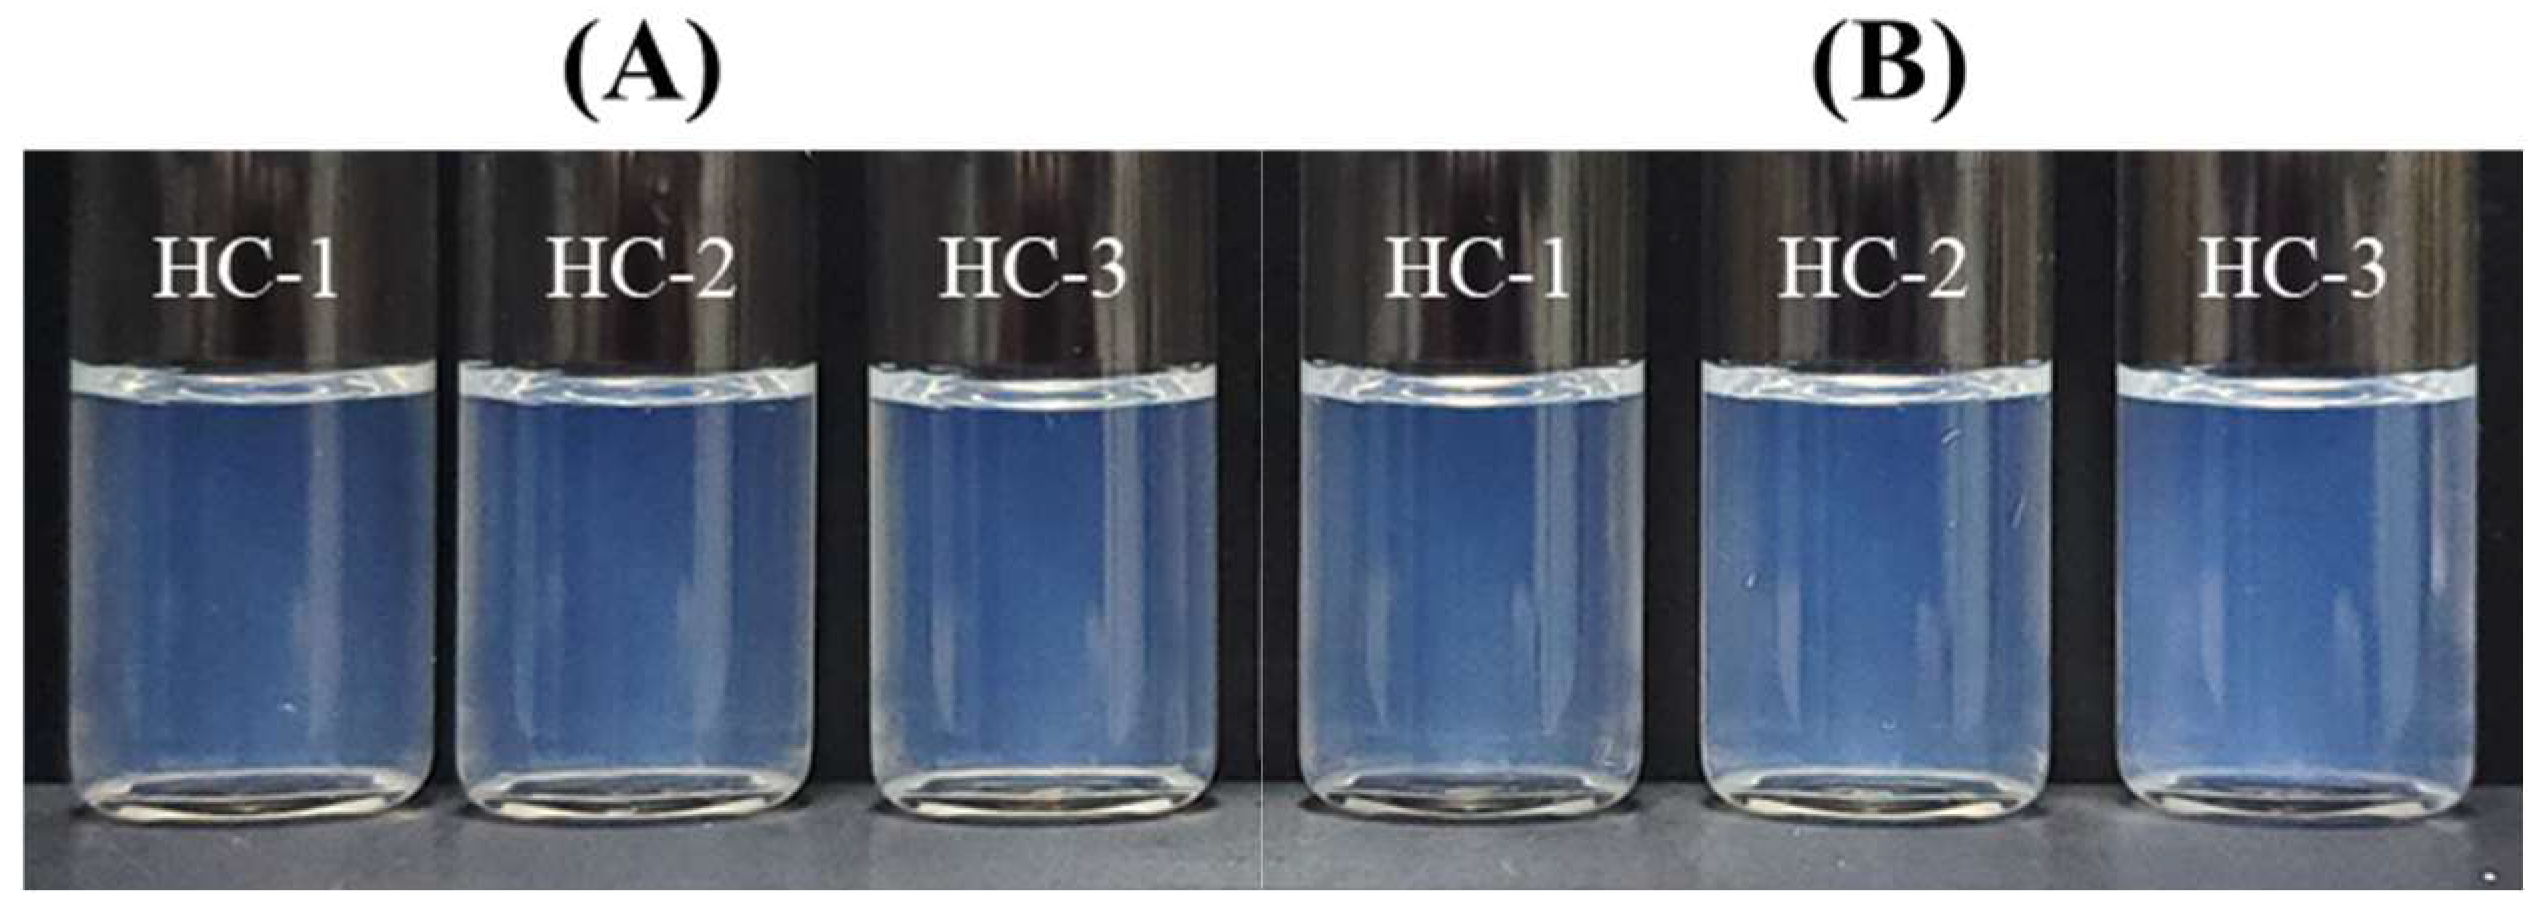
An SNEDDS must be stable under a wide range of temperature conditions and must not cause system collapse upon dilution. We performed thermodynamic stability studies using the method identified in Section 2.9. No creaming, caking, or phase separation was observed between pre- and post-conditions before and after six cycles of 40 °C to 4 °C (Figure 9). The particle size was 26.63 nm, the PDI was 0.088, and the transmittance was 72.90%, with no difference between pre- and post-conditions. Therefore, we ascertained that FLU-SNE was thermodynamically stable [31,32].

3.5.3. pH of FLU-SNE

pH is an important factor in ophthalmic formulations. The FLU-SNE pH test result was 7.16 ± 0.01, a pH that does not cause local eye pain [47].

3.5.4. Morphological Evaluation of FLU-SNE

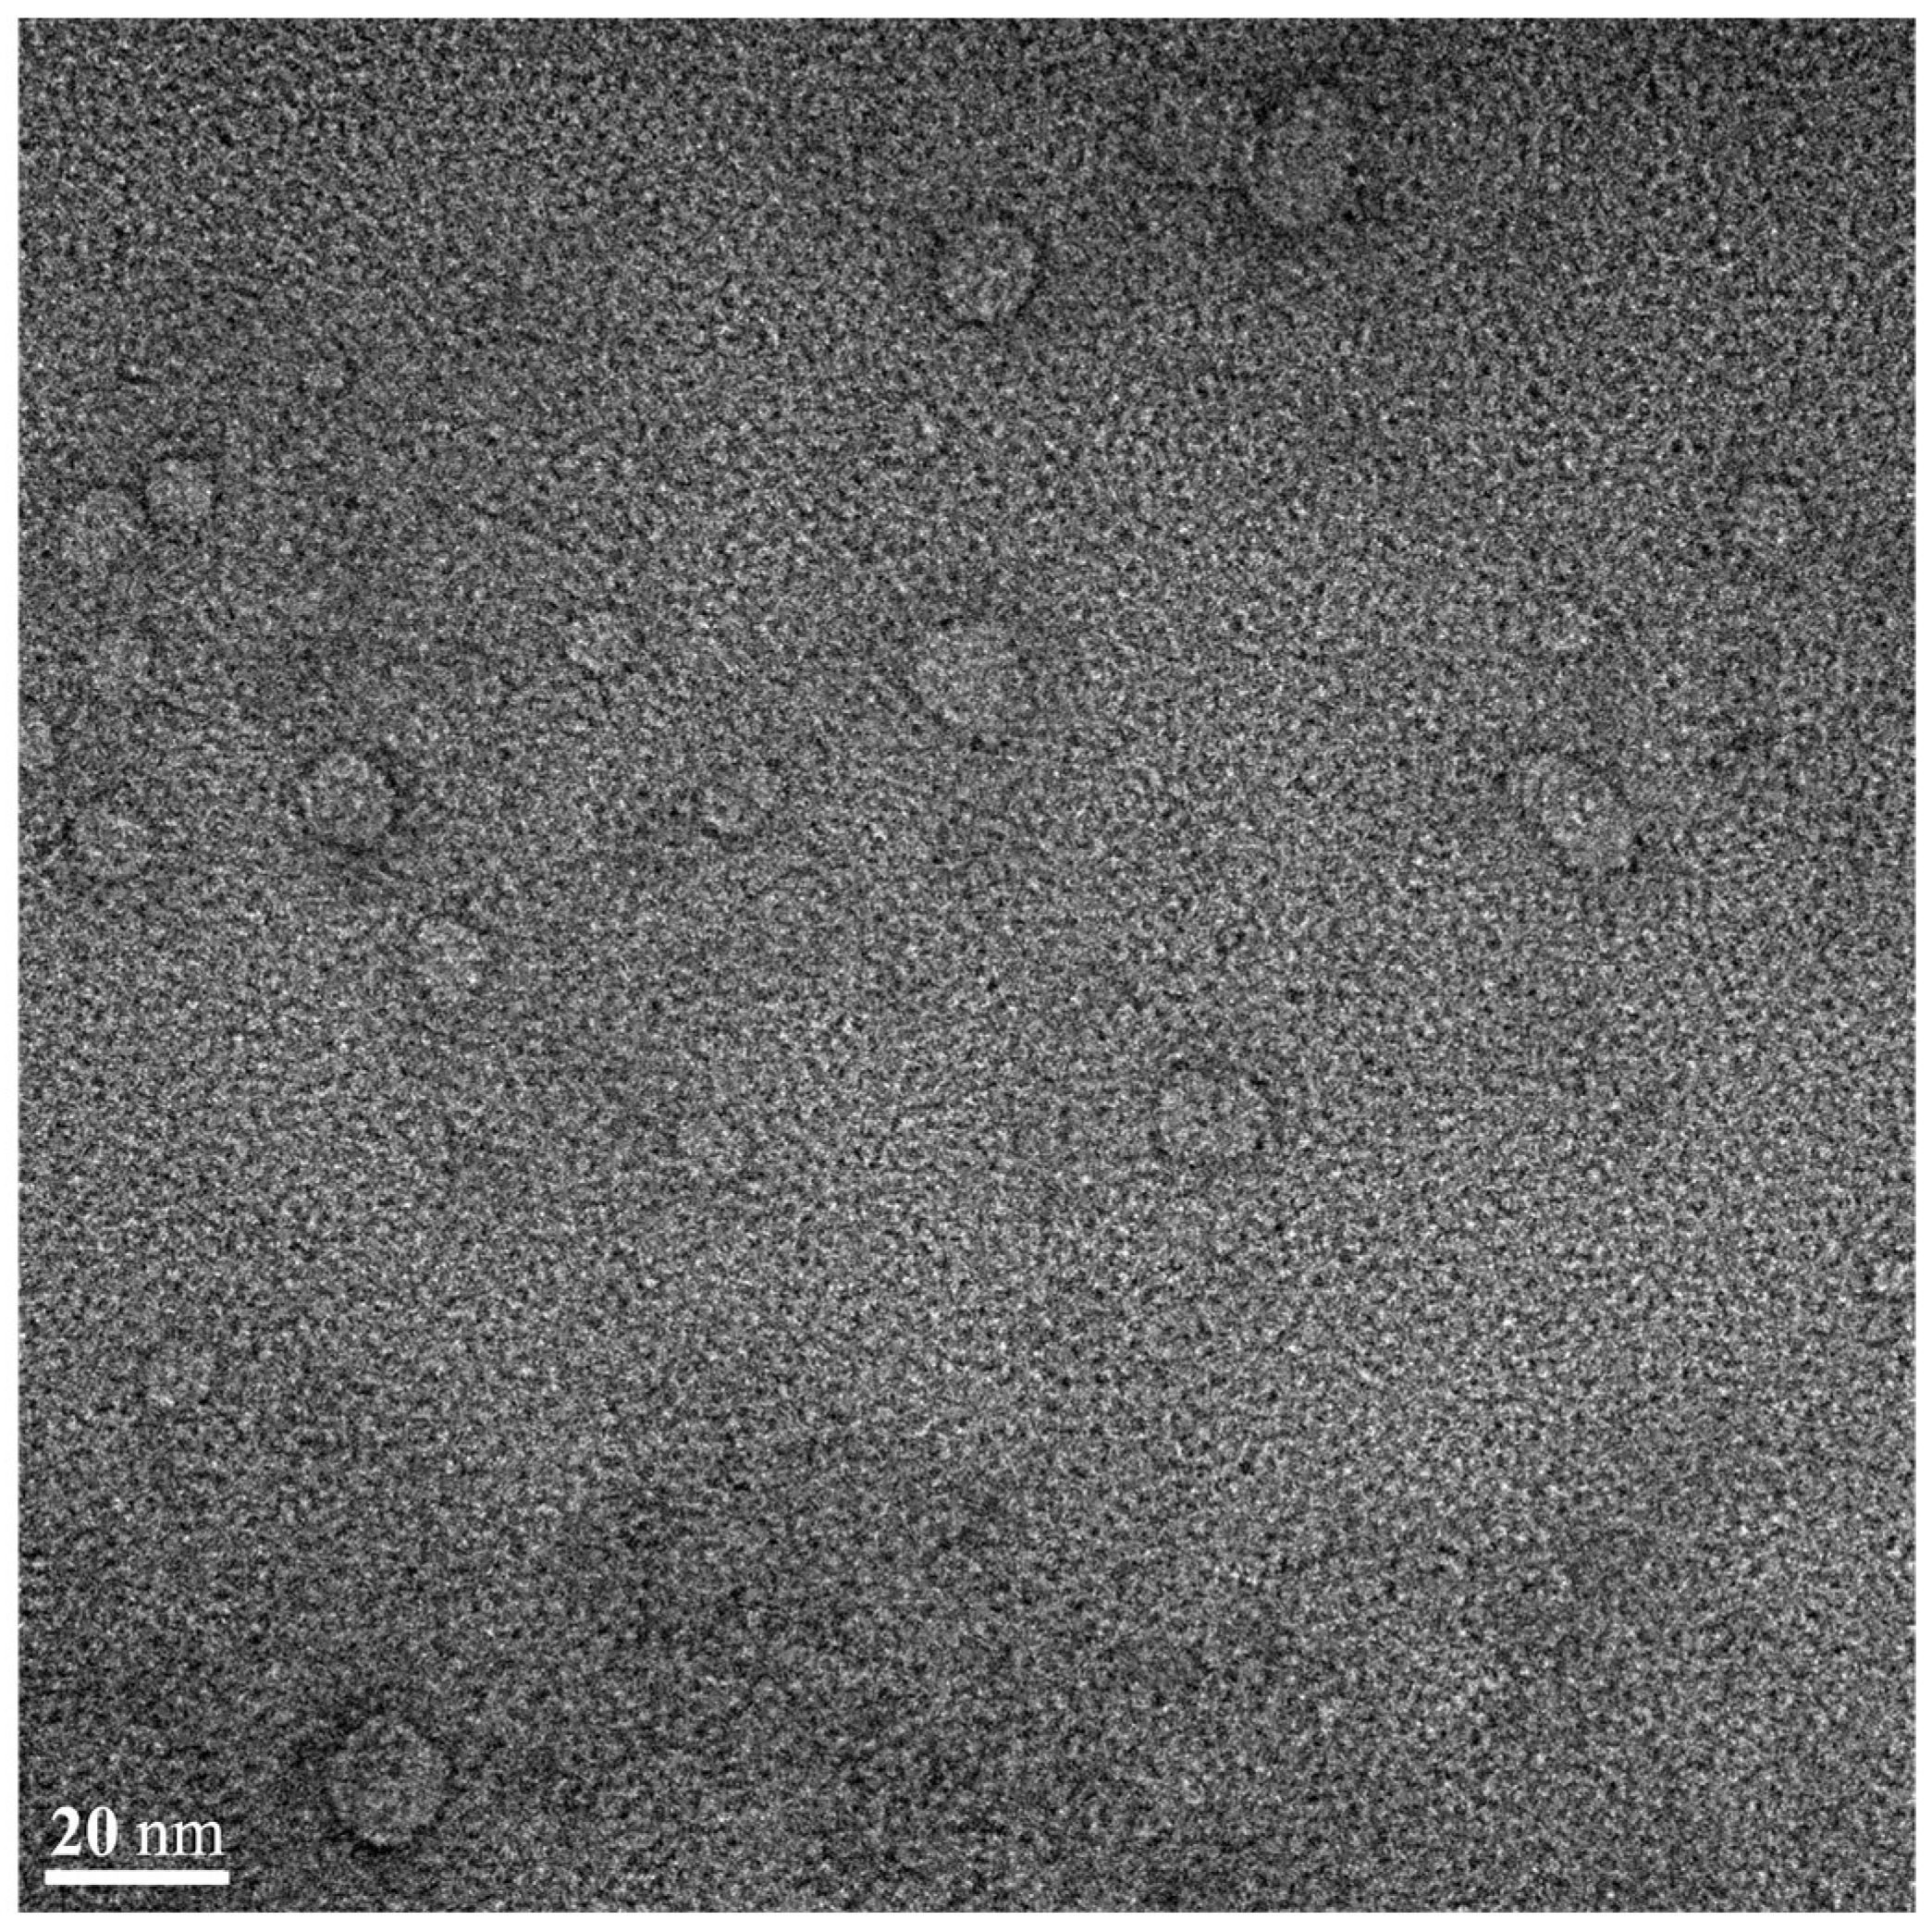
Figure 10 shows a representative TEM image of FLU-SNE dispersed in a buffer with a pH of 6.8. FLU-SNE was observed to contain single spherical and translucent nanoemulsion droplets with a mean diameter of <25 nm. This value was comparable with that obtained when the particle size was analyzed using dynamic light scattering.

3.6. In Vitro Diffusion Test

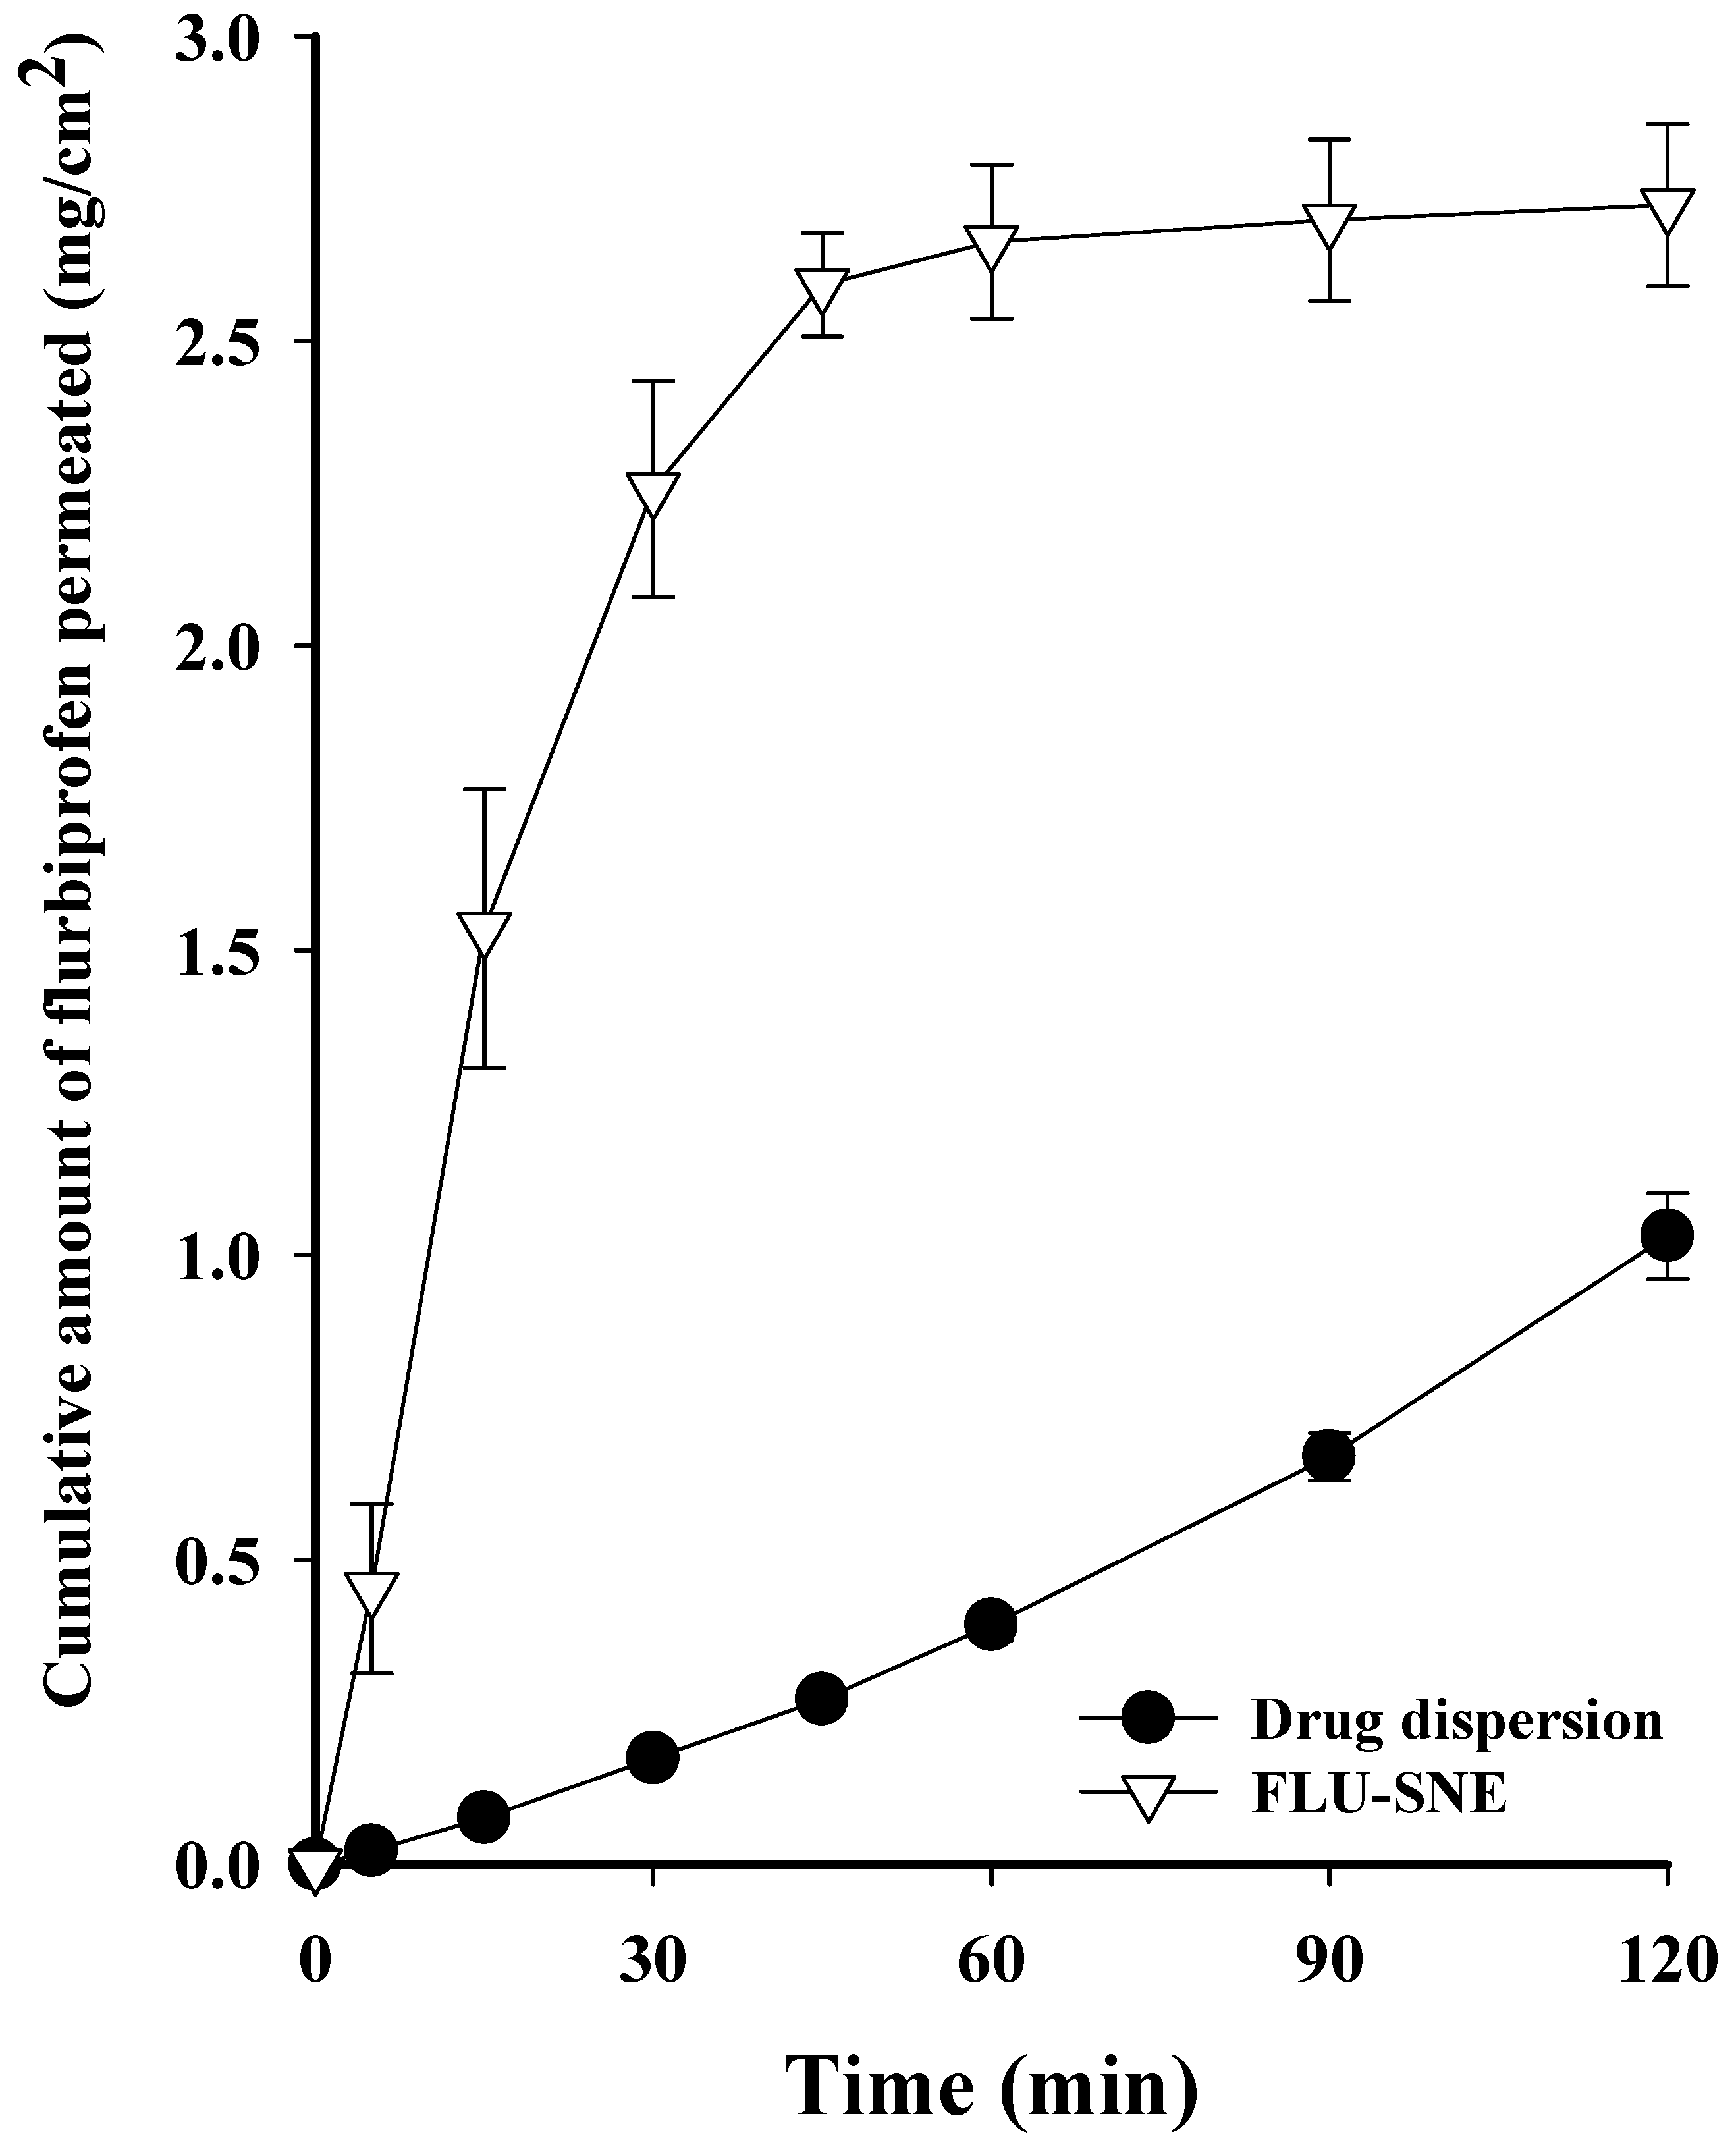
The flux of DQS in the 12,400 Da cellulose membrane was observed to be 2.723 ± 0.133 (mg/cm2) for FLU-SNE and 1.031 ± 0.070 (mg/cm2) for the drug dispersion, indicating that FLU-SNE exhibited approximately 2.5 times higher flux than the drug dispersion. FLU-SNE has a small particle size, which increases the interfacial surface area for drug absorption, and has a low PDI value, which provides good uniformity and higher permeability compared to drug dispersions [11,12,16]. Eye drops are rapidly eliminated from the eye, and the higher the initial penetration of a drug, the better its absorption. [16,48,49]. FLU-SNE has higher initial penetration and maximum flux than a drug dispersion, which is advantageous for drug absorption in ophthalmic formulations (Figure 11) [13,49].

3.7. Ex Vivo Diffusion Test

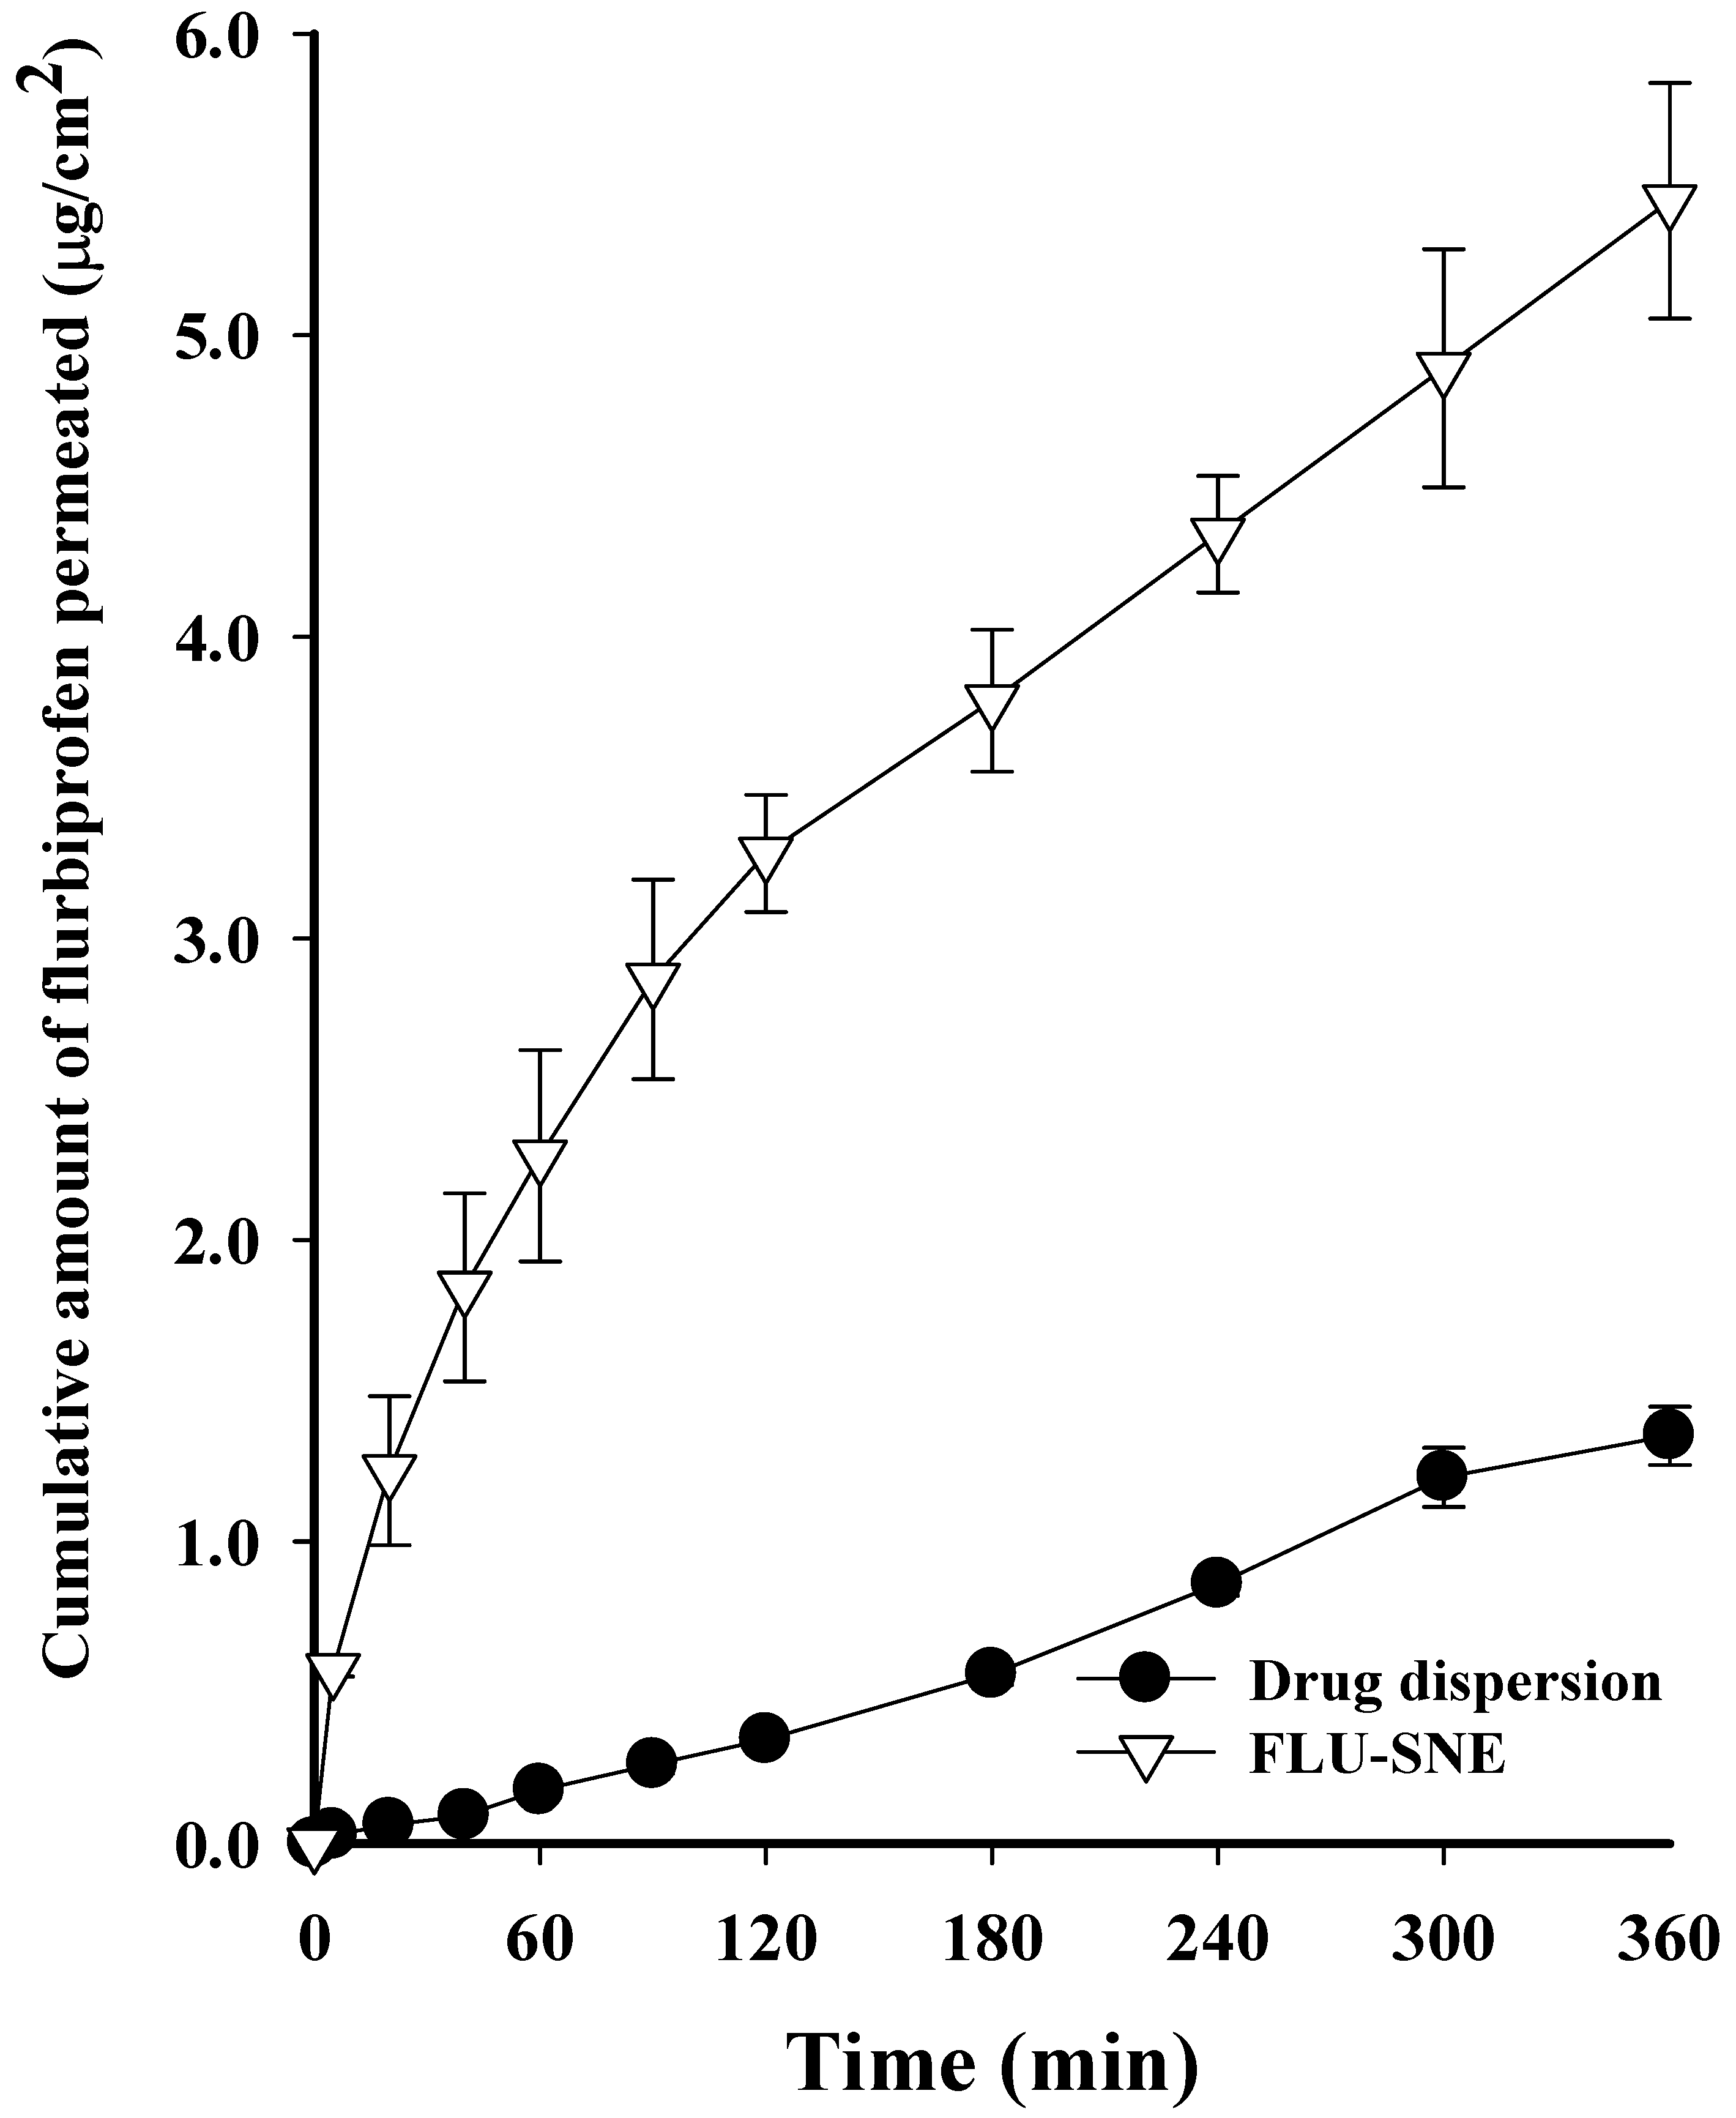
The flux of DQS in the bovine cornea was observed to be 5.446 ± 0.390 (μg/cm2) for FLU-SNE and 1.350 ± 0.097 (μg/cm2) for the drug dispersion, indicating that FLU-SNE exhibited approximately 4 times higher flux than the drug dispersion. FLU-SNE has a small particle size, which increases the interfacial surface area for drug absorption, and has a low PDI value, which provides good uniformity and higher permeability compared to drug dispersions [11,12,16]. The drug diffusion pattern was higher in the early stage; this is similar to the in vitro drug diffusion results, which were initially higher than those for the drug dispersion [16,48,49]. FLU-SNE had higher initial penetration and maximum flux than the drug dispersion, which is advantageous for drug absorption in ophthalmic formulations (Figure 12) [16,49]. The in vitro and ex vivo diffusion test results commonly showed faster and higher penetration for FLU-SNE than for the drug dispersion. This suggests that FLU-SNE increases the initial penetration and maximum penetration of drugs in ophthalmic formulations, which is expected to enhance drug bioavailability [13,49].

4. Conclusions

In this study, we developed and optimized an SNEDDS for the topical ocular administration of FLU using a QbD approach. Using a BBD, we optimized a formulation with a small particle size, low PDI, and high transmittance by considering the oil weight, surfactant weight, and co-surfactant weight, which are factors of SNEDDSs, as variables. The morphological test results supported the DLS results, and FLU-SNE exhibited good thermodynamic stability without phase separation or creaming, even under stress conditions such as heating–cooling cycles. The permeability test on FLU-SNE using a Franz diffusion cell confirmed that the drug flux was approximately 2.5 times higher in in vitro experiments using a cellulose membrane, and about 4 times higher in ex vivo experiments using excised bovine corneal tissue, compared to that of a drug dispersion. This suggests that the FLU-SNE developed in this study can significantly improve drug delivery efficiency as a topical ocular administration formulation. Although there have been many studies on SNEDDS formulations using existing FLU, most of them focused on oral administration systems or enhancing systemic absorption. Therefore, in this study, FLU with low solubility in water was optimized as FLU-SNE suitable for topical ocular administration using a QbD approach. The results regarding the reproducibility, stability, and permeability of FLU-SNE suggest the potential for more effective topical ophthalmic FLU-SNEDDSs.

Author Contributions

Conceptualization, J.-H.J., and T.-H.Y.; formal analysis, S.-W.R., M.-G.K., G.-H.K., Y.-J.O., S.-J.L., and N.-W.K.; writing—original draft preparation, J.-H.J.; supervision, K.-H.B. and K.-S.K.; project administration, K.-S.K.; funding acquisition, K.-S.K. All authors have read and agreed to the published version of the manuscript.

Funding

This research received no external funding.

Institutional Review Board Statement

Not applicable.

Informed Consent Statement

Not applicable.

Data Availability Statement

Data available on request due to restrictions, e.g., privacy or ethical restrictions.

Conflicts of Interest

The authors declare that the research was conducted in the absence of any commercial or financial relationships that could be construed as potential conflicts of interest.

References

  1. Krishna, U.; Ajanaku, D.; Denniston, A.K.; Gkika, T. Uveitis: A sight-threatening disease which can impact all systems. Postgrad. Med. J. 2017, 93, 766–773. [Google Scholar] [CrossRef]
  2. Ahuja, M.; Dhake, A.S.; Sharma, S.K.; Majumdar, D.K. Topical ocular delivery of NSAIDs. AAPS J. 2008, 10, 229–241. [Google Scholar] [CrossRef] [PubMed]
  3. Blazaki, S.; Tsika, C.; Tzatzarakis, M.; Naoumidi, E.; Tsatsakis, A.; Tsatsanis, C.; Tsilimbaris, M.K. Pharmacokinetics and efficacy of intraocular flurbiprofen. Graefe’s Arch. Clin. Exp. Ophthalmol. 2017, 255, 2375–2380. [Google Scholar] [CrossRef] [PubMed]
  4. Ginsburg, A.P.; Cheetham, J.K.; DeGryse, R.E.; Abelson, M. Effects of flurbiprofen and indomethacin on acute cystoid macular edema after cataract surgery: Functional vision and contrast sensitivity. J. Cataract Refract. Surg. 1995, 21, 82–92. [Google Scholar] [CrossRef]
  5. Pignatello, R.; Bucolo, C.; Spedalieri, G.; Maltese, A.; Puglisi, G. Flurbiprofen-loaded acrylate polymer nanosuspensions for ophthalmic application. Biomaterials 2002, 23, 3247–3255. [Google Scholar] [CrossRef]
  6. Wu, K.Y.; Akbar, D.; Giunta, M.; Kalevar, A.; Tran, S.D. Hydrogels in ophthalmology: Novel strategies for overcoming therapeutic challenges. Materials 2023, 17, 86. [Google Scholar] [CrossRef] [PubMed]
  7. Vane, J.R.; Botting, R.M. Mechanism of action of nonsteroidal anti-inflammatory drugs. Am. J. Med. 1998, 104, 2S–8S. [Google Scholar] [CrossRef]
  8. Li, N.; Zhuang, C.; Wang, M.; Sun, X.; Nie, S.; Pan, W. Liposome coated with low molecular weight chitosan and its potential use in ocular drug delivery. Int. J. Pharm. 2009, 379, 131–138. [Google Scholar] [CrossRef]
  9. Zingale, E.; Bonaccosrso, A.; D’Amico, A.G.; Lombardo, R.; D’Agata, V.; Rautio, J.; Pignatello, R. Formulating Resveratrol and Melatonin Self-Nanoemulsifying Drug Delivery Systems (SNEDDS) for Ocular Administration Using Design of Experiments. Pharmaceutics 2024, 16, 125. [Google Scholar] [CrossRef]
  10. Yin, H.F.; Yin, C.M.; Ouyang, T.; Sun, S.D.; Chen, W.G.; Yang, X.L.; He, X.; Zhang, C.F. Self-nanoemulsifying drug delivery system of genkwanin: A novel approach for anti-colitis-associated colorectal cancer. Drug Des. Dev. Ther. 2021, 15, 557–576. [Google Scholar] [CrossRef]
  11. Rasoanirina, B.N.V.; Lassoued, M.A.; Miladi, K.; Razafindrakoto, Z.; Chaâbane-Banaoues, R.; Ramanitrahasimbola, D.; Cornet, M.; Sfar, S. Self-nanoemulsifying drug delivery system to improve transcorneal permeability of voriconazole: In-vivo studies. J. Pharm. Pharmacol. 2020, 72, 889–896. [Google Scholar] [CrossRef]
  12. Hegde, R.R.; Verma, A.; Ghosh, A. Microemulsion: New insights into the ocular drug delivery. Int. Sch. Res. Not. 2013, 2013, 826798. [Google Scholar] [CrossRef] [PubMed]
  13. Zingale, E.; Masuzzo, S.; Lajunen, T.; Reinisalo, M.; Rautio, J.; Consoli, V.; D’amico, A.G.; Vanella, L.; Pignatello, R. Protective Role and Enhanced Intracellular Uptake of Curcumin in Retinal Cells Using Self-Emulsifying Drug Delivery Systems (SNEDDS). Pharmaceuticals 2025, 18, 265. [Google Scholar] [CrossRef] [PubMed]
  14. Wang, L.; Dong, J.; Chen, J.; Eastoe, J.; Li, X. Design and optimization of a new self-nanoemulsifying drug delivery system. J. Colloid Interface Sci. 2009, 330, 443–448. [Google Scholar] [CrossRef]
  15. Yılmaz, B.; Bayrak, B.; Kadıoğlu, Y. Development and validation of HPLC method for the determination of Flurbiprofen in pharmaceutical preparations. Int. J. PharmATA 2022, 2, 72–81. [Google Scholar]
  16. Bachu, R.D.; Chowdhury, P.; Al-Saedi, Z.H.; Karla, P.K.; Boddu, S.H. Ocular drug delivery barriers—Role of nanocarriers in the treatment of anterior segment ocular diseases. Pharmaceutics 2018, 10, 28. [Google Scholar] [CrossRef]
  17. Al Haydar, M.; Abid, H.R.; Sunderland, B.; Wang, S. Metal organic frameworks as a drug delivery system for flurbiprofen. Drug Des. Dev. Ther. 2017, 11, 2685–2695. [Google Scholar] [CrossRef]
  18. Vikash, B.; Pandey, N.K.; Kumar, B.; Wadhwa, S.; Goutam, U.; Alam, A.; Al-Otaibi, F.; Chaubey, P.; Mustafa, G.; Gupta, G. Formulation and evaluation of ocular self-nanoemulsifying drug delivery system of brimonidine tartrate. J. Drug Deliv. Sci. Technol. 2023, 81, 104226. [Google Scholar] [CrossRef]
  19. Kassem, A.A.; Salama, A.; Mohsen, A.M. Formulation and optimization of cationic nanoemulsions for enhanced ocular delivery of dorzolamide hydrochloride using Box-Behnken design: In vitro and in vivo assessments. J. Drug Deliv. Sci. Technol. 2022, 68, 103047. [Google Scholar] [CrossRef]
  20. Gonzalez-Mira, E.; Egea, M.; Garcia, M.; Souto, E. Design and ocular tolerance of flurbiprofen loaded ultrasound-engineered NLC. Colloids Surf. B Biointerfaces 2010, 81, 412–421. [Google Scholar] [CrossRef]
  21. Younes, N.F.; Abdel-Halim, S.A.; Elassasy, A.I. Solutol HS15 based binary mixed micelles with penetration enhancers for augmented corneal delivery of sertaconazole nitrate: Optimization, in vitro, ex vivo and in vivo characterization. Drug Deliv. 2018, 25, 1706–1717. [Google Scholar] [CrossRef]
  22. Xin, J.; Tang, J.; Bu, M.; Sun, Y.; Wang, X.; Wu, L.; Liu, H. A novel eye drop of alpha tocopherol to prevent ocular oxidant damage: Improve the stability and ocular efficacy. Drug Dev. Ind. Pharm. 2016, 42, 525–534. [Google Scholar] [CrossRef] [PubMed]
  23. Auriol, S.; Mahieu, L.; Brousset, P.; Malecaze, F.; Mathis, V. Safety of medium-chain triglycerides used as an intraocular tamponading agent in an experimental vitrectomy model rabbit. Retina 2013, 33, 217–223. [Google Scholar] [CrossRef] [PubMed]
  24. Tangri, P.; Khurana, S. Basics of ocular drug delivery systems. Int. J. Res. Pharm. Biomed. Sci. 2011, 2, 1541–1552. [Google Scholar]
  25. Choi, H.J.; Kim, K.S. Development of a novel ticagrelor solid dispersion-loaded tablet with enhanced solubility. Yakhak Hoeji 2020, 64, 21–27. [Google Scholar] [CrossRef]
  26. Choi, S.A.; Park, E.J.; Lee, J.H.; Min, K.A.; Kim, S.T.; Jang, D.J.; Maeng, H.J.; Jin, S.G.; Cho, K.H. Preparation and Characterization of Pazopanib Hydrochloride-Loaded Four-Component Self-Nanoemulsifying Drug Delivery Systems Preconcentrate for Enhanced Solubility and Dissolution. Pharmaceutics 2022, 14, 1875. [Google Scholar] [CrossRef] [PubMed]
  27. Choi, H.J.; Kim, K.S. Development of Solid Self-nanoemulsifying Drug Delivery Systems of Ticagrelor Using Porous Carriers. J. Life Sci. 2021, 31, 502–510. [Google Scholar]
  28. Kim, D.S.; Cho, J.H.; Park, J.H.; Kim, J.S.; Song, E.S.; Kwon, J.; Giri, B.R.; Jin, S.G.; Kim, K.S.; Choi, H.G. Self-microemulsifying drug delivery system (SMEDDS) for improved oral delivery and photostability of methotrexate. Int. J. Nanomed. 2019, 14, 4949–4960. [Google Scholar] [CrossRef]
  29. Quinteros, D.A.; Tártara, L.I.; Palma, S.D.; Manzo, R.H.; Allemandi, D.A. Ocular delivery of flurbiprofen based on Eudragit® E-flurbiprofen complex dispersed in aqueous solution: Preparation, characterization, in vitro corneal penetration, and ocular irritation. J. Pharm. Sci. 2014, 103, 3859–3868. [Google Scholar] [CrossRef]
  30. Kim, Y.H.; Kim, S.B.; Choi, S.H.; Nguyen, T.T.L.; Ahn, S.H.; Moon, K.S.; Moon, K.S.; Cho, K.H.; Sim, T.Y.; Heo, E.J.; et al. Development and evaluation of self-microemulsifying drug delivery system for improving oral absorption of poorly water-soluble Olaparib. Pharmaceutics 2023, 15, 1669. [Google Scholar] [CrossRef]
  31. Bali, V.; Ali, M.; Ali, J. Nanocarrier for the enhanced bioavailability of a cardiovascular agent: In vitro, pharmacodynamic, pharmacokinetic and stability assessment. Int. J. Pharm. 2011, 403, 46–56. [Google Scholar] [CrossRef] [PubMed]
  32. Rajitha, P.; Shammika, P.; Aiswarya, S.; Gopikrishnan, A.; Jayakumar, R.; Sabitha, M. Chaulmoogra oil based methotrexate loaded topical nanoemulsion for the treatment of psoriasis. J. Drug Deliv. Sci. Technol. 2019, 49, 463–476. [Google Scholar] [CrossRef]
  33. Rasoanirina, B.N.V.; Lassoued, M.A.; Kamoun, A.; Bahloul, B.; Milaki, K.; Sfar, S. Voriconazole-loaded self-nanoemulsifying drug delivery system (SNEDDS) to improve transcorneal permeability. Pharm. Dev. Technol. 2020, 25, 694–703. [Google Scholar] [CrossRef]
  34. Tracy, P.; Dasgupta, D.; More, S. Challenges and opportunities for production of C5 sugar fatty acid esters (SFAEs) from renewable resources. Ind. Crops Prod. 2023, 193, 116170. [Google Scholar] [CrossRef]
  35. Villar, A.M.S.; Naveros, B.C.; Campmany, A.C.C.; Trenchs, M.A.; Rocabert, C.B.; Bellowa, L.H. Design and optimization of self-nanoemulsifying drug delivery systems (SNEDDS) for enhanced dissolution of gemfibrozil. Int. J. Pharm. 2012, 431, 161–175. [Google Scholar] [CrossRef]
  36. Singh, A.K.; Chaurasiya, A.; Singh, M.; Upadhyay, S.C.; Mykherjee, R.; Khar, R.K. Exemestane loaded self-microemulsifying drug delivery system (SMEDDS): Development and optimization. Aaps Pharmscitech 2008, 9, 628–634. [Google Scholar] [CrossRef] [PubMed]
  37. Beg, S.; Sandhu, P.S.; Batra, R.S.; Khurana, R.K.; Singh, B. QbD-based systematic development of novel optimized solid self-nanoemulsifying drug delivery systems (SNEDDS) of lovastatin with enhanced biopharmaceutical performance. Drug Deliv. 2015, 22, 765–784. [Google Scholar] [CrossRef]
  38. Dixit, A.R.; Rajput, S.J.; Patel, S.G. Preparation and bioavailability assessment of SMEDDS containing valsartan. AAPS Pharmscitech 2010, 11, 314–321. [Google Scholar] [CrossRef]
  39. Singh, D.; Tiwary, A.K.; Bedi, N. Canagliflozin loaded SMEDDS: Formulation optimization for improved solubility, permeability and pharmacokinetic performance. J. Pharm. Investig. 2019, 49, 67–85. [Google Scholar] [CrossRef]
  40. Traul, K.; Driedger, A.; Ingle, D.; Nakhasi, D. Review of the toxicologic properties of medium-chain triglycerides. Food Chem. Toxicol. 2000, 38, 79–98. [Google Scholar] [CrossRef]
  41. Smail, S.S.; Ghareeb, M.M.; Omer, H.K.; Al-Kinani, A.A.; Alany, R.G. Studies on surfactants, cosurfactants, and oils for prospective use in formulation of ketorolac tromethamine ophthalmic nanoemulsions. Pharmaceutics 2021, 13, 467. [Google Scholar] [CrossRef] [PubMed]
  42. Jeong, I.J.; Kim, K.J. An interactive desirability function method to multiresponse optimization. Eur. J. Oper. Res. 2009, 195, 412–426. [Google Scholar] [CrossRef]
  43. Hasniyati, M.R.; Zuhailawati, H.; Ramakrishnan, S. A statistical prediction of multiple responses using overlaid contour plot on hydroxyapatite coated magnesium via cold spray deposition. Procedia Chem. 2016, 19, 181–188. [Google Scholar] [CrossRef]
  44. Khor, C.; Jaafar, M.B.; Ramakrishnan, S. Optimization of conductive thin film epoxy composites properties using desirability optimization methodology. J. Optim. 2016, 2016, 1652928. [Google Scholar] [CrossRef]
  45. Kuk, D.-H.; Ha, E.-S.; Ha, D.-H.; Sim, W.-Y.; Lee, S.-K.; Jeong, J.-S.; Kim, J.-S.; Baek, I.-H.; Park, H.; Choi, D.H. Development of a resveratrol nanosuspension using the antisolvent precipitation method without solvent removal, based on a quality by design (QbD) approach. Pharmaceutics 2019, 11, 688. [Google Scholar] [CrossRef]
  46. Balakumar, K.; Raghavan, C.V.; Abdu, S. Self nanoemulsifying drug delivery system (SNEDDS) of rosuvastatin calcium: Design, formulation, bioavailability and pharmacokinetic evaluation. Colloids Surf. B Biointerfaces 2013, 112, 337–343. [Google Scholar] [CrossRef] [PubMed]
  47. Leone, G.; Pepi, S.; Consumi, M.; Mahdizadeh, F.F.; Lamponi, S.; Magnani, A. Phosphorylated xanthan gum-Ag (I) complex as antibacterial viscosity enhancer for eye drops formulation. Carbohydr. Polym. 2021, 267, 118196. [Google Scholar] [CrossRef]
  48. Song, Y.; Nagai, N.; Saijo, S.; Kaji, H.; Nishizawa, M.; Abe, T. In situ formation of injectable chitosan-gelatin hydrogels through double crosslinking for sustained intraocular drug delivery. Mater. Sci. Eng. C 2018, 88, 1–12. [Google Scholar] [CrossRef]
  49. Resch, M.D.; Resch, B.E.; Csizmazia, E.; Imre, L.; Németh, J.; Révész, P.; Csányi, E. Permeability of human amniotic membrane to ofloxacin in vitro. Investig. Ophthalmol. Vis. Sci. 2010, 51, 1024–1027. [Google Scholar] [CrossRef]
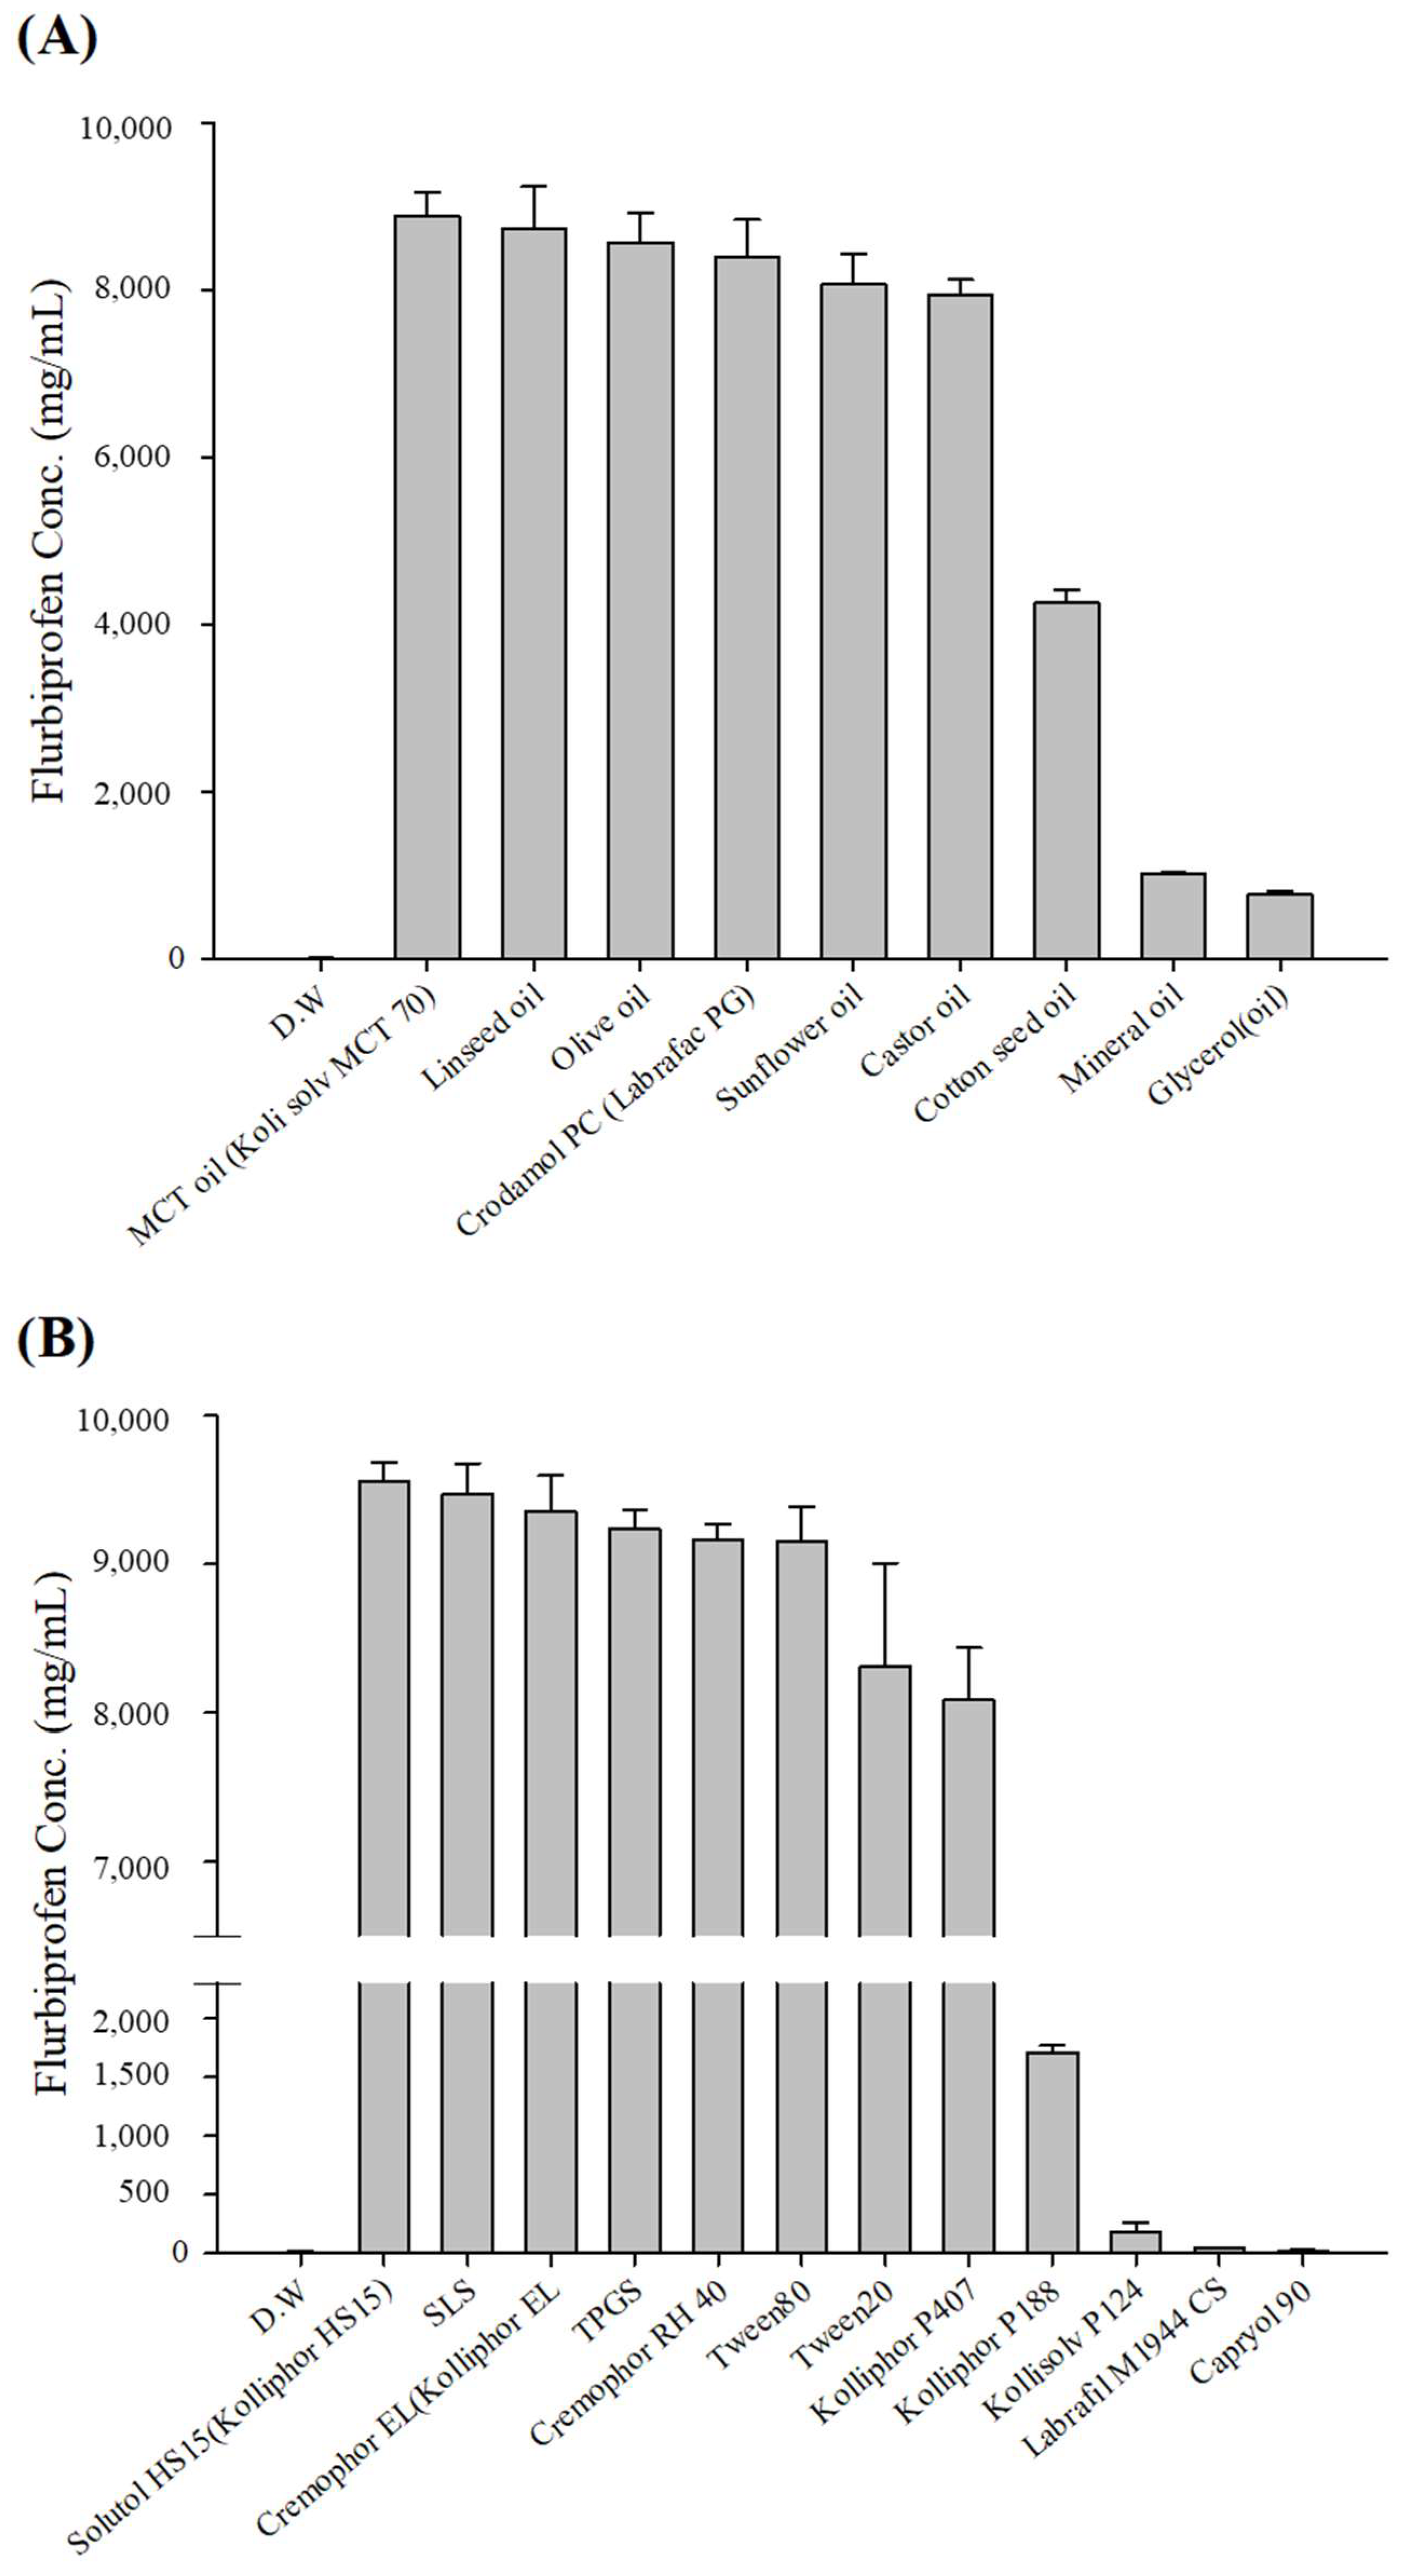
Figure 1. Solubility of FLU in various (A) oils and (B) 10% (w/v) surfactants.
Pharmaceutics 17 00629 g001
Figure 2. Pseudo-ternary diagram of Kollisolv MCT 70, Solutol HS 15, and Labrafil M1944CS (w/w/w).
Pharmaceutics 17 00629 g002
Figure 3. (A) Contour plot, (B) surface plot, and (C) Pareto chart for Y1 particle size.
Pharmaceutics 17 00629 g003
Figure 4. (A) Contour plot, (B) surface plot, and (C) Pareto chart for Y2 PDI.
Pharmaceutics 17 00629 g004aPharmaceutics 17 00629 g004b
Figure 5. (A) Contour plot, (B) surface plot, and (C) Pareto chart for Y4 transmittance.
Pharmaceutics 17 00629 g005aPharmaceutics 17 00629 g005b
Figure 6. Optimized process variables (desirability function analysis).
Pharmaceutics 17 00629 g006
Figure 7. Overlaid contour plots depicting the design space.
Pharmaceutics 17 00629 g007
Figure 8. Optimized FLU-SNE reproducibility (particle size): (A) monovariance graph and (B) correlation graph.
Pharmaceutics 17 00629 g008
Figure 9. Observation of creaming and caking phase separations for FLU-SNE: (A) initial results and (B) after 48 h.
Pharmaceutics 17 00629 g009
Figure 10. Transmission electron microscopy image of optimized FLU-SNE (20 nm).
Pharmaceutics 17 00629 g010
Figure 11. In vitro release profile of FLU-SNE and drug dispersion.
Pharmaceutics 17 00629 g011
Figure 12. Ex vivo release profile of FLU-SNE and drug dispersion.
Pharmaceutics 17 00629 g012
Table 1. Factor levels of the Box–Behnken design.
Level
Factor−1 (Low)+1 (High)
X1: Oil weight (mg)1020
X2: Surfactant weight (mg)4080
X3: Co-surfactant weight (mg)1050
Table 2. Factor levels and responses of the Box–Behnken design.
X1X2X3Y1Y2
Oil
(mg)
Surfactant
(mg)
Co-Surfactant
(mg)
Particle Size
(nm)
PDI
123123
20803034.3832.9832.330.1000.0890.091
20605072.6770.1269.980.2370.2310.239
20601023.1622.5822.560.0710.0470.047
204030105.4099.5597.090.2140.2130.226
15805037.9336.6236.410.1230.1100.101
15801023.7122.3422.140.0610.0720.053
15603038.0836.5536.300.1110.1140.111
15603035.0135.3135.250.1140.1170.120
15603038.8037.4937.140.1350.1100.111
15405093.5790.0688.480.2040.2000.189
15401039.2038.0137.630.1120.1170.108
10803027.6126.2425.960.0670.0820.083
10605045.3444.0143.650.1590.160.174
10601032.3030.8230.490.1110.1160.116
10403059.4258.0857.760.2290.2300.225
X1X2X3Y3Y4
Oil
(mg)
Surfactant
(mg)
Co-Surfactant
(mg)
Zeta Potential (mV)
(Absolute Value)
Transmittance
(%)
121212
2080301.3100.4441.3100.4441.3100.444
2060504.2206.2704.2206.2704.2206.270
2060103.2701.2503.2701.2503.2701.250
2040300.4830.1130.4830.1130.4830.113
1580502.5800.2862.5800.2862.5800.286
1580100.1780.9510.1780.9510.1780.951
1560301.8802.3901.8802.3901.8802.390
1560302.1503.0502.1503.0502.1503.050
1560300.3730.2580.3730.2580.3730.258
1540500.2750.2150.2750.2150.2750.215
1540100.7663.8400.7663.8400.7663.840
1080300.8930.6000.8930.6000.8930.600
1060501.2701.8001.2701.8001.2701.800
1060100.7241.4100.7241.4100.7241.410
1040305.8202.9005.8202.9005.8202.900
Table 3. Y1 particle size ANOVA results and model summary.
DF *Adj SS *Adj MS *F-Valuep-Value
Model923,321.32591.3115.600.000
Linear Model318,477.56159.2274.770.000
X1: Oil (mg)11685.41685.475.190.000
X2: Surfactant (mg)110,651.310,651.3475.170.000
X3: Co-Surfactant (mg)16140.86140.8273.950.000
Quadratic Model31878.8626.327.940.000
X1: Oil21483483.021.550.000
X2: Surfactant211457.61457.665.030.000
X3: Co-Surfactant2110.110.10.450.506
Two-Factor
Interaction
32965988.344.090.000
X1: Oil ·
X2: Surfactant
1952.3952.342.480.000
X1: Oil ·
X3: Co-Surfactant
1920.2920.241.050.000
X2: Surfactant ·
X3: Co-Surfactant
11092.51092.548.740.000
SR2R2 (Retouch)R2 (Prediction)
4.7345196.75%95.91%94.24%
* DF: Degrees of Freedom, Adj SS: Adjusted Sum of Squares, Adj MS: Adjusted Mean Squares.
Table 4. Y2 PDI ANOVA results and model summary.
DFAdj SSAdj MSF-Valuep-Value
Model90.1364590.01516243.430.000
Linear Model30.1122650.037422107.180.000
X1: Oil (mg)10.0002040.0002040.580.450
X2: Surfactant (mg)10.0635510.063551182.030.000
X3: Co-Surfactant (mg)10.0485100.048510138.940.000
Quadratic Model30.0109830.00366110.490.000
X1: Oil210.0103420.01034229.620.000
X2: Surfactant210.0006460.0006461.850.182
X3: Co-Surfactant210.0000800.0000800.230.634
Two-Factor
Interaction
30.0132110.00440412.610.000
X1: Oil ·
X2: Surfactant
10.0005200.0005201.490.230
X1: Oil ·
X3: Co-Surfactant
10.0117190.01171933.570.000
X2: Surfactant ·
X3: Co-Surfactant
10.0009720.0009722.780.104
SR2R2 (Retouch)R2 (Prediction)
0.018685191.78%89.67%85.56%
Table 5. Y4 transmittance ANOVA results and model summary.
DFAdj SSAdj MSF-Valuep-Value
Model918,204.72022.7574.210.000
Linear Model310,620.83540.28129.880.000
X1: Oil (mg)1870.1870.1131.920.000
X2: Surfactant (mg)16838.06838.02250.860.000
X3: Co-Surfactant (mg)12912.72912.72106.860.000
Quadratic Model3591.2197.087.230.001
X1: Oil21256.1256.069.390.004
X2: Surfactant21379.5379.4613.920.001
X3: Co-Surfactant214.54.490.160.687
Two-Factor
Interaction
36992.62330.8885.510.000
X1: Oil ·
X2: Surfactant
124.724.710.910.348
X1: Oil ·
X3: Co-Surfactant
13391.33391.28124.410.000
X2: Surfactant ·
X3: Co-Surfactant
13576.73576.65131.210.000
SR2R2 (Retouch)R2 (Prediction)
5.2209295.02%93.74%91.15%
Table 6. Multiple-response predictions.
FactorSetting
X1: Oil Weight (mg)18.9
X2: Surfactant Weight (mg)70.7
X3: Co-Surfactant Weight (mg)10.0
ResponseSuitable ValueSE Suitable Value95% CI95% PI
Y1: Particle Size (nm)16.822.19(12.37, 21.26)(6.23, 27.41)
Y2: PDI0.0470.009(0.029, 0.064)(0.005, 0.089)
Y4: Transmittance (%)74.582.42(69.68, 79.48)(62.90, 86.26)
Table 7. Evaluation of optimized FLU-SNE.
Particle Size (nm)PDITransmittance (%)
24.89 ± 0.280.068 ± 0.00874.85 ± 5.69
Disclaimer/Publisher’s Note: The statements, opinions and data contained in all publications are solely those of the individual author(s) and contributor(s) and not of MDPI and/or the editor(s). MDPI and/or the editor(s) disclaim responsibility for any injury to people or property resulting from any ideas, methods, instructions or products referred to in the content.