
3D Printing of PVA Capsular Devices for Applications in Compounding Pharmacy: Stability Evaluation and In Vivo Performance

 , , ,
, , ,
Abstract
1. Introduction
2. Materials and Methods
2.1. Materials
2.2. Capsular Devices Design and 3D Printing Process
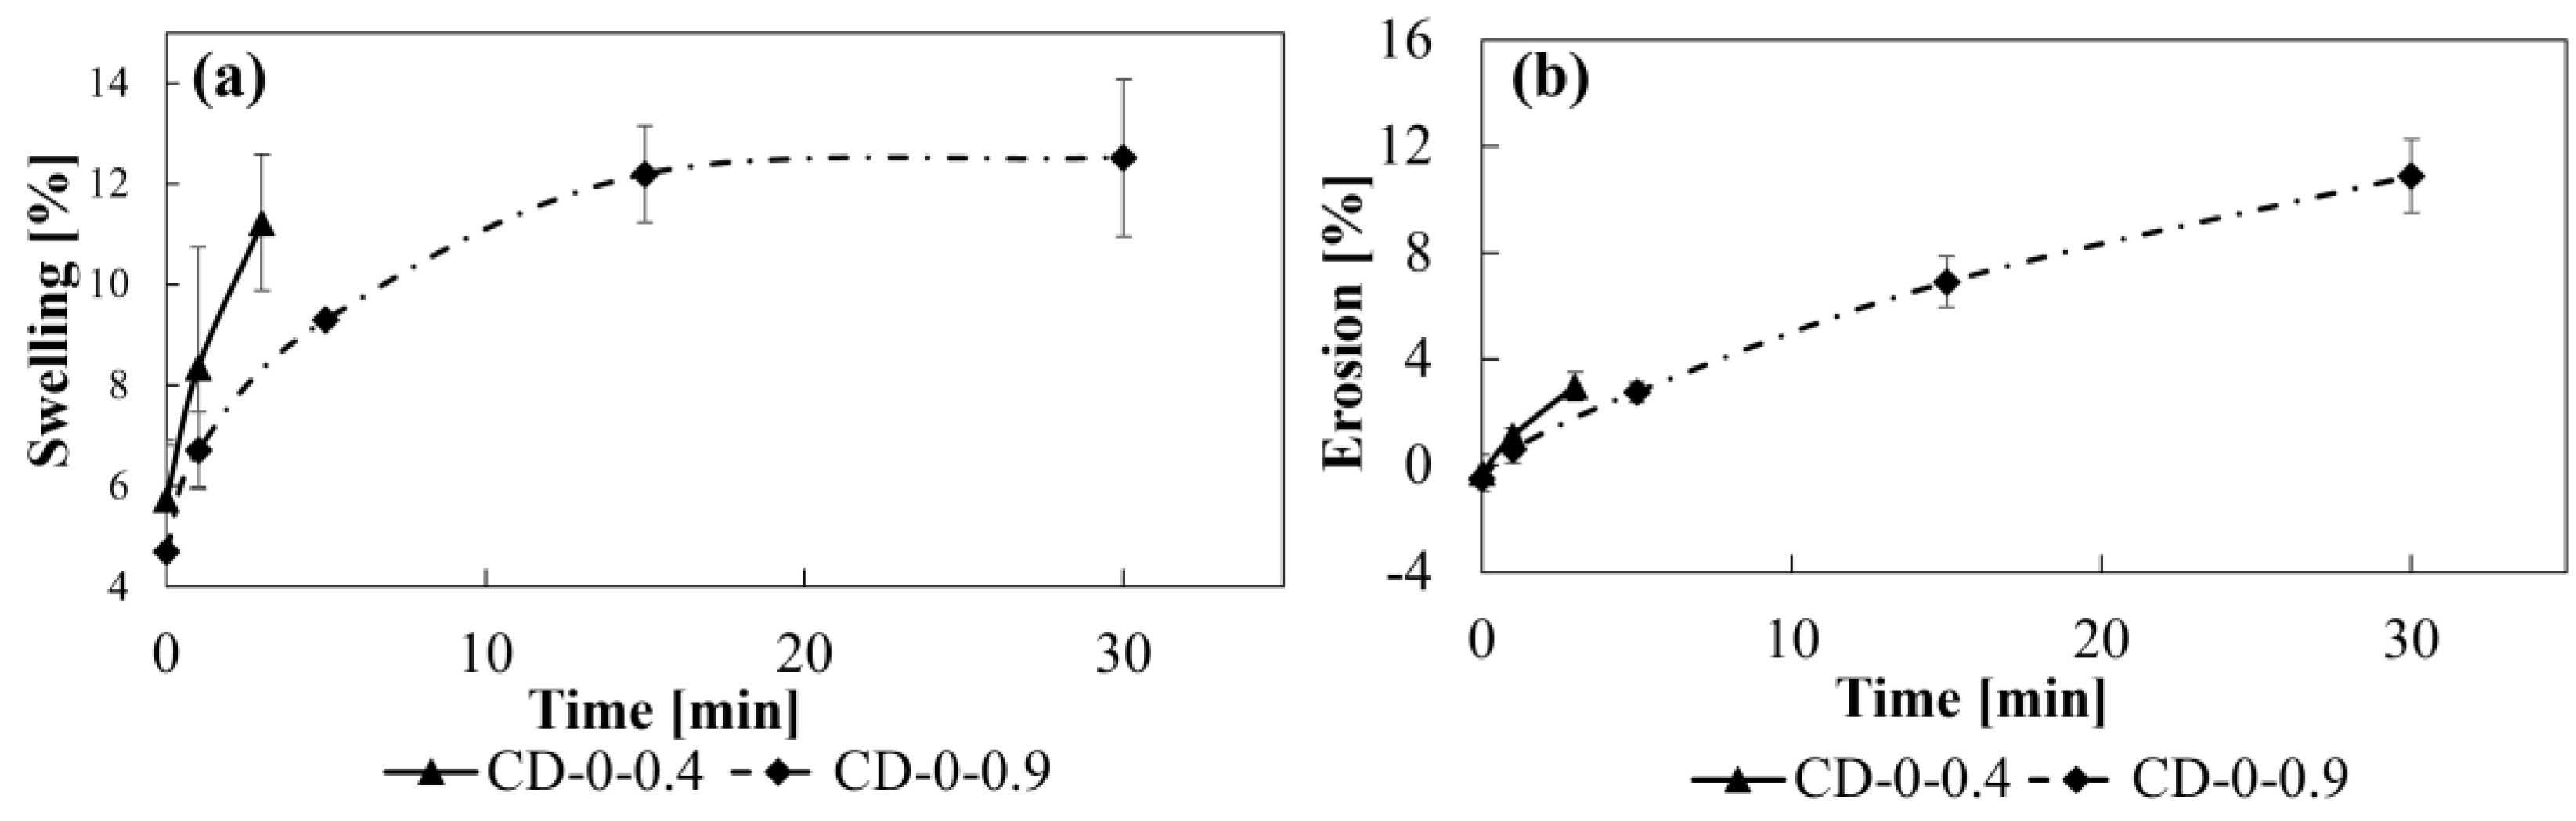
2.3. Swelling and Erosion Studies
- -
- tim for CD–0.4 = 0 min, 1 min, and 3 min;
- -
- tim for CD–0.9 = 0 min, 1 min, 5 min, 15 min, and 30 min.
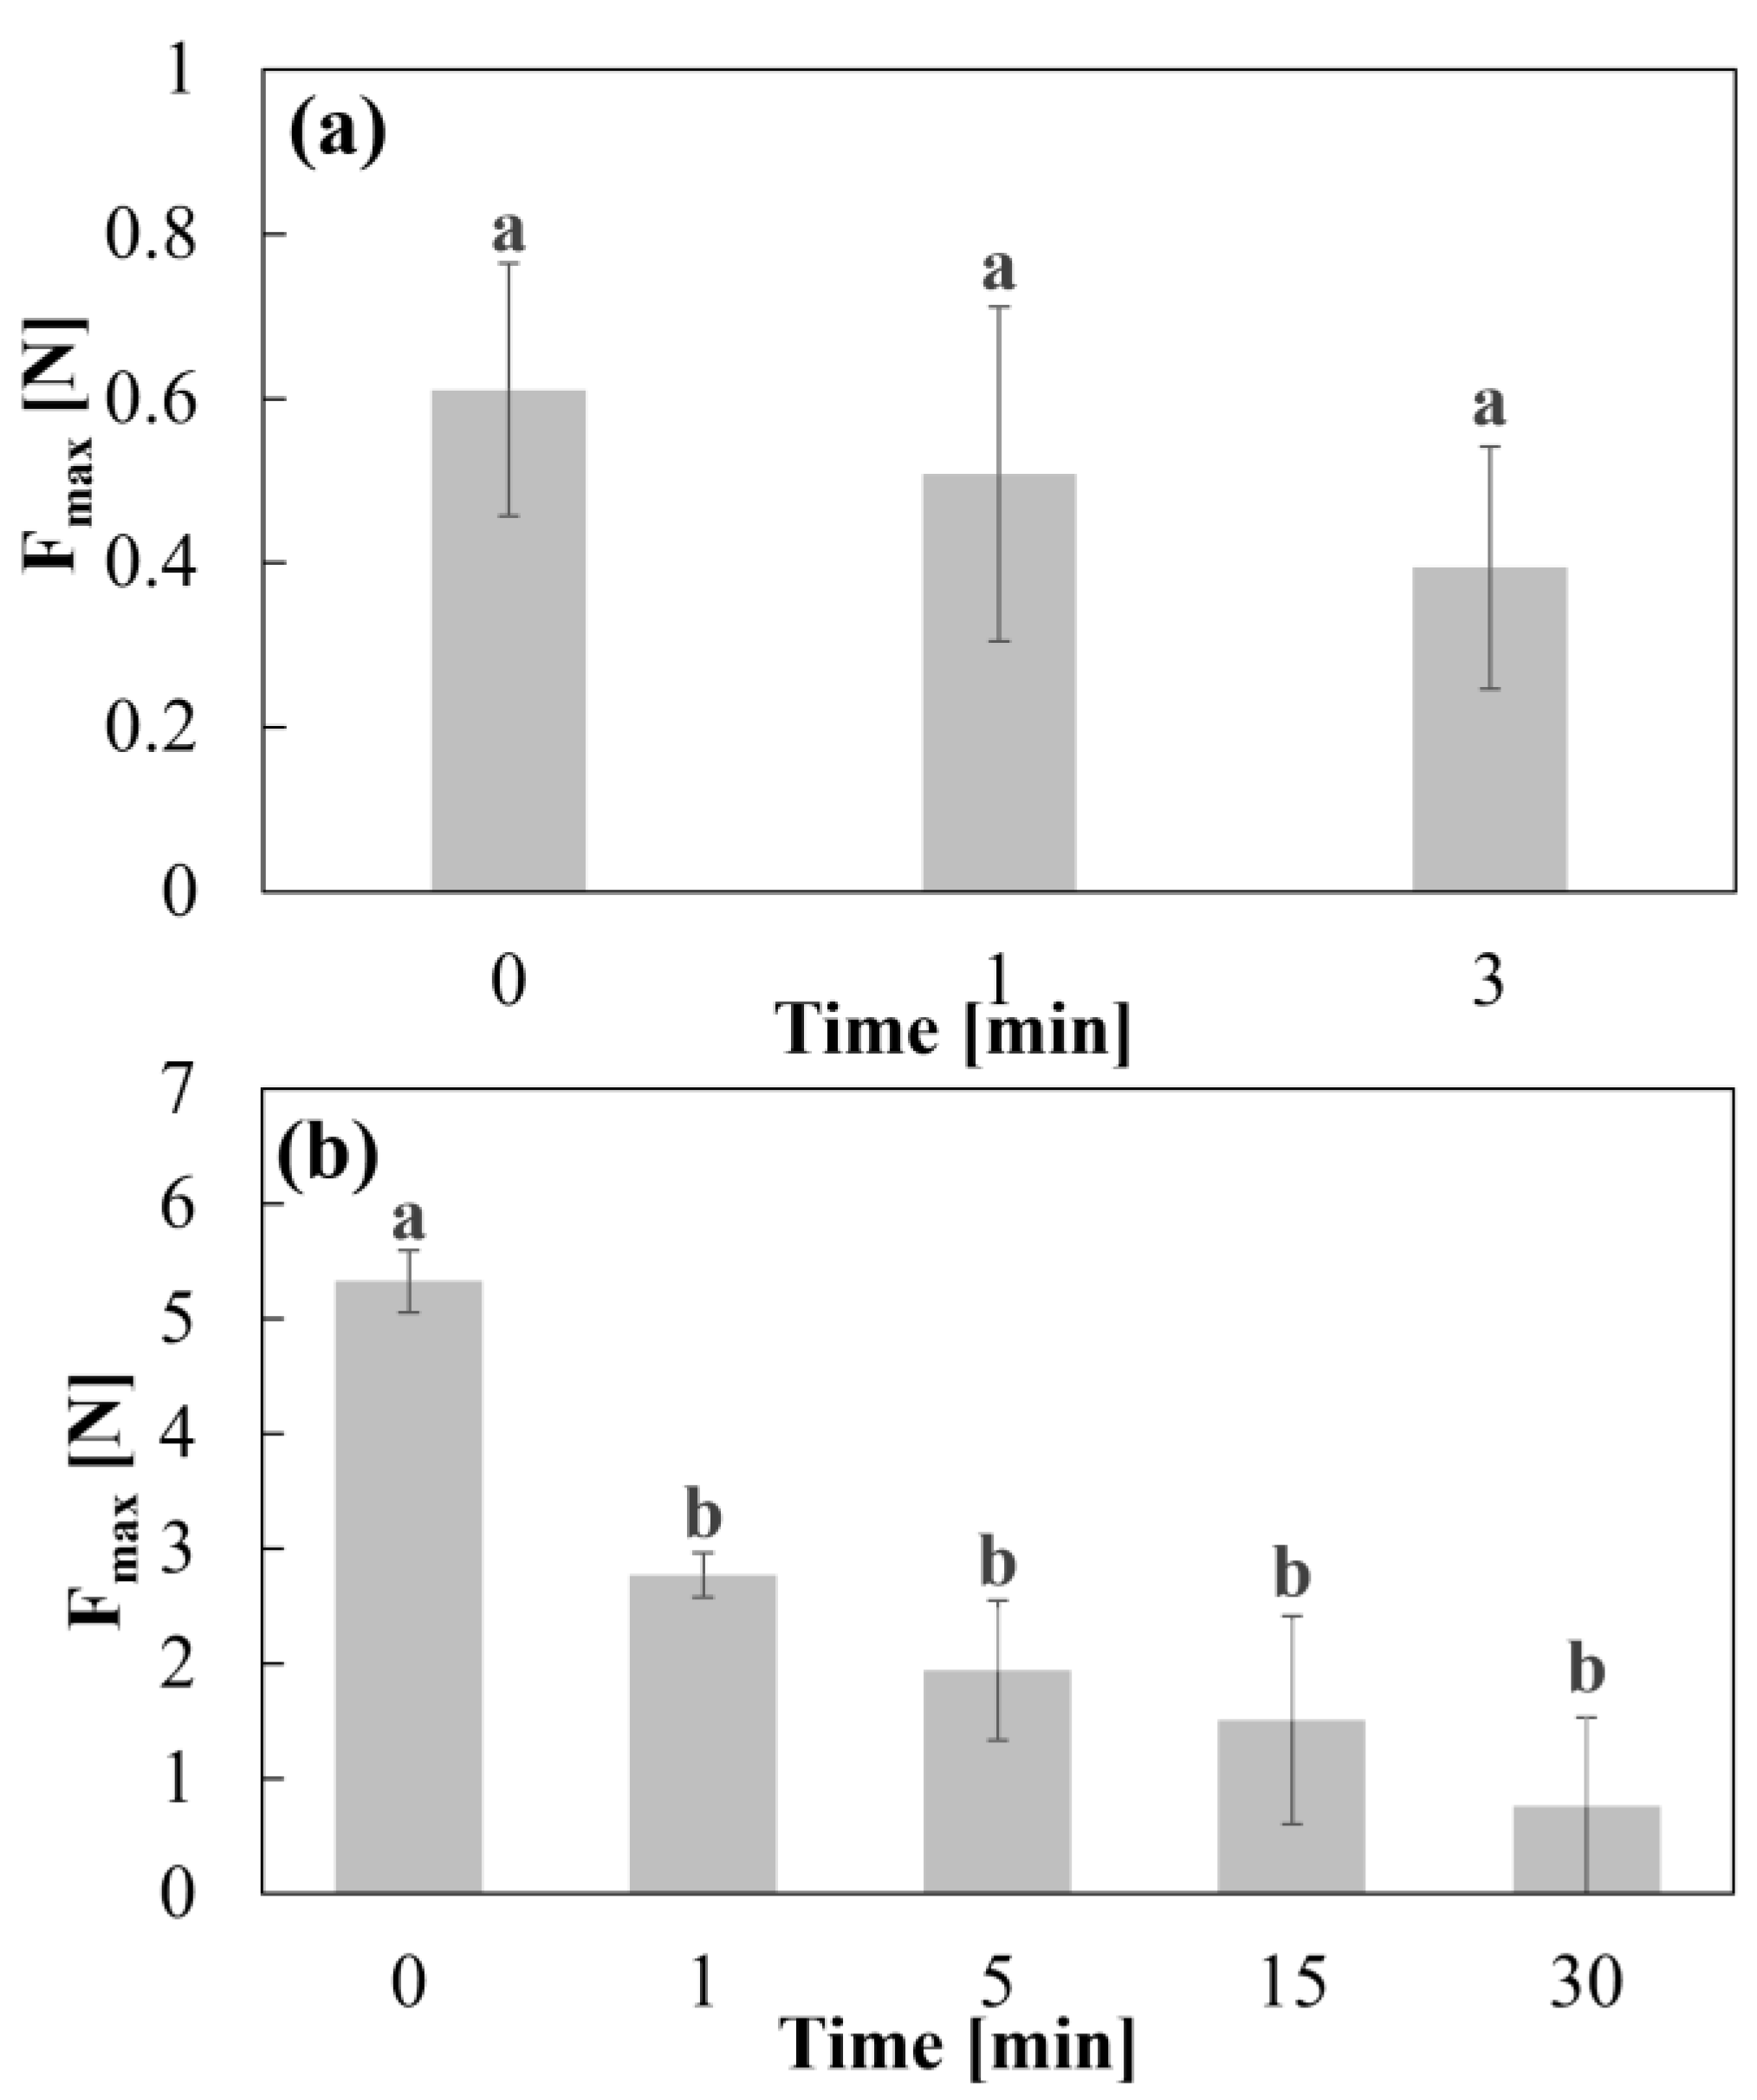
2.4. Adhesion Test
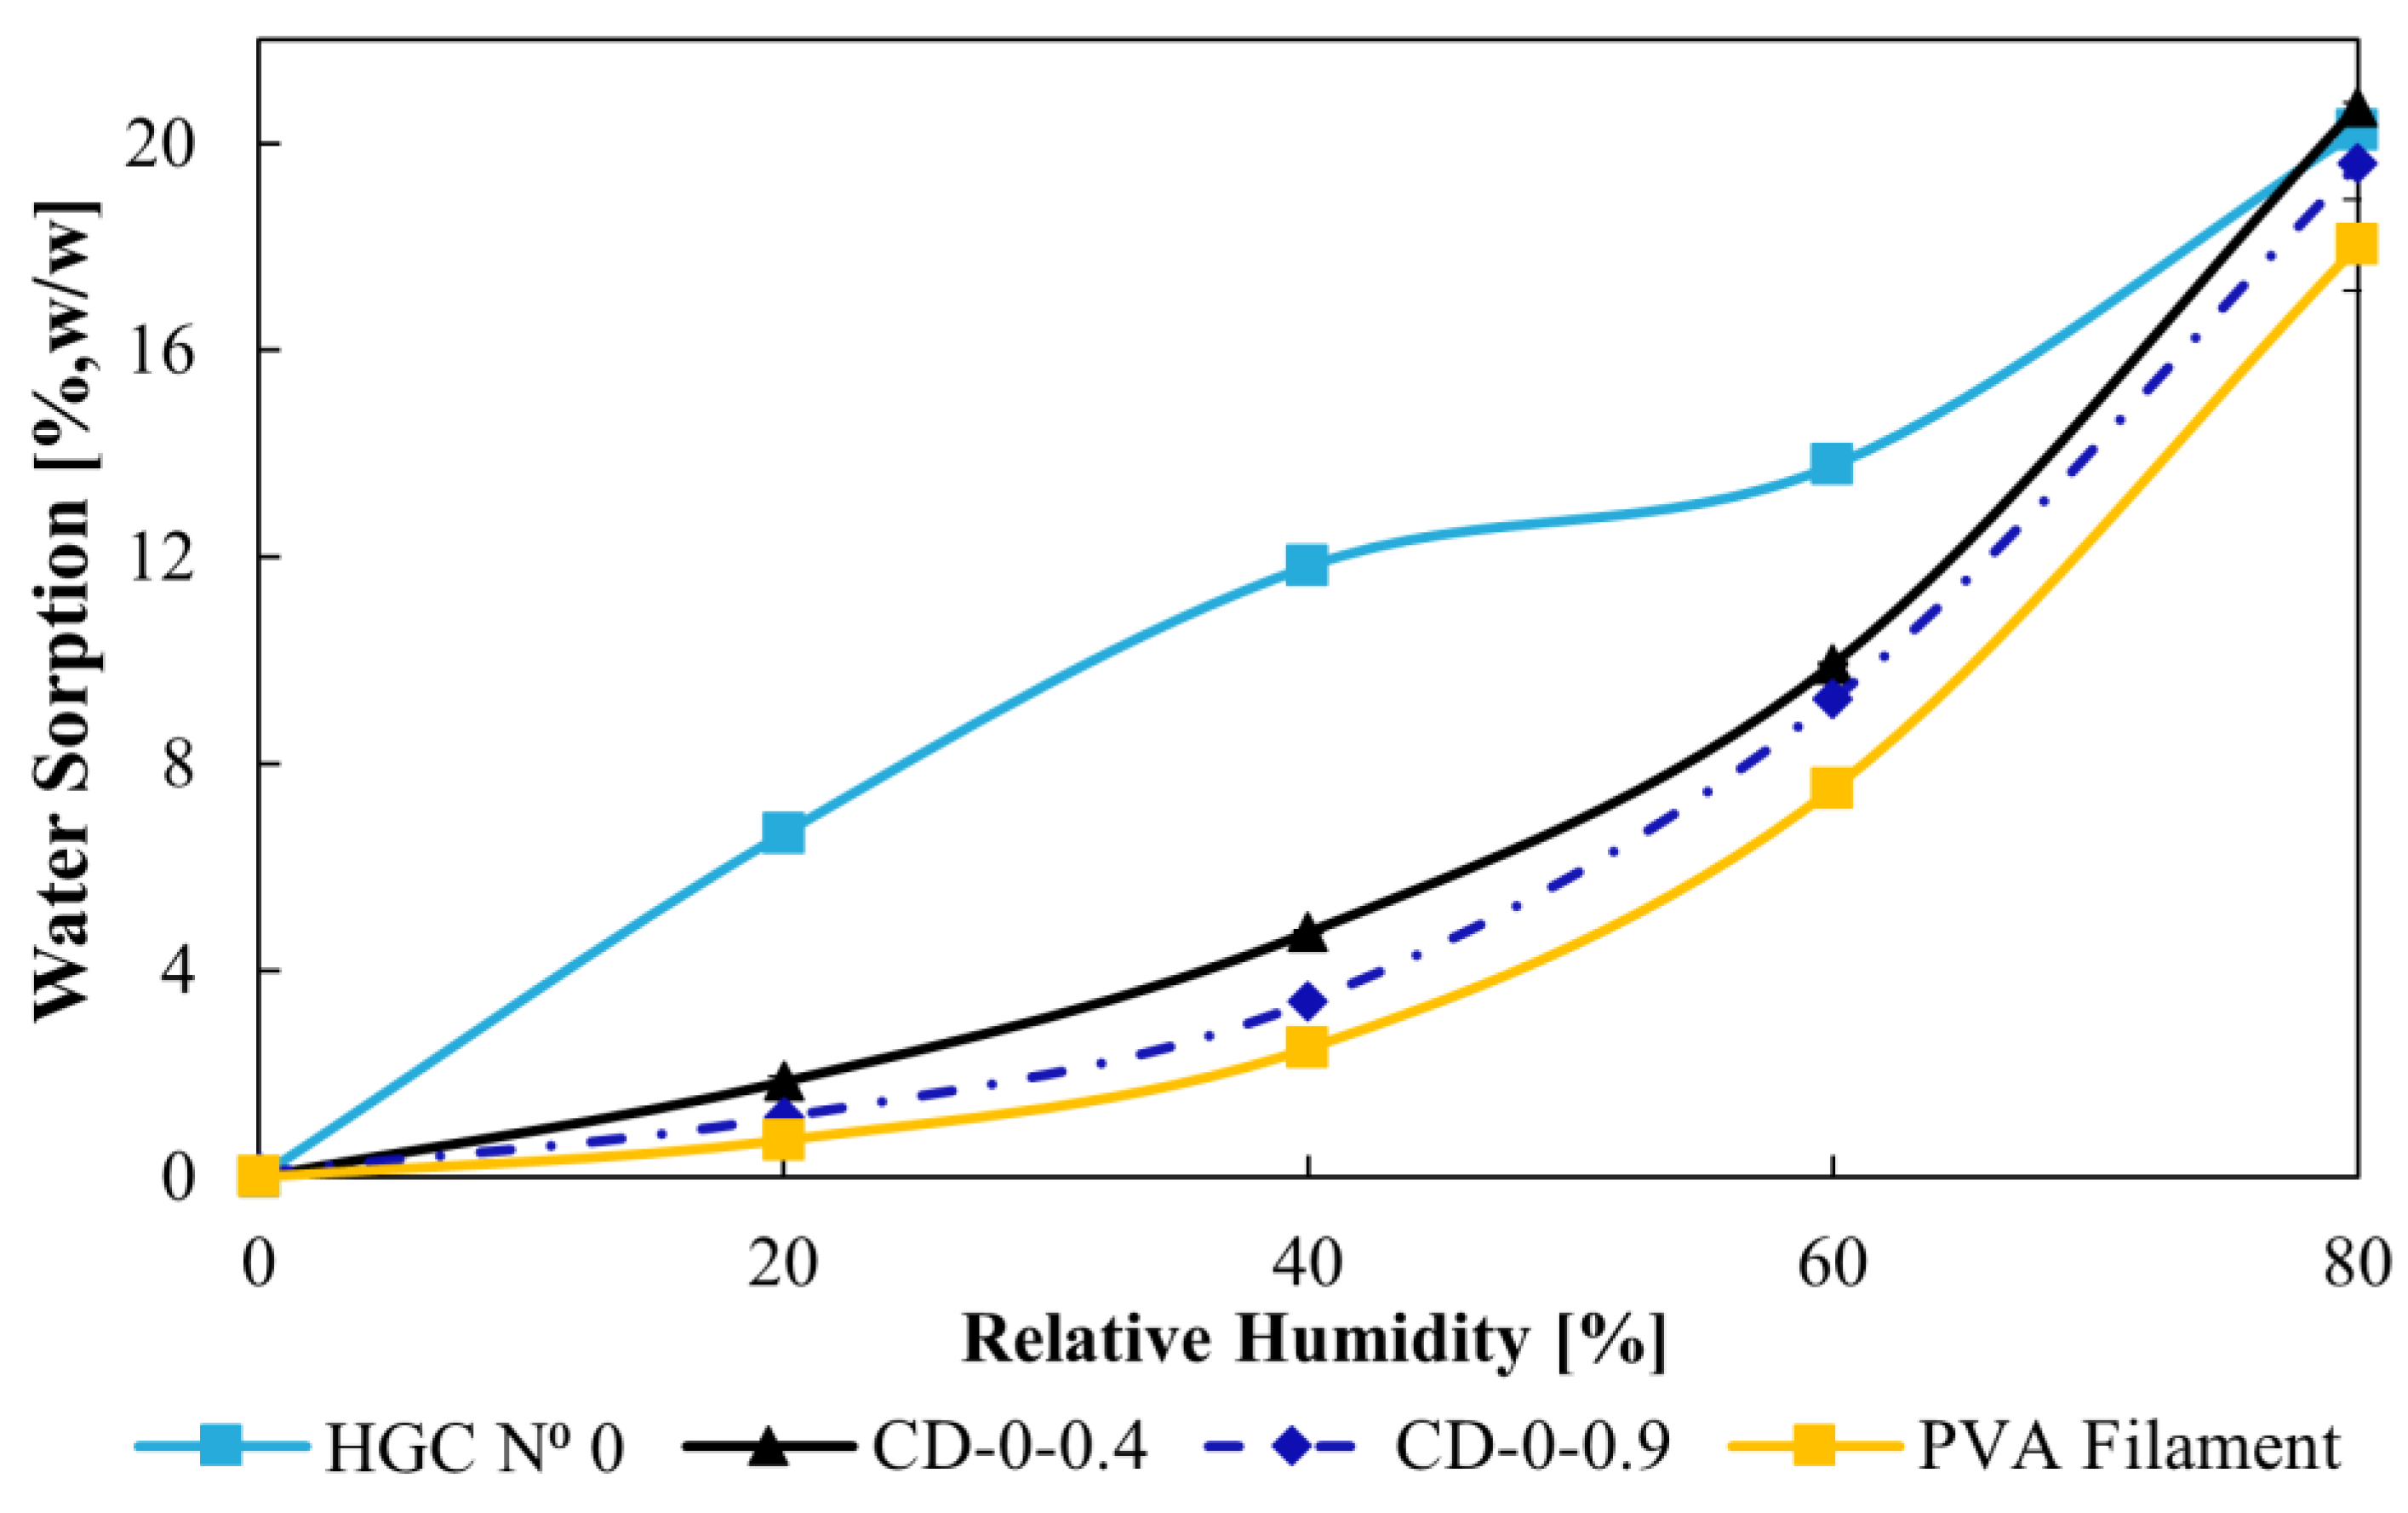
2.5. Water Sorption
2.6. Differential Scanning Calorimetry (DSC)
2.7. Fourier Transform Infrared Spectroscopy (FTIR)
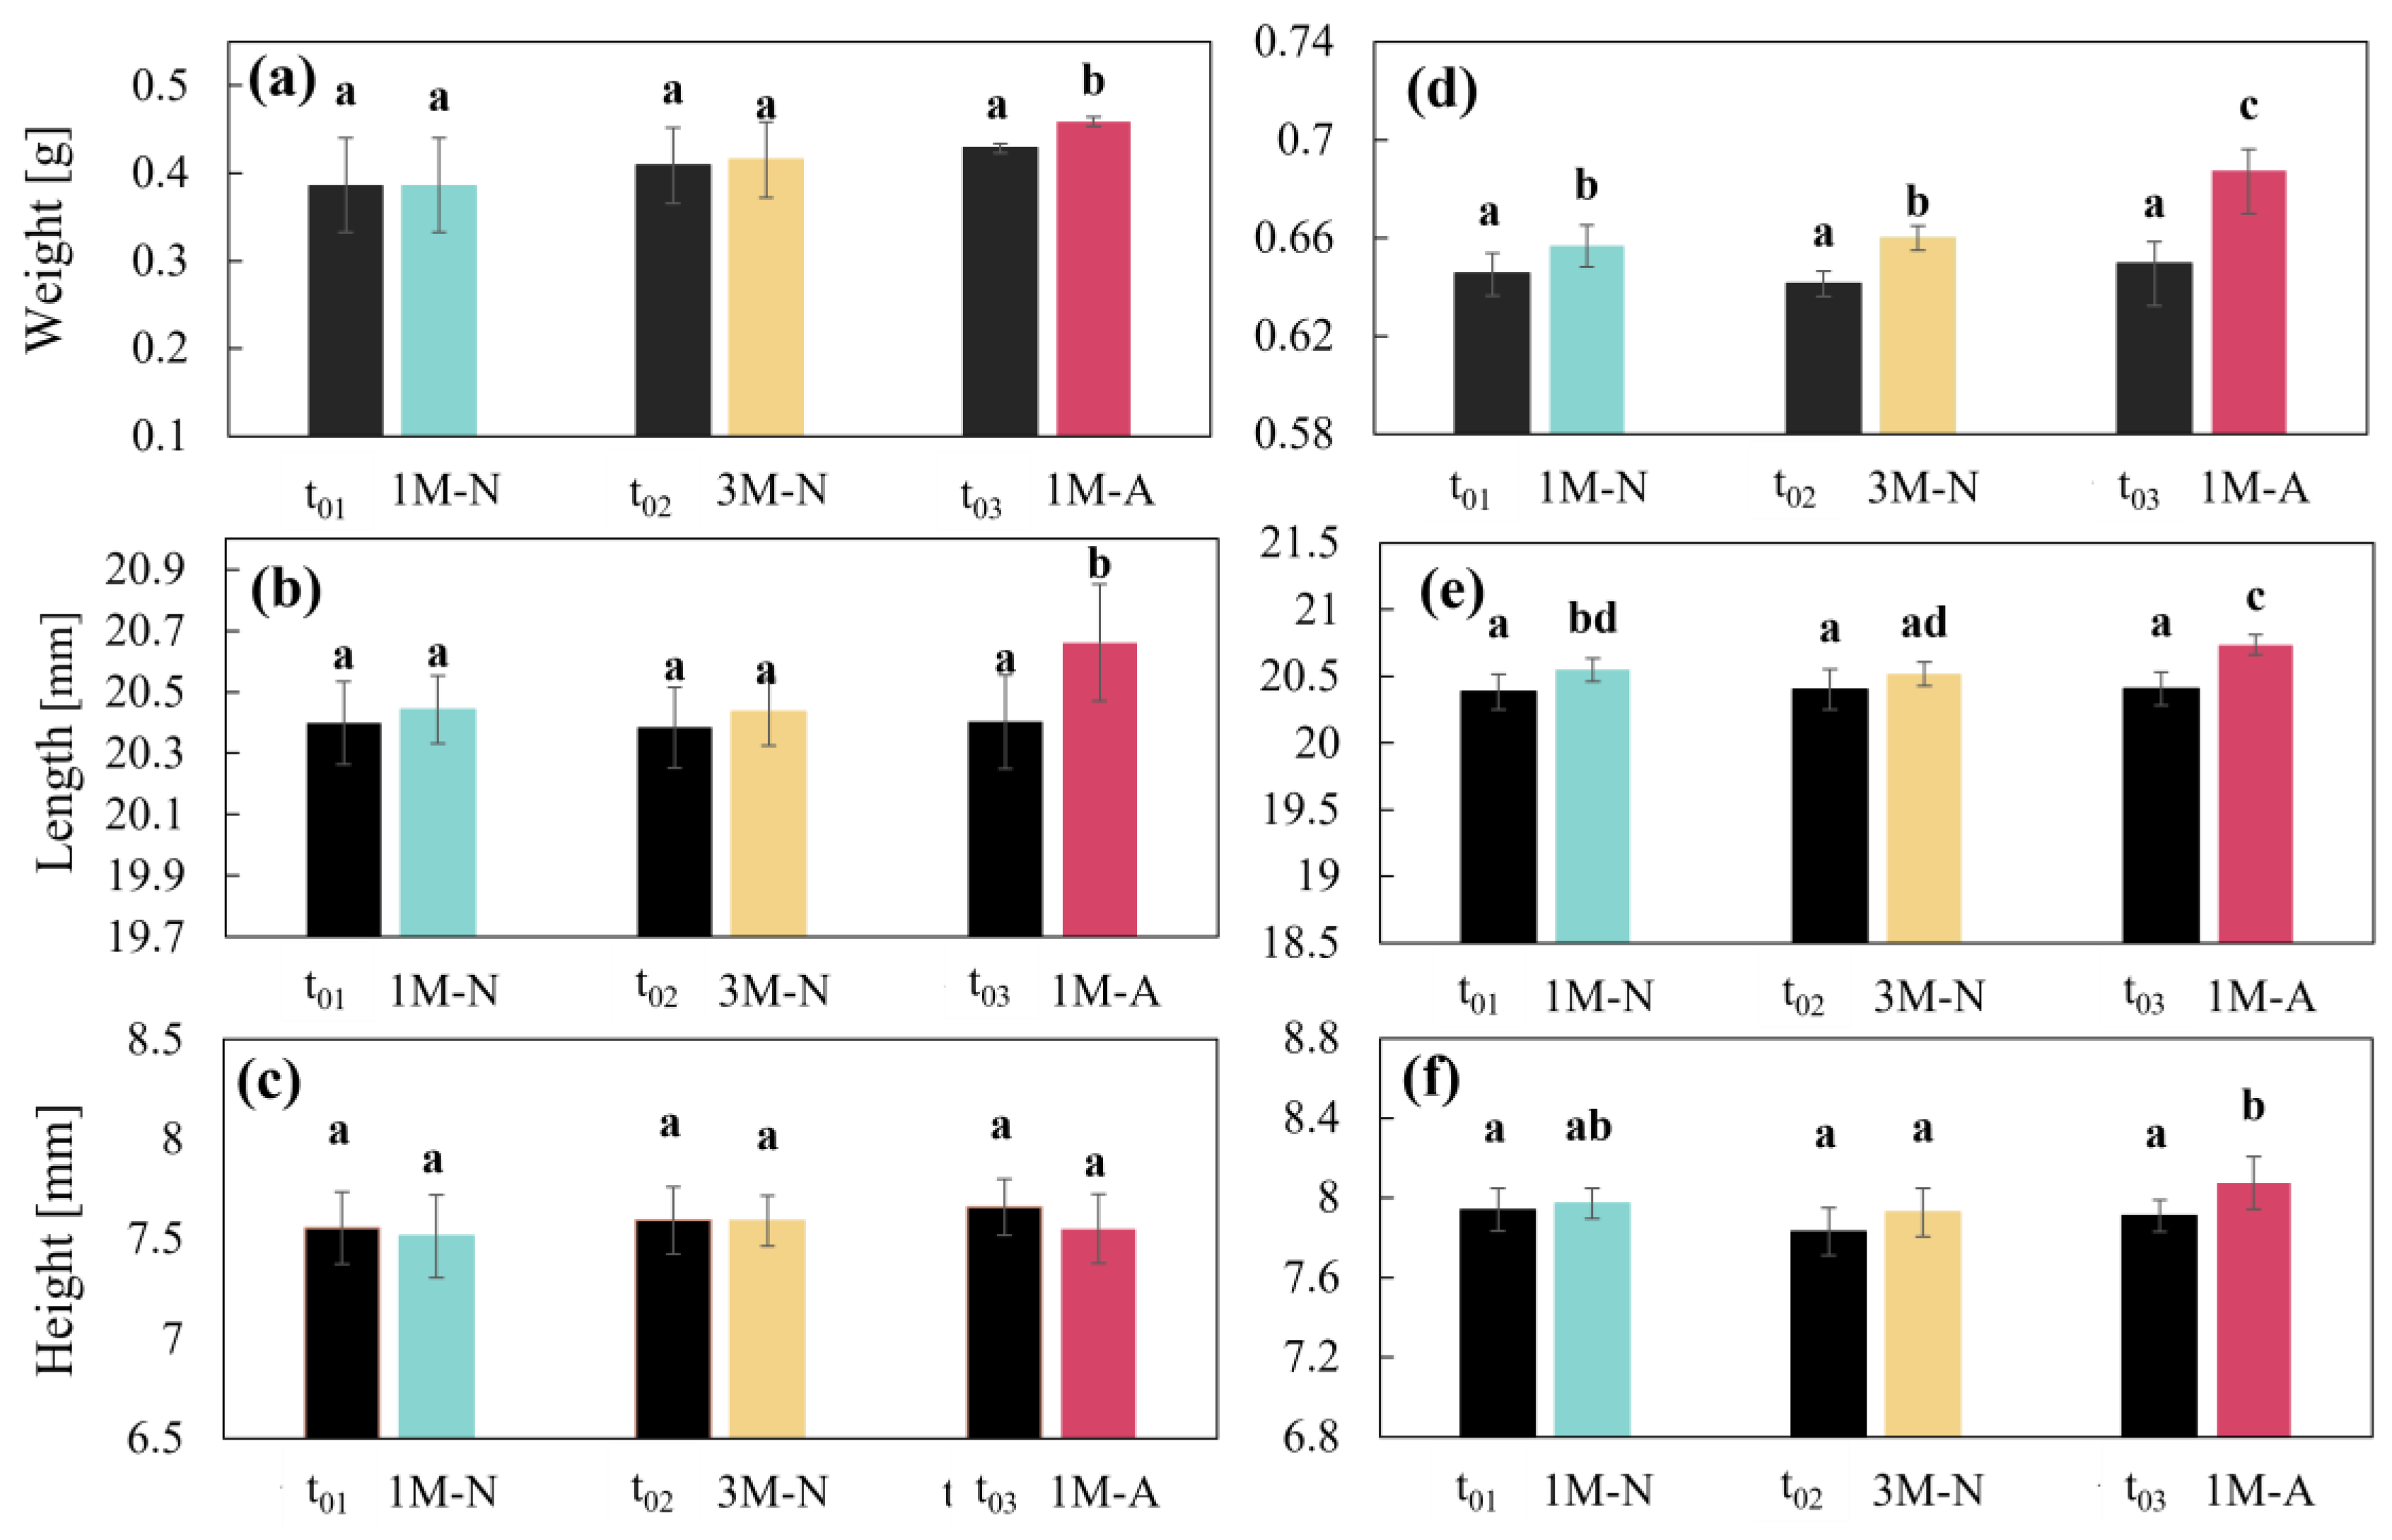
2.8. CDs Weight and Dimensions
2.9. Disintegration Test
2.10. Dissolution Profiles
2.11. Stability Studies
2.12. Statistical Analysis
2.13. In Vivo Studies
3. Results
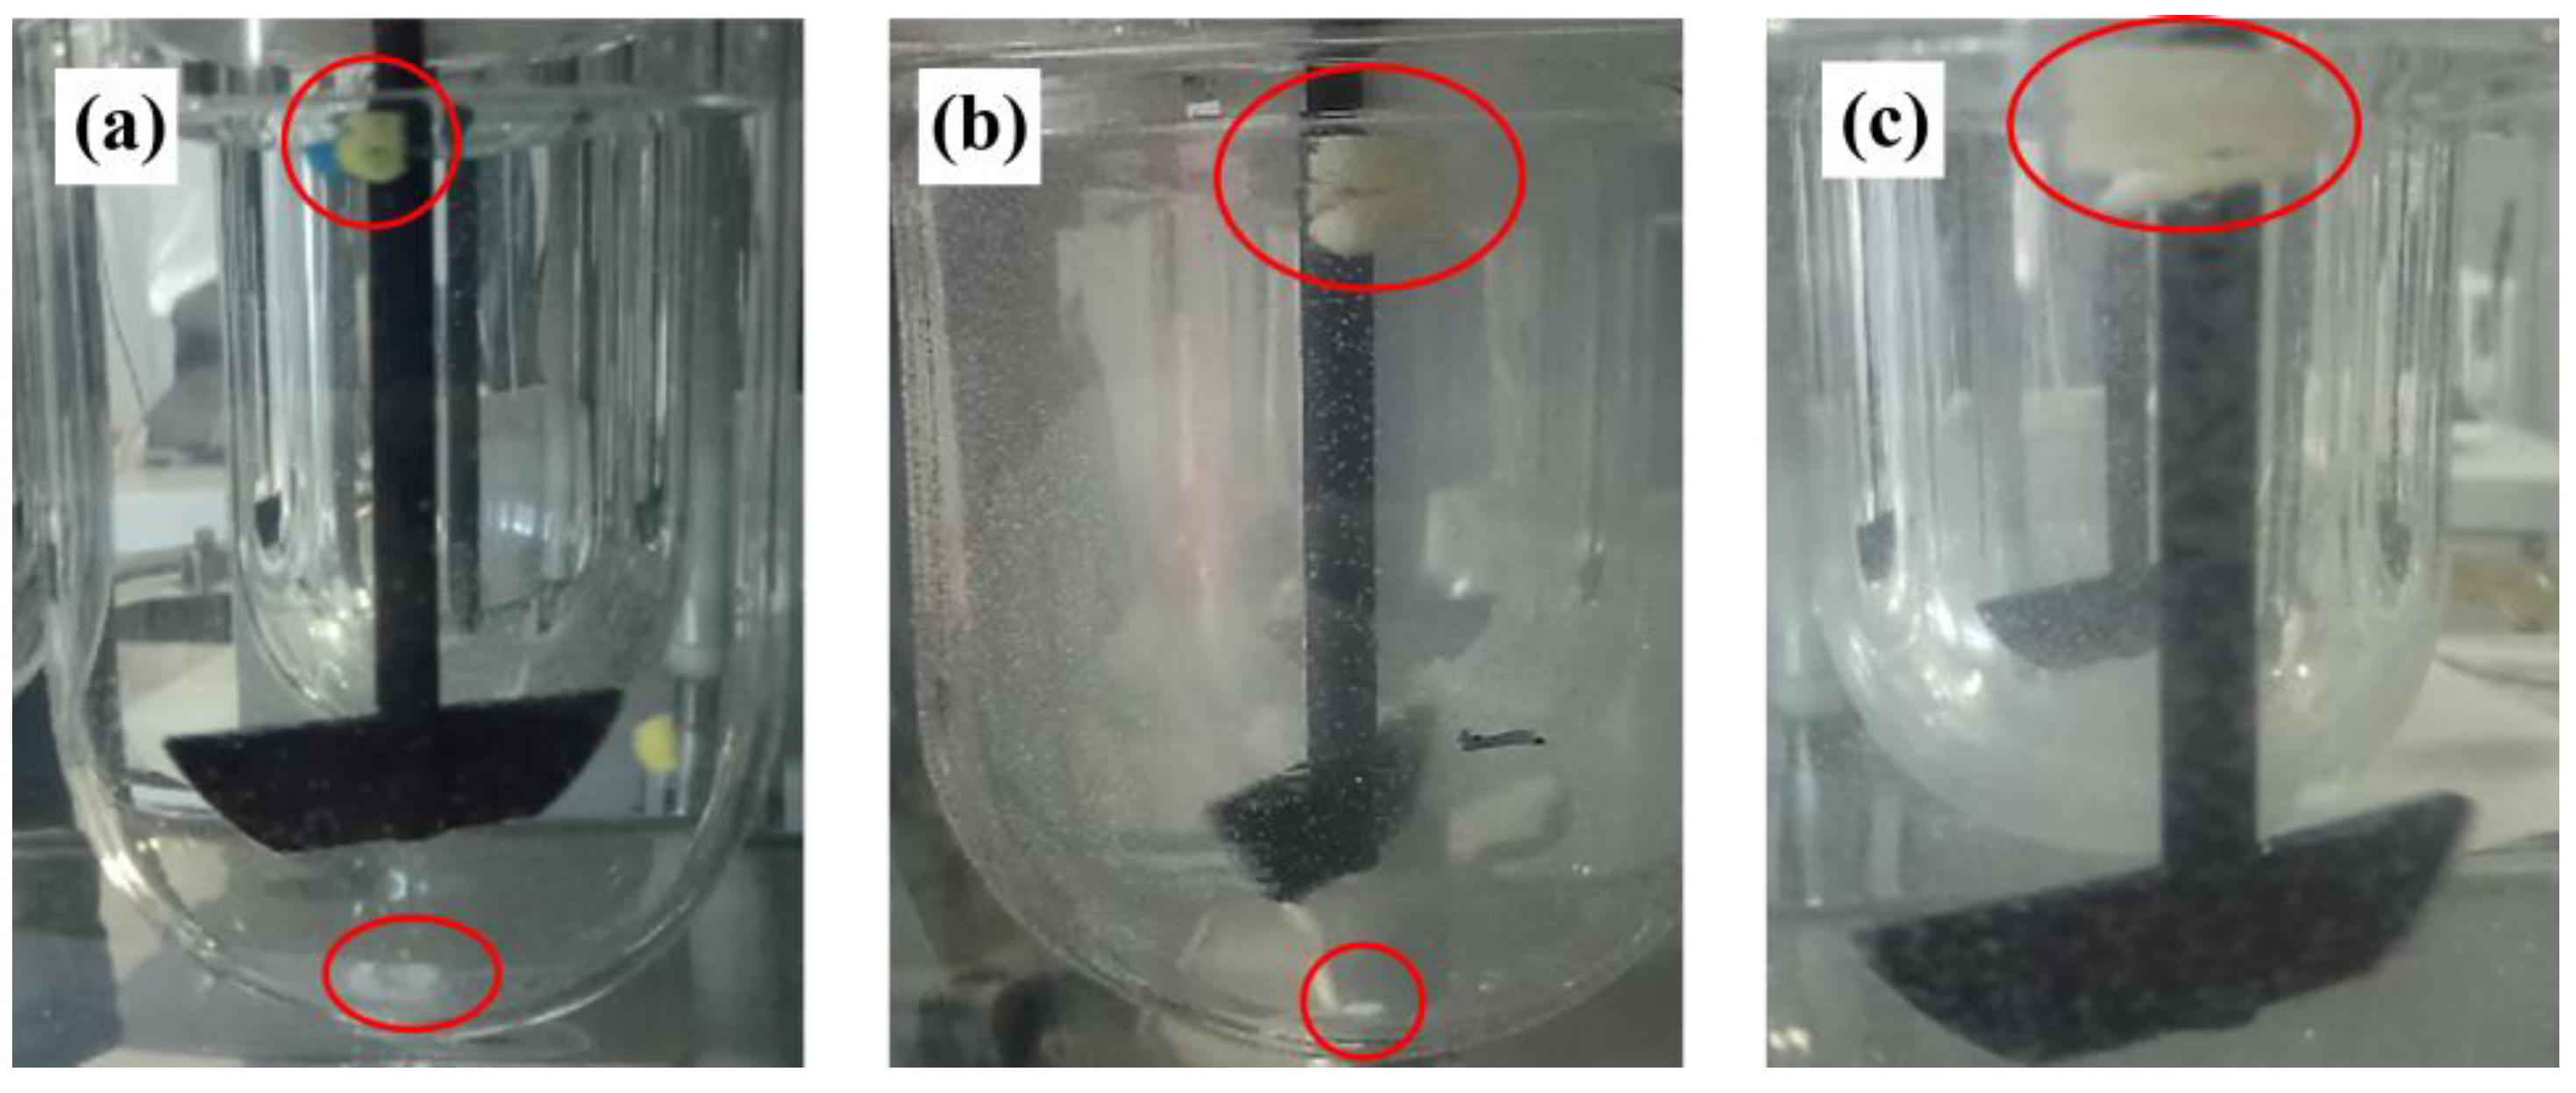
3.1. Swelling/Erosion and Adhesion Studies
3.2. Water Sorption
3.3. Stability Studies
3.3.1. Drug DSC and FTIR
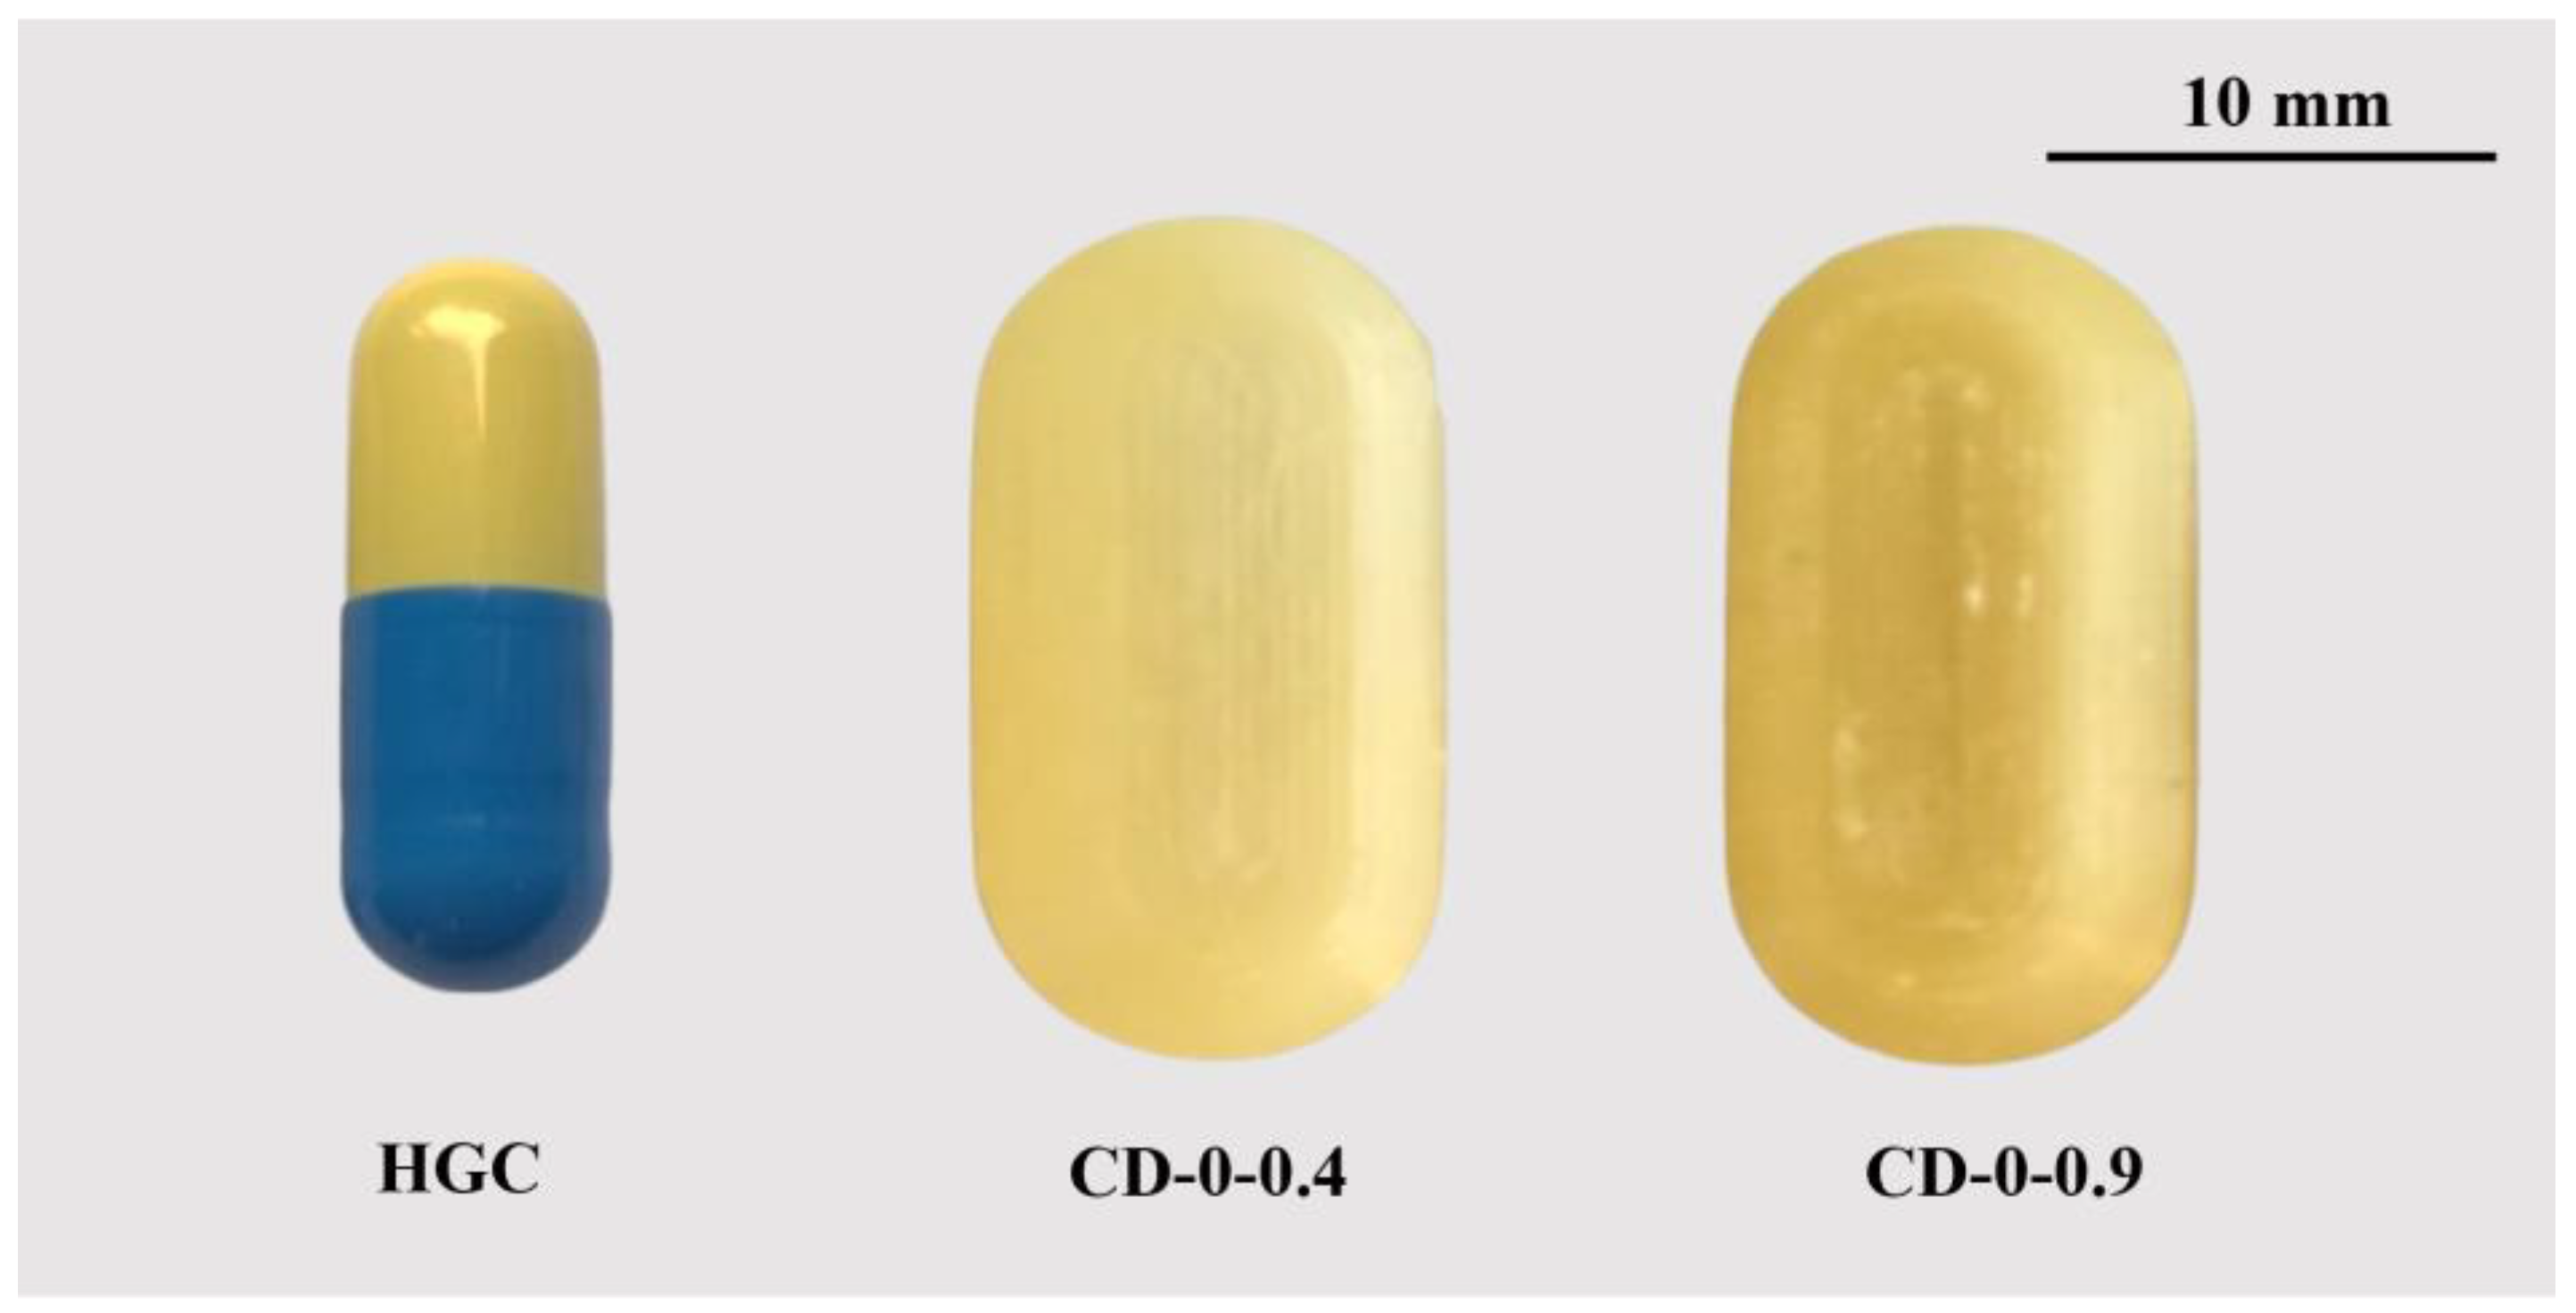
3.3.2. CDs Weight and Dimensions
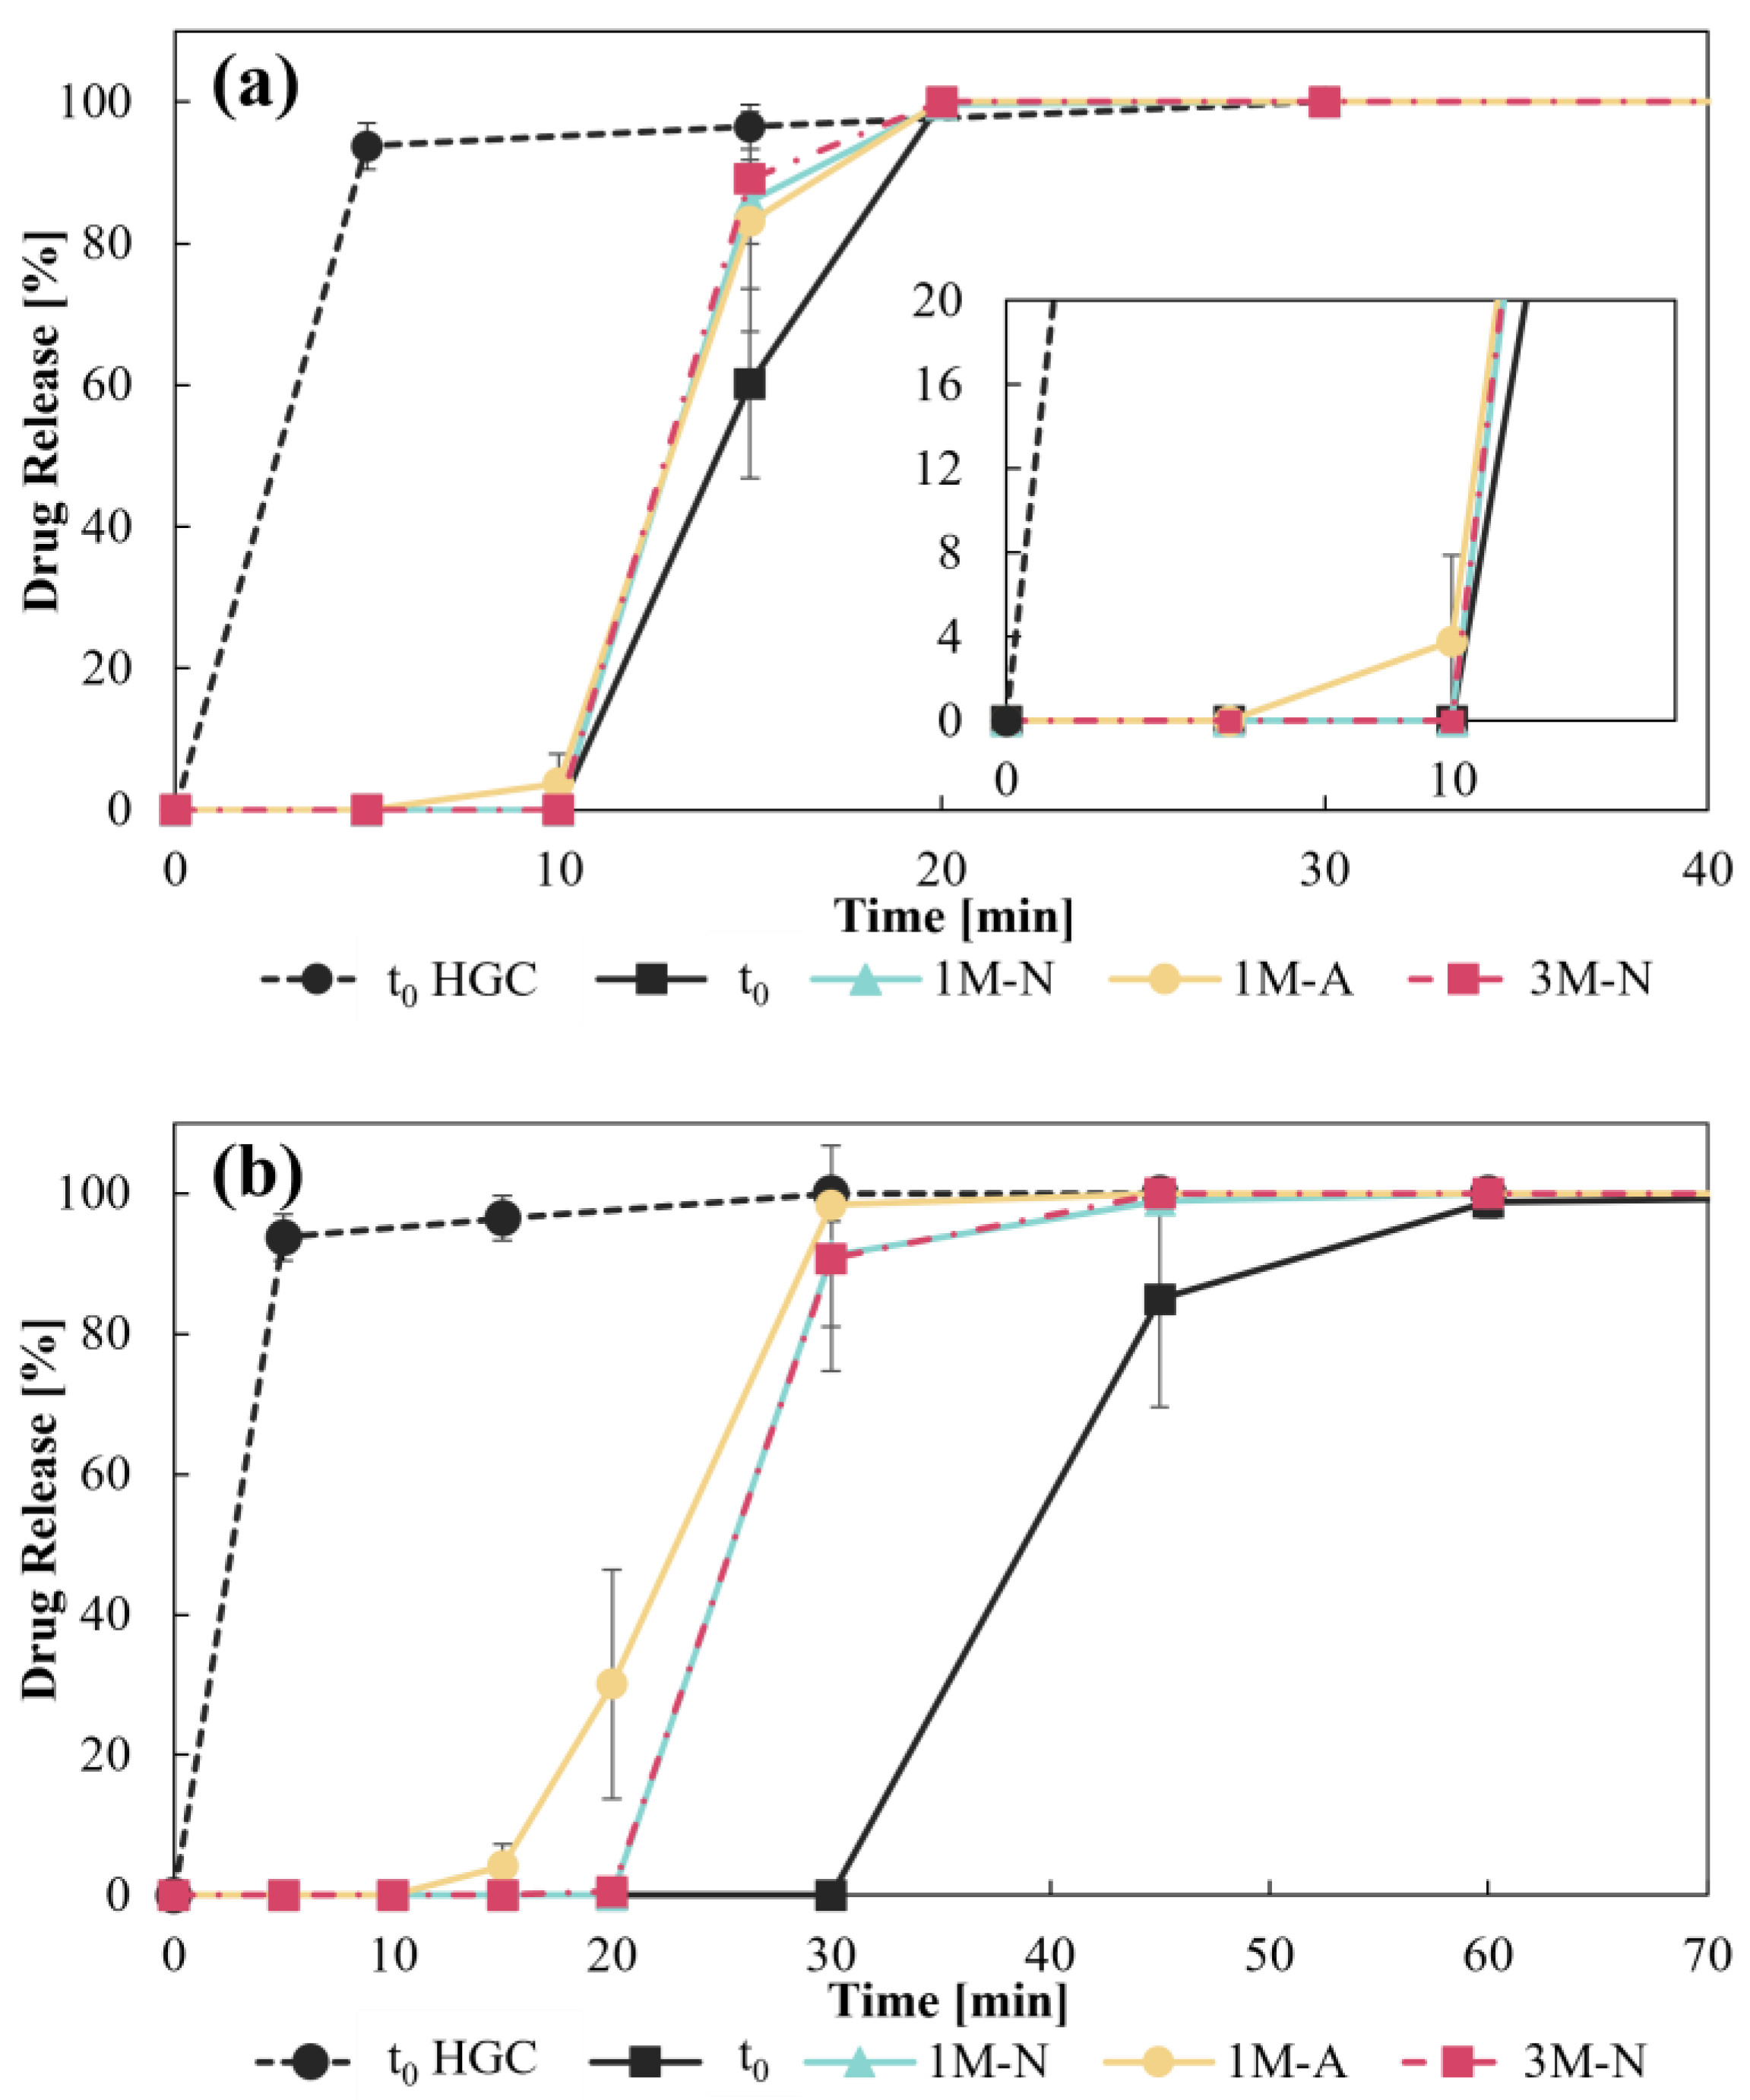
3.3.3. Disintegration Test and Dissolution Profiles
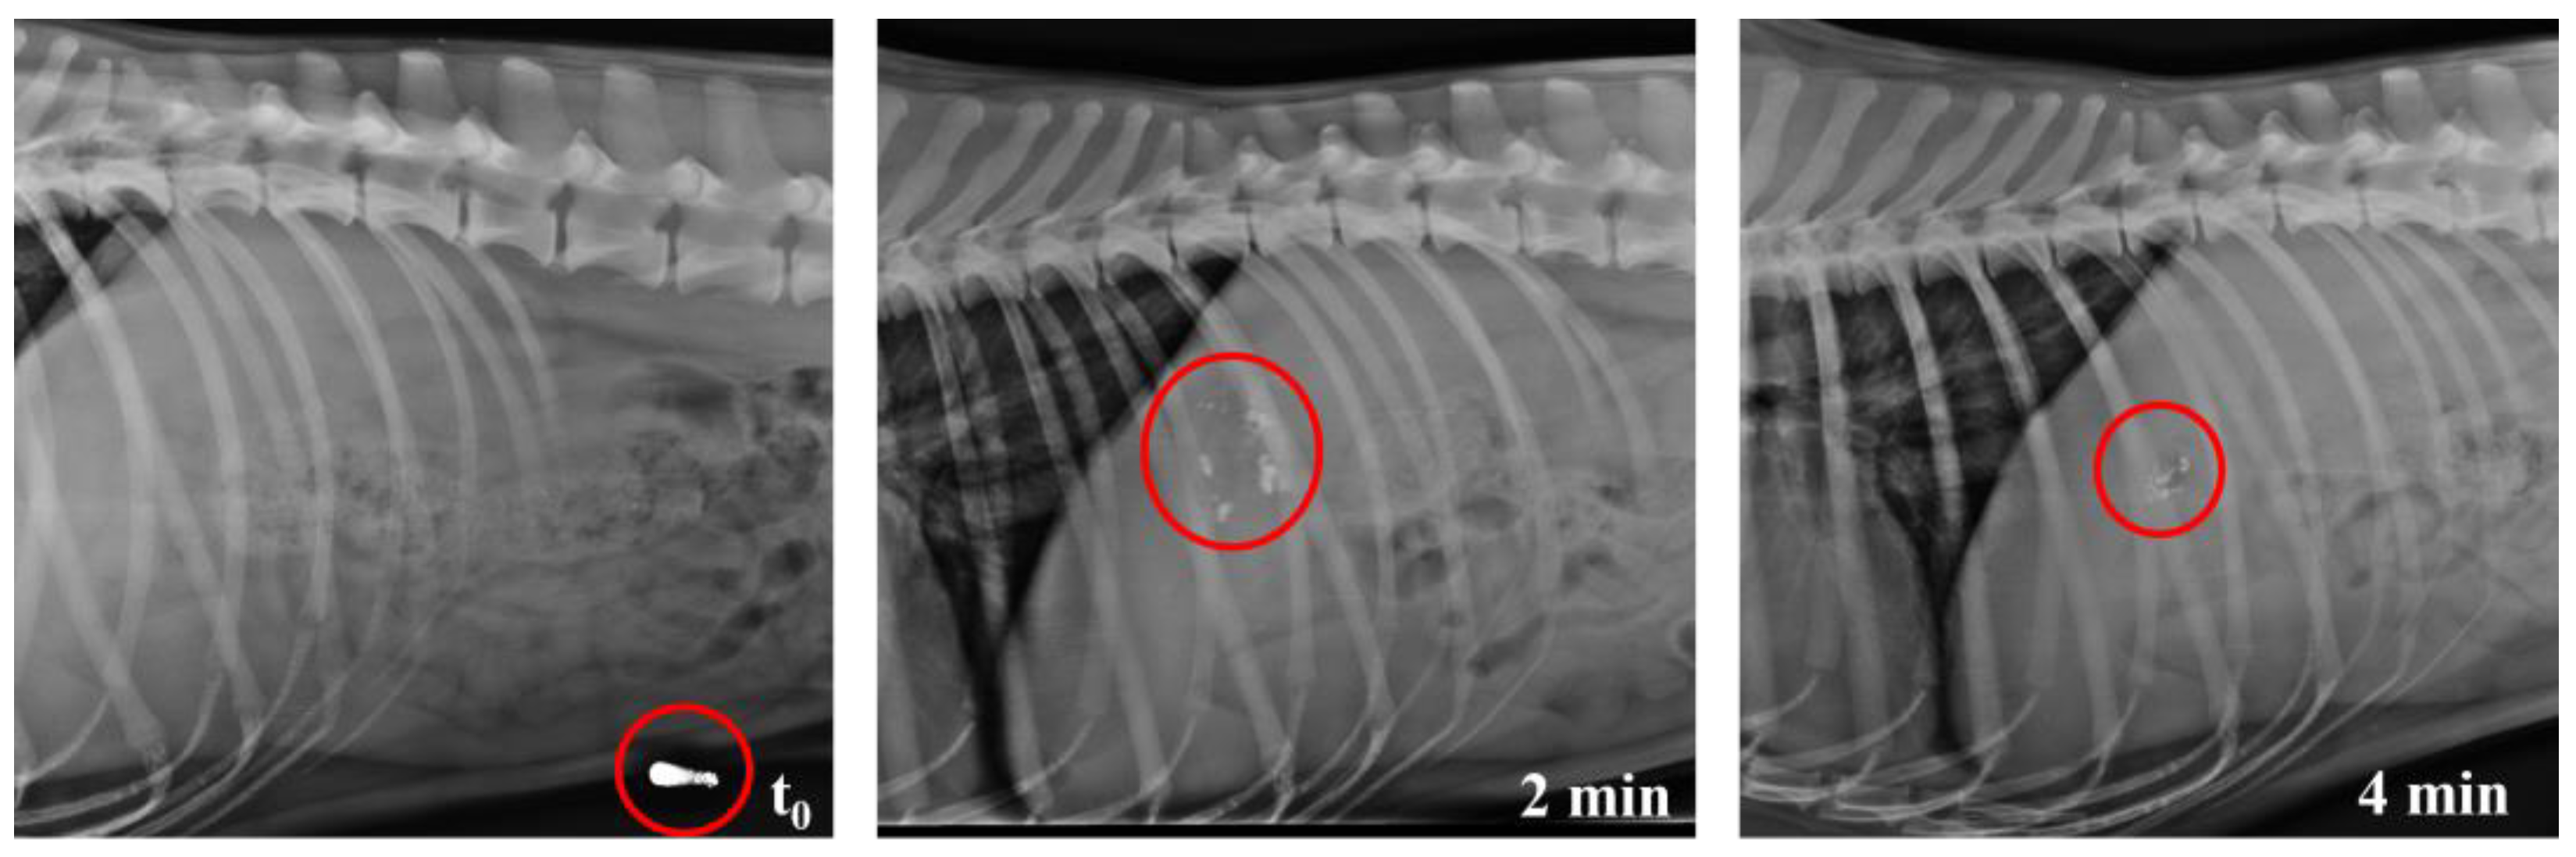
3.4. In Vivo Studies
4. Conclusions
Author Contributions
Funding
Institutional Review Board Statement
Data Availability Statement
Acknowledgments
Conflicts of Interest
References
- Fernandes, A.I.; Pereira, G.G.; Pinto, J.F. Digital Compounding in Pharmacies: A Pilot Stability Study. Med. Sci. Forum 2023, 22, 9. [Google Scholar] [CrossRef]
- Topelius, N.S.; Shokraneh, F.; Bahman, M.; Lahtinen, J.; Hassinen, N.; Airaksinen, S.; Verma, S.; Hrizanovska, L.; Lass, J.; Paaver, U.; et al. Automated Non-Sterile Pharmacy Compounding: A Multi-Site Study in European Hospital and Community Pharmacies with Pediatric Immediate Release Propranolol Hydrochloride Tablets. Pharmaceutics 2024, 16, 678. [Google Scholar] [CrossRef] [PubMed]
- Huanbutta, K.; Burapapadh, K.; Sriamornsak, P.; Sangnim, T. Practical Application of 3D Printing for Pharmaceuticals in Hospitals and Pharmacies. Pharmaceutics 2023, 15, 1877. [Google Scholar] [CrossRef]
- Bianchi, M.; Pegoretti, A.; Fredi, G. An Overview of Poly(vinyl alcohol) and Poly(vinyl pyrrolidone) in Pharmaceutical Additive Manufacturing; John Wiley and Sons Ltd.: Hoboken, NJ, USA, 2023. [Google Scholar] [CrossRef]
- Couți, N.; Porfire, A.; Iovanov, R.; Crișan, A.G.; Iurian, S.; Casian, T.; Tomuță, I. Polyvinyl Alcohol, a Versatile Excipient for Pharmaceutical 3D Printing. Polymers 2024, 16, 517. [Google Scholar] [CrossRef]
- Peña, J.F.; Cotabarren, I.; Gallo, L. Three-Dimensional Printing of PVA Capsular Devices for Applications in Compounding Pharmacy: Effect of Design Parameters on Pharmaceutical Performance. Pharmaceutics 2024, 16, 1069. [Google Scholar] [CrossRef]
- Seoane-Viaño, I.; Pérez-Ramos, T.; Liu, J.; Januskaite, P.; Guerra-Baamonde, E.; González-Ramírez, J.; Vázquez-Caruncho, M.; Basit, A.W.; Goyanes, A. Visualizing disintegration of 3D printed tablets in humans using MRI and comparison with in vitro data. J. Control. Release 2024, 365, 348–357. [Google Scholar] [CrossRef]
- Genina, N.; Boetker, J.P.; Colombo, S.; Harmankaya, N.; Rantanen, J.; Bohr, A. Anti-tuberculosis drug combination for controlled oral delivery using 3D printed compartmental dosage forms: From drug product design to in vivo testing. J. Control. Release 2017, 268, 40–48. [Google Scholar] [CrossRef] [PubMed]
- Goyanes, A.; Fernández-Ferreiro, A.; Majeed, A.; Gomez-Lado, N.; Awad, A.; Luaces-Rodríguez, A.; Gaisford, S.; Aguiar, P.; Basit, A.W. PET/CT imaging of 3D printed devices in the gastrointestinal tract of rodents. Int. J. Pharm. 2018, 536, 158–164. [Google Scholar] [CrossRef]
- Smith, D.; Kapoor, Y.; Hermans, A.; Nofsinger, R.; Kesisoglou, F.; Gustafson, T.P.; Procopio, A. 3D printed capsules for quantitative regional absorption studies in the GI tract. Int. J. Pharm. 2018, 550, 418–428. [Google Scholar] [CrossRef]
- Charoenying, T.; Patrojanasophon, P.; Ngawhirunpat, T.; Rojanarata, T.; Akkaramongkolporn, P.; Opanasopit, P. Fabrication of floating capsule-in- 3D-printed devices as gastro-retentive delivery systems of amoxicillin. J. Drug Deliv. Sci. Technol. 2020, 55, 101393. [Google Scholar] [CrossRef]
- Kotha, S.L.R.; Adye, D.R.; Borkar, R.M.; Banerjee, S. 3D printing of hollow capsular body & sealing pin by fused filament fabrication (FFF) technique using Kollicoat MAE 100P filament for intestinal specific delivery. J. Mater. Sci. 2023, 58, 9282–9296. [Google Scholar] [CrossRef]
- Milliken, R.L.; Quinten, T.; Andersen, S.K.; Lamprou, D.A. Application of 3D Printing in Early Phase Development of Pharmaceutical Solid Dosage Forms; Elsevier B.V.: Amsterdam, The Netherlands, 2024. [Google Scholar] [CrossRef]
- Rodríguez-Maciñeiras, X.; Bendicho-Lavilla, C.; Rial, C.; Garba-Mohammed, K.; Worsley, A.; Díaz-Torres, E.; Orive-Martínez, C.; Orive-Mayor, Á.; Basit, A.W.; Alvarez-Lorenzo, C.; et al. Advancing medication compounding: Use of a pharmaceutical 3D printer to auto-fill minoxidil capsules for dispensing to patients in a community pharmacy. Int. J. Pharm. 2025, 671, 125251. [Google Scholar] [CrossRef] [PubMed]
- Denis, L.; Jørgensen, A.K.; Do, B.; Vaz-Luis, I.; Pistilli, B.; Rieutord, A.; Basit, A.W.; Goyanes, A.; Annereau, M. Developing an innovative 3D printing platform for production of personalised medicines in a hospital for the OPERA clinical trial. Int. J. Pharm. 2024, 661, 124306. [Google Scholar] [CrossRef] [PubMed]
- Goyanes, A.; Madla, C.M.; Umerji, A.; Piñeiro, G.D.; Montero, J.M.G.; Diaz, M.J.L.; Barcia, M.G.; Taherali, F.; Sánchez-Pintos, P.; Couce, M.-L.; et al. Automated therapy preparation of isoleucine formulations using 3D printing for the treatment of MSUD: First single-centre, prospective, crossover study in patients. Int. J. Pharm. 2019, 567, 118497. [Google Scholar] [CrossRef]
- Gültekin, H.E.; Tort, S.; Acartürk, F. Fabrication of Three Dimensional Printed Tablets in Flexible Doses: A Comprehensive Study 2 from Design to Evaluation. Available online: https://ssrn.com/abstract=4028237 (accessed on 11 February 2025).
- Keikhosravi, N.; Mirdamadian, S.Z.; Varshosaz, J.; Taheri, A. Preparation and characterization of polypills containing aspirin and simvastatin using 3D printing technology for the prevention of cardiovascular diseases. Drug Dev. Ind. Pharm. 2020, 46, 1665–1675. [Google Scholar] [CrossRef]
- Pereira, B.C.; Isreb, A.; Isreb, M.; Forbes, R.T.; Oga, E.F.; Alhnan, M.A. Additive Manufacturing of a Point-of-Care ‘Polypill:’ Fabrication of Concept Capsules of Complex Geometry with Bespoke Release against Cardiovascular Disease. Adv. Healthc. Mater. 2020, 9, e2000236. [Google Scholar] [CrossRef]
- Vakili, H.; Nyman, J.O.; Genina, N.; Preis, M.; Sandler, N. Application of a colorimetric technique in quality control for printed pediatric orodispersible drug delivery systems containing propranolol hydrochloride. Int. J. Pharm. 2016, 511, 606–618. [Google Scholar] [CrossRef]
- Gallo, L.; Bucalá, V.; Ramírez-Rigo, M.V. Formulation and Characterization of Polysaccharide Microparticles for Pulmonary Delivery of Sodium Cromoglycate. AAPS PharmSciTech 2017, 18, 1634–1645. [Google Scholar] [CrossRef]
- Deutsche Normen (DIN). DIN 50008: Klimaprüfungen; Gleichklimatische Prüfbedingungen für Prüflinge; Definition und Verfahren; Beuth Verlag: Berlin, Germany, 1981. [Google Scholar]
- World Health Organization. The International Pharmacopoeia, 9th ed.; World Health Organization: Geneva, Switzerland, 2019. [Google Scholar]
- Pharmacopeial Convention. USP 44—NF 39; United States Pharmacopeial Convention: Rockville, MD, USA, 2021. [Google Scholar]
- Muselík, J.; Komersová, A.; Kubová, K.; Matzick, K.; Skalická, B. A critical overview of FDA and EMA statistical methods to compare in vitro drug dissolution profiles of pharmaceutical products. Pharmaceutics 2021, 13, 1703. [Google Scholar] [CrossRef]
- Matheny, C.; Martin, C.M.H. Compounding pharmacy: Old methods finding a new niche. Consult. Pharm.® 2010, 25, 357–363. [Google Scholar] [CrossRef]
- Real, J.P.; Real, D.A.; Lopez-Vidal, L.; Barrientos, B.A.; Bolaños, K.; Tinti, M.G.; Litterio, N.J.; Kogan, M.J.; Palma, S.D. 3D-Printed Gastroretentive Tablets Loaded with Niclosamide Nanocrystals by the Melting Solidification Printing Process (MESO-PP). Pharmaceutics 2023, 15, 1387. [Google Scholar] [CrossRef] [PubMed]
- Müller, L.; Rosenbaum, C.; Rump, A.; Grimm, M.; Klammt, F.; Kleinwort, A.; Busemann, A.; Weitschies, W. Determination of Mucoadhesion of Polyvinyl Alcohol Films to Human Intestinal Tissue. Pharmaceutics 2023, 15, 1740. [Google Scholar] [CrossRef] [PubMed]
- Juan, C.; Gallo, L.; Vidal, N.G. Development of Losartan Orally Disintegrating Tablets by Direct Compression: A Cost-Effective Approach to Improve Paediatric Patient’s Compliance. AAPS PharmSciTech 2024, 25, 79. [Google Scholar] [CrossRef]
- Center for Drug Evaluation and Research (CDER), U.S. Department of Health and Human Services—Food and Drug Administration. Dissolution Testing and Acceptance Criteria for Immediate-Release Solid Oral Dosage Form Drug Products Containing High Solubility Drug Substances. Guidance for Industry; U.S. Food and Drug Administration: Silver Spring, MD, USA, 2018.


| Disintegration Time [s] | ||
|---|---|---|
| CD–0–0.4 | CD–0–0.9 | |
| t0 | 524 ± 25 | 1510 ± 54 |
| 1M-N | 509 ± 5 | 1139 ± 89 |
| 3M-N | 524 ± 38 | 1050 ± 54 |
| 1M-A | 437 ± 24 | 741 ± 161 |
| CD–0–0.4 | CD–0–0.9 | |||||
|---|---|---|---|---|---|---|
| 1M-N | 1M-A | 3M-N | 1M-N | 1M-A | 3M-N | |
| t0 | 54.2 | 56.5 | 51.8 | 26.7 | 24.1 | 26.8 |
| 1M-N | 92.6 | 89.3 | 50.2 | 98.4 | ||
| 1M-A | 80.4 | 50.4 | ||||
Disclaimer/Publisher’s Note: The statements, opinions and data contained in all publications are solely those of the individual author(s) and contributor(s) and not of MDPI and/or the editor(s). MDPI and/or the editor(s) disclaim responsibility for any injury to people or property resulting from any ideas, methods, instructions or products referred to in the content. |
© 2025 by the authors. Licensee MDPI, Basel, Switzerland. This article is an open access article distributed under the terms and conditions of the Creative Commons Attribution (CC BY) license (https://creativecommons.org/licenses/by/4.0/).
Share and Cite
Peña, J.F.; Real, D.A.; Real, J.P.; Palma, S.D.; Zarazaga, M.d.P.; Litterio, N.J.; Gallo, L.; Cotabarren, I.M. 3D Printing of PVA Capsular Devices for Applications in Compounding Pharmacy: Stability Evaluation and In Vivo Performance. Pharmaceutics 2025, 17, 613. https://doi.org/10.3390/pharmaceutics17050613
Peña JF, Real DA, Real JP, Palma SD, Zarazaga MdP, Litterio NJ, Gallo L, Cotabarren IM. 3D Printing of PVA Capsular Devices for Applications in Compounding Pharmacy: Stability Evaluation and In Vivo Performance. Pharmaceutics. 2025; 17(5):613. https://doi.org/10.3390/pharmaceutics17050613
Chicago/Turabian StylePeña, Juan Francisco, Daniel Andrés Real, Juan Pablo Real, Santiago Daniel Palma, María del Pilar Zarazaga, Nicolás Javier Litterio, Loreana Gallo, and Ivana Maria Cotabarren. 2025. "3D Printing of PVA Capsular Devices for Applications in Compounding Pharmacy: Stability Evaluation and In Vivo Performance" Pharmaceutics 17, no. 5: 613. https://doi.org/10.3390/pharmaceutics17050613
APA StylePeña, J. F., Real, D. A., Real, J. P., Palma, S. D., Zarazaga, M. d. P., Litterio, N. J., Gallo, L., & Cotabarren, I. M. (2025). 3D Printing of PVA Capsular Devices for Applications in Compounding Pharmacy: Stability Evaluation and In Vivo Performance. Pharmaceutics, 17(5), 613. https://doi.org/10.3390/pharmaceutics17050613