Continuous Microfluidic Antisolvent Crystallization as a Bottom-Up Solution for the Development of Long-Acting Injectable Formulations


 ,
,  and
and
Abstract
1. Introduction
2. Experimental Section
2.1. Materials
2.2. MCR-CLASC Process
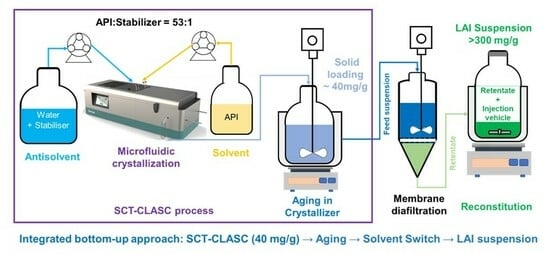
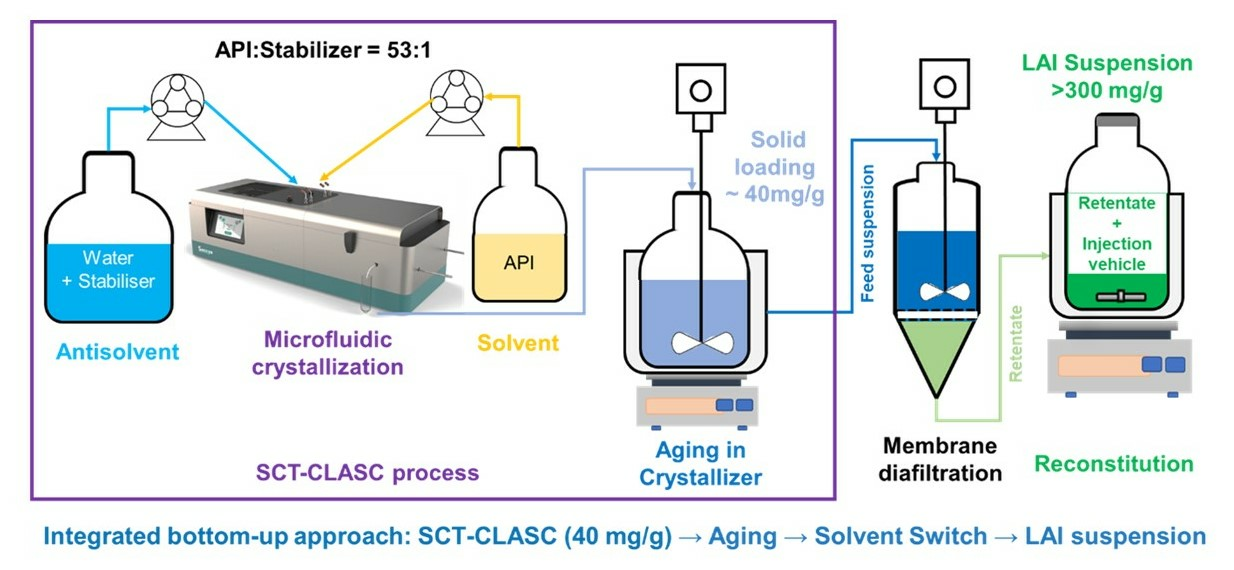
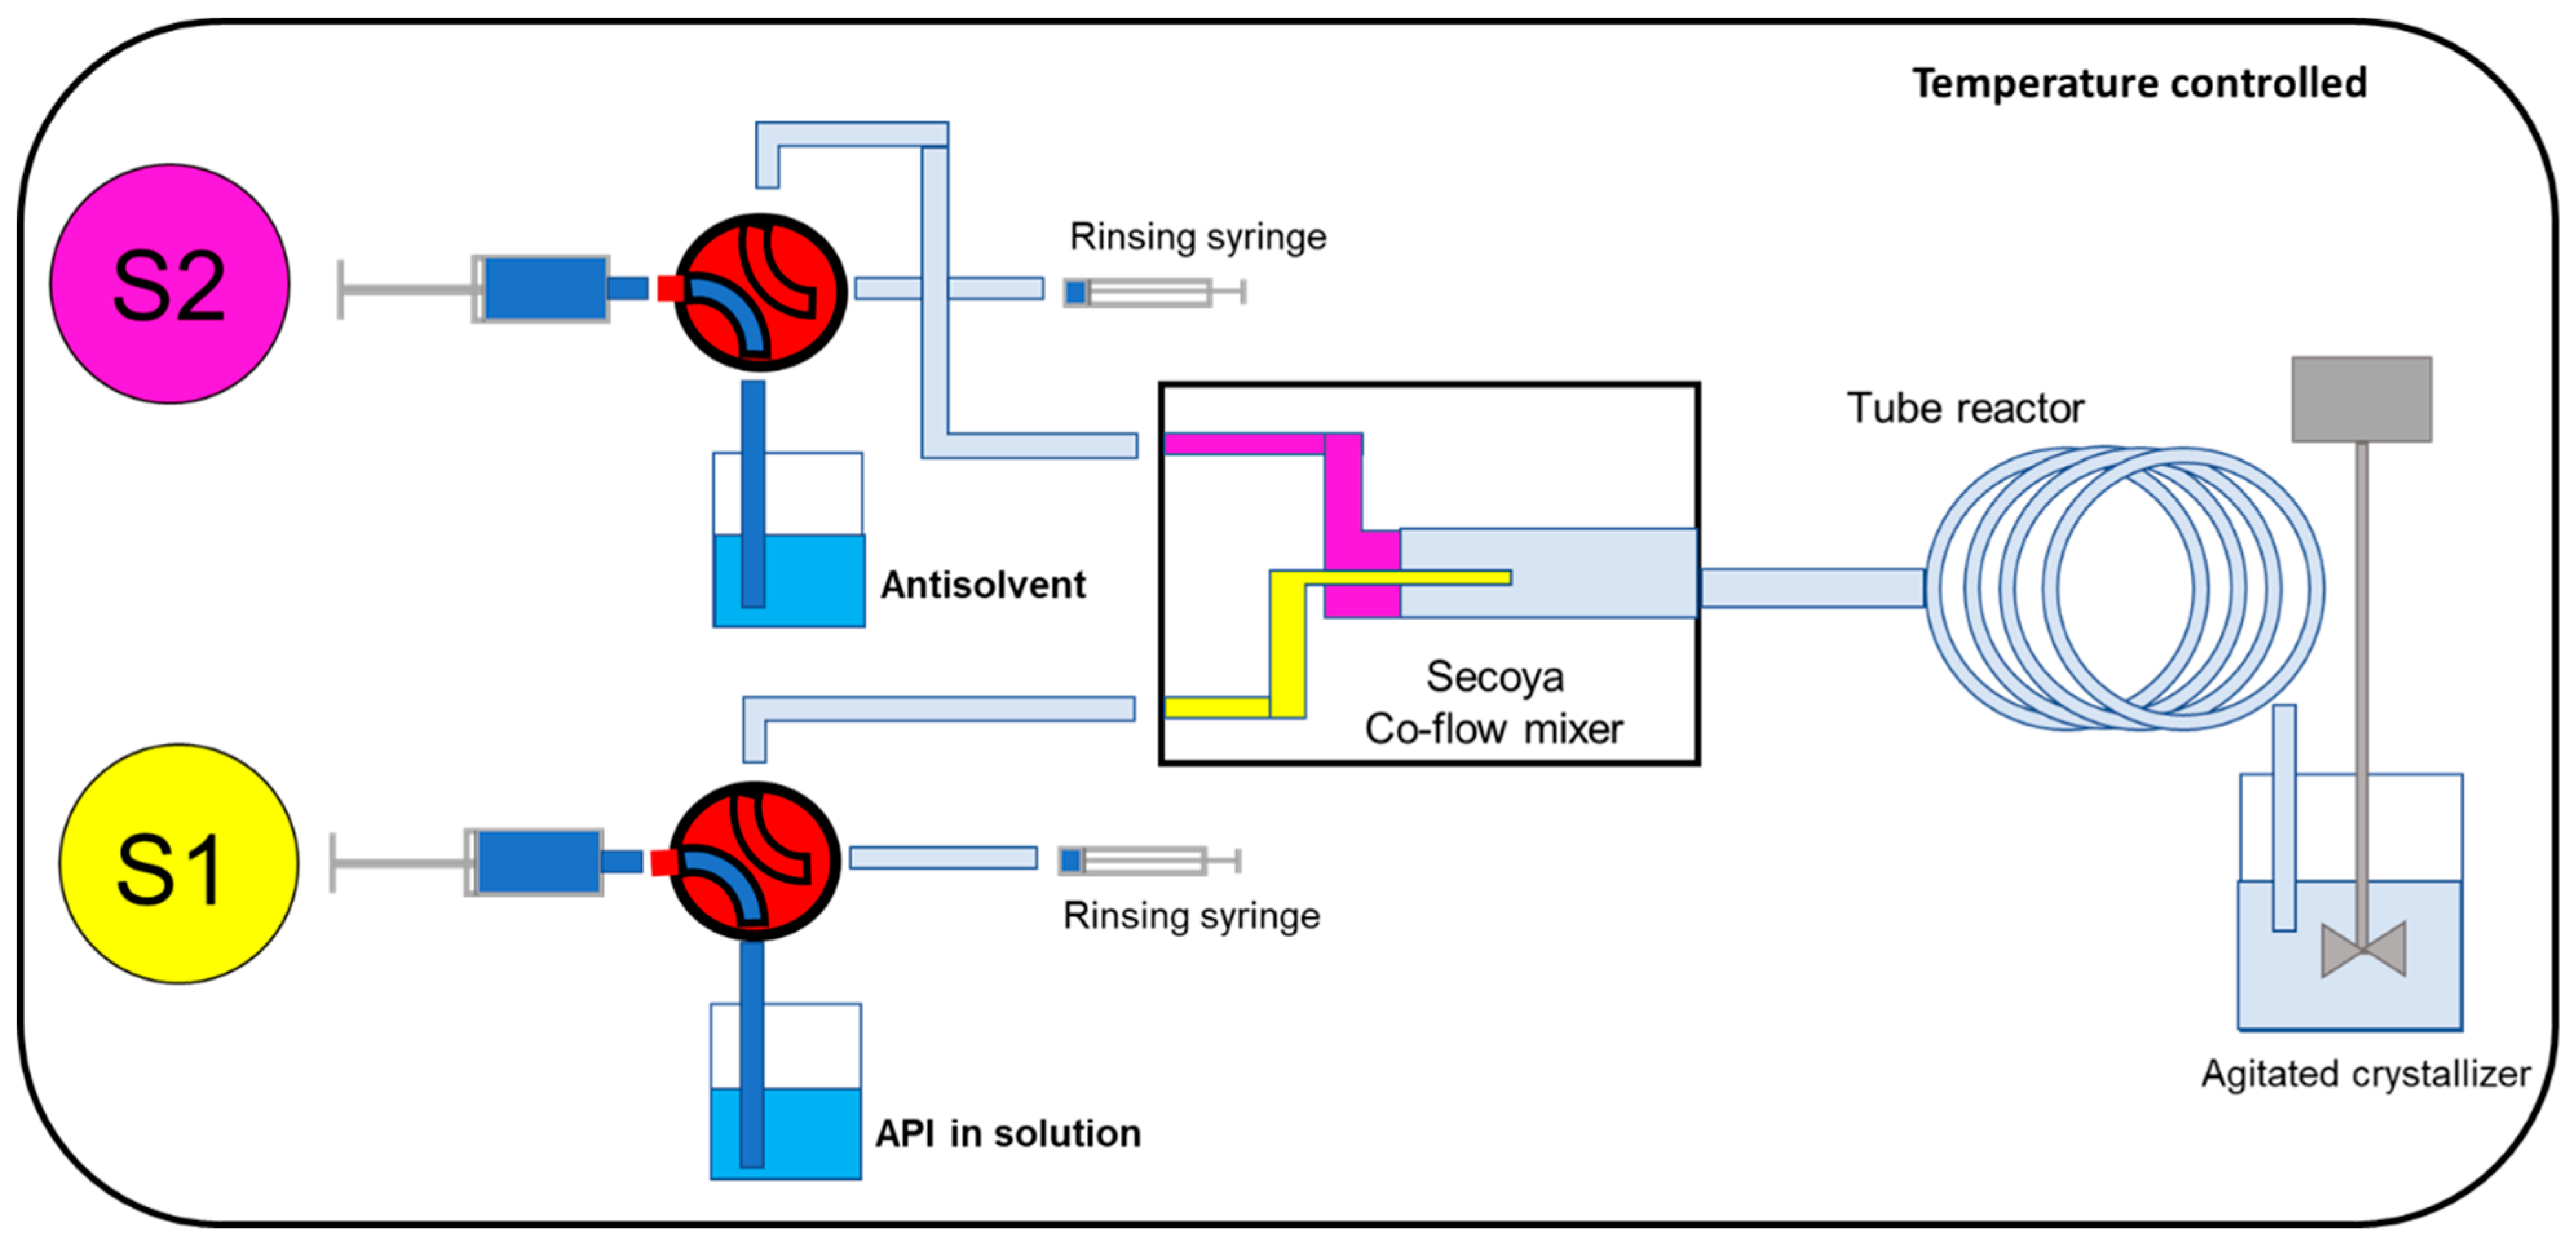
2.3. Secoya Microfluidic Crystallization Technology-Based Continuous Liquid Antisolvent Crystallization (SCT-CLASC) Process
2.4. Operating Parameter Optimization
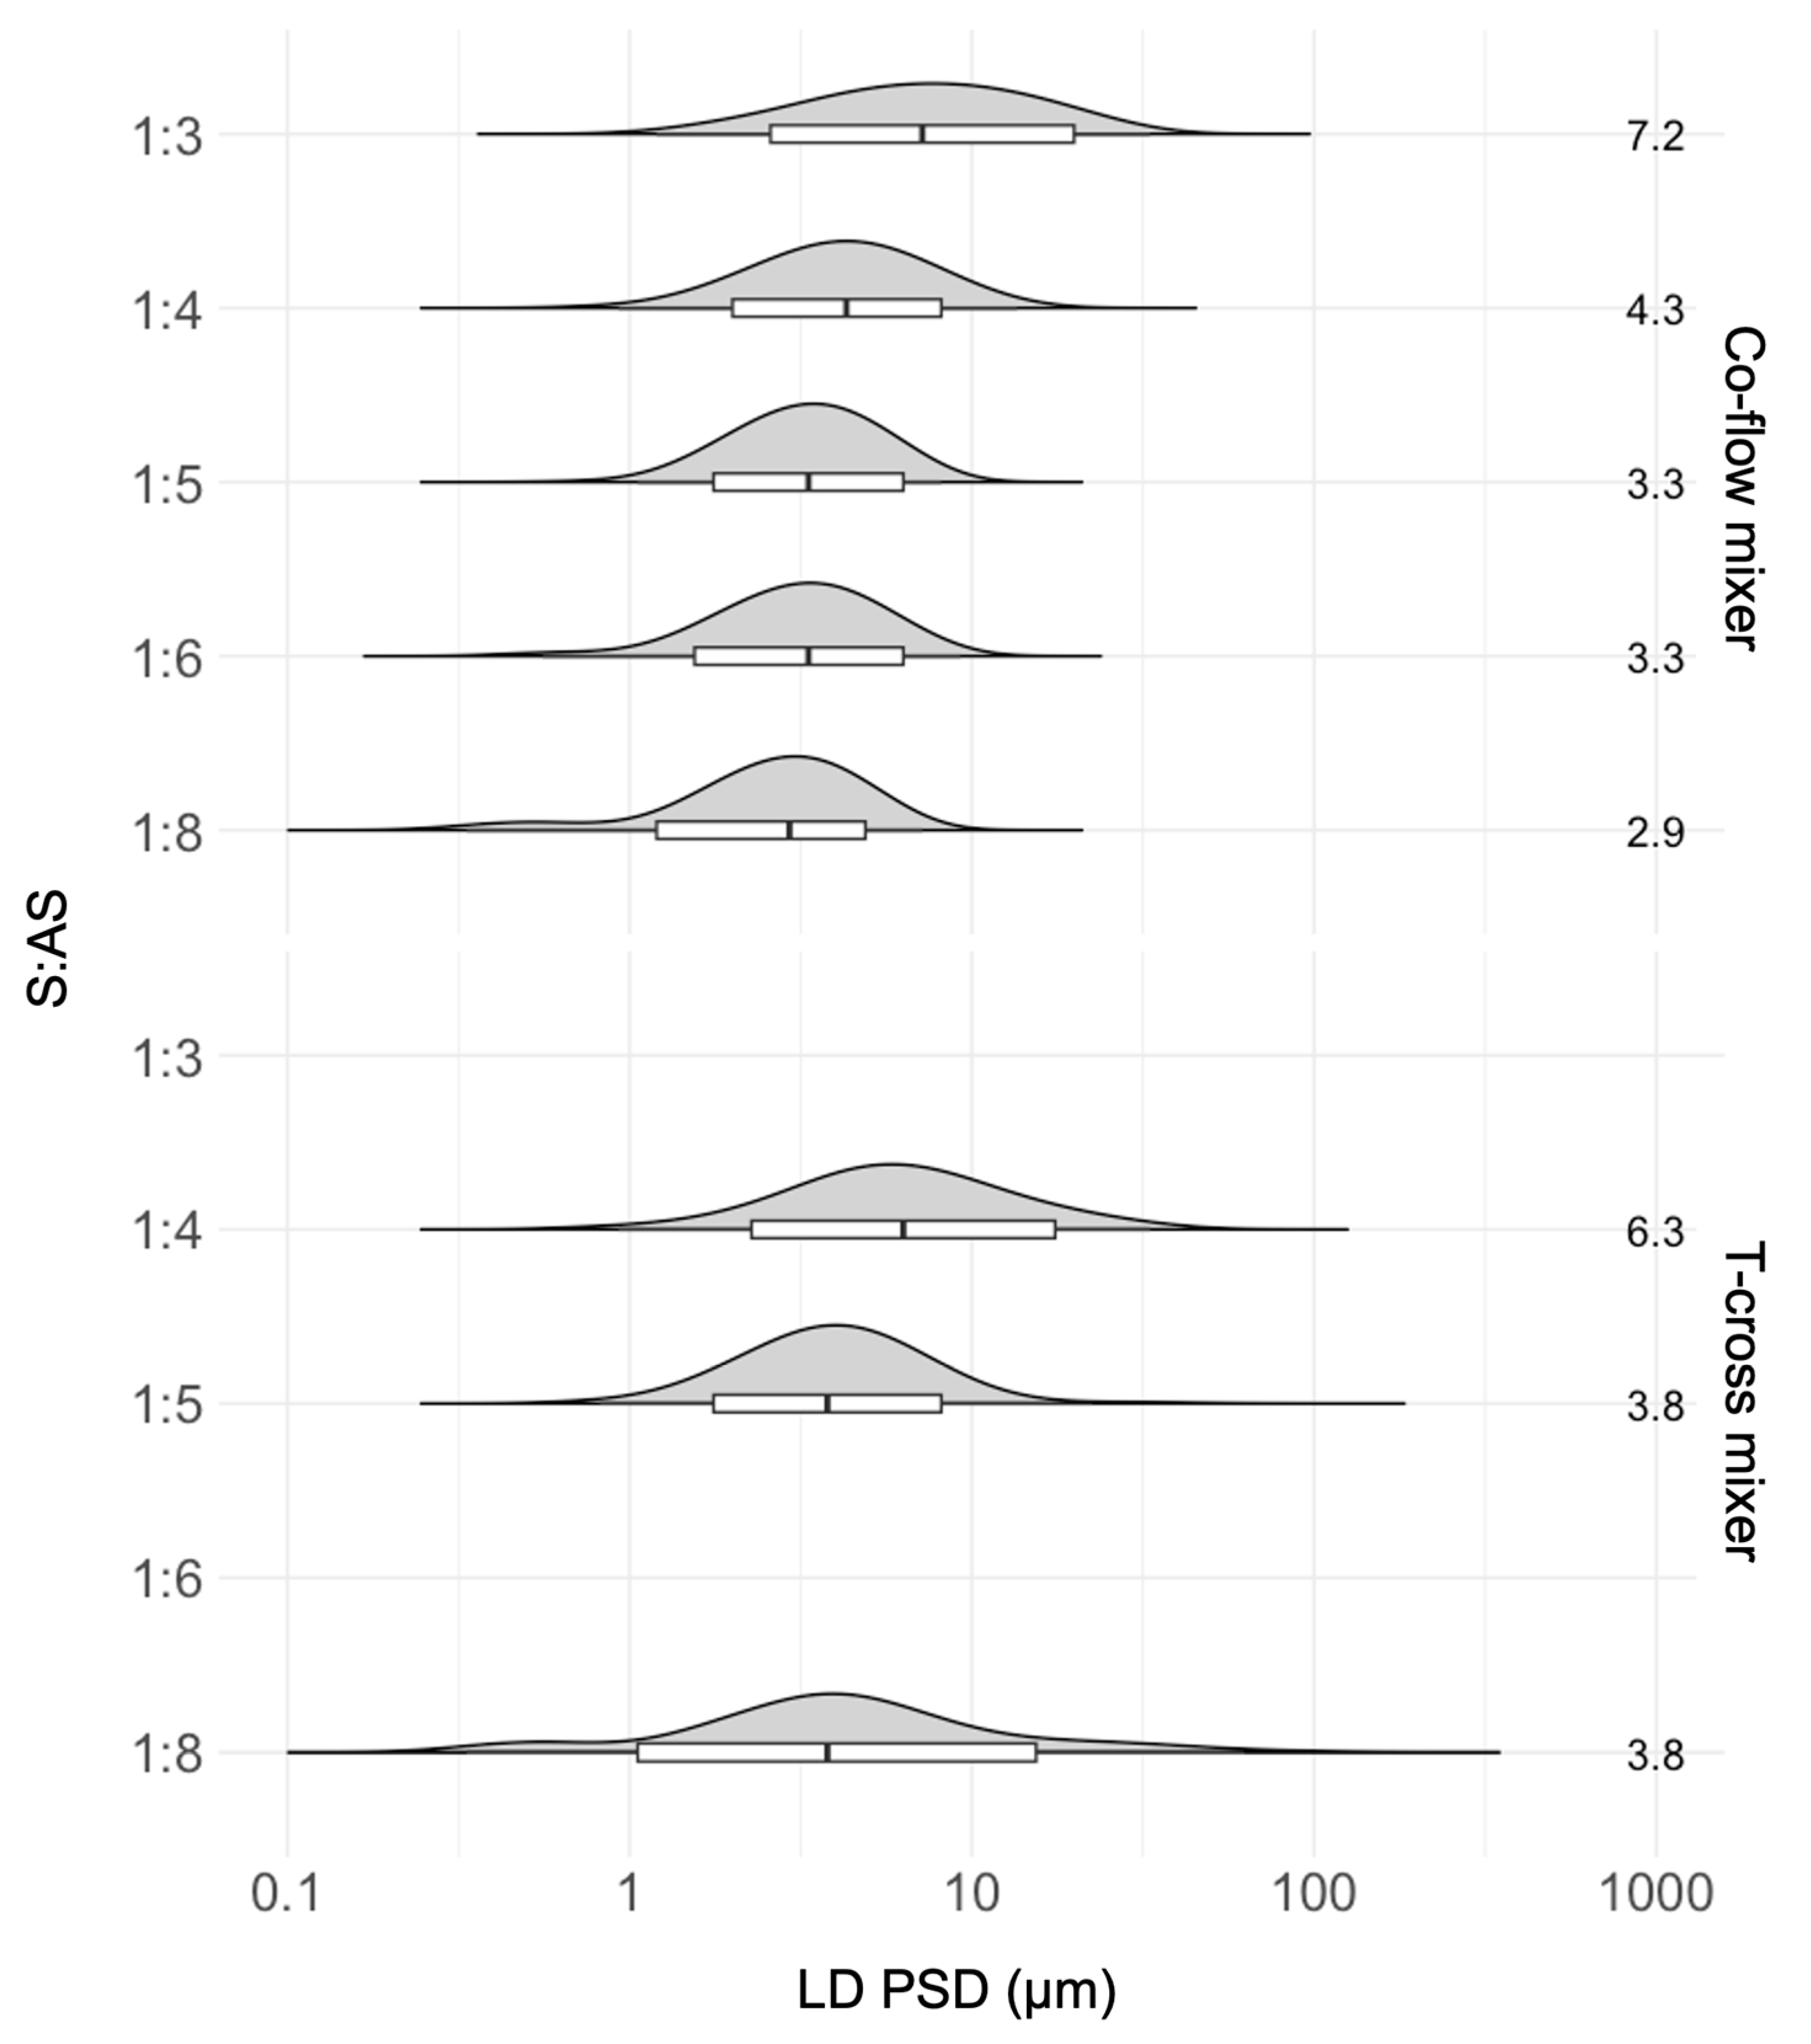
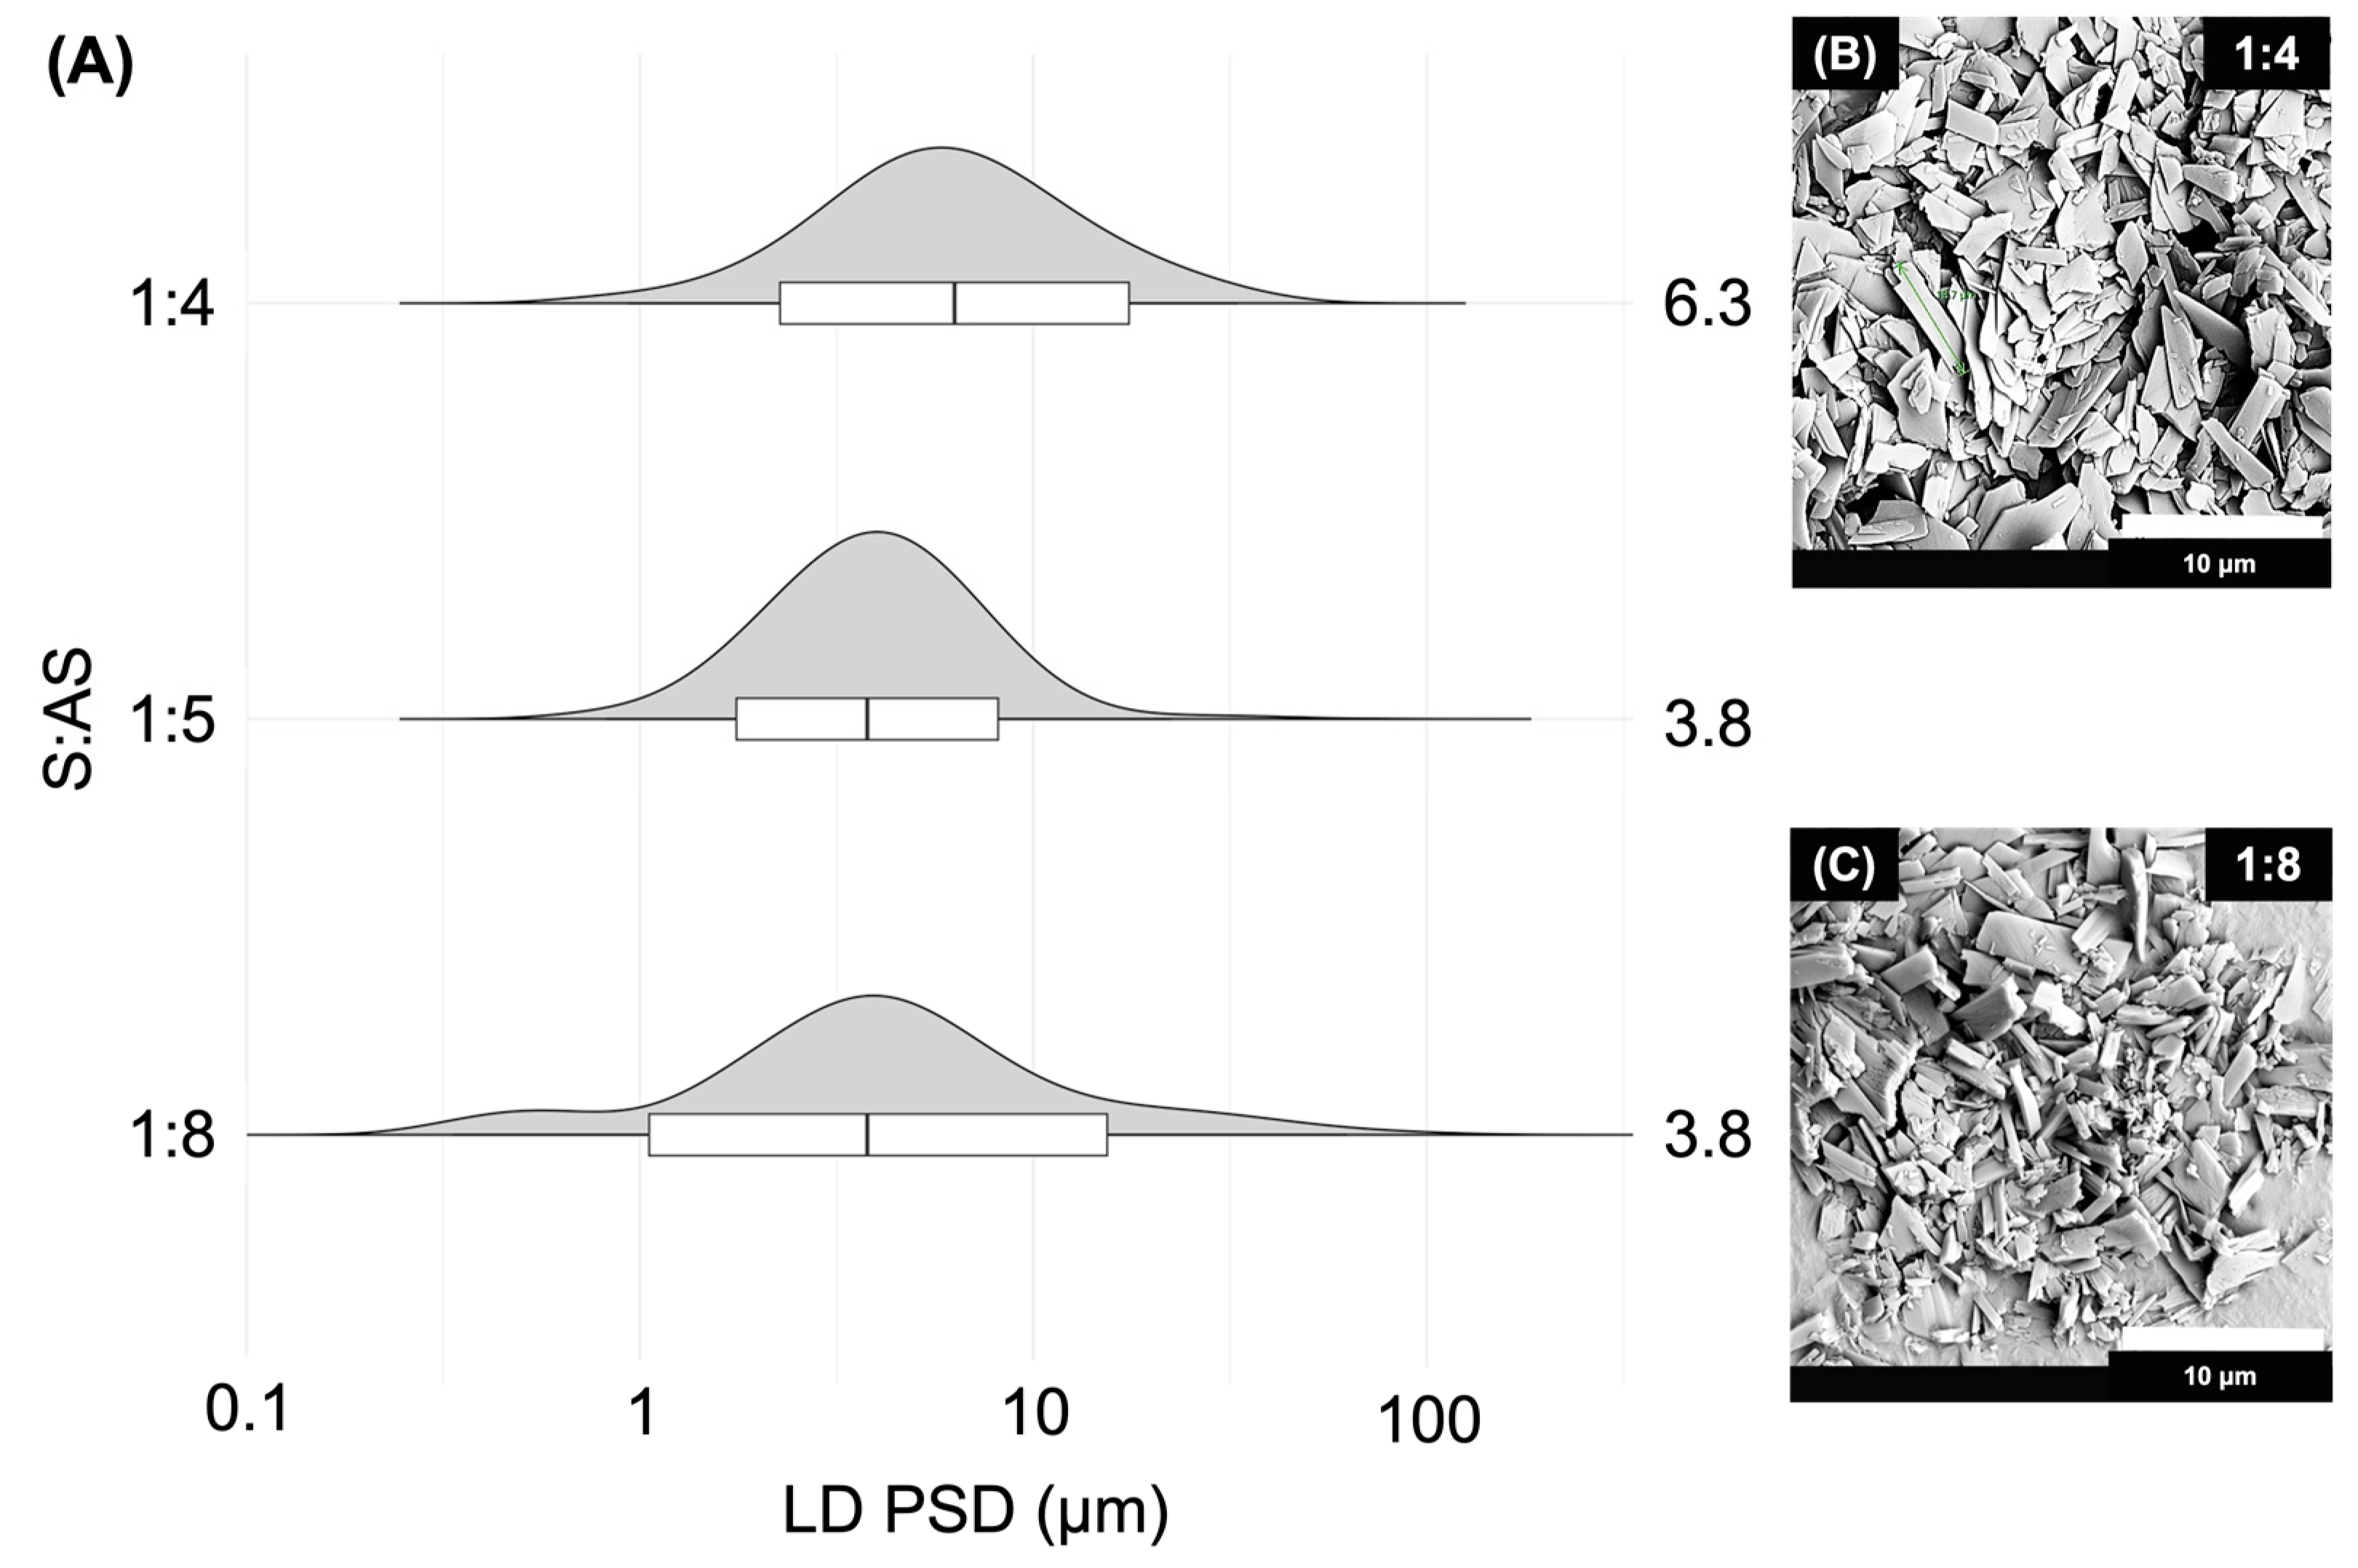
2.4.1. Solvent-to-Antisolvent (S:AS) Ratio
2.4.2. Solvent–Antisolvent (S–AS) Stream Flow Rate
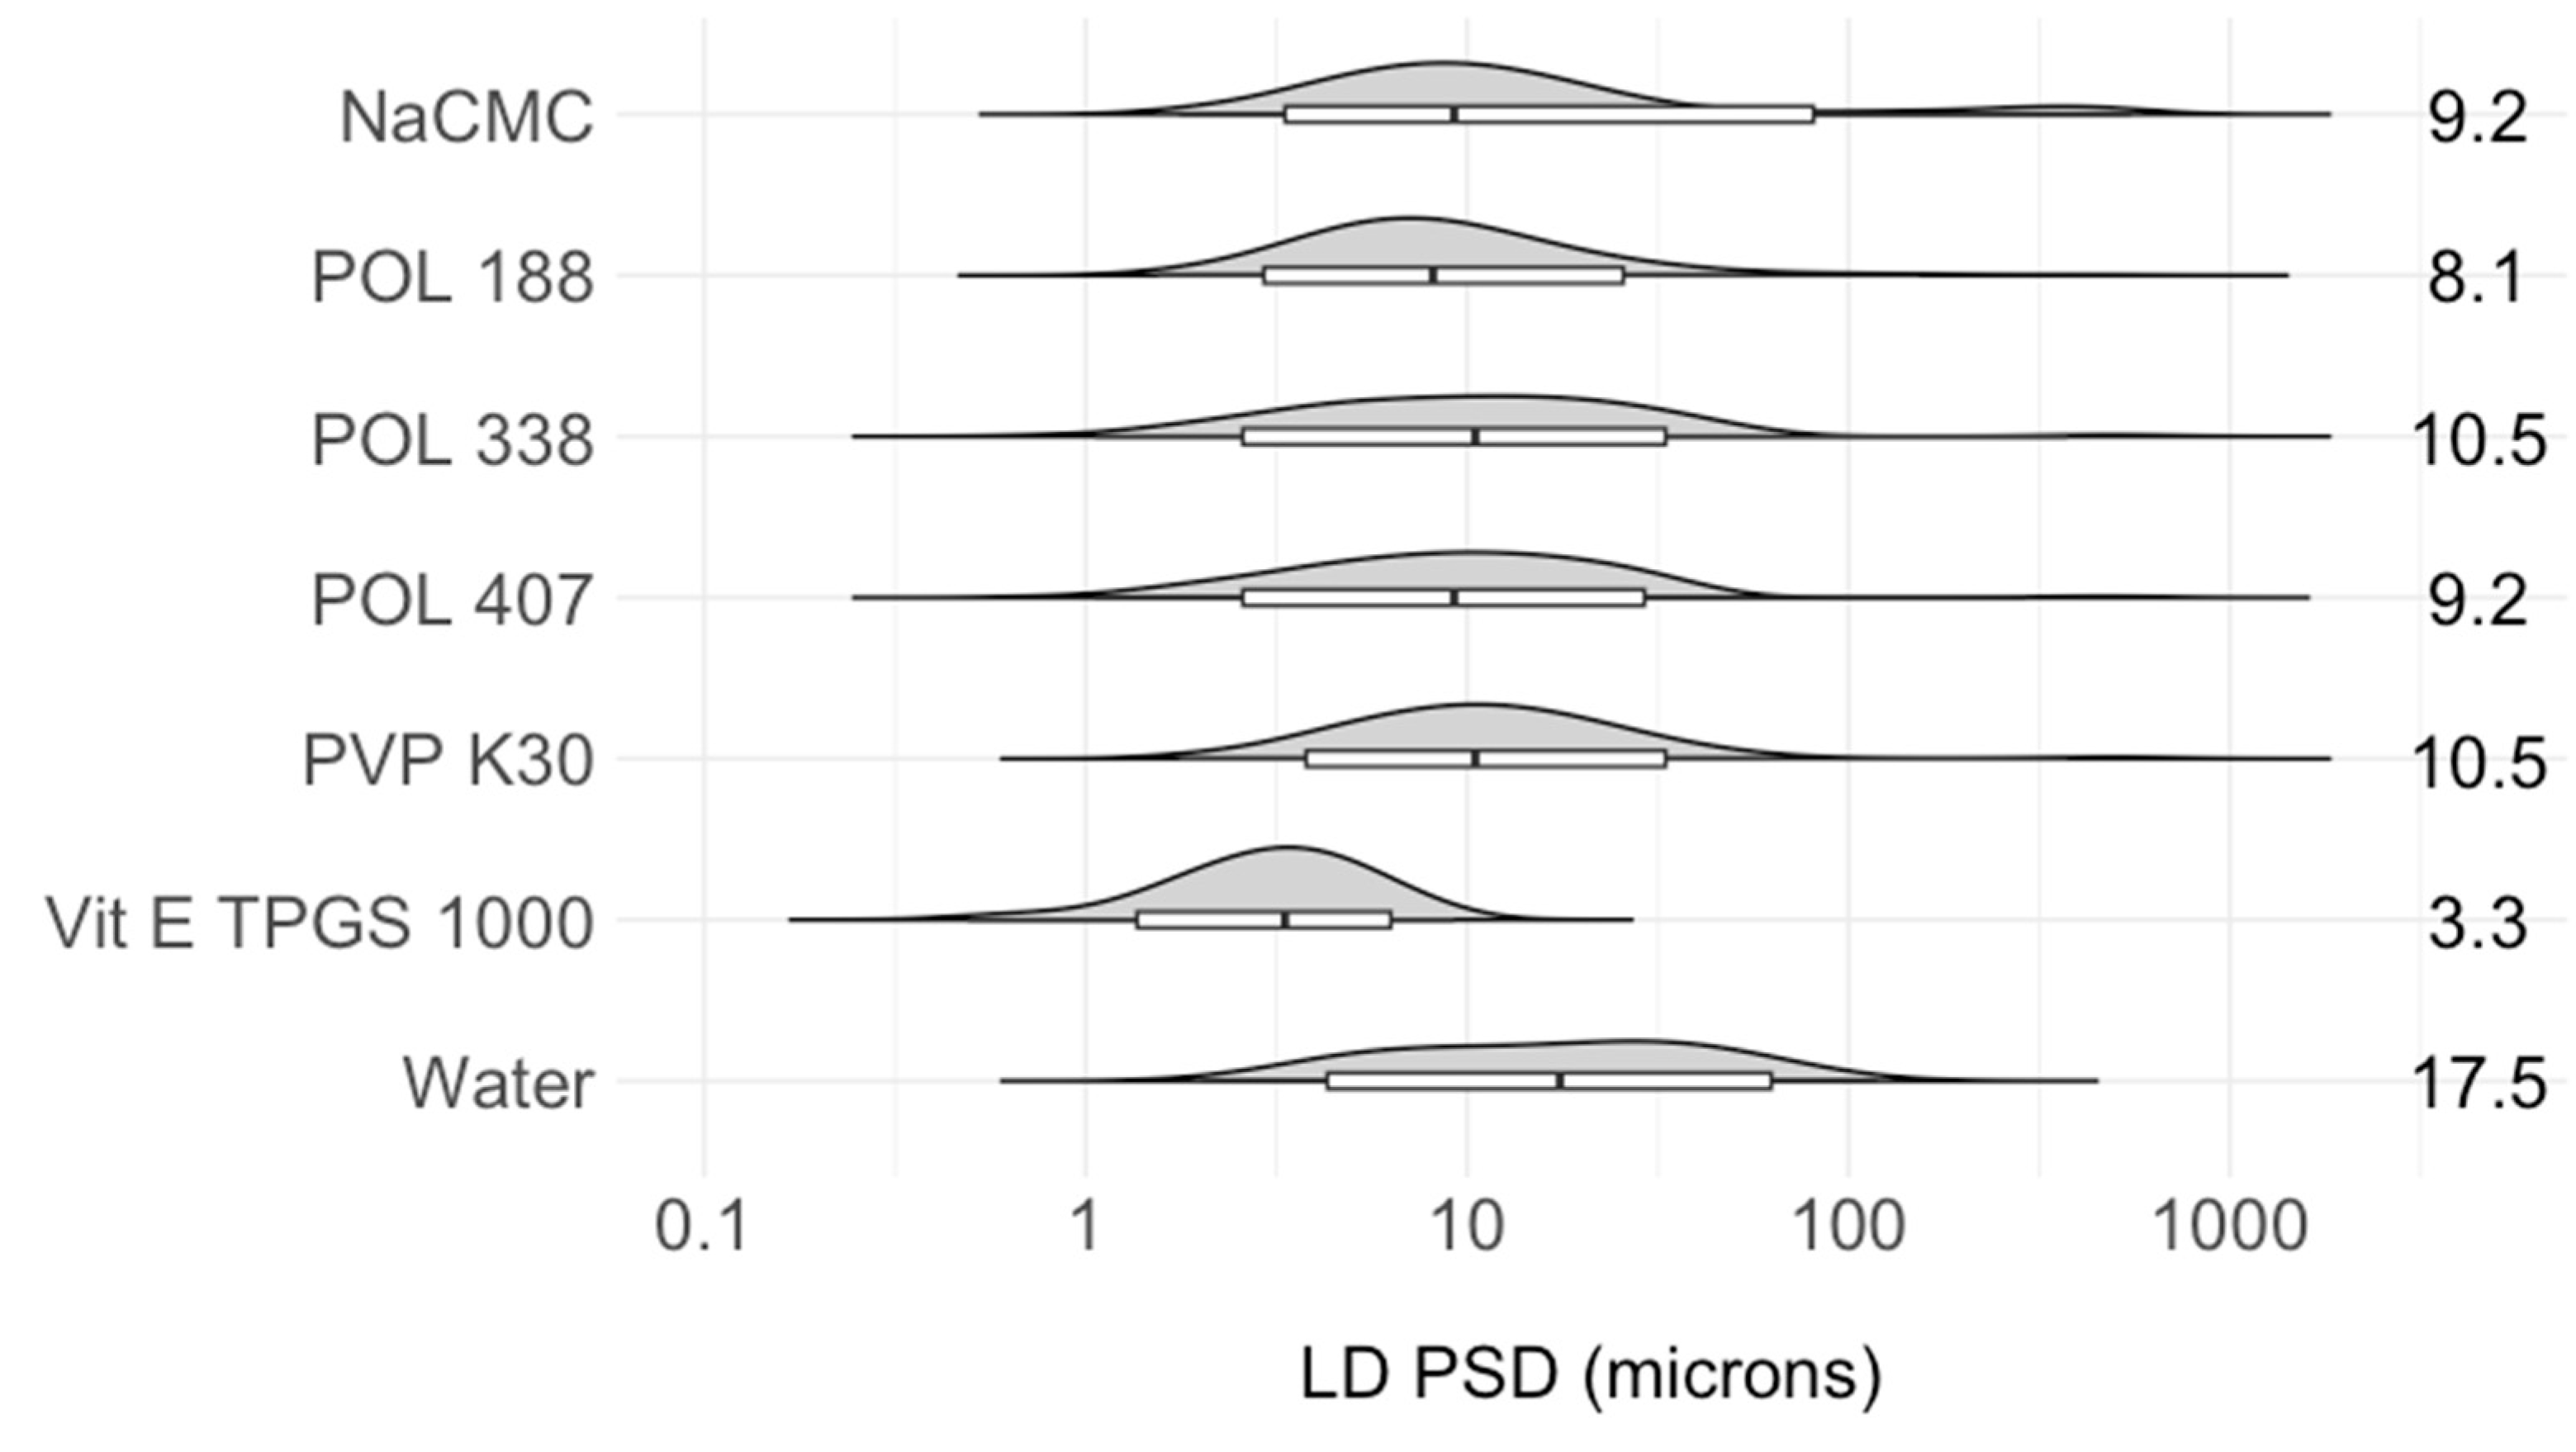
2.4.3. Stabilizer Selection
2.4.4. API Feed Solution Concentration
2.4.5. Microfluidic Mixing Device Comparison
2.5. Optimization of Vit E TPGS 1000 Concentration
2.6. Downstream Processing of LAI Suspensions
2.7. Stability Study
2.8. Particle Size Distribution (PSD)
2.9. Solid-State Characterization
2.9.1. Scanning Electron Microscopy (SEM)
2.9.2. Powder X-ray Diffraction (PXRD)
2.10. Residual Solvent Analysis
2.11. Vit E TPGS 1000 Content Analysis
2.12. Itraconazole Loading in Final LAI Suspensions
2.13. In Vitro Discriminatory Dissolution Comparison
3. Results and Discussion
3.1. MCR-CLASC Process
3.2. Secoya Microfluidic Crystallization Technology-Based Continuous Liquid Antisolvent Crystallization (SCT-CLASC) Process
3.2.1. Operating Parameter Optimization
S:AS Ratio
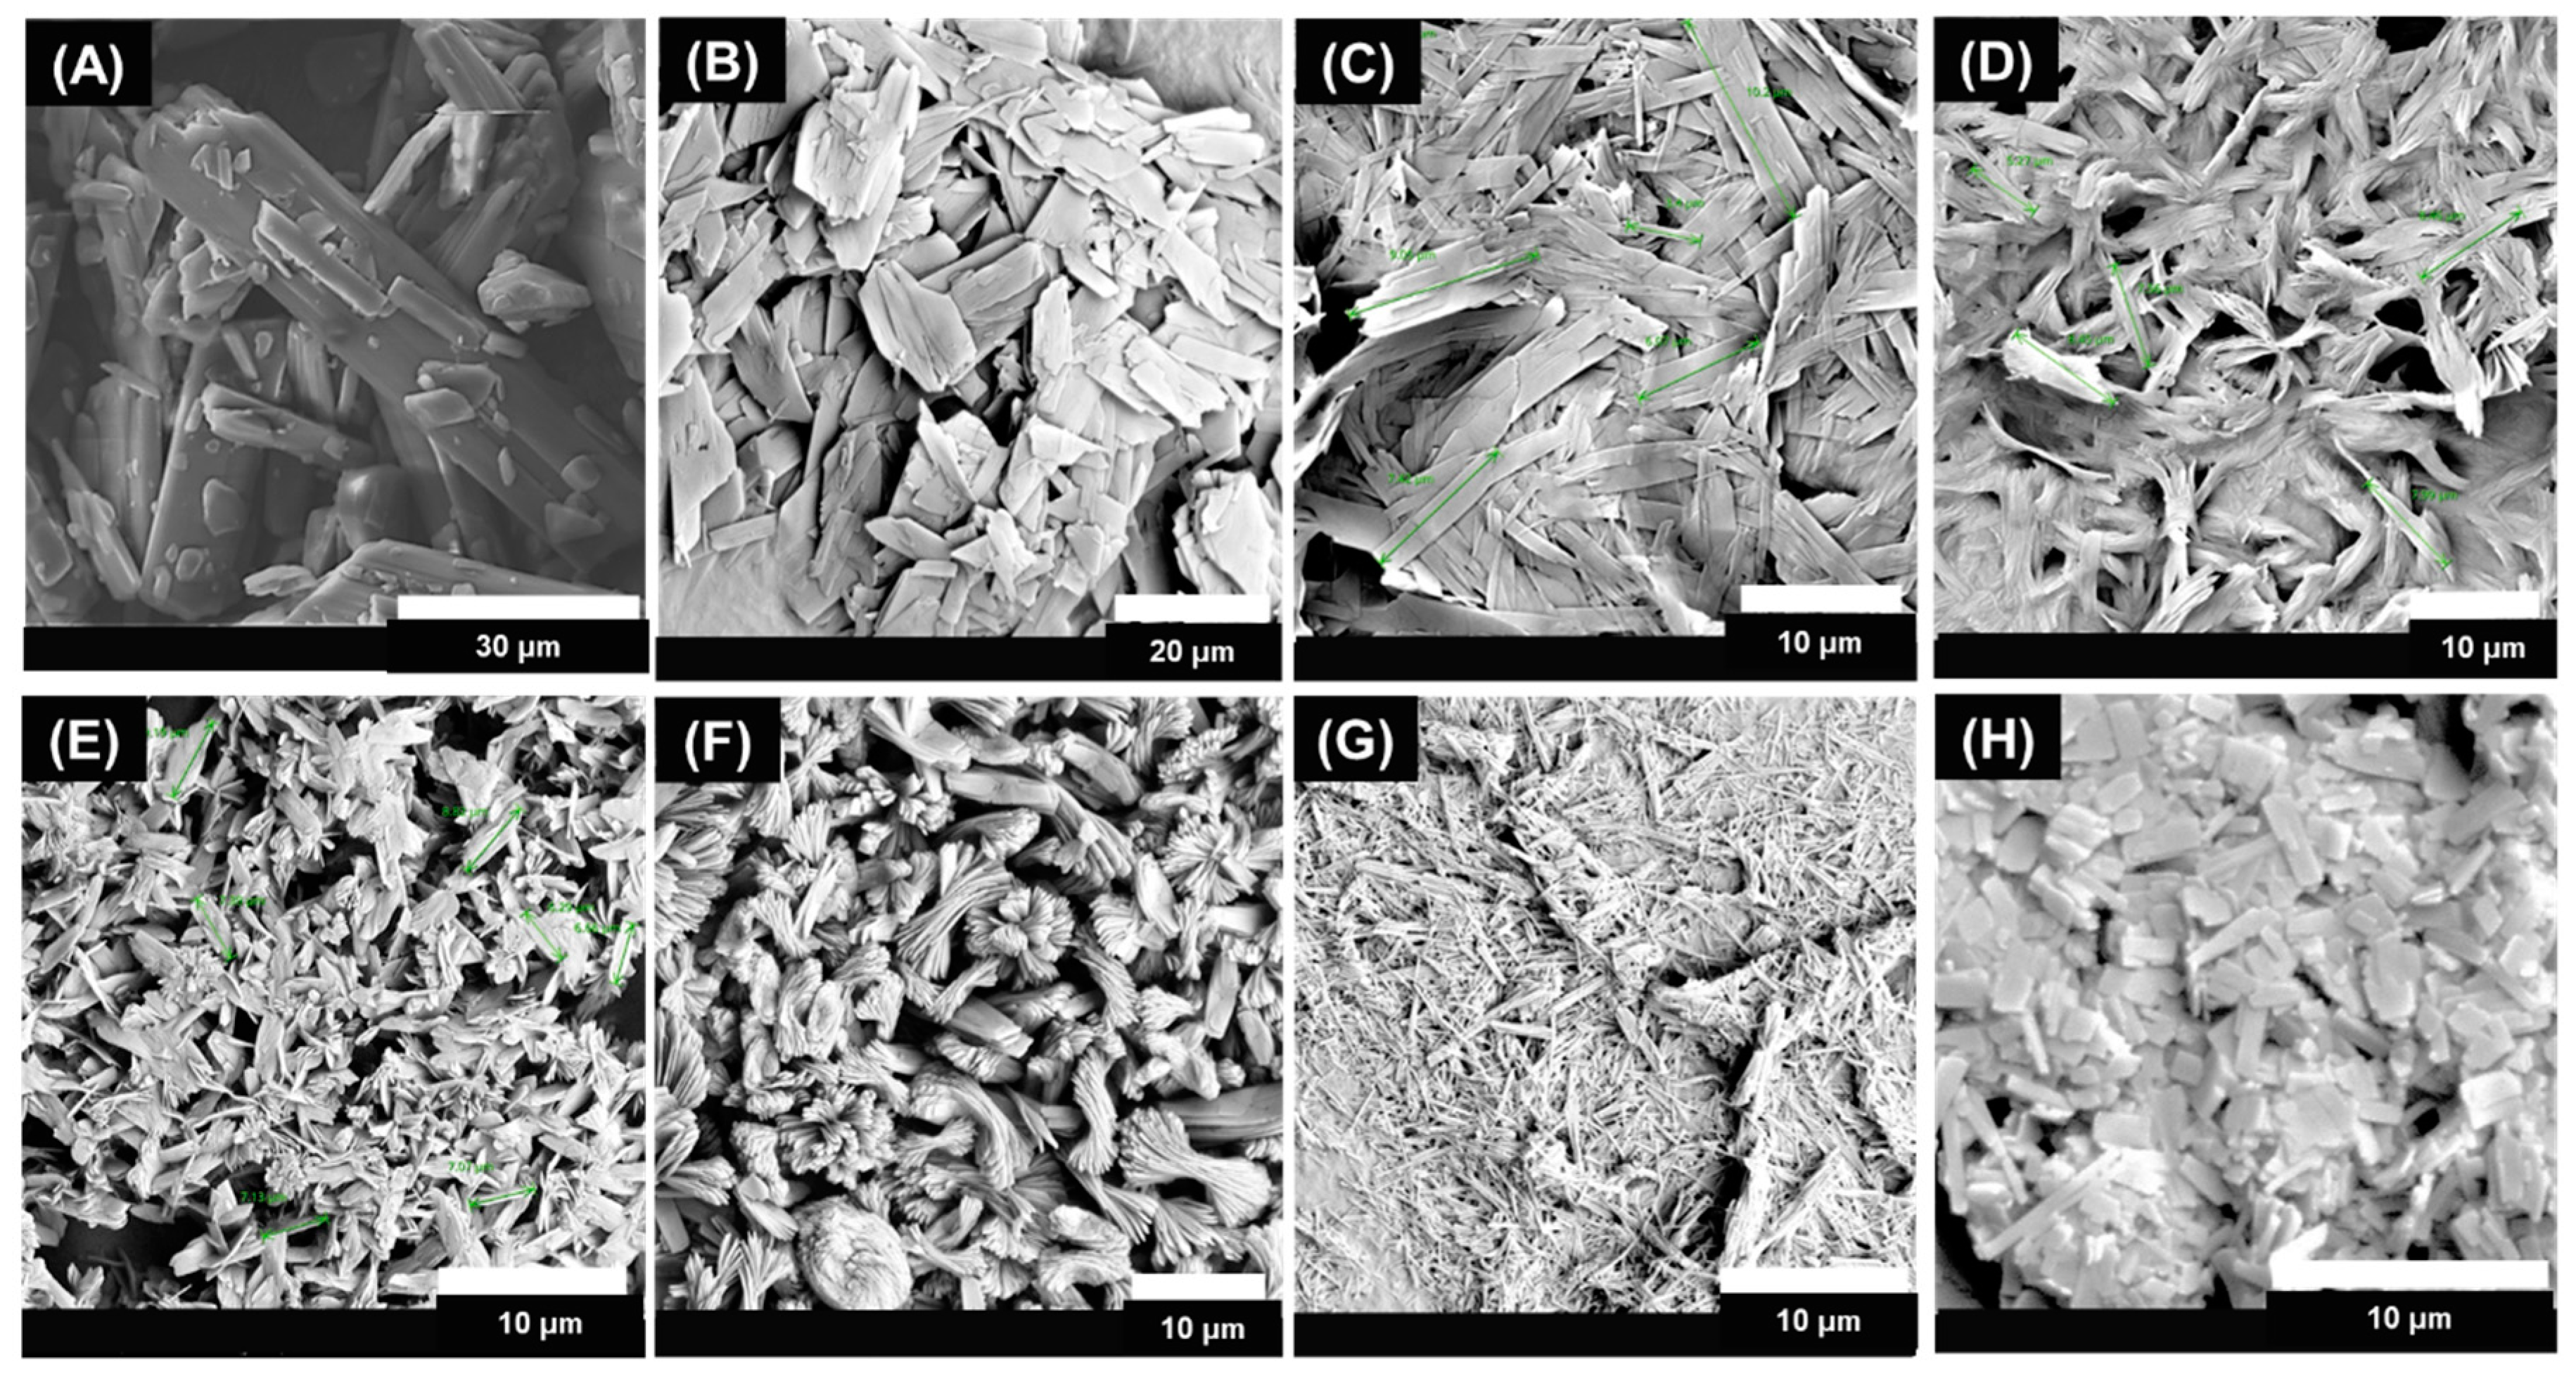
Stabilizer Selection
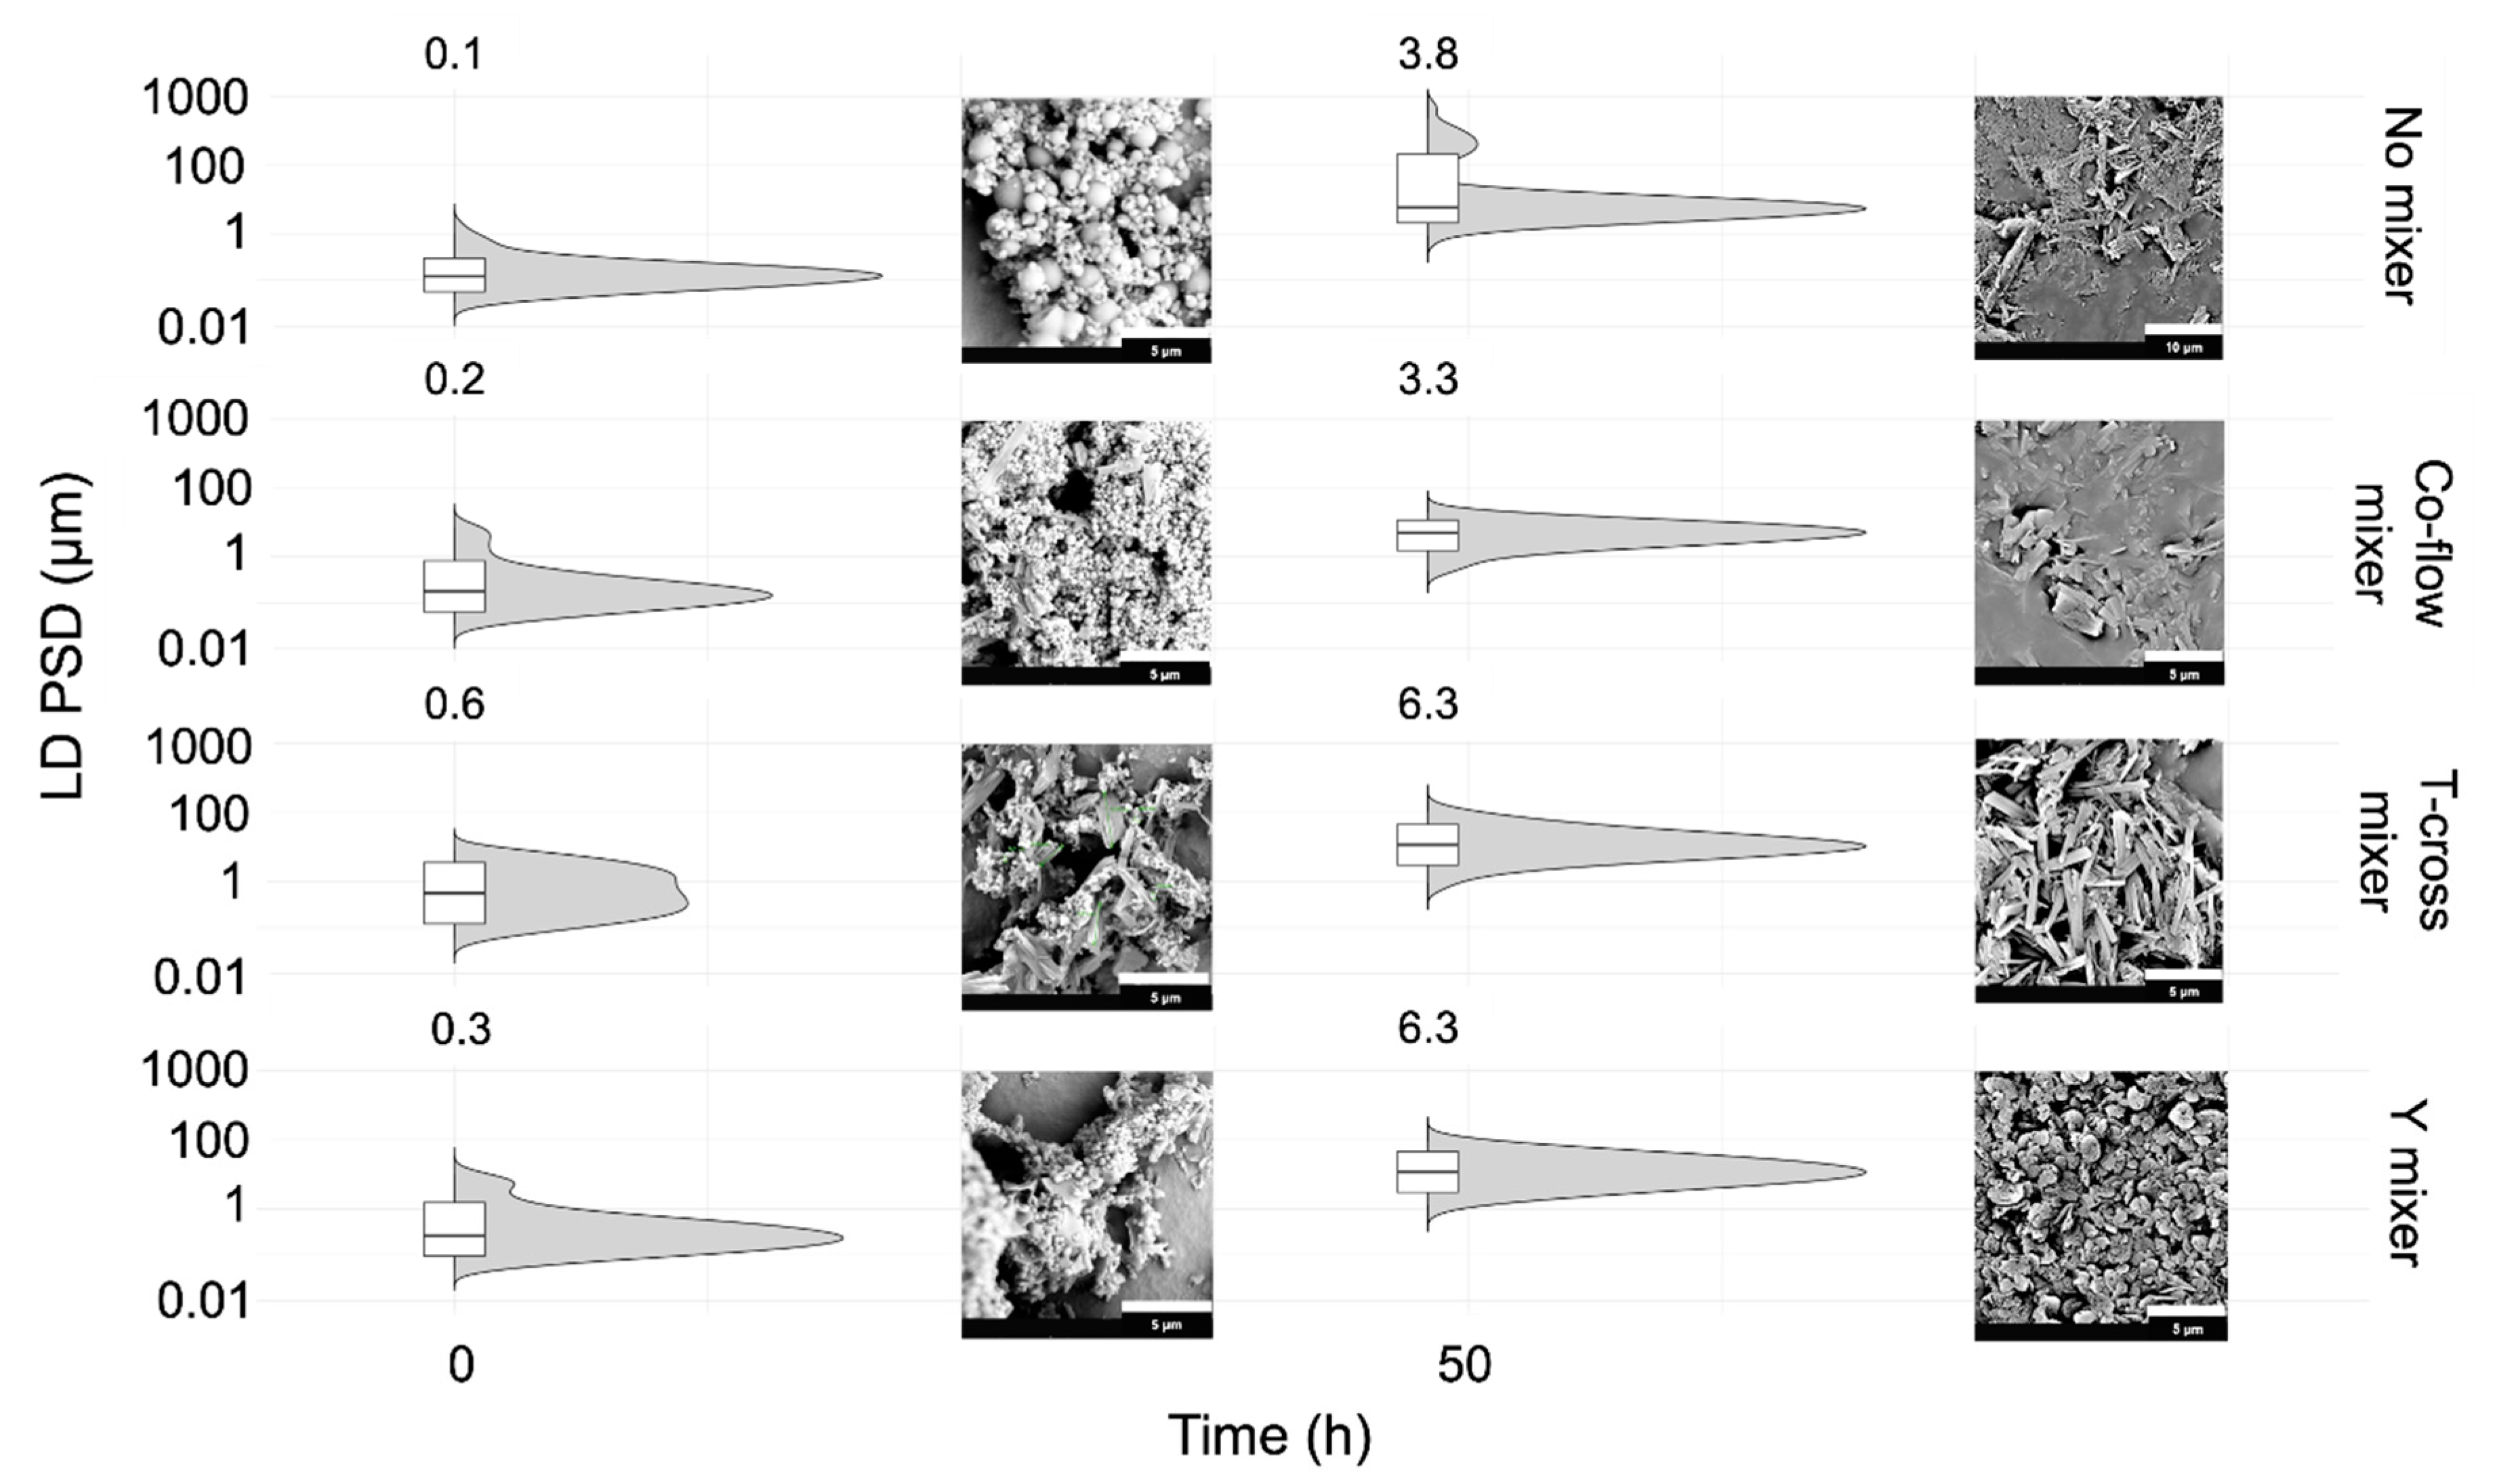
Effects of Static Mixing Devices on the SCT-CLASC Process
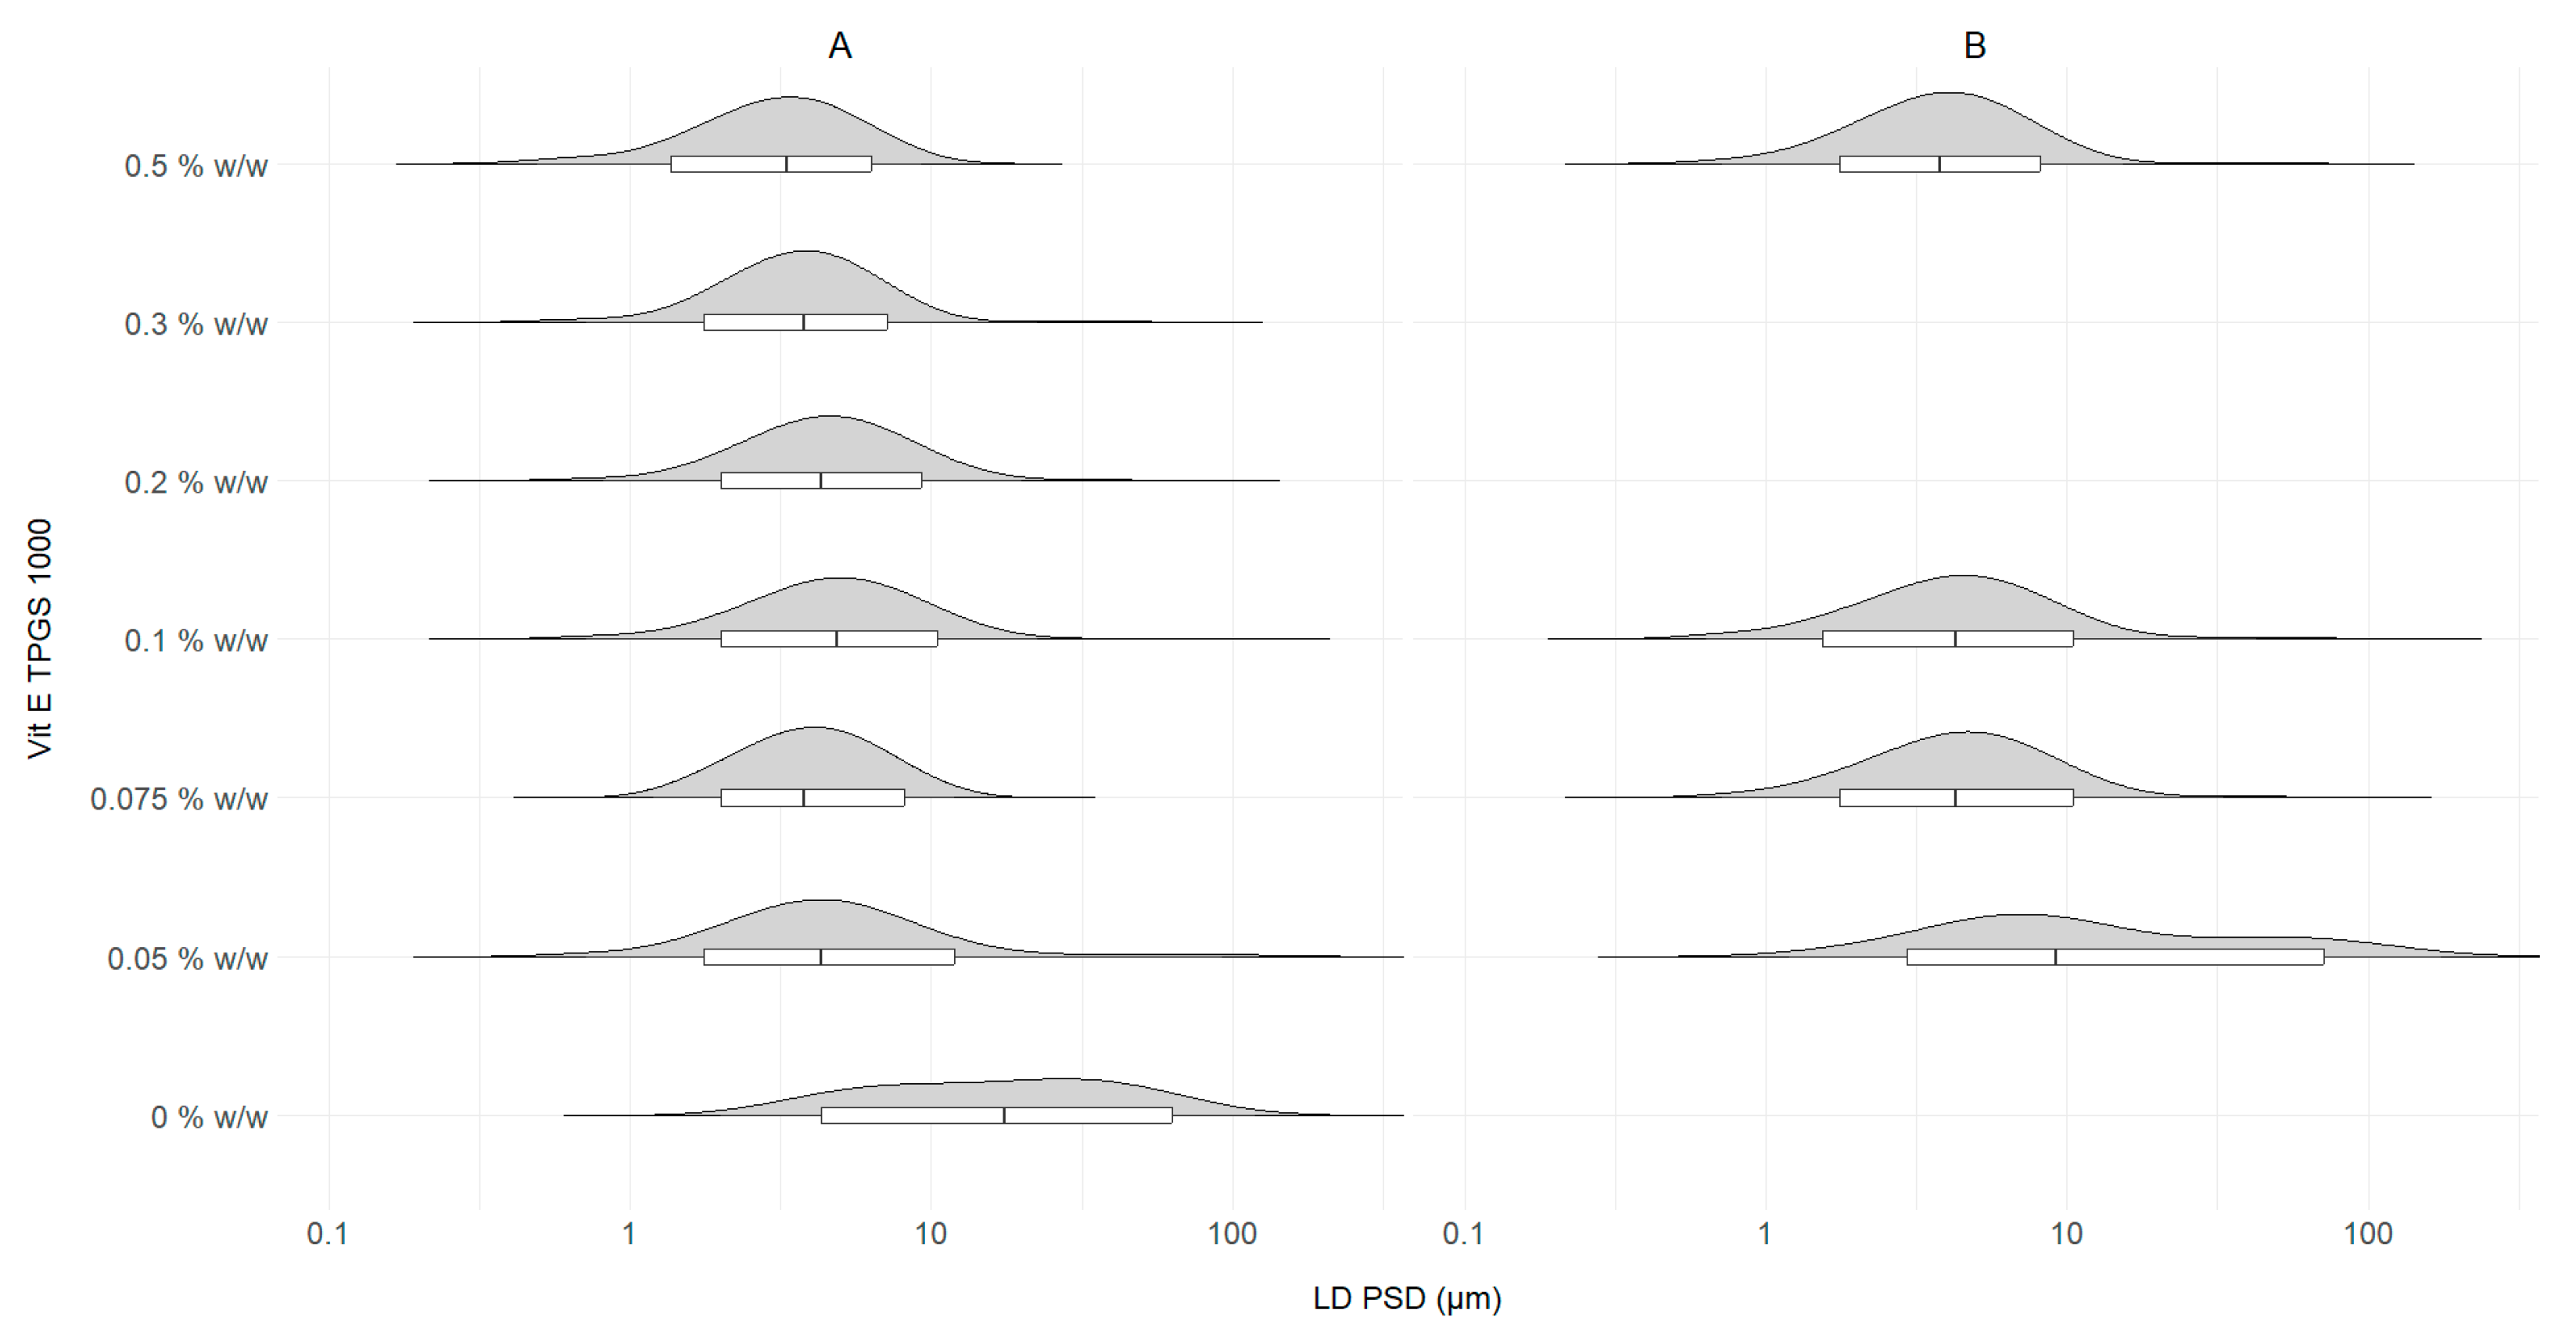
3.3. Stabilizer Concentration Optimization
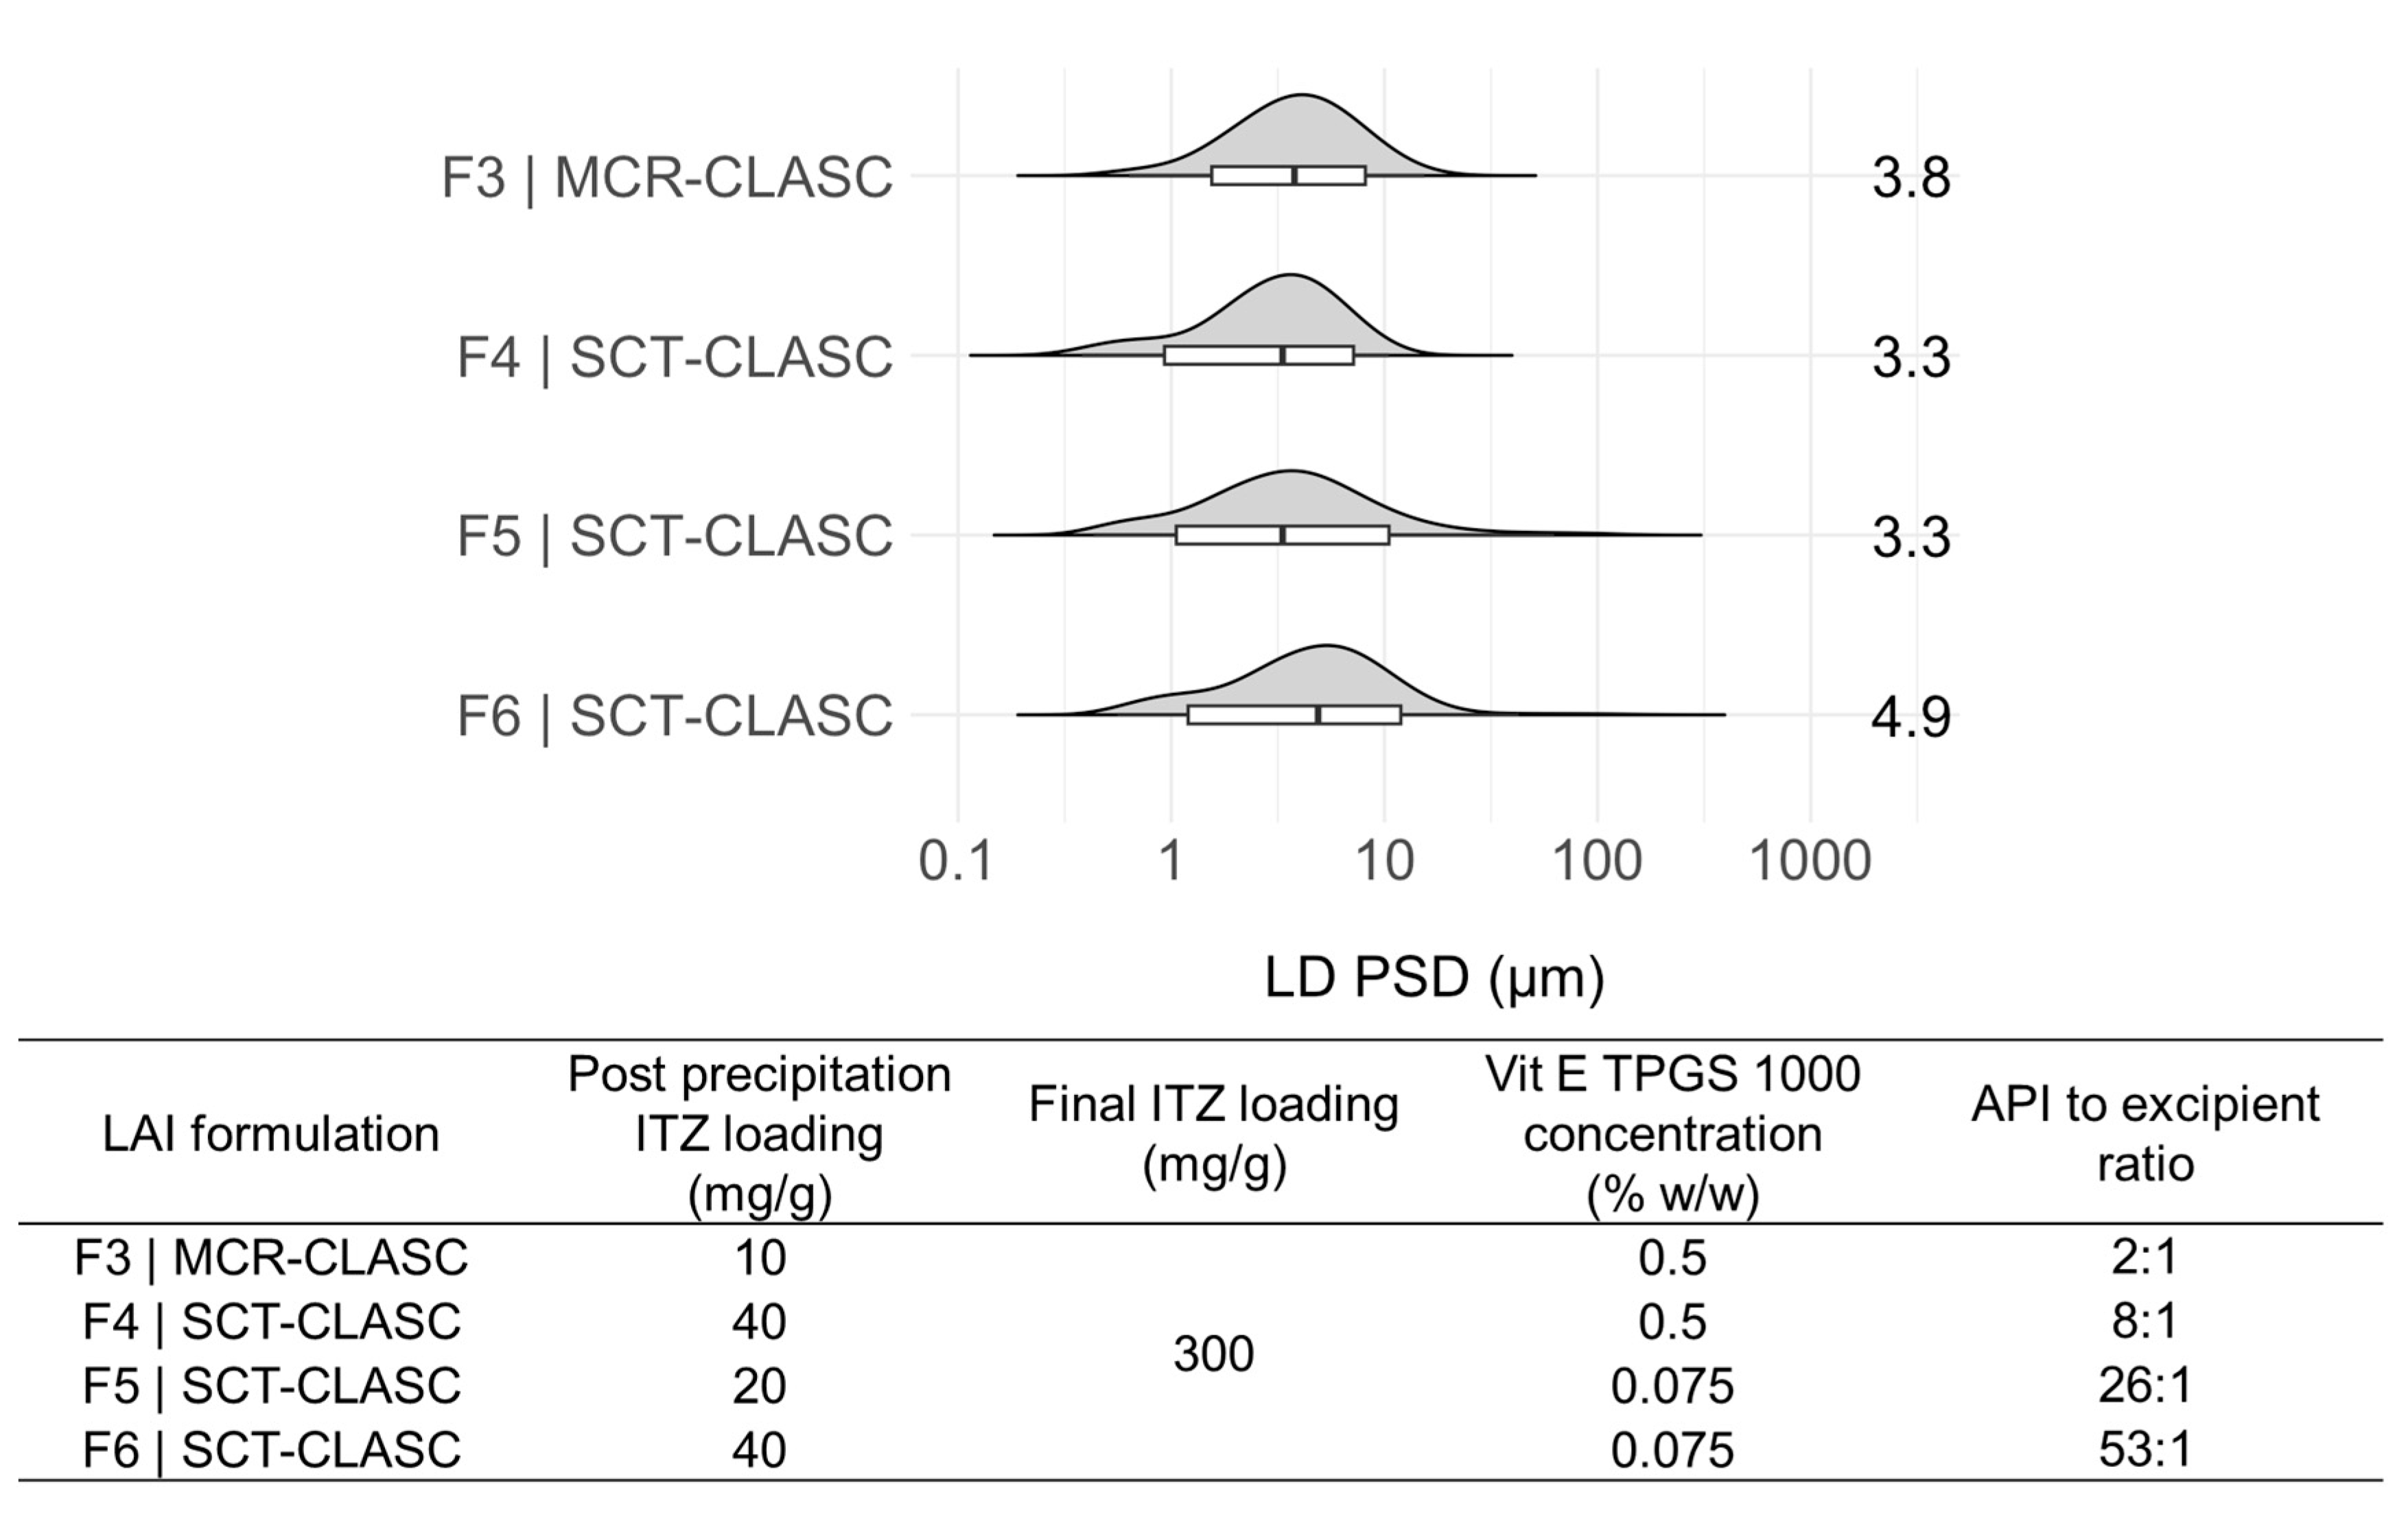
3.4. Comparison of Optimized Suspensions after the SCT-CLASC Process
3.5. Downstream Processing of LAI Suspensions
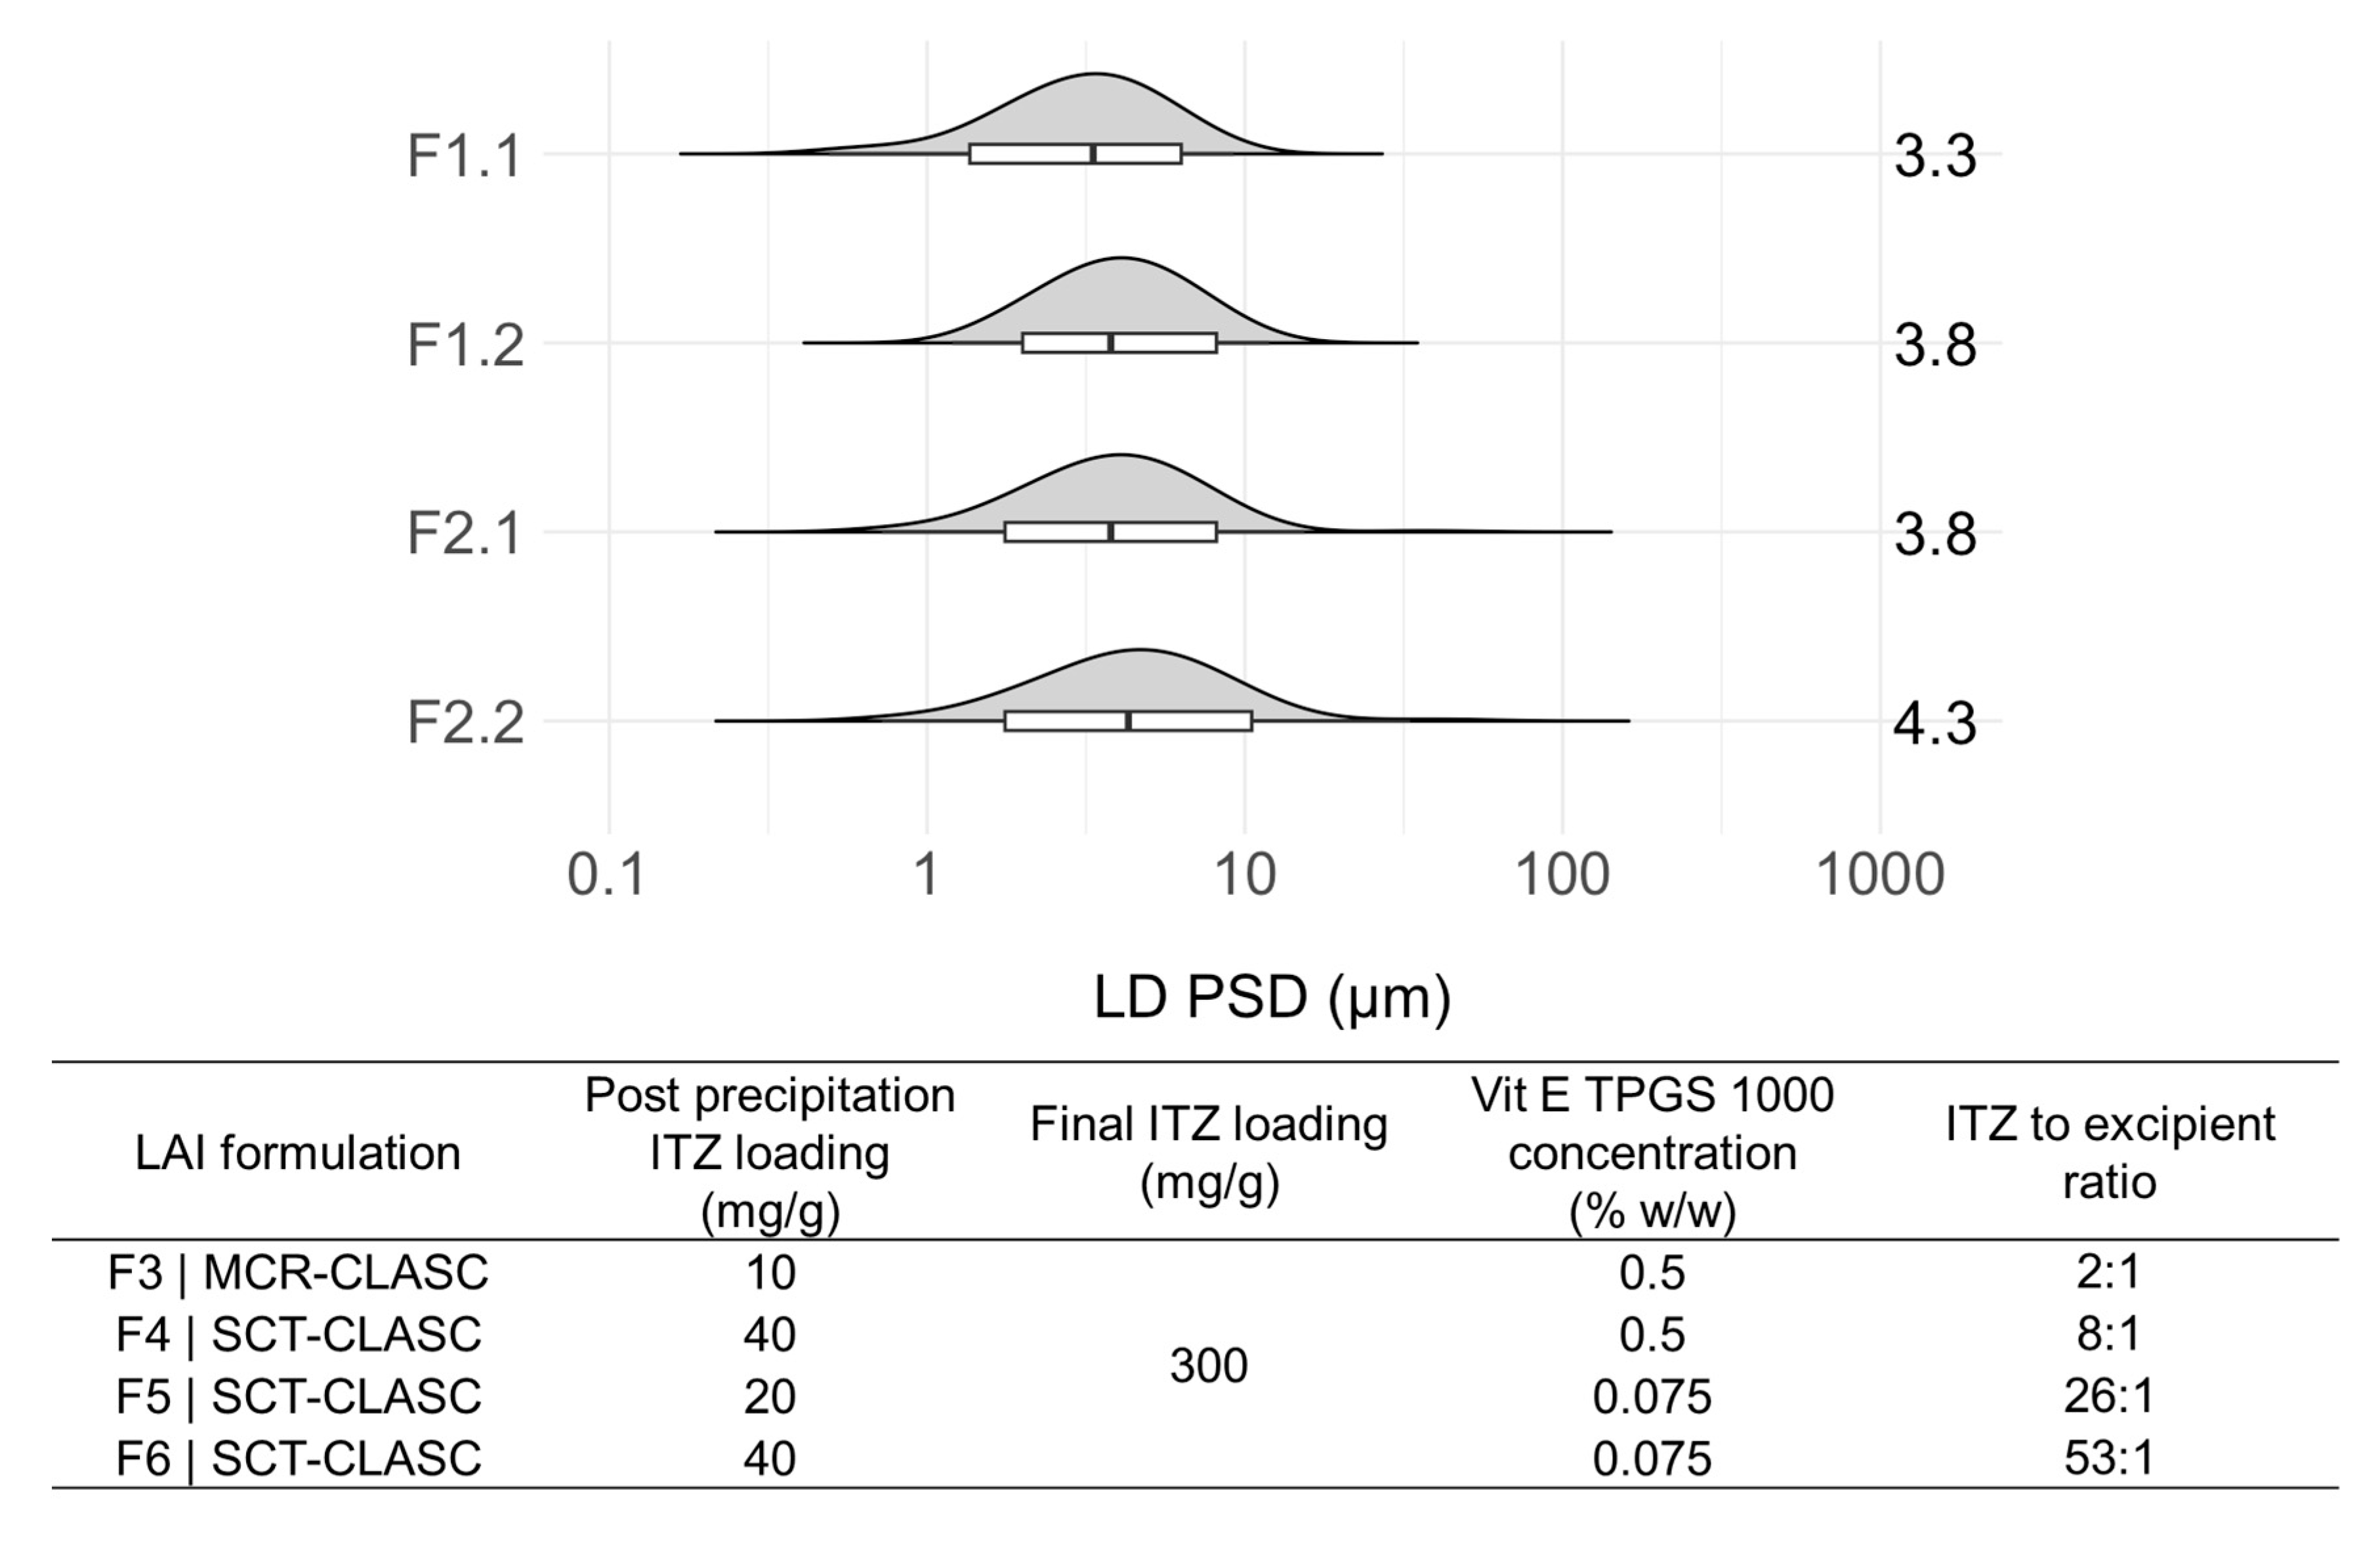
3.5.1. PSD Comparison of LAI Suspensions
3.5.2. Analysis of Final ITZ and Stabilizer Loading and Residual Solvent
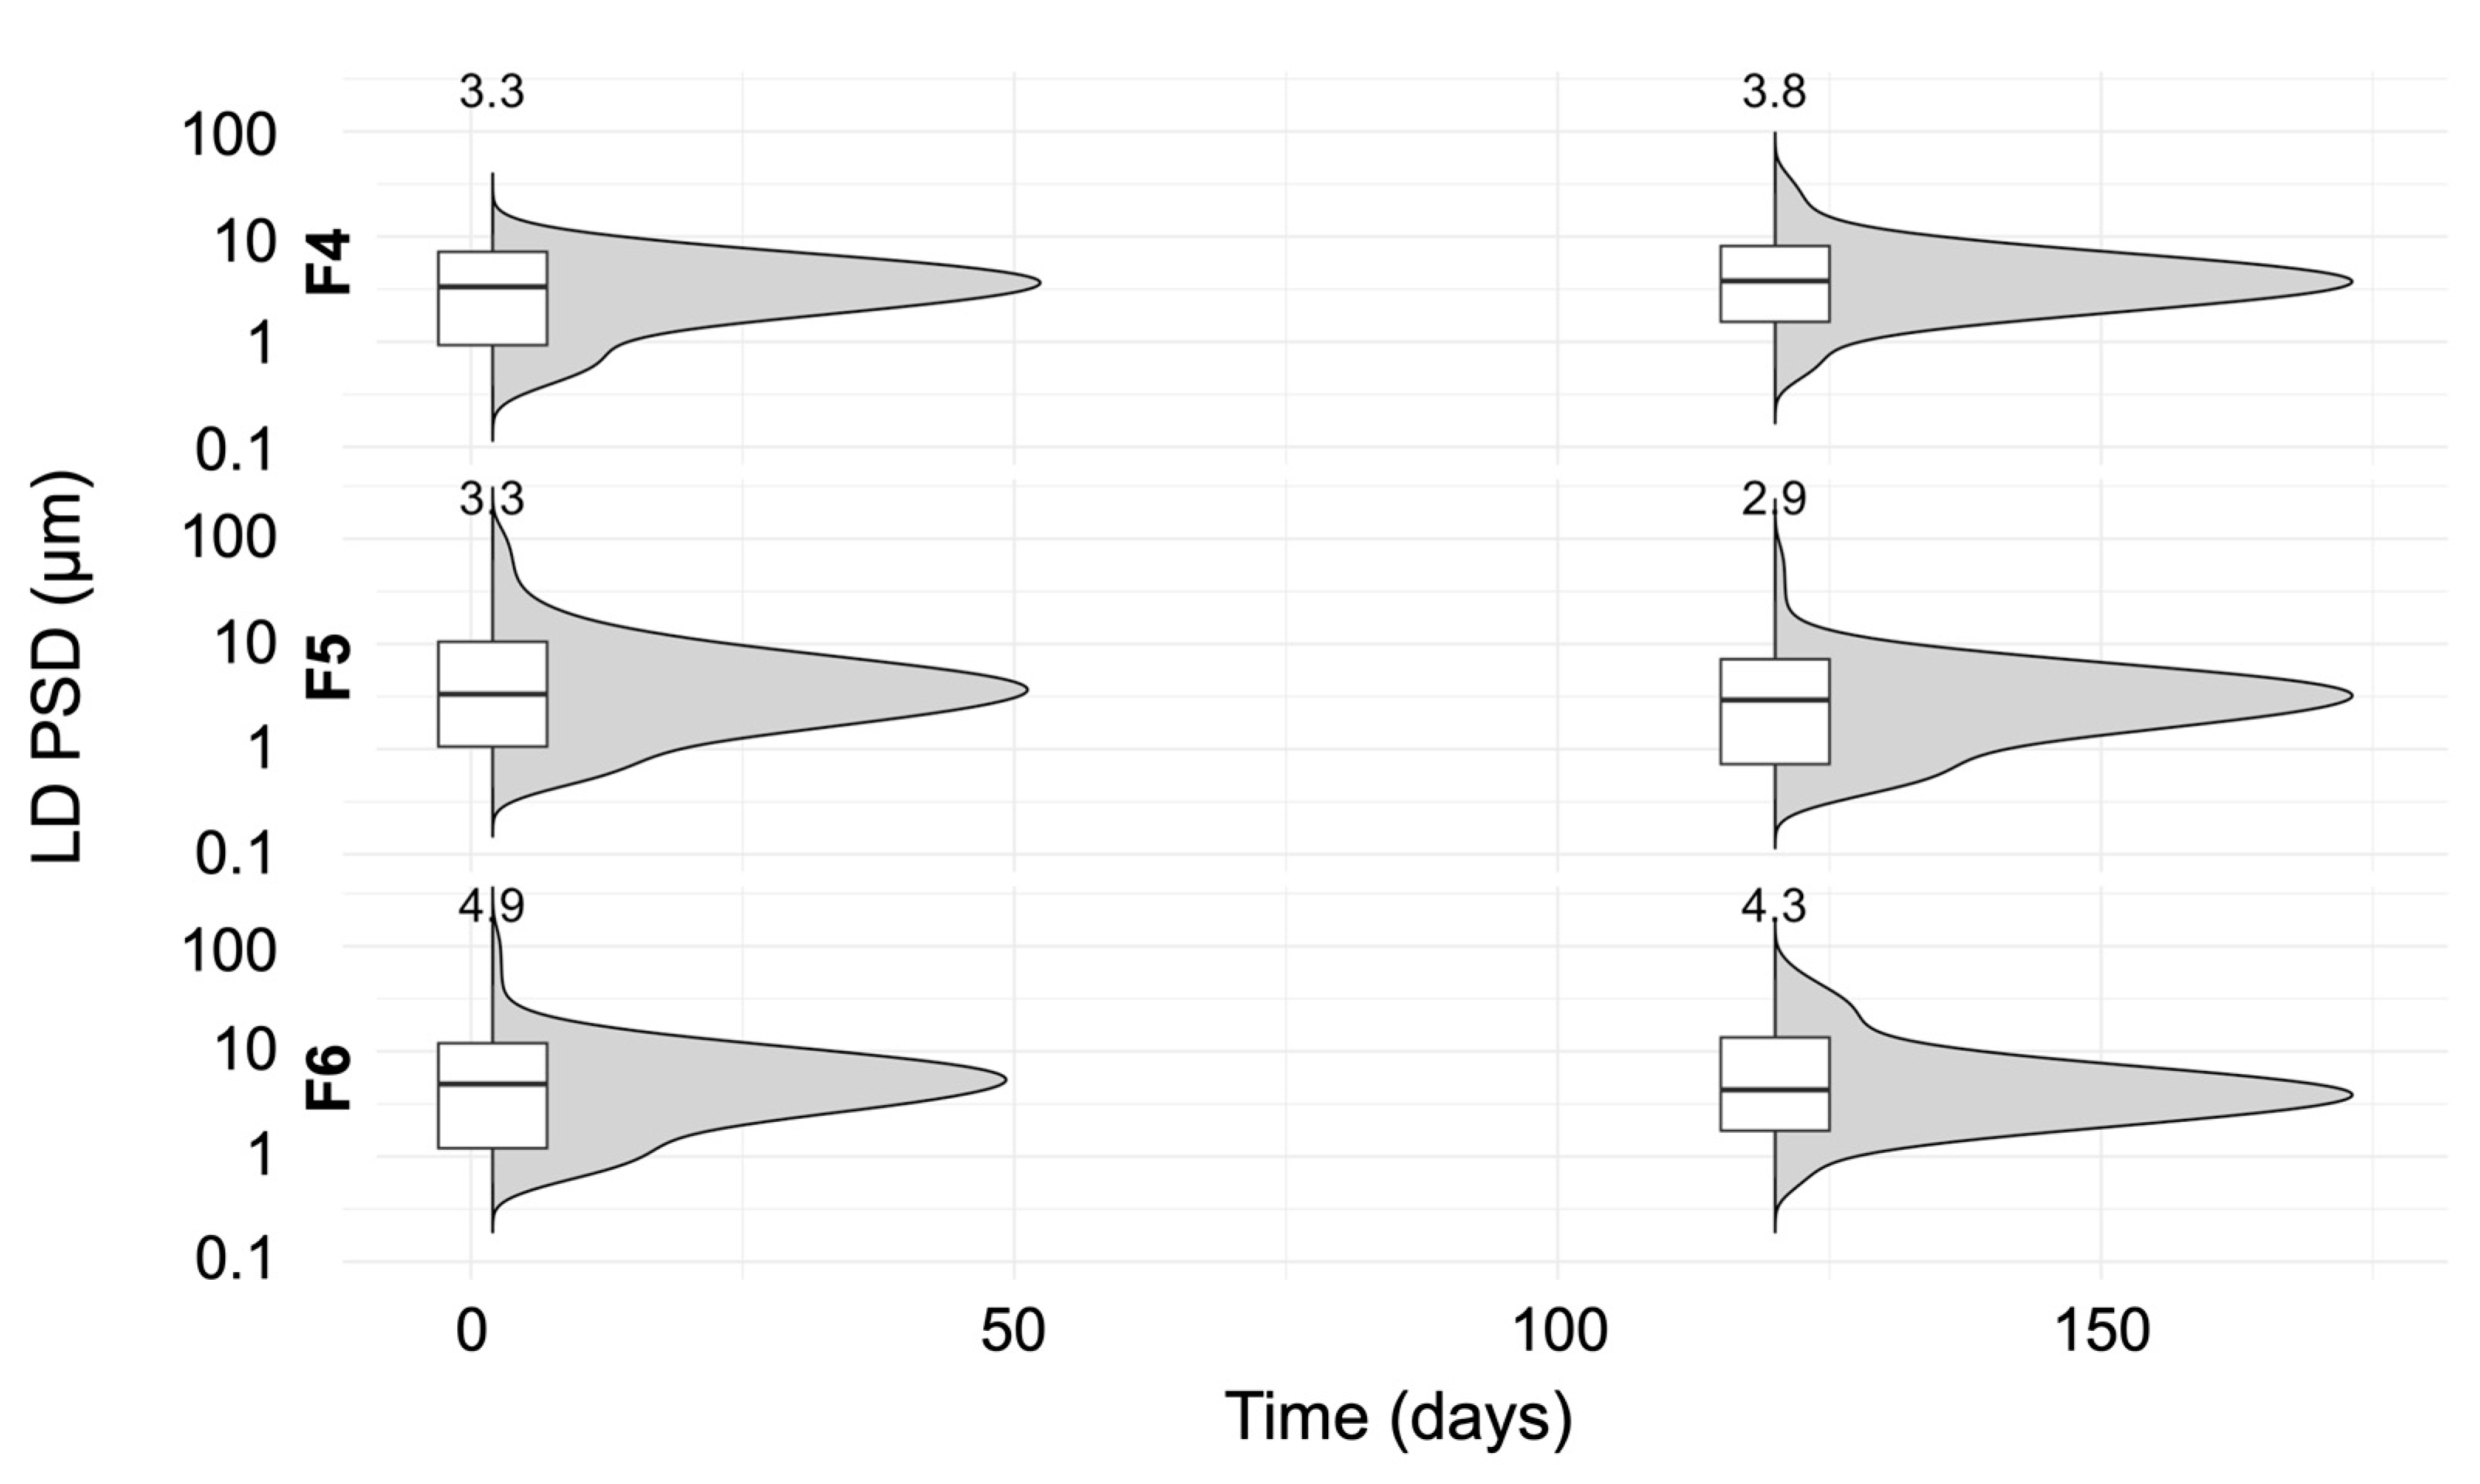
3.6. Stability
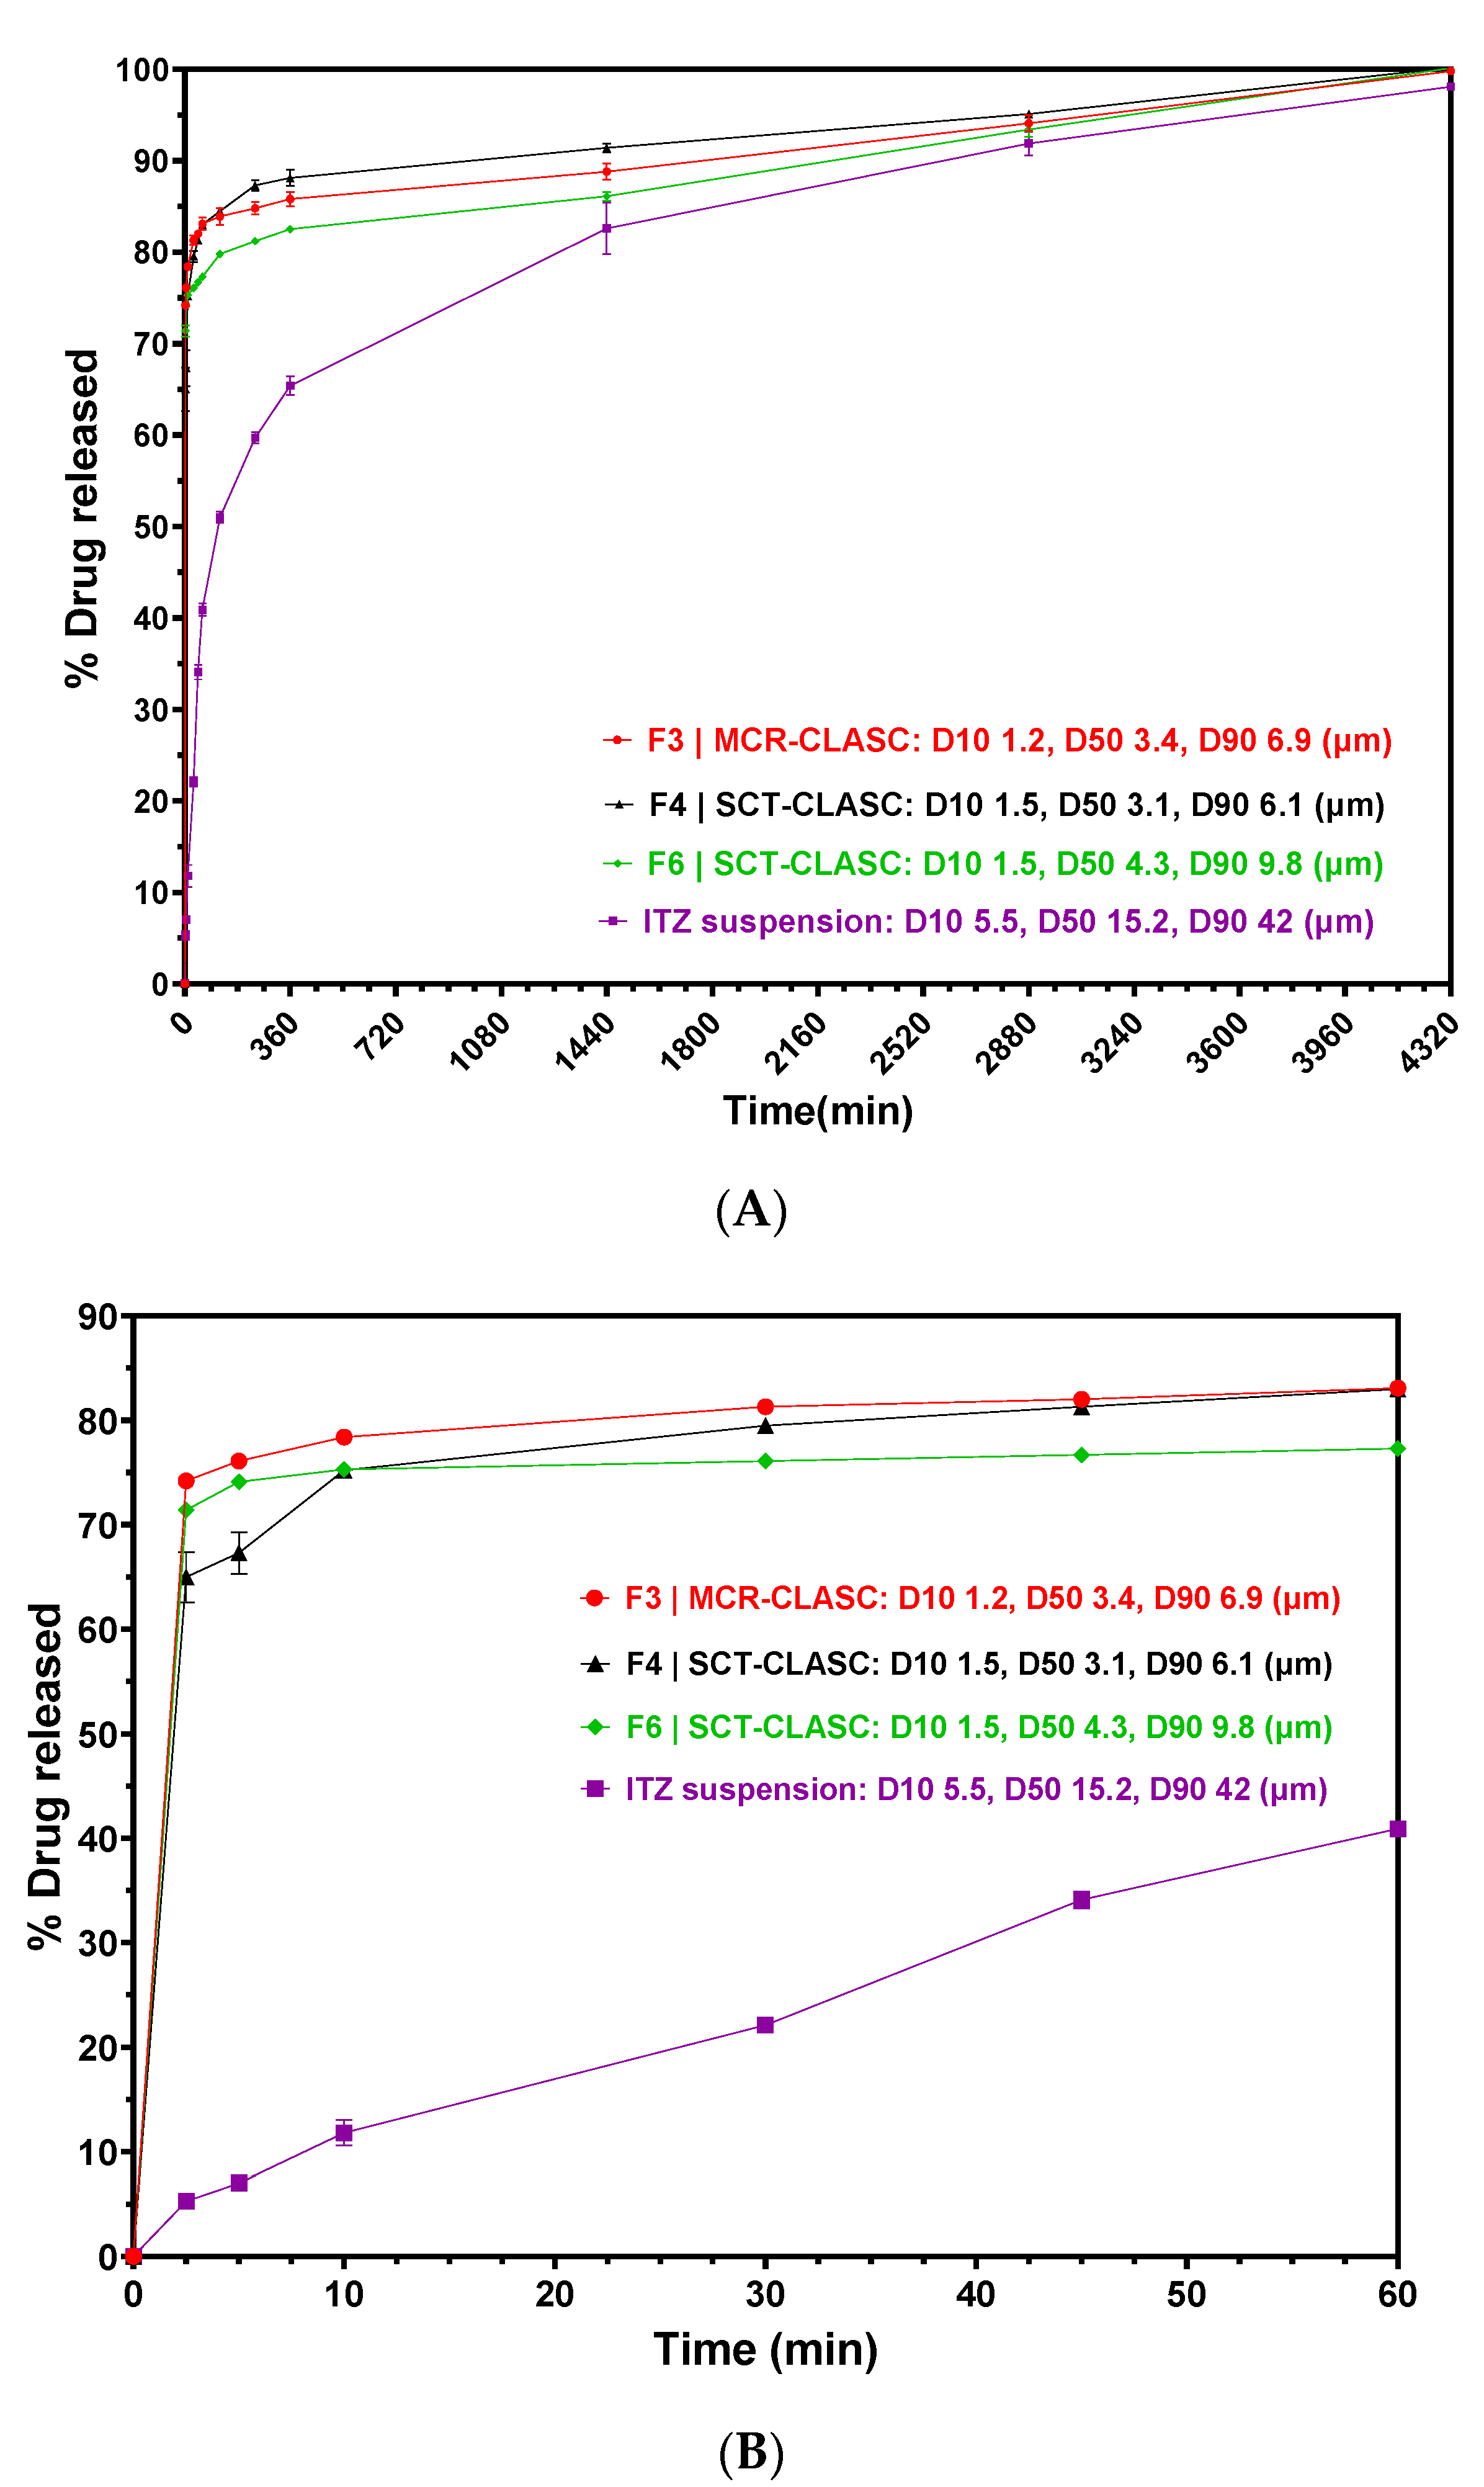
3.7. In Vitro Discriminatory Dissolution Comparison
4. Conclusions
Supplementary Materials
Author Contributions
Funding
Institutional Review Board Statement
Informed Consent Statement
Data Availability Statement
Conflicts of Interest
Abbreviations
| API | Active pharmaceutical ingredient |
| AS | Antisolvent |
| CLASC | Continuous liquid antisolvent crystallization |
| D10 | The proportion of the distribution of particles with diameters smaller than the value is 10% |
| D50 | Median diameter of the distribution of particles |
| D90 | The proportion of the distribution of particles with diameters below the value is 90% |
| FEP | Fluorinated ethylene propylene |
| HPMC | Hydroxy propyl methyl cellulose |
| IM | Intramuscular |
| ITZ | Itraconazole |
| IVR | In vitro drug release |
| HPMC | Hydroxy propyl methyl cellulose |
| LAI | Long-acting injectables |
| LASC | Liquid antisolvent crystallization |
| MCR-CLASC | Microchannel reactor-based CLASC |
| NMP | N-methyl pyrrolidone |
| NaCMC | Sodium carboxymethylcellulose |
| PEA | Perfluoro alkoxy |
| PEEK | Polyether ether ketone |
| POL | Poloxamer |
| PSD | Particle size distribution |
| PVP K30 | Polyvinyl pyrrolidone K30 |
| PBS | Phosphate buffer saline of pH 7.4 |
| PXRD | Powder X-ray diffraction |
| PSD | Particle size distribution |
| S | Solvent |
| SEM | Scanning electron microscopy |
| SC | Subcutaneous |
| SCT-CLASC | Secoya microfluidic crystallization technology-based CLASC |
| UPLC | Ultra-high-performance liquid chromatography |
| USFDA | US Food and Drug Administration |
| Vit E TPGS 1000 | D-α-Tocopherol polyethylene glycol 1000 succinate |
References
- Gonella, A.; Grizot, S.; Liu, F.; López Noriega, A.; Richard, J. Long-Acting Injectable Formulation Technologies: Challenges and Opportunities for the Delivery of Fragile Molecules. Expert Opin. Drug Deliv. 2022, 19, 927–944. [Google Scholar] [CrossRef] [PubMed]
- Nkanga, C.I.; Fisch, A.; Rad-Malekshahi, M.; Romic, M.D.; Kittel, B.; Ullrich, T.; Wang, J.; Krause, R.W.M.; Adler, S.; Lammers, T.; et al. Clinically Established Biodegradable Long Acting Injectables: An Industry Perspective. Adv. Drug Deliv. Rev. 2020, 167, 19–46. [Google Scholar] [CrossRef] [PubMed]
- Remenar, J.F. Making the Leap from Daily Oral Dosing to Long-Acting Injectables: Lessons from the Antipsychotics. Mol. Pharm. 2014, 11, 1739–1749. [Google Scholar] [CrossRef] [PubMed]
- Holm, R.; Lee, R.W.; Glassco, J.; DiFranco, N.; Bao, Q.; Burgess, D.J.; Lukacova, V.; Alidori, S. Long-Acting Injectable Aqueous Suspensions—Summary from an AAPS Workshop. AAPS J. 2023, 25, 49. [Google Scholar] [CrossRef]
- Kim, Y.-C.; Min, K.A.; Jang, D.-J.; Ahn, T.Y.; Min, J.H.; Yu, B.E.; Cho, K.H. Practical Approaches on the Long-Acting Injections. J. Pharm. Investig. 2020, 50, 147–157. [Google Scholar] [CrossRef]
- Swindells, S.; Siccardi, M.; Barrett, S.E.; Olsen, D.B.; Grobler, J.A.; Podany, A.T.; Nuermberger, E.; Kim, P.; Barry, C.E.; Owen, A.; et al. Long-Acting Formulations for the Treatment of Latent Tuberculous Infection: Opportunities and Challenges. Int. J. Tuberc. Lung Dis. 2018, 22, 125–132. [Google Scholar] [CrossRef]
- Owen, A.; Rannard, S. Strengths, Weaknesses, Opportunities and Challenges for Long Acting Injectable Therapies: Insights for Applications in HIV Therapy. Adv. Drug Deliv. Rev. 2016, 103, 144–156. [Google Scholar] [CrossRef] [PubMed]
- Bassand, C.; Villois, A.; Gianola, L.; Laue, G.; Ramazani, F.; Riebesehl, B.; Sanchez-Felix, M.; Sedo, K.; Ullrich, T.; Duvnjak Romic, M. Smart Design of Patient-Centric Long-Acting Products: From Preclinical to Marketed Pipeline Trends and Opportunities. Expert Opin. Drug Deliv. 2022, 19, 1265–1283. [Google Scholar] [CrossRef]
- Chaudhary, K.; Patel, M.M.; Mehta, P.J. Long-Acting Injectables: Current Perspectives and Future Promise. Crit. Rev. Ther. Drug Carr. Syst. 2019, 36, 137–181. [Google Scholar] [CrossRef]
- de Filippis, R.; De Fazio, P.; Gaetano, R.; Steardo, L.; Cedro, C.; Bruno, A.; Zoccali, R.A.; Muscatello, M.R.A. Current and Emerging Long-Acting Antipsychotics for the Treatment of Schizophrenia. Expert Opin. Drug Saf. 2021, 20, 771–790. [Google Scholar] [CrossRef]
- Bauer, A.; Berben, P.; Chakravarthi, S.S.; Chattorraj, S.; Garg, A.; Gourdon, B.; Heimbach, T.; Huang, Y.; Morrison, C.; Mundhra, D.; et al. Current State and Opportunities with Long-Acting Injectables: Industry Perspectives from the Innovation and Quality Consortium “Long-Acting Injectables” Working Group. Pharm. Res. 2023, 40, 1601–1631. [Google Scholar] [CrossRef] [PubMed]
- Peters, L.; Dyer, M.; Schroeder, E.; D’Souza, M.S. Invega Hafyera (Paliperidone Palmitate): Extended-Release Injectable Suspension for Patients with Schizophrenia. J. Pharm. Technol. 2023, 39, 88–94. [Google Scholar] [CrossRef] [PubMed]
- Li, S.; He, Y.; Sun, D.; Wang, Z.; Yu, J.; Ye, J.; He, Z.; Wang, Y. Long Acting Ionically Paired Pamoate-Based Suspension of Lurasidone: An Exploration of Size Effects on in Vitro Dissolution and in Vivo Pharmacokinetic Behaviors. AAPS PharmSciTech 2023, 24, 83. [Google Scholar] [CrossRef] [PubMed]
- Ma, Z.; Zhang, H.; Wang, Y.; Tang, X. Development and Evaluation of Intramuscularly Administered Nano/Microcrystal Suspension. Expert Opin. Drug Deliv. 2019, 16, 347–361. [Google Scholar] [CrossRef] [PubMed]
- Kumar, R.; Thakur, A.K.; Banerjee, N.; Kumar, A.; Gaurav, G.K.; Arya, R.K. Liquid Antisolvent Crystallization of Pharmaceutical Compounds: Current Status and Future Perspectives. Drug Deliv. Transl. Res. 2023, 13, 400–418. [Google Scholar] [CrossRef] [PubMed]
- Płaczek, M.; Jacyna, J.; Sznitowska, M. Prolonged-Release Drug Formulations for Parenteral Administration. Part l. Suspensions and Oily Solutions for Injection. Pol. Merkur. Lekarski. 2013, 35, 391–396. [Google Scholar]
- Nguyen, V.T.T.; Darville, N.; Vermeulen, A. Pharmacokinetics of Long-Acting Aqueous Nano-/Microsuspensions After Intramuscular Administration in Different Animal Species and Humans—A Review. AAPS J. 2022, 25, 4. [Google Scholar] [CrossRef] [PubMed]
- Jain, R.; Meyer, J.; Wehr, A.; Rege, B.; von Moltke, L.; Weiden, P.J. Size Matters: The Importance of Particle Size in a Newly Developed Injectable Formulation for the Treatment of Schizophrenia. CNS Spectr. 2020, 25, 323–330. [Google Scholar] [CrossRef]
- Chamanza, R.; Darville, N.; van Heerden, M.; De Jonghe, S. Comparison of the Local Tolerability to 5 Long-Acting Drug Nanosuspensions with Different Stabilizing Excipients, Following a Single Intramuscular Administration in the Rat. Toxicol. Pathol. 2018, 46, 85–100. [Google Scholar] [CrossRef]
- Mittal, S.; Kazakevich, I.; Bhattacharjee, H.; Bakker, P.; Schenck, L.; Goldfarb, D.J. Formulation for Parenteral Administration. WO 2018/175271 Al, 2018, 1–20. Available online: https://patentimages.storage.googleapis.com/df/0c/71/382840175a58f7/WO2018175271A1.pdf (accessed on 27 January 2024).
- Hugo Silva, M.; Kumar, A.; Hodnett, B.K.; Tajber, L.; Holm, R.; Hudson, S.P. Impact of Excipients and Seeding on the Solid-State Form Transformation of Indomethacin during Liquid Antisolvent Precipitation. Cryst. Growth Des. 2022, 22, 6056–6069. [Google Scholar] [CrossRef]
- Anjum, F.; Wessner, M.; Sadowski, G. Membrane-Based Solvent Exchange Process for Purification of API Crystal Suspensions. Membranes 2023, 13, 263. [Google Scholar] [CrossRef] [PubMed]
- Kumar, S.; Burgess, D.J. Nanosuspensions. In Long Acting Injections and Implants; Springer US: Boston, MA, USA, 2012; pp. 239–261. [Google Scholar]
- McComiskey, K.P.M.; Mugheirbi, N.A.; Stapleton, J.; Tajber, L. In Situ Monitoring of Nanoparticle Formation: Antisolvent Precipitation of Azole Anti-Fungal Drugs. Int. J. Pharm. 2018, 543, 201–213. [Google Scholar] [CrossRef] [PubMed]
- Di Profio, G.; Stabile, C.; Caridi, A.; Curcio, E.; Drioli, E. Antisolvent Membrane Crystallization of Pharmaceutical Compounds. J. Pharm. Sci. 2009, 98, 4902–4913. [Google Scholar] [CrossRef] [PubMed]
- Chergaoui, S.; Debecker, D.P.; Leyssens, T.; Luis, P. Key Parameters Impacting the Crystal Formation in Antisolvent Membrane-Assisted Crystallization. Membranes 2023, 13, 140. [Google Scholar] [CrossRef] [PubMed]
- Thorat, A.A.; Dalvi, S.V. Liquid Antisolvent Precipitation and Stabilization of Nanoparticles of Poorly Water Soluble Drugs in Aqueous Suspensions: Recent Developments and Future Perspective. Chem. Eng. J. 2012, 181–182, 1–34. [Google Scholar] [CrossRef]
- Zhu, W.-Z.; Wang, J.-X.; Shao, L.; Zhang, H.; Zhang, Q.; Chen, J.-F. Liquid Antisolvent Preparation of Amorphous Cefuroxime Axetil Nanoparticles in a Tube-in-Tube Microchannel Reactor. Int. J. Pharm. 2010, 395, 260–265. [Google Scholar] [CrossRef]
- Fatemi, N.; Devos, C.; Van Gerven, T.; Kuhn, S. Continuous Crystallization of Paracetamol Exploiting Gas–Liquid Flow in Modular Nucleation and Growth Stages. Chem. Eng. Sci. 2022, 248, 117095. [Google Scholar] [CrossRef]
- Fang, L.; Gao, Z.; Gao, Z.; Huang, W.; Wan, X.; Rohani, S.; Gong, J. Controlled Crystallization of Metastable Polymorphic Pharmaceutical: Comparative Study of Batchwise and Continuous Tubular Crystallizers. Chem. Eng. Sci. 2023, 266, 118277. [Google Scholar] [CrossRef]
- Bhamidi, V.; Lee, S.H.; He, G.; Chow, P.S.; Tan, R.B.H.; Zukoski, C.F.; Kenis, P.J.A. Antisolvent Crystallization and Polymorph Screening of Glycine in Microfluidic Channels Using Hydrodynamic Focusing. Cryst. Growth Des. 2015, 15, 3299–3306. [Google Scholar] [CrossRef]
- Mukhopadhyay, R. When Microfluidic Devices Go. Anal. Chem. 2005, 77, 429–432. [Google Scholar] [CrossRef]
- Wang, Y.; Liu, Y.; Liu, M.; Qian, W.; Zhou, D.; Liu, T.; Luo, G.; Xing, M. Short Fluorocarbon Chains Containing Hydrophobic Nanofibrous Membranes with Improved Hemocompatibility, Anticoagulation and Anti-Fouling Performance. Colloids Surf. B Biointerfaces 2019, 180, 49–57. [Google Scholar] [CrossRef]
- Rimez, B.; Conté, J.; Lecomte-Norrant, E.; Cognet, P.; Gourdon, C.; Scheid, B. Continuous-Flow Tubular Crystallization to Discriminate between Two Competing Crystal Polymorphs. 2. Antisolvent Crystallization. Cryst. Growth Des. 2018, 18, 6440–6447. [Google Scholar] [CrossRef]
- Li, J.; Sheng, L.; Tuo, L.; Xiao, W.; Ruan, X.; Yan, X.; He, G.; Jiang, X. Membrane-Assisted Antisolvent Crystallization: Interfacial Mass-Transfer Simulation and Multistage Process Control. Ind. Eng. Chem. Res. 2020, 59, 10160–10171. [Google Scholar] [CrossRef]
- Poornachary, S.K.; Han, G.; Kwek, J.W.; Chow, P.S.; Tan, R.B.H. Crystallizing Micronized Particles of a Poorly Water-Soluble Active Pharmaceutical Ingredient: Nucleation Enhancement by Polymeric Additives. Cryst. Growth Des. 2016, 16, 749–758. [Google Scholar] [CrossRef]
- Simone, E.; Klapwijk, A.R.; Wilson, C.C.; Nagy, Z.K. Investigation of the Evolution of Crystal Size and Shape during Temperature Cycling and in the Presence of a Polymeric Additive Using Combined Process Analytical Technologies. Cryst. Growth Des. 2017, 17, 1695–1706. [Google Scholar] [CrossRef] [PubMed]
- Matteucci, M.E.; Hotze, M.A.; Johnston, K.P.; Williams, R.O. Drug Nanoparticles by Antisolvent Precipitation: Mixing Energy versus Surfactant Stabilization. Langmuir 2006, 22, 8951–8959. [Google Scholar] [CrossRef]
- Meyer, T.; David, R.; Renken, A.; Villermaux, J. Micromixing in a static mixer and an empty tube by a chemical method. Proceedings of Tenth International Symposium on Chemical Reaction Engineering, Basle, Switzerland, 29 August–1 September 1988; Elsevier: Amsterdam, The Netherlands, 1988; pp. 1955–1960. [Google Scholar]
- Rimez, B.; Septavaux, J.; Debuysschère, R.; Scheid, B. The Creation and Testing of a Fully Continuous Tubular Crystallization Device Suited for Incorporation into Flow Chemistry Setups. J. Flow Chem. 2019, 9, 237–249. [Google Scholar] [CrossRef]
- Bodák, B.; Breveglieri, F.; Mazzotti, M. On the Model-Based Design and Comparison of Crystallization-Based Deracemization Techniques. Chem. Eng. Sci. 2022, 254, 117595. [Google Scholar] [CrossRef]
- Lai, T.-T.C.; Ferguson, S.; Palmer, L.; Trout, B.L.; Myerson, A.S. Continuous Crystallization and Polymorph Dynamics in the L-Glutamic Acid System. Org. Process Res. Dev. 2014, 18, 1382–1390. [Google Scholar] [CrossRef]
- Orehek, J.; Teslić, D.; Likozar, B. Continuous Crystallization Processes in Pharmaceutical Manufacturing: A Review. Org. Process Res. Dev. 2021, 25, 16–42. [Google Scholar] [CrossRef]
- Ma, Y.; Wu, S.; Macaringue, E.G.J.; Zhang, T.; Gong, J.; Wang, J. Recent Progress in Continuous Crystallization of Pharmaceutical Products: Precise Preparation and Control. Org. Process Res. Dev. 2020, 24, 1785–1801. [Google Scholar] [CrossRef]
- Rimez, B.; Septavaux, J.; Scheid, B. The Coupling of In-Flow Reaction with Continuous Flow Seedless Tubular Crystallization. React. Chem. Eng. 2019, 4, 516–522. [Google Scholar] [CrossRef]
- Alvarez, A.J.; Myerson, A.S. Continuous Plug Flow Crystallization of Pharmaceutical Compounds. Cryst. Growth Des. 2010, 10, 2219–2228. [Google Scholar] [CrossRef]
- Niculescu, A.-G.; Chircov, C.; Bîrcă, A.C.; Grumezescu, A.M. Nanomaterials Synthesis through Microfluidic Methods: An Updated Overview. Nanomaterials 2021, 11, 864. [Google Scholar] [CrossRef]
- Liu, F.; Luo, W.; Qiu, J.; Guo, Y.; Zhao, S.; Bao, B. Continuous Antisolvent Crystallization of Dolutegravir Sodium Using Microfluidics. Ind. Eng. Chem. Res. 2022, 61, 6693–6702. [Google Scholar] [CrossRef]
- Laybourn, A.; Robertson, K.; Slater, A.G. Quid Pro Flow. J. Am. Chem. Soc. 2023, 145, 4355–4365. [Google Scholar] [CrossRef] [PubMed]
- Génot, V.; Desportes, S.; Croushore, C.; Lefèvre, J.-P.; Pansu, R.B.; Delaire, J.A.; von Rohr, P.R. Synthesis of Organic Nanoparticles in a 3D Flow Focusing Microreactor. Chem. Eng. J. 2010, 161, 234–239. [Google Scholar] [CrossRef]
- SCT-LAB: Secoya Technologies. Available online: https://www.secoya-tech.com/products/sct-lab/ (accessed on 24 January 2024).
- Application Note SCT: How to Use the Different Inserts for Antisolvent Crystallization. Secoya Technologies. Available online: https://www.secoya-tech.com/resources/ (accessed on 27 January 2024).
- Niu, Y.; Du, S.; Sheng, L.; Xiao, W.; Jiang, X.; He, G. High-Efficient Crystal Particle Manufacture by Microscale Process Intensification Technology. Green Chem. Eng. 2021, 2, 57–69. [Google Scholar] [CrossRef]
- Nandi, S.; Padrela, L.; Tajber, L.; Collas, A. Development of Long-Acting Injectable Suspensions by Continuous Antisolvent Crystallization: An Integrated Bottom-up Process. Int. J. Pharm. 2023, 648, 123550. [Google Scholar] [CrossRef] [PubMed]
- Anjum, F.; Viville, T.; Nandi, S.; Wessner, M.; Witte, B.D.; Collas, A.; Sadowski, G. Bottom-up Production of Injectable Itraconazole Suspensions Using Membrane Technology. Int. J. Pharm. 2023, Submitted. [Google Scholar] [CrossRef]
- Klapwijk, A.R.; Simone, E.; Nagy, Z.K.; Wilson, C.C. Tuning Crystal Morphology of Succinic Acid Using a Polymer Additive. Cryst. Growth Des. 2016, 16, 4349–4359. [Google Scholar] [CrossRef]
- Chen, Q.; Weng, J.; Sadowski, G.; Ji, Y. Influence Mechanism of Polymeric Excipients on Drug Crystallization: Experimental Investigation and Chemical Potential Gradient Model Analysis and Prediction. Cryst. Growth Des. 2023, 23, 3862–3872. [Google Scholar] [CrossRef]
- Lee, M.K.; Kim, S.; Ahn, C.-H.; Lee, J. Hydrophilic and Hydrophobic Amino Acid Copolymers for Nano-Comminution of Poorly Soluble Drugs. Int. J. Pharm. 2010, 384, 173–180. [Google Scholar] [CrossRef]
- Fatemi, N.; Devos, C.; Cordt, G.; Gerven, T.; Kuhn, S. Effect of Sodium Dodecyl Sulfate on the Continuous Crystallization in Microfluidic Devices Using Microbubbles. Chem. Eng. Technol. 2019, 42, 2105–2112. [Google Scholar] [CrossRef]
- Kim, S.; Wang, H.; Yan, L.; Zhang, X.; Cheng, Y. Continuous Preparation of Itraconazole Nanoparticles Using Droplet-Based Microreactor. Chem. Eng. J. 2020, 393, 124721. [Google Scholar] [CrossRef]
- Kaur Bhangu, S.; Ashokkumar, M.; Lee, J. Ultrasound Assisted Crystallization of Paracetamol: Crystal Size Distribution and Polymorph Control. Cryst. Growth Des. 2016, 16, 1934–1941. [Google Scholar] [CrossRef]
- Mugheirbi, N.A.; Tajber, L. Mesophase and Size Manipulation of Itraconazole Liquid Crystalline Nanoparticles Produced via Quasi Nanoemulsion Precipitation. Eur. J. Pharm. Biopharm. 2015, 96, 226–236. [Google Scholar] [CrossRef] [PubMed]
- Kozyra, A.; Mugheirbi, N.A.; Paluch, K.J.; Garbacz, G.; Tajber, L. Phase Diagrams of Polymer-Dispersed Liquid Crystal Systems of Itraconazole/Component Immiscibility Induced by Molecular Anisotropy. Mol. Pharm. 2018, 15, 5192–5206. [Google Scholar] [CrossRef] [PubMed]
- European Medicines Agency Group IEW. ICH Guideline Q3C (R8) on Impurities: Guideline for Residual Solvents; European Medicines Agency Group IEW: Amsterdam, The Netherlands, 2021. [Google Scholar]


| Type of Stabilizer | Concentration (% w/w) | Equilibrium Solubility (μg/g Solution) |
|---|---|---|
| Vit E TPGS 1000 | 0.5 | 12 ± 1.2 |
| POL 188 | 0.5 | 4.4 ± 0.3 |
| POL 338 | 0.5 | 8 ± 0.5 |
| POL 407 | 0.5 | 9.5 ± 0.5 |
| PVP K30 | 0.5 | 3.3 ± 0.2 |
| Na CMC | 0.5 | 2 ± 0.1 |
| Vit E TPGS 1000 | 0.5 | 12 ± 1.2 |
| 0.075 | 0.2 ± 0.05 |
| LAI Formulation | Final ITZ Loading (% w/w) | Vit E TPGS 1000 (% w/w) | Residual NMP (% w/w) |
|---|---|---|---|
| F3|MCR-CLASC | 29 ± 1.8 | 14.4 ± 0.6 | <0.05 |
| F4|SCT-CLASC | 30 ± 2.1 | 3.7 ± 0.1 | |
| F5|SCT-CLASC | 29 ± 2.4 | 1.1 ± 0.1 | |
| F6|SCT-CLASC | 30 ± 1.6 | 0.5 ± 0.1 |
Disclaimer/Publisher’s Note: The statements, opinions and data contained in all publications are solely those of the individual author(s) and contributor(s) and not of MDPI and/or the editor(s). MDPI and/or the editor(s) disclaim responsibility for any injury to people or property resulting from any ideas, methods, instructions or products referred to in the content. |
© 2024 by the authors. Licensee MDPI, Basel, Switzerland. This article is an open access article distributed under the terms and conditions of the Creative Commons Attribution (CC BY) license (https://creativecommons.org/licenses/by/4.0/).
Share and Cite
Nandi, S.; Verstrepen, L.; Hugo Silva, M.; Padrela, L.; Tajber, L.; Collas, A. Continuous Microfluidic Antisolvent Crystallization as a Bottom-Up Solution for the Development of Long-Acting Injectable Formulations. Pharmaceutics 2024, 16, 376. https://doi.org/10.3390/pharmaceutics16030376
Nandi S, Verstrepen L, Hugo Silva M, Padrela L, Tajber L, Collas A. Continuous Microfluidic Antisolvent Crystallization as a Bottom-Up Solution for the Development of Long-Acting Injectable Formulations. Pharmaceutics. 2024; 16(3):376. https://doi.org/10.3390/pharmaceutics16030376
Chicago/Turabian StyleNandi, Snehashis, Laura Verstrepen, Mariana Hugo Silva, Luis Padrela, Lidia Tajber, and Alain Collas. 2024. "Continuous Microfluidic Antisolvent Crystallization as a Bottom-Up Solution for the Development of Long-Acting Injectable Formulations" Pharmaceutics 16, no. 3: 376. https://doi.org/10.3390/pharmaceutics16030376
APA StyleNandi, S., Verstrepen, L., Hugo Silva, M., Padrela, L., Tajber, L., & Collas, A. (2024). Continuous Microfluidic Antisolvent Crystallization as a Bottom-Up Solution for the Development of Long-Acting Injectable Formulations. Pharmaceutics, 16(3), 376. https://doi.org/10.3390/pharmaceutics16030376