Abstract
The impairment of skin integrity derived from derangement of the orthorhombic lateral organization is mainly caused by dysregulation of ceramide amounts in the skin barrier. Ceramides, fatty acids, and cholesterol-containing nano-based formulations have been used to impair the skin barrier. However, there is still a challenge to formulate novel formulations consisting of ceramides due to their chemical structure, poor aqueous solubility, and high molecular weight. In this study, the design and optimization of Ceramide 3 (CER-NP)-loaded liposomes are implemented based on response surface methodology (RSM). The optimum CER-NP-loaded liposome was selected based on its particle size (PS) and polydispersity index (PDI). The optimum CER-NP-loaded liposome was imagined by observing the encapsulation by using a confocal laser scanning microscope (CLSM) within fluorescently labeled CER-NP. The characteristic liquid crystalline phase and lipid chain conformation of CER-NP-loaded liposomes were determined using attenuated total reflectance infrared spectroscopy (ATR-IR). The CER-NP-loaded liposomes were imagined using a field emission scanning electron microscope (FE-SEM). Finally, the in vitro release of CER-NP from liposomes was examined using modified Franz Cells. The experimental and predicted results were well correlated. The CLSM images of optimized liposomes were conformable with the other studies, and the encapsulation efficiency of CER-NP was 93.84 ± 0.87%. ATR-IR analysis supported the characteristics of the CER-NP-loaded liposome. In addition, the lipid chain conformation shows similarity with skin barrier lipid organization. The release pattern of CER-NP liposomes was fitted with the Korsmeyer–Peppas model. The cytotoxicity studies carried out on HaCaT keratinocytes supported the idea that the liposomes for topical administration of CER-NP could be considered relatively safe. In conclusion, the optimized CER-NP-loaded liposomes could have the potential to restore the skin barrier function.
1. Introduction
The skin barrier function is mainly characterized by stratum corneum lipids consisting of ceramides, fatty acids, and cholesterol. In favor of a significant equimolar ratio of ceramides, fatty acids, and cholesterol, the stratum corneum expresses an orthorhombic lateral organization, which provides skin integrity [1]. In atopic dermatitis (AD), there is an impairment of skin integrity derived from derangement of orthorhombic lateral organization caused by dysregulation of ceramides, fatty acids, and cholesterol ratio [2,3,4,5]. The disease is manifested by the downregulation of ceramide biosynthesis [6,7,8]. The Cer-NP, which is N-acylated phytosphingosine having the D-erythro structure linked to normal saturated or unsaturated fatty acid is the main ceramide subtype in a healthy stratum corneum layer and decreases in AD [9]. The stratum corneum lipidomic analysis revealed that CER-NP is reduced in AD patients [10]. Hereby, the extraordinary arrangement of stratum corneum lipids disorganization ends up with impaired skin barrier as well as immunological responses [11].
Even with the usage of topical corticosteroids and calcineurin inhibitors as the first option for the treatment of the disease, the formulations consisting of ceramides have recently attracted attention as lipid replacement therapy for AD [12,13]. With this approach, regaining decreased ceramides to stratum corneum is aimed at restoring the skin barrier function [14,15]. In lipid replacement therapy, the impaired skin barrier is replenished via conventional formulations [16,17,18]. In the market, moisturizers are comprised of ceramides present in varied dosage forms such as serum, face mask, lotion, spray, etc. The main idea of using ceramide comes from repairing the skin barrier by replacing the skin barrier components [19,20]. Dermocosmeceutical products mainly contain ceramides with fatty acids and cholesterol in approximate ratios (Triple Lipid Restore, SkinCeuticals; TriXera, Avène; CeramidinTM, Dr. Jart+). On the other hand, conventional formulations may have a limitation with penetration through the skin’s outermost layer [21]. Therefore, novel carrier systems such as nanoemulsion, solid lipid nanoparticles, and special vesicles have become a trend in the market instead of conventional formulations (CeraVe®, Loreal, New York, NY, USA). Furthermore, a controlled release designed system comes to the forefront due to maintaining the replacement of ceramide. The liposomes look promising for the market and are considered the most appropriate and biocompatible nano-formulation through the phospholipid basement, which is the main component of the skin cell membrane. The schematic presentation of ceramide replacement therapy with liposomes is provided in Figure 1.
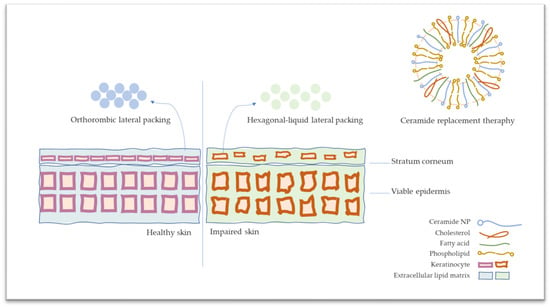
Figure 1.
The schematic presentation of stratum corneum on healthy and atopic dermatitis skin and ceramide replacement therapy.
During the design of dosage forms, numerous aspects of pharmaceutical technology that affect the formulation’s quality should be taken into consideration. In a conventional approach, optimization is carried out by manipulating one factor while holding the rest of the parameters invariable. However, this approach necessitates numerous formulation practices. Formulation development is a time-consuming and over-costing process. Therefore, RSM has gained interest over the past decade. In this approach, the relationship between the variables can be evaluated in detail in a short time while the impact of factors on the formulation is examined by changing multiple parameters at once.
In this study, the design and optimization of CER-NP-loaded liposomes were carried out by RSM. For the optimization of CER-NP-loaded liposomes, it is crucial to limit the amount of cholesterol to maintain the surface characteristics of liposomes. The high hydrophobicity of CER-NP poses a challenge to encapsulate and disperse in aqueous media, which is why the optimization of the amount of oleic acid is essential. By this design, the CER-NP-loaded liposomes were formed in an optimum amount of the CER-NP, oleic acid, and cholesterol. Within this approach, the formulation optimization process was carried out based on the quality parameters of CER-NP-loaded liposomes. The predicted formulation is characterized via dynamic light scattering (DLS) and confocal laser scanning microscope techniques and evaluated by in vitro release test and MTT assay.
2. Materials and Methods
2.1. Materials
CER-NP was kindly provided by Evonik Industries AG (Essen, Germany). Oleic acid and PEG 400 were gifted from Croda International Prc. (Snaith, UK). Cholesterol was purchased by Sigma-Aldrich Chemie (Ann Arbor, MI, USA). Mannitol SD 200 was gifted from Roquette Freres SA (Lestrem, France). Lipoid S100 was kindly provided by Lipoid GmBH (Ludwigshafen, Germany). NBD-Ceramide (NBD-Cer) was purchased from ABP Bioscience (Rockville, MD, USA). HPLC-grade methanol (MeOH), tetrahydrofuran (THF), and acetonitrile (ACN) were purchased from Merck KGaA (Darmstadt, Germany). Cellulose acetate membrane was purchased from Sartorius (Sartorius AG, Göttingen, Germany). The total assays were performed using ultrapure Milli-Q water (Bedford, MA, USA).
2.2. Preparation Method of CER-NP-Loaded Liposomes
The CER-NP-loaded liposomes were prepared with a thin-film hydration method [22]. Briefly, phospholipid was weighed at specific amounts, and CER-NP, cholesterol, and oleic acid were weighed at various concentrations, as shown in Table 1. The lipids are dissolved in a mixture of chloroform/methanol (1:1, v/v) [23]. Then, the solution was evaporated under a 100-mbar vacuum at 45 °C temperature. After the evaporation, the thin-film layer in the round-bottom flask was hydrated with phosphate-buffered saline (PBS, pH 7.36). The formulation was sonicated at 20 kHz of frequency. Afterward, the prepared CER-NP-loaded liposome was characterized in terms of particle size, PDI value, and zeta potential (ZP) by using ZetaSizer Nano ZS (Malvern, UK). The empty liposomes were prepared with cholesterol, oleic acid, and phospholipid by the abovementioned method but without Cer-NP in their content.

Table 1.
Selected variables in central composite design.
2.3. Experimental Design of CER-NP-Loaded Liposomes
In the basics of the experimental design, the independent variables are specified based on the literature [24,25]. The independent variables are specified as the amounts of cholesterol, oleic acid, and CER-NP with 5 variables (−α, −1, 0, +1, +α) based on central composite design [26]. The experimental design was obtained by the Design of Expert 12. The selected variables are provided in Table 1. The formulation was evaluated based on two crucial responses: particle size and PDI value.
2.4. Characterization of CER-NP-Loaded Liposomes
2.4.1. Measurement of Particle Size and Polydispersity Index and Zeta Potential
The particle size, PDI value, and zeta potential of CER-NP liposomes were measured based on dynamic light scattering principles through ZetaSizer Nano ZS (Malvern Panalytical, Malvern, UK). The samples were diluted with PBS (dilution factor: 3.10−2). The measurement was performed with three replicates at 25 °C room temperature.
2.4.2. Determination of HPLC Method of CER-NP in Liposomes
The samples on encapsulation efficiency, drug content, and the release study were analyzed by HPLC. The Cer-NP was analyzed by reversed-phase HPLC system (Prominence LC-20A, Shimadzu Corporation, Kyoto, Japan) equipped with UV–Vis detector (SPD-20A, Shimadzu Corporation, Kyoto, Japan). The method was modified based on the literature. Briefly, the C18 RP 150 mm × 4.6 mm, 5 μm column is selected as the stationary phase [26,27]. The mobile phase was prepared with methanol: acetonitrile (3:2) after filtering and degassing. The analysis was performed at isocratically at 0.8 mL/min flow rate with 10 μL injection volume under 45 °C oven temperature. The UV–Vis detector was set to 210 nm to detect the Cer-NP effectively. The validation steps were performed based on ICH Q2 (R2) [28,29]. The standard solutions of linearity were prepared by dilution of stock solution with MeOH:THF (1:1). The other lipid ingredients did not show any interference with Cer-NP peaks. The selectivity, linearity, accuracy, precision (repeatability inter-day and intra-day), limit of detection (LOD), and limit of quantification (LOQ) were calculated. The retention time was 9.27 min. The determination coefficient of the linearity curve (r2) was higher than 0.99. The LOD and LOQ values were 1.48 µg/mL and 4.5 µg/mL, respectively.
2.4.3. Encapsulation Efficiency and CER-NP Content
The encapsulation efficiency and CER-NP content of the optimum liposome were determined by centrifugation and HPLC analysis. For CER-NP content samples, the specific amount of liposome was dissolved in the MeOH: THF solvent system, and the liposomal membrane was disrupted. For encapsulation efficiency samples, the liposomes were centrifuged for 30 min at 15,000 rpm (Allegra X-30, Beckman Coulter, Brea, CA, USA). Then, the supernatant, including non-encapsulated CER-NP and other ingredients, was withdrawn and dissolved in the MeOH: THF solvent system. The samples were filtered by membrane filter (PTFE, 0.45 µm). Then, the samples were analyzed by the validated HPLC method. The CER-NP content was calculated based on the theoretical and practical weight of CER-NP. The encapsulation efficiency was calculated based on Equation (1).
EE% = (Mi/Mt) × 100
Equation (1): Encapsulation efficiency percentage equation based on sediment, supernatant, and total amounts of CER-NP. EE: encapsulation efficiency; Mi: the amount of CER-NP encapsulated in a liposome; Mt: the amount of theoretical CER-NP in the formulation.
2.4.4. CLSM Imagining of CER-NP-Loaded Liposomes
NBD-CER ((N-{6-[(7-nitro-2,1,3-benzoxadiazol-4-yl)amino]hexanoyl}sphingosine) which is a fluorescent agent via nitro group was used for examination to localize the ceramide molecules on the liposomal membrane. The various molar concentrations of NBD-Cer were added to the system to observe which ratio of NBD-Cer was effectively encapsulated in liposomes. Fluorescent liposomes were prepared with ratios of 1.73, 1.39, 0.68, 0.34, and 0.17‰ mmol NBD-Cer [30]. The imagining was captured on a Leica TCS SPE confocal microscope (Leica Microsystem, Wetzlar, Germany) with ACS APO 63×/1.30 oil CS. The spectrum was scanned between 488 and 560 nm. The observation was performed at 25 °C temperature and 40% relative humidity. The images were obtained by five replicates.
2.4.5. ATR-IR Spectroscopy Analysis of CER-NP-Loaded Liposomes
The ATR-IR spectroscopy was carried out with NBD-CER containing optimized liposomes in comparison to the empty liposome at 20 runs. Lipoid S100, cholesterol, and oleic acid were analyzed to control the functional group region specifically. The wavelength was in the range of 400–4000 cm−1. The transmittance was observed at a percentage in the range of 0–100. The IRAffinity-1S Fourier Transform Infrared Spectrophotometer (Shimadzu Corporation, Kyoto, Japan) was used in the analysis. The spectral data were evaluated in LabSolutions IR Software (Shimadzu Corporation, Kyoto, Japan).
2.4.6. FE-SEM Imagining of CER-NP-Loaded Liposomes
The optimum CER-NP-loaded liposome was dispersed in a 4% mannitol solution as a cryoprotectant. The dispersion system was lyophilized in Scanvac Lyophilizer (Labogene, Lillerød, Denmark) for 24 h. The powder was applied on aluminum cylinder sample stubs (12.7 diameter, 1 mm height) covered with double-sided carbon tape. The dust on the samples was removed by blowing air with an air pump. The optimum CER-NP-loaded liposome was imagined via Apreo2S FE-SEM (Thermo Fischer Scientific, Waltham, MA, USA) with a T1 segmented lower in-lens detector. The imagining was carried out under a 1 kV high vacuum without an Au/Pd conductive coat (FE-SEM Mag: 10,000-100,000×). The FE-SEM imagining of the optimum CER-NP-loaded liposome.
2.4.7. Solubility Studies of CER-NP
The medium of the in vitro release test was specified based on the solubility test of CER-NP in various release media (R1: PBS; R2: 10% propylene glycol; R3: 10% PEG 400; R4: 2% Tween 80; R5: 1% bovine serum albumin (BSA); R6: 25% ethyl alcohol) to provide sink condition. Briefly, an excess amount of CER-NP was added to the release medium and kept in a shaker for 72 h under room temperature. The samples were centrifuged, and the supernatant was dissolved in a solvent and quantified by the validated HPLC method.
2.4.8. In Vitro Release of CER-NP from Liposomes
The amount of receptor phase sample was specified according to the amount of dissolved CER-NP in selected receptor media. The effective diffusion area was 1.77 cm2, and 0.5 mL volume was used. The receptor media (R3: 10% PEG 400) volume was 7 mL. The cellulose acetate membrane (0.45 µm, Sartorious) was kept in receptor media for 5 min right before applying the formulation. The applied formulation was 500 µL for each Franz’s diffusion cell. The sampling and replacing the receptor media volume were 500 µL for each time point. The test was performed on a vertical diffusion system (Teledyne Hanson Research, Chatsworth, CA, USA) with 6 cells under 32 °C system temperature. The sampling was performed for 8 h with sampling points at 0.5, 1, 2, 3, 4, 5, 6, and 8 h. The samples were analyzed on HPLC, and the percentage of cumulative released amount was calculated as a function of time.
2.4.9. Cytotoxicity Studies
The cytotoxicity test was performed with a 3-[4,5-dimethylthiazol-2-yl]-2,5 diphenyl tetrazolium bromide (MTT) cytotoxicity assay based on the formation of formazan crystals via living cells. HaCaT keratinocyte (CLS 300493) was obtained from Cell Line Services (Heidelberg, Germany). The cell line was cultured at 37 °C and 5% CO2 atmosphere in Dulbecco’s Modified Eagles Medium supplemented with 10% fetal bovine serum, 1% streptomycin, and penicillin. After reaching the optimum cell density, the cells were seeded in a 96-well plate at 7 × 10³ cells/well density and treated with optimized CER-NP-loaded liposomes (100%, 50%, 25%, 12.5%, 6.25, and 3.12%), liposome without CER-NP as the negative control, and sodium lauryl sulfate (SLS) (5.0%, 2.5%, 1.25%) as the positive control. The exposure was maintained for 24 h.
After 24 h, the MTT solution (5 mg/mL in PBS) was applied to each plate after washing with 1× Dulbecco’s PBS. The cells were incubated for 2 h at 37 °C in an incubator in a humidified atmosphere of 5% CO2. The MTT and culture medium were removed, and formazan crystals were dissolved via dimethyl sulfoxide for 20 min. After dissolving, the absorbance of each well was recorded at 570 nm using a microplate reader (Thermo, Waltham, MA, USA). The cytotoxicity of the CER-NP-loaded liposomes and the controls were evaluated as a relative light unit (RLU) based on absorbance.
2.4.10. Physical Stability Studies
The optimized CER-NP-loaded liposomes were kept at 25 ± 2 °C temperature and 60% relative humidity ± 5%, and the accelerated conditions were 40 ± 2 °C temperature and 75 ± 5% relative humidity during the 30 and 90 days with different samples [31]. The stability samples were analyzed in terms of their particle size, PDI, and zeta potential values to show their physical stability.
2.4.11. Statistical Analysis
The results of each experiment were run in at least triplicate, and the data were then presented as the mean standard deviation (SD). One-way ANOVA was used for the statistical analysis along with Tukey’s post hoc test. A difference was deemed statistically significant if the p-value was less than 0.05.
3. Results and Discussion
3.1. Solubility of CER-NP
The in vitro release tests are performed based on the theory of drug diffusion, which takes the solubility of active molecules in receptor media as a prior condition. To maintain the sink condition, it is necessary to quantitatively determine the solubility of Cer-NP in alternative receptor media. The CER-NP is widely known in the literature for its aqueous solubility problem [32]. Therefore, the solubility test was performed to select the receptor media used in the in vitro release test for the CER-NP-loaded liposomes.
According to the CER-NP solubility test results, it showed low solubility in PBS pH 7.4. However, the scale-up and post-approval changes (SUPAC) guidelines allow the additive contents for poorly water-soluble drugs and ingredients [33]. The receptor medium alternatives and solubility of CER-NP are provided in Table 2.

Table 2.
CER-NP solubility in various in vitro release test receptor media.
The ethyl alcohol in R6 can just disperse the CER-NP grains based on the organoleptic evaluation. The BSA: PBS media is the most preferred one in drug formulation studies because of the hydrophilic and hydrophobic surfaces of BSA [34]. However, CER-NP was not solved in R5 media effectively. The R2 media have shown a peak on the chromatogram, but it was under the quantification limit in the HPLC method. The R3 and R4 give high solubility to CER-NP. Therefore, the R3 media were preferred as receptor media for the in vitro release test to maintain sink condition.
3.2. Experimental Design: CER-NP-Loaded Liposome Optimization
The optimization of CER-NP-loaded liposomes was carried out based on RSM in this study. The intercellular matrix in the stratum corneum consists of different ceramides, including CER-NP, fatty acids, and cholesterol, in a specific range. Through the RSM, CER-NP and other lipid substituents are used in harmony. The responses for the design were particle size and PDI value of liposomes. During the optimization process, the concentration of CER-NP was 2.19% of the total lipid amount, which is the value of lipid replacement therapy [35]. The oleic acid and cholesterol were in more than CER-NP molar concentrations to improve the release and diffusive properties of CER-NP. At this point, the RSM could have assisted the formulation optimization by specifying the lipid substituent amounts and maintaining the quality of CER-NP-loaded liposome.
Non-ionic surfactants such as Tween 80 and sodium cholate are widely used to form liposomes. However, destroying the orthorhombic lateral packing of the lipid barrier is observed due to applying a cosmetic formulation that includes ionic and non-ionic surfactants [36]. However, phosphatidylcholine needs surfactants to form a vesicle structure, even if this could be cholesterol. In this study, it is a priority to use cholesterol, which occurs in the skin’s extracellular matrix, as a surface-active agent in encapsulating the essential amount of CER-NP.
In the pre-formulation process, CER-NP and cholesterol-containing liposome formulations do not have a fine particle size, and the PDI value indicates the issue of the low solubility of CER-NP and membrane fluidity derived from cholesterol [37]. In the same manner, the presence of oleic acid changes the particle size and PDI value response in the pre-formulation study. However, the CER-NP-loaded liposomes should contain CER-NP, fatty acid, and cholesterol at an optimum ratio. With this design, the particle size response was minimized to accumulate the CER-NP-loaded liposome on the stratum corneum. The stability of CER-NP-loaded liposomes is typically associated with PDI values and zeta potential. The goal of this study was to minimize and reach a PDI value of less than 0.3 and a zeta potential of −15 < z < +15 mV [38].
3.3. Determination of Responses: Particle Size and PDI Value
In the optimization process, there are various models, such as quadratic, cubic, and factorial, to fit the response data in an efficient model. In our case, it was the most efficient model, quadratic for both particle size and PDI value based on the Design of Expert. The equation defining the quadratic model is provided in Equation (2).
Y: β0 + β1A + β2B + β12AB + β11A2 + β22B2
Equation (2): Quadratic model equation for particle size and PDI value responses.
The predicted value is defined as Y in the equation. A and B are independent variables. β1 and β2 define linear coefficients; β12 represents interaction coefficients; β11 and β22 define quadratic coefficients. The formulation inputs about material attributes are listed in Table 3. During the optimization process, the formulations listed in Table 3 were prepared and examined to take the responses.

Table 3.
The variable lipid amounts (mg) per phospholipid amounts (50 mg) and particle size and PDI value results of formulations.
The second-order quadratic equation was used when minimizing the particle size. The predicted particle size was calculated via Equation (3), which is provided below.
PS: 180.61 − 16.01 A + 73.23 B − 70.46 C + 23.06 AB − 22.51 AC − 95.55B C + 3.64 A2 + 30.94 B2 + 57.53 C2
Equation (3): Particle size responses equation based on quadratic model.
The statistical analysis of variances is provided in Table 4 for particle size. The particle size responses showed a good F-value (26.91) and low p-value (<0.0001), which means the equation of the model was significant. The lack-of-fit value was insignificant (p = 0.9384), which means that the model fitting is fine. The adjusted and predicted R2 values are 0.9247 and 0.8966, respectively. The values show that the experimental and predicted values are correlated.

Table 4.
Statistical analysis of particle size response in ANOVA.
The second-order quadratic equation provided below was used when minimizing the PDI value.
PDI: 0.57 − 0.18 A + 0.15 B − 0.28 C − 0.10 AB + 0.128 AC − 0.05 BC + 0.042 A2 + 0.039 B2 + 0.037 C2
Equation (4): PDI value responses equation based on quadratic model.
The statistical analysis of PDI value responses is provided in Table 5. The PDI value responses show a good F-value (16.88) and low p-value (0.0001), indicating a significant model equation. The lack-of-fit value was not significant (p = 0.6827), which indicates fitting the model is fine. The adjusted and predicted R2 values are 0.8827 and 0.7587, respectively. The values show that the experimental and predicted values are correlated.

Table 5.
Statistical analysis of PDI value response in ANOVA.
The desirability factor, which is crucial in optimization methods including multi-response parameters, was found to be 0.9387 in this optimization method. The value proves that the experimental value would meet the target of the predicted value.
According to the statistical analysis, CER-NP (factor A) is not significantly effective on both the particle size and PDI value (p = 0.7028 and 0.6571). However, cholesterol (factor B) and oleic acid (factor C) were significantly effective on the particle size and PDI value (p < 0.05). The one-factor analysis shows the individual effect of each factor on particle size and PDI values. The one-factor analysis is provided in Figure 2. Figure 2a,d shows the insignificant effect of CER-NP on particle size and PDI values. Figure 2b,e explains the point that the cholesterol increase raised the particle size and PDI value. The increase in oleic acid reduced the particle size and PDI value, as shown in Figure 2c,f.
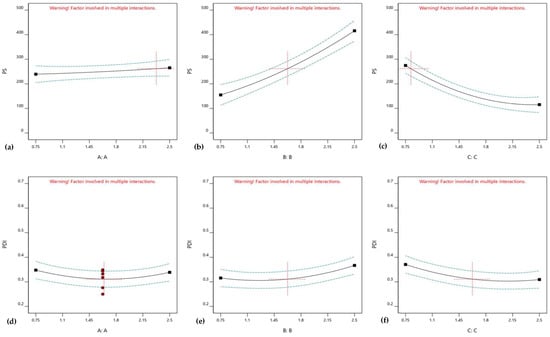
Figure 2.
One-factor analysis of CER-NP (a,d), cholesterol (b,e), and oleic acid (c,f) on CER-NP-loaded liposome responses; particle size (a–c) and PDI value (d,f,g).
Three-dimensional response surface graphs show the effects of the relations of ingredients. Figure 3a shows the effect of relations between oleic acid and cholesterol; meanwhile, CER-NP amount is maximized. Figure 3c indicates that oleic acid has a crucial effect on particle size in maximized cholesterol with any levels of CER-NP. The maximum amount of oleic acid can keep the particle size under control in many levels of cholesterol and CER-NP based on Figure 3e. Figure 3b shows that the PDI value was controlled by cholesterol in maximized CER-NP with any levels of oleic acid. However, the CER-NP and oleic acid may have an optimum ratio to obtain a minimum PDI value in the maximum level of cholesterol, according to Figure 3d. When oleic acid is maximized, an increasing amount of cholesterol can reduce the PDI value at a maximum level of CER-NP in Figure 3f.
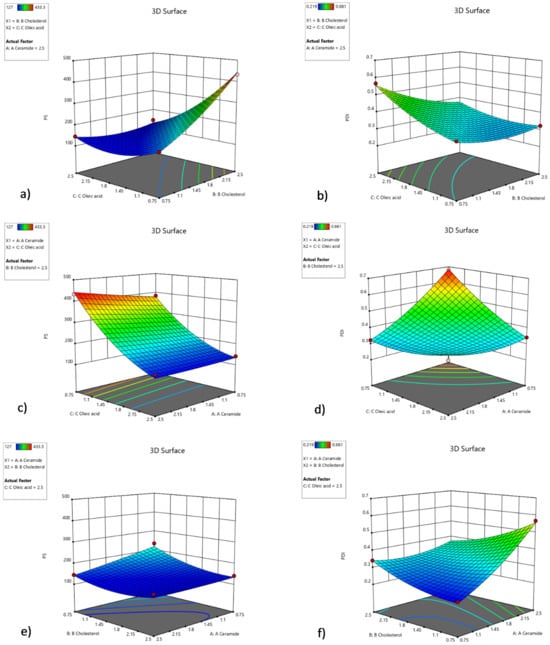
Figure 3.
Three-dimensional response surface graph involving factors’ interactions with each other in optimization. The interaction of cholesterol and oleic acid factors within the high amount of CER-NP on particle size (a) and PDI value (b), the interaction of oleic acid and CER-NP factors within the high amount of cholesterol on particle size (c) and PDI value (d), the interaction of cholesterol and CER-NP factors within the high amount of oleic acid on particle size (e) and PDI value (f).
The idea about raising particle size by high cholesterol amounts in the low level of oleic acid is supported by studies on liposomes containing cholesterol [39]. It is reported that an overrated amount of sterol causes an increase in the mean diameter of the liposome [40]. The increase in particle size might be related to interactions between lipid chains close to the head group of phosphatidylcholine and membrane stretching in the presence of sterols. Therefore, by increasing the cholesterol ratio, more than adequate cholesterol molecules may diffuse the phosphatidylcholine bilayer membrane. For this reason, the membrane fluidity is increased, and the close packing on the phosphatidylcholine bilayer membrane is prevented.
In addition, the study reports that the ceramide/stearic acid/cholesterol-based liposomal membrane shows that the disarrangement of molecules and phase softening occurred because of the increase in cholesterol concentration [41]. In our study, the oleic acid provides advantages on this point via increasing surface activity on liposomes. In this way, close packing on the phosphatidylcholine bilayer membrane could have been promoted. In the preformulation study, the impact of oleic acid on particle size, PDI value, and zeta potential was realized. The effect of cholesterol on particle size may be solved in the presence of oleic acid in liposomes. Kurniawan J. et al. showed that the oleic acid causes electrostatic repulsion on the dipalmitoylphosphatidylcholine membrane at neutral pH apart from low acidic pH [42]. Therefore, we thought that oleic acid could have improved the particle size by causing electrostatic repulsion and increasing the surface activity on the phosphatidylcholine bilayer membrane [42,43].
On the other hand, the high amount of oleic acid in a low level of cholesterol with maximum CER-NP can cause a rise in the PDI value. The rigidity derived from cholesterol provides stability to liposome structure, which is why cholesterol has a crucial role in PDI value. However, the cholesterol is not enough to obtain a fine PDI value without oleic acid based on preformulation studies (with oleic acid PS: 136.1, PDI: 0.248; without oleic acid, PS: 494.7, PDI: 0.706). Therefore, we thought that the PDI value brings up to the mark as the oleic acid/cholesterol ratio optimized.
Evaluation of Zeta Potential
Zeta potential responses were in the range between (−)1.85 and (−)10.3 mV that showed no significant difference statistically. Therefore, zeta potential has been descoped on responses in this study. Even so, oleic acid-containing liposomes have been negatively charged rather than the absence of oleic acid according to pre-formulation studies (with oleic acid ZP: −10.7 ± 1.11 mV; without oleic acid ZP: −1.30 ± 0.47 mV) (unpublished data).
3.4. Selection of the Optimized CER-NP-Loaded Liposomes
The optimized liposome formulation was selected based on minimizing the particle size and PDI value by the Design of Expert. The software suggested that the concentrations of CER-NP, oleic acid, and cholesterol are 2.4, 3.76, and 5%, respectively. In this hypothetical case, the particle size and PDI value would be 132.6 nm and 0.278, respectively.
The experimental particle size and PDI data of optimized liposomes, which performed at least three replications, were 136.6 ± 4.05 d.nm and 0.248 ± 0.012, respectively. As a result, the experimental responses were in close agreement with the predicted responses. The DLS result of the optimum CER-NP-loaded liposome is provided in Figure 4.
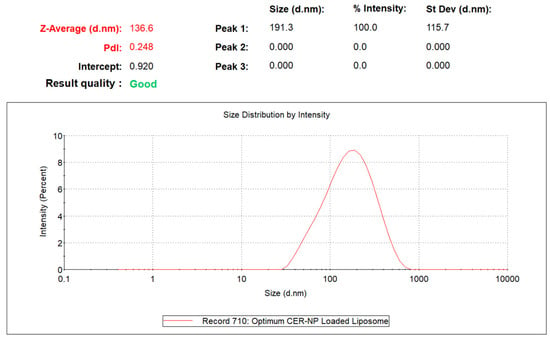
Figure 4.
The particle size and PDI value of optimized CER-NP-loaded liposomes.
3.4.1. Encapsulation Efficiency and CER-NP Content of the Optimized CER-NP-Loaded Liposomes
The optimum liposomes were evaluated due to their encapsulation efficiency. Considering the physicochemical structural similarity between ceramide subtypes and phosphatidylcholine, it might be possible to diffuse to CER-NP into the phosphatidylcholine bilayer membrane. Therefore, the selected CER-NP-loaded liposome results were provided in context. As a result, the CER-NP content was determined to be 97.54%. The encapsulation efficiency was 93.84 ± 0.87%. The high encapsulation efficiency could result in the increased lipophilicity of CER-NP.
3.4.2. Confocal Laser Scanning Microscope Imagining of Optimized CER-NP-Loaded Liposomes
The optimized liposomes prepared with various molar concentrations of NBD-CER instead of CER-NP have been observed in CLSM. The fluorescent nitro group of NBD-CER is inevitably shown in a vesicle structure. The CLSM images are provided in Figure 5. The NBD-Cer amount was evaluated based on CLSM figures. Figure 5A contained the highest molar concentration of NBD-Cer. Figure 5B–D may contain less localized fluorescent areas rather than Figure 5A [44].
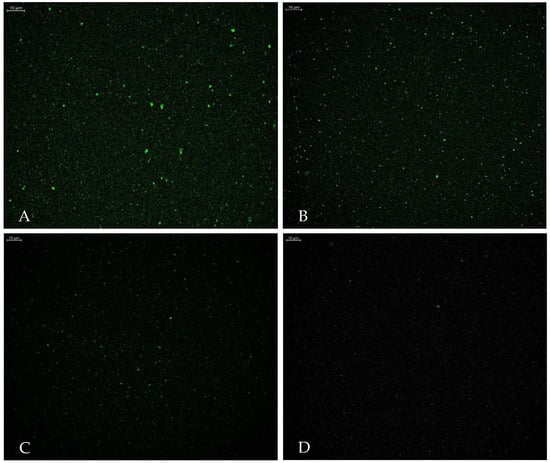
Figure 5.
Confocal laser scanning microscope images of optimum liposome with NBD-Cer at (A) 1.73‰ mmol, (B) 1.39‰ mmol, (C) 0.68‰ mmol, and (D) 0.34‰ mmol NBD-Cer (Scale bar: 10 µm).
The localization of ceramides in liposomes is crucial in terms of the release characteristics of liposomes. This study focused on two preparation processes of ceramide-loaded liposomes, showing that ceramide is mainly encapsulated in a liposome bilayer unless there is another polymeric phase [45]. The CLSM imagining shows that the NBD-CER was successfully encapsulated in vesicles. In addition, we presume that the CER-NP was localized in the phosphatidylcholine layer apart from the aqueous inside of vesicles due to its lipophilicity. However, it is crucial to specify the NBD-Cer molar concentrations used instead of CER-NP in liposomes to obtain fine CLSM imagining. In the literature, the NBD-CER containing liposome was imagined under CLSM at various concentrations. Based on the authors’ view, the NBD-CER was localized on the bilamellar membrane of the liposome [30]. This consideration supports the idea that CER-NP and other lipid substituents might be composed in harmony within the phosphatidylcholine bilamellar membrane.
3.4.3. ATR-IR Analysis of Optimized CER-NP-Loaded Liposomes
The NBD-CER has a specific 1,2,5 oxadiazole group on its chemical structure. In addition, the oxadiazole ring is bonded to 4-nitroaniline and becomes a nitrobenzoxadiazole (-NBD) functional group as fluorescent functionality. The chemical structure and functional group of NBD-CER are provided in Figure 6.
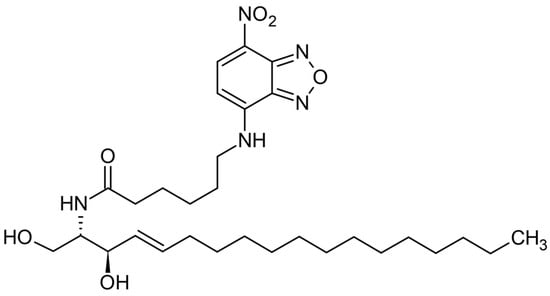
Figure 6.
Chemical structure and functional group of NBD-Cer.
The liquid phase of optimized liposomes containing NBD-CER was analyzed via ATR-IR spectroscopy in comparison with the liquid dispersion of empty liposomes based on transmittance (%). The spectral data are provided in Figure 7. According to the results, the C-N stretch was shown up in 1224.80 cm−1 as amide III in liquid disperse liposome with NBD-CER (red). The specific regions were seen in only liquid disperse liposomes with NBD-CER (red), not in liquid disperse empty liposomes (blue) as compared to the spectral data.
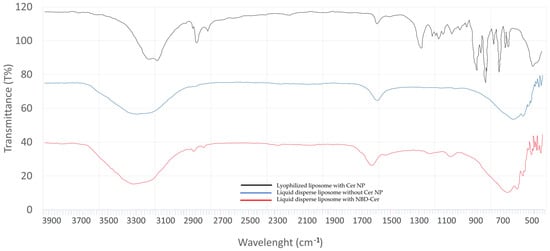
Figure 7.
Spectral data of lyophilized liposome with CER-NP (black), liquid dispersion of liposome with CER-NP (blue), and liquid dispersion of liposome with NBD-CER (red).
In addition, there are other characteristic peaks of liposomes in ATR-IR. The PO2 symmetric stretching region coming from phosphatidylcholine is shown at 1082.07 cm−1 in lyophilized liposomes with CER-NP (black) [46,47,48]. This region gives an idea about the microenvironment of PO2− groups in liposomes. The sharp peak on 1737.86 cm−1 on the phosphatidylcholine spectrum is derived from the non-hydrogen bonded C=O group. However, in aqueous media, water may diffuse into the side of the carbonyl group on the lipid bilayer and make hydrogen bond interaction on the carbonyl group area [49,50,51,52]. Therefore, the sharp peak may split in aqueous dispersion because of the lipid–water interface on the side of the carbonyl group [47,53]. The CH2 symmetric stretch and CH2 asymmetric stretch were shown at 2854.65 cm−1 and 2924.09 cm−1 in liquid-dispersed liposomes with NBD-Cer (red). In many studies, the CH2 vibration at 2852–2855 cm−1 is considered a sign of a liquid crystalline phase that leads to liposome formation [54,55,56]. These are derived from the characteristics of lipid acyl chain packing and fluidity on liposomes [53,57]. In lyophilized liposomes with CER-NP (black), the CH2 vibration region shows a lower frequency at 2852.72 cm−1. This indicates a more regular and ordered lipid organization, which is like orthorhombic lateral packing of skin lipids in a healthy stratum corneum. Le Deygen I.M. et al. reported the specific peaks of liposomes in ATR-IR analysis [47]. Stretching vibrations of the CH2 group are symmetric and asymmetric, stretching into 2850 cm−1 and 2919 cm−1 bands, which are like our findings.
3.4.4. FE-SEM Imagining of Optimized CER-NP-Loaded Liposomes
The lyophilized CER-NP-loaded liposomes dispersed in mannitol as cryoprotectant are shown as specific liposome images [58]. The spherical feature of liposomes is observed in FE-SEM images (Figure 8). The lyophilized CER-NP-loaded liposomes smaller than 500 nm were indicated with blue arrows on the images. Figure 8A,B shows the close view of liposomes (Mag: 25,000×). Figure 8C,D shows the distribution of liposomes in a wide perspective on a small scale (Mag: 10,000×). In electron microscopy, it is well known that high voltage can degrade the samples. The FE-SEM principle minimizes the voltage applied on the sample surface. In this way, the liposomes are observed under low kilovolts without any degradation and no need for sample covering. The surface morphology of liposomes was observed in 3D and real time in FE-SEM. The morphology of liposomes was hexagonal, similar to those observed in the literature [59]. The small-size liposomes are mostly dispersed in mannitol. The particle sizes and FE-SEM images are also comparable to those reported in the literature [59,60].
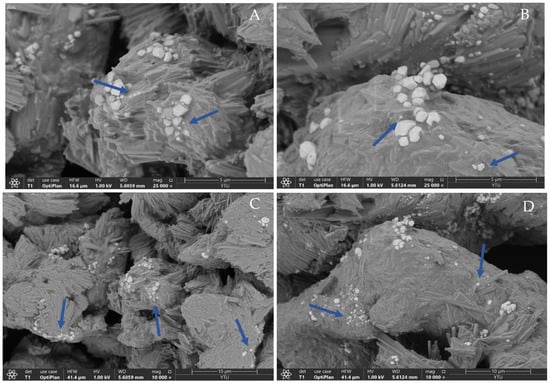
Figure 8.
The FESEM image of optimum CER-NP-loaded liposomes in large scale ((A,B); mag: 25,000) and small scale ((C,D); mag: 10,000). The blue arrows indicated the lyophilized CER-NP-loaded liposomes.
3.4.5. Physical Stability Studies
The physical stability results of optimized CER-NP-loaded liposomes are provided in Table 6. The stability was evaluated for 3 months based on particle size and PDI value, which are crucial characteristics indicating physical liposome stability. During the 30 days, the optimum CER-NP-loaded liposomes were observed in monophasic features at 25 °C temperature and 60% relative humidity. However, the liposomes could not keep the monophasic feature under accelerated stability conditions even for 30 days. The DLS results are provided in Table 6.

Table 6.
The PS and PDI results, which are obtained at different time points at 25 °C and 40 °C, refer to the stability of the optimal CER-NP-loaded liposome.
Based on the DLS result, the formulation shows a good stability property for the first 30 days period at 25 °C temperature and 60% relative humidity. The main point might be the zeta potential provided by oleic acid. However, the fine zeta potential is not all issues. The cholesterol in optimized ratio might have an impact on PDI values during the 30 days, but it is well-known that dispersed systems are not suitable for long-term stability without viscosity-increasing excipients. The phospholipids’ transition temperature (Tc) has a pivotal role in the stability of the liposomal system [61]. In our study, Lipoid S100 has an approximate Tc value with the temperature condition of the long-term stability test [62]. The particle size and PDI values increased comprehensibly under the 25 °C temperature conditions. However, the particle size and PDI value increased dramatically under the 40 °C temperature conditions. This state might explain why the liposomal system is dramatically unstable under accelerated stability test conditions.
3.4.6. In Vitro CER-NP Release from Optimized Liposomes
It is well-known that liposomes provide a sustained drug release via lipid bilayer. Therefore, the in vitro CER-NP release from liposomes is crucial to observe the CER-NP release rate as a function of time. In vitro release of CER-NP from optimized liposomes was evaluated based on the cumulative released percentage of CER-NP from liposomes. As was seen in Figure 9, more than 50% of CER-NP was released from the optimum liposome until the 6th hour. Almost the entire amount of the CER-NP (89%) was released at the end of the 8 h. The release rate was calculated at 0.54 ± 0.013 (k, µg.cm−2·h−1).
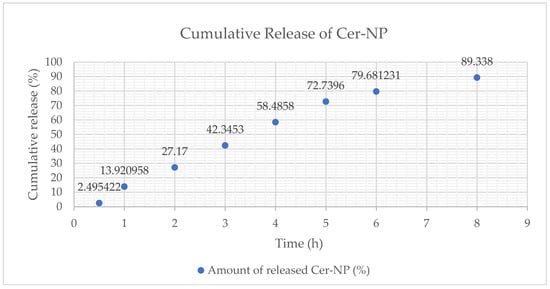
Figure 9.
The cumulative release (%) profile of CER-NP from optimum liposomal formulation, cumulative release percentage (y), and time point (x).
In general, non-linear regression models are commonly preferred to express the release profile of liposomes. According to the results, the cumulative release may fit the Korsmeyer–Peppas kinetic model. The Korsmeyer–Peppas equation (Mt/M∞ = ktn) shows an exponent value between 0.5 < n < 1.0, which means the formulation expresses a non-Fickian diffusion profile [63,64]. The n value is close to 1.0, and the drug release rate is independent of time. In Figure 10, the regression coefficient of the Korsmeyer–Peppas model was over 1.0, which means the release profile is interpreted as close to the super case II transport drug release mechanism.
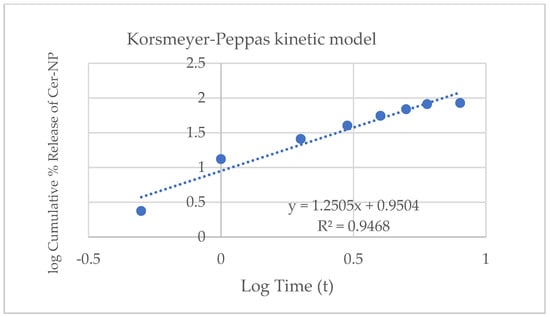
Figure 10.
Release kinetic of optimum liposomal formulation fitting on Korsmeyer–Peppas kinetic model.
In the literature, there are many cases in which the drug release from liposomes fitted the Korsmeyer–Peppas kinetic model [63,65,66]. The CER-NP release from optimized liposomes showed a similar release pattern as reported in the literature.
3.4.7. Cytotoxicity Analysis of Optimized CER-NP-Loaded Liposomes
Even the CER-NP, oleic acid, and cholesterol are naturally bio-transformed through the skin surface; the concentration of skin lipids in the formulation can cause skin irritation. To work the safety assessment, the liposomes without CER-NP and the optimized CER-NP-loaded liposomes were applied to the keratinocyte cell line in comparison with SLS as positive control, which is acceptable as cytotoxic on human keratinocytes within each concentration used in this study [67,68].
As a result, the relative light unit on 100% concentration of the optimized CER-NP-loaded liposomes was 6.89 times higher than those of the highest concentration of SLS. The results are provided in Figure 11. This signifies that the optimized CER-NP-loaded liposomes could be considered relatively safe for lipid replacement therapy on AD via topical administration.
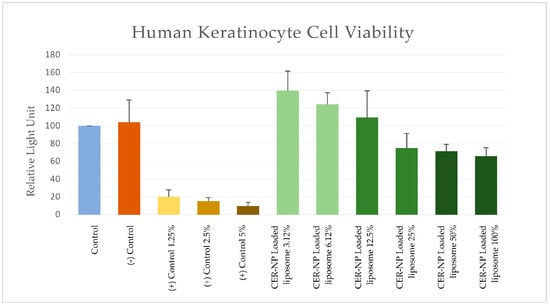
Figure 11.
MTT assay; RLU values of each group as cell viability sign on cytotoxicity tests. Control is a non-treatment, (−) control is a liposome without CER-NP, and (+) control is SLS at distinct concentrations. Optimum CER-NP-loaded liposome series are obtained via dilution. The final CER-NP molar concentration is provided below the figure.
In addition, the optimum CER-NP-loaded liposomes had just 0.63 times lower RLU than those without CER-NP. This means there may be no concern about the CER-NP content used in this study.
4. Conclusions
In recent years, the lipid replacement approach via liposomes has reached the trend of restoring the skin barrier. The skin lipids feature low formulation-forming capacity due to being poorly soluble in excipients used in topical dosage forms. In this study, CER-NP-loaded liposomes were designed and optimized by using RSM. According to the experimental design, the optimum CER-NP-loaded liposomes were obtained at a fine particle size and PDI value. The central composite design presents a prediction model that showed a good correlation with experimental responses. The CLSM images support the encapsulation of CER-NP in liposomes. The optimized liposomes were obtained with high CER-NP content and encapsulation efficiency. ATR-IR analysis supported the characteristic liquid crystalline phase formation of the liposome. The liposomes were physically stable in terms of particle size and distribution. The release profile of the liposomes was fitted with the Korsmeyer–Peppas model. The cytotoxicity studies showed that the CER-NP-loaded liposomes could be considered relatively safe.
In conclusion, the positive and negative sides of lipid substituents were harmonized via RSM. It is clearly understood that each lipid substituent in CER-NP-loaded liposomes is a cornerstone for the quality of skin products. The liposome optimization process is performed cost-effectively, and the optimized CER-NP-loaded liposomes to potentially restore the skin barrier function was obtained. Nevertheless, to confirm the efficacy of the optimized liposome formulation, further skin penetration and clinical efficacy data should be obtained.
Author Contributions
Conceptualization, H.Ş.B., A.A.S. and S.G.; methodology, H.Ş.B., A.A.S. and S.G.; software, A.A.S.; formal analysis, A.A.S.; investigation, H.Ş.B., K.B. and E.M.G.; data curation, H.Ş.B.; writing—original draft preparation, H.Ş.B. and K.B.; writing—review and editing, E.M.G., A.A.S. and S.G.; visualization, H.Ş.B., K.B. and EMG; supervision, S.G.; project administration, S.G.; funding acquisition, S.G. All authors have read and agreed to the published version of the manuscript.
Funding
This research was funded by the Istanbul University Research Fund Project number 37152.
Institutional Review Board Statement
Not applicable.
Informed Consent Statement
Not applicable.
Data Availability Statement
Not applicable.
Acknowledgments
The authors thank the Istanbul University Research Fund, Croda Türkiye, Evonik Türkiye, and Lipoid GmBH.
Conflicts of Interest
The authors declare no conflict of interest.
References
- Van Smeden, J.; Bouwstra, J.A. Stratum Corneum Lipids: Their Role for the Skin Barrier Function in Healthy Subjects and Atopic Dermatitis Patients. Curr. Probl. Dermatol. 2016, 49, 8–26. [Google Scholar] [CrossRef] [PubMed]
- Di Nardo, A.; Wertz, P.; Giannetti, A.; Seidenari, S. Ceramide and cholesterol composition of the skin of patients with atopic dermatitis. Acta Derm. Venereol. 1998, 78, 27–30. [Google Scholar] [CrossRef] [PubMed]
- Goldsmith, L.A.; Baden, H.P. Uniquely Oriented Epidermal Lipid. Nature 1970, 225, 1052–1053. [Google Scholar] [CrossRef] [PubMed]
- Bouwstra, J.; Gooris, G.; Dubbelaar, F.; Ponec, M. Phase behavior of lipid mixtures based on human ceramides: Coexistence of crystalline and liquid phases. J. Lipid Res. 2001, 42, 1759–1770. [Google Scholar] [CrossRef] [PubMed]
- Schmitt, T.; Neubert, R.H. State of the art in Stratum Corneum research: The biophysical properties of ceramides. Chem. Phys. Lipids 2018, 216, 91–103. [Google Scholar] [CrossRef]
- Eckl, K.-M.; Tidhar, R.; Thiele, H.; Oji, V.; Hausser, I.; Brodesser, S.; Preil, M.-L.; Önal-Akan, A.; Stock, F.; Müller, D.; et al. Impaired Epidermal Ceramide Synthesis Causes Autosomal Recessive Congenital Ichthyosis and Reveals the Importance of Ceramide Acyl Chain Length. J. Investig. Dermatol. 2013, 133, 2202–2211. [Google Scholar] [CrossRef]
- Li, Q.; Fang, H.; Dang, E.; Wang, G. The role of ceramides in skin homeostasis and inflammatory skin diseases. J. Dermatol. Sci. 2019, 97, 2–8. [Google Scholar] [CrossRef]
- Jensen, J.-M.; Fölster-Holst, R.; Baranowsky, A.; Schunck, M.; Winoto-Morbach, S.; Neumann, C.; Schütze, S.; Proksch, E. Impaired sphingomyelinase activity and epidermal differentiation in atopic dermatitis. J. Investig. Dermatol. 2004, 122, 1423–1431. [Google Scholar] [CrossRef]
- Choi, M.J.; Maibach, H.I. Role of ceramides in barrier function of healthy and diseased skin. Am. J. Clin. Dermatol. 2005, 6, 215–223. [Google Scholar] [CrossRef]
- Emmert, H.; Baurecht, H.; Thielking, F.; Stölzl, D.; Rodriguez, E.; Harder, I.; Proksch, E.; Weidinger, S. Stratum corneum lipidomics analysis reveals altered ceramide profile in atopic dermatitis patients across body sites with correlated changes in skin microbiome. Exp. Dermatol. 2020, 30, 1398–1408. [Google Scholar] [CrossRef]
- Van Smeden, J.; Janssens, M.; Gooris, G.S.; Bouwstra, J.A. The important role of stratum corneum lipids for the cutaneous barrier function. Biochim. Biophys. Acta 2014, 1841, 295–313. [Google Scholar] [CrossRef]
- Berkers, T.; Visscher, D.; Gooris, G.S.; Bouwstra, J.A. Topically Applied Ceramides Interact with the Stratum Corneum Lipid Matrix in Compromised Ex Vivo Skin. Pharm. Res. 2018, 35, 48. [Google Scholar] [CrossRef] [PubMed]
- Danby, S.G.; Andrew, P.V.; Brown, K.; Chittock, J.; Kay, L.J.; Cork, M.J. An Investigation of the Skin Barrier Restoring Effects of a Cream and Lotion Containing Ceramides in a Multi-vesicular Emulsion in People with Dry, Eczema-Prone, Skin: The RESTORE Study Phase 1. Dermatol. Ther. 2020, 10, 1031–1041. [Google Scholar] [CrossRef] [PubMed]
- McClanahan, D.; Wong, A.; Kezic, S.; Samrao, A.; Hajar, T.; Hill, E.; Simpson, E. A randomized controlled trial of an emollient with ceramide and filaggrin-associated amino acids for the primary prevention of atopic dermatitis in high-risk infants. J. Eur. Acad. Dermatol. Venereol. 2019, 33, 2087–2094. [Google Scholar] [CrossRef]
- Ishida, K.; Takahashi, A.; Bito, K.; Draelos, Z.; Imokawa, G. Treatment with Synthetic Pseudoceramide Improves Atopic Skin, Switching the Ceramide Profile to a Healthy Skin Phenotype. J. Investig. Dermatol. 2020, 140, 1762–1770.e8. [Google Scholar] [CrossRef] [PubMed]
- Okoshi, K.; Kinugasa, Y.; Ito, S.; Kume, T.; Seki, T.; Nishizaka, T.; Okada, J.; Kawada, H.; Nagasawa, A.; Iijima, M.; et al. Efficacy of Pseudo-Ceramide-Containing Steroid Lamellar Cream in Patients with Mild to Moderate Atopic Dermatitis: A Randomized, Double-Blind Study. Dermatol. Ther. 2022, 12, 1823–1834. [Google Scholar] [CrossRef] [PubMed]
- Huth, S.; Schmitt, L.; Marquardt, Y.; Heise, R.; Lüscher, B.; Amann, P.M.; Baron, J.M. Effects of a ceramide-containing water-in-oil ointment on skin barrier function and allergen penetration in an IL-31 treated 3D model of the disrupted skin barrier. Exp. Dermatol. 2018, 27, 1009–1014. [Google Scholar] [CrossRef]
- Lim, S.H.; Kim, E.J.; Lee, C.H.; Park, G.H.; Yoo, K.M.; Nam, S.J.; Shin, K.-O.; Park, K.; Choi, E.H. A Lipid Mixture Enriched by Ceramide NP with Fatty Acids of Diverse Chain Lengths Contributes to Restore the Skin Barrier Function Impaired by Topical Corticosteroid. Skin Pharmacol. Physiol. 2022, 35, 112–123. [Google Scholar] [CrossRef]
- Tessema, E.N.; Gebre-Mariam, T.; Frolov, A.; Wohlrab, J.; Neubert, R.H.H. Development and validation of LC/APCI-MS method for the quantification of oat ceramides in skin permeation studies. Anal. Bioanal. Chem. 2018, 410, 4775–4785. [Google Scholar] [CrossRef]
- Kono, T.; Miyachi, Y.; Kawashima, M. Clinical significance of the water retention and barrier function-improving capabilities of ceramide-containing formulations: A qualitative review. J. Dermatol. 2021, 48, 1807–1816. [Google Scholar] [CrossRef]
- Čuříková-Kindlová, B.A.; Vovesná, A.; Nováčková, A.; Zbytovská, J. In Vitro Modeling of Skin Barrier Disruption and its Recovery by Ceramide-Based Formulations. AAPS PharmSciTech 2021, 23, 21. [Google Scholar] [CrossRef] [PubMed]
- Bangham, A.D.; Standish, M.M.; Watkins, J.C. Diffusion of univalent ions across the lamellae of swollen phospholipids. J. Mol. Biol. 1965, 13, 238–252, IN26–IN27. [Google Scholar] [CrossRef] [PubMed]
- Imura, T.; Sakai, H.; Yamauchi, H.; Kaise, C.; Kozawa, K.; Yokoyama, S.; Abe, M. Preparation of liposomes containing Ceramide 3 and their membrane characteristics. Colloids Surf. B Biointerfaces 2001, 20, 1–8. [Google Scholar] [CrossRef]
- Simões, A.; Veiga, F.; Figueiras, A.; Vitorino, C. A practical framework for implementing Quality by Design to the development of topical drug products: Nanosystem-based dosage forms. Int. J. Pharm. 2018, 548, 385–399. [Google Scholar] [CrossRef] [PubMed]
- De Barros, C.; Aranha, N.; Severino, P.; Souto, E.B.; Zielińska, A.; Lopes, A.; Rios, A.; Batain, F.; Crescencio, K.; Chaud, M.; et al. Quality by Design Approach for the Development of Liposome Carrying Ghrelin for Intranasal Administration. Pharmaceutics 2021, 13, 686. [Google Scholar] [CrossRef]
- Sağıroğlu, A.A.; Özsoy, Y.; Özer, Ö. Design, optimization and characterization of novel topical formulations containing Triamcinolone Acetonide. J. Drug Deliv. Sci. Technol. 2020, 58, 101594. [Google Scholar] [CrossRef]
- Sahin Bektay, H.; Emine, K.; Sevgi, G. Development and Validation of a Simple and Selective Chromatographic Method for Quantification of Ceramide-NP in Skin-Simulating Liposomes. J. Cosmet. Sci. 2023, in press. [Google Scholar]
- International Council for Harmonisation of Technical Requirements for Pharmaceuticals for Human Use. ICH Harmonised Tripartite Guideline, Topic Q 2 (R1) Validation of Analytical Procedures: Text and Methodology Current Step 4 version, Parent Guideline dated 27 October 1994, Complementary Guideline on Methodology dated 6 November 1996, incorporated in 6 November 2005. Available online: https://www.ich.org/page/quality-guidelines (accessed on 11 September 2023).
- Do, U.H.; Pei, P.T.; Minard, R.D. Separation of molecular species of ceramides as benzoyl and p-nitrobenzoyl derivatives by high performance liquid chromatography. Lipids 1981, 16, 855–862. [Google Scholar] [CrossRef]
- Pedrosa, L.R.C.; van Cappellen, W.A.; Steurer, B.; Ciceri, D.; Hagen, T.L.T.; Eggermont, A.M.; Verheij, M.; Goñi, F.M.; Koning, G.A.; Contreras, F.-X. C8-glycosphingolipids preferentially insert into tumor cell membranes and promote chemotherapeutic drug uptake. Biochim. Biophys. Acta 2015, 1848, 1656–1670. [Google Scholar] [CrossRef][Green Version]
- Stability Testing of Existing Active Ingredients and Related Finished Products|European Medicines Agency n.d. Available online: https://www.ema.europa.eu/en/stability-testing-existing-active-ingredients-related-finished-products (accessed on 9 November 2022).
- Tessema, E.N.; Gebre-Mariam, T.; Paulos, G.; Wohlrab, J.; Neubert, R.H. Delivery of oat-derived phytoceramides into the stratum corneum of the skin using nanocarriers: Formulation, characterization and in vitro and ex-vivo penetration studies. Eur. J. Pharm. Biopharm. 2018, 127, 260–269. [Google Scholar] [CrossRef]
- Scale-Up and Postapproval Changes: Chemistry, Manufacturing, and Controls, In Vitro Release Testing and In Vivo Bioequivalence Documentation, Guidance for Industry Semisolid Dosage Forms; U.S. Department of Health and Human Services Food and Drug Administration, Center for Drug Evaluation and Research (CDER): Silver Spring, MD, USA, 1997; Volume 20857, pp. 301–827.
- Alinaghi, A.; Macedo, A.; Cheruvu, H.S.; Holmes, A.; Roberts, M.S. Human epidermal in vitro permeation test (IVPT) analyses of alcohols and steroids. Int. J. Pharm. 2022, 627, 122114. [Google Scholar] [CrossRef]
- Berkers, T.; Visscher, D.; Gooris, G.S.; Bouwstra, J.A. Degree of skin barrier disruption affects lipid organization in regenerated stratum corneum. Acta Derm. Venereol. 2018, 98, 421–427. [Google Scholar] [CrossRef] [PubMed]
- Vater, C.; Apanovic, A.; Riethmüller, C.; Litschauer, B.; Wolzt, M.; Valenta, C.; Klang, V. Changes in Skin Barrier Function after Repeated Exposition to Phospholipid-Based Surfactants and Sodium Dodecyl Sulfate In Vivo and Corneocyte Surface Analysis by Atomic Force Microscopy. Pharmaceutics 2021, 13, 436. [Google Scholar] [CrossRef] [PubMed]
- Şahin Bektay, H.; Kahraman, E.; Güngör, S. Design of skin-simulating nanoformulations for ceramide replacement in the skin: A preliminary study. Maced. Pharm. Bull. 2020, 66, 101–102. [Google Scholar] [CrossRef]
- Karn, P.R.; Cho, W.; Park, H.J.; Park, J.S.; Hwang, S.J. Characterization and stability studies of a novel liposomal cyclosporin a prepared using the supercritical fluid method: Comparison with the modified conventional Bangham method. Int. J. Nanomed. 2013, 8, 365–377. [Google Scholar] [CrossRef]
- Shaker, S.; Gardouh, A.R.; Ghorab, M.M. Factors affecting liposomes particle size prepared by ethanol injection method. Res. Pharm. Sci. 2017, 12, 346–352. [Google Scholar] [CrossRef]
- Jovanović, A.A.; Balanč, B.D.; Ota, A.; Grabnar, P.A.; Djordjević, V.B.; Šavikin, K.P.; Bugarski, B.M.; Nedović, V.A.; Ulrih, N.P. Comparative Effects of Cholesterol and β-Sitosterol on the Liposome Membrane Characteristics. Eur. J. Lipid Sci. Technol. 2018, 120, 1800039. [Google Scholar] [CrossRef]
- Strati, F.; Mukhina, T.; Neubert, R.H.; Opalka, L.; Hause, G.; Schmelzer, C.E.; Menzel, M.; Brezesinski, G. Cerosomes as skin repairing agent: Mode of action studies with a model stratum corneum layer at liquid/air and liquid/solid interfaces. BBA Adv. 2022, 2, 100039. [Google Scholar] [CrossRef]
- Kurniawan, J.; Suga, K.; Kuhl, T.L. Interaction forces and membrane charge tunability: Oleic acid containing membranes in different pH conditions. Biochim. Biophys. Acta 2017, 1859, 211–217. [Google Scholar] [CrossRef]
- Kim, D.-H.; An, E.J.; Kim, J.; Han, S.-H.; Kim, J.-W.; Oh, S.-G.; Suh, K.-D.; Cho, E.C. Fabrication and characterization of pseudo-ceramide-based liposomal membranes. Colloids Surf. B Biointerfaces 2009, 73, 207–211. [Google Scholar] [CrossRef]
- Best, C.; Calianese, D.; Szulak, K.; Cammarata, G.; Brum, G.; Carbone, T.; Still, E.; Higgins, K.; Ji, F.; DI, W.; et al. Paclitaxel disrupts polarized entry of membrane-permeable C6 ceramide into ovarian cancer cells resulting in synchronous induction of cell death. Oncol. Lett. 2013, 5, 1854–1858. [Google Scholar] [CrossRef] [PubMed]
- Zou, P.; Stern, S.T.; Sun, D. PLGA/liposome hybrid nanoparticles for short-chain ceramide delivery. Pharm. Res. 2014, 31, 684–693. [Google Scholar] [CrossRef] [PubMed][Green Version]
- Chen, C.; Tripp, C.P. An infrared spectroscopic based method to measure membrane permeance in liposomes. Biochim. Biophys. Acta BBA-Biomembr. 2008, 1778, 2266–2272. [Google Scholar] [CrossRef] [PubMed]
- Le-Deygen, I.M.; Rokosovina, V.V.; Skuredina, A.A.; Yakimov, I.D.; Kudryashova, E.V. The Charge and Phase State of Liposomes Dramatically Affects the Binding of Mannosylated Chitosan. Future Pharmacol. 2022, 2, 330–346. [Google Scholar] [CrossRef]
- Pohle, W.; Bohl, M.; Böhlig, H. Interpretation of the influence of hydrogen bonding on the stretching vibrations of the PO−2 moiety. J. Mol. Struct. 1991, 242, 333–342. [Google Scholar] [CrossRef]
- Hübner, W.; Blume, A. Interactions at the lipid–water interface. Chem. Phys. Lipids 1998, 96, 99–123. [Google Scholar] [CrossRef]
- Disalvo, E.; Bouchet, A.; Frias, M. Connected and isolated CH2 populations in acyl chains and its relation to pockets of confined water in lipid membranes as observed by FTIR spectrometry. Biochim. Biophys. Acta BBA-Biomembr. 2013, 1828, 1683–1689. [Google Scholar] [CrossRef]
- Simon, S.; McIntosh, T. Depth of water penetration into lipid bilayers. Methods Enzymol. 1986, 127, 511–521. [Google Scholar] [CrossRef]
- Bhide, S.Y.; Berkowitz, M.L. Structure and dynamics of water at the interface with phospholipid bilayers. J. Chem. Phys. 2005, 123, 224702. [Google Scholar] [CrossRef]
- Moreno, M.M.; Garidel, P.; Suwalsky, M.; Howe, J.; Brandenburg, K. The membrane-activity of Ibuprofen, Diclofenac, and Naproxen: A physico-chemical study with lecithin phospholipids. Biochim. Biophys. Acta BBA-Biomembr. 2009, 1788, 1296–1303. [Google Scholar] [CrossRef]
- Iqbal, J.; Behl, G.; Walker, G.; Edin, C.; Kumar, P.; O’reilly, N.; Bhatia, R.; Fitzhenry, L.; Arora, T. Nanoparticles in Pharmacotherapy; Chapter-6 Nanoparticulate Drug Delivery Systems for the Oral Administration of Macromolecular Drugs; Elsevier: Amsterdam, The Netherlands, 2019; pp. 147–193. ISBN 0128165049. [Google Scholar] [CrossRef]
- Brandenburg, K.; Kusumoto, S.; Seydel, U. Conformational studies of synthetic lipid A analogues and partial structures by infrared spectroscopy. Biochim. Biophys. Acta BBA-Biomembr. 1997, 1329, 183–201. [Google Scholar] [CrossRef] [PubMed]
- Mantsch, H.H.; McElhaney, R.N. Phospholipid phase transitions in model and biological membranes as studied by infrared spectroscopy. Chem. Phys. Lipids 1991, 57, 213–226. [Google Scholar] [CrossRef] [PubMed]
- Goormaghtigh, E.; Raussens, V.; Ruysschaert, J.-M. Attenuated total reflection infrared spectroscopy of proteins and lipids in biological membranes. Biochim. Biophys. Acta BBA-Rev. Biomembr. 1999, 1422, 105–185. [Google Scholar] [CrossRef] [PubMed]
- Ramli, N.A.; Ali, N.; Hamzah, S.; Yatim, N.I. Physicochemical characteristics of liposome encapsulation of stingless bees’ propolis. Heliyon 2021, 7, e06649. [Google Scholar] [CrossRef] [PubMed]
- Chaudhury, A.; Das, S.; Lee, R.F.; Tan, K.-B.; Ng, W.-K.; Tan, R.B.; Chiu, G.N. Lyophilization of cholesterol-free PEGylated liposomes and its impact on drug loading by passive equilibration. Int. J. Pharm. 2012, 430, 167–175. [Google Scholar] [CrossRef] [PubMed]
- Basu, S.; Mukherjee, B.; Chowdhury, S.R.; Paul, P.; Choudhury, R.; Kumar, A.; Mondal, L.; Hossain, C.M.; Maji, R. Colloidal gold-loaded, biodegradable, polymer-based stavudine nanoparticle uptake by macrophages: An in vitro study. Int. J. Nanomed. 2012, 7, 6049–6061. [Google Scholar] [CrossRef]
- Chen, W.; Duša, F.; Witos, J.; Ruokonen, S.-K.; Wiedmer, S.K. Determination of the Main Phase Transition Temperature of Phospholipids by Nanoplasmonic Sensing. Sci. Rep. 2018, 8, 14815. [Google Scholar] [CrossRef]
- Gharib, R.; Auezova, L.; Charcosset, C.; Greige-Gerges, H. Drug-in-cyclodextrin-in-liposomes as a carrier system for volatile essential oil components: Application to anethole. Food Chem. 2017, 218, 365–371. [Google Scholar] [CrossRef]
- Begum, M.Y.; Osmani, R.A.M.; Alqahtani, A.; Ghazwani, M.; Hani, U.; Ather, H.; Atiya, A.; Rahamathulla, M.; Siddiqua, A. Development of stealth liposomal formulation of celecoxib: In vitro and in vivo evaluation. PLoS ONE 2022, 17, e0264518. [Google Scholar] [CrossRef]
- Wu, I.Y.; Bala, S.; Škalko-Basnet, N.; di Cagno, M.P. Interpreting non-linear drug diffusion data: Utilizing Korsmeyer-Peppas model to study drug release from liposomes. Eur. J. Pharm. Sci. 2019, 138, 105026. [Google Scholar] [CrossRef]
- Dave, V.; Gupta, A.; Singh, P.; Gupta, C.; Sadhu, V.; Reddy, K.R. Synthesis and characterization of celecoxib loaded PEGylated liposome nanoparticles for biomedical applications. Nano-Struct. Nano-Objects 2019, 18, 100288. [Google Scholar] [CrossRef]
- Lim, H.; Jin, S.; Jeong, Y.; Kim, S.-B.; Jang, D.-J.; Kim, S.T. Preparation of hydroxypropyl-β-cyclodextrin-incorporated liposomes and evaluation of their rapid release property. J. Ind. Eng. Chem. 2021, 100, 59–62. [Google Scholar] [CrossRef]
- Erdal, M.S.; Özhan, G.; Mat, C.; Özsoy, Y.; Güngör, S. Colloidal nanocarriers for the enhanced cutaneous delivery of naftifine: Characterization studies and in vitro and in vivo evaluations. Int. J. Nanomed. 2016, 11, 1027–1037. [Google Scholar] [CrossRef] [PubMed]
- Choi, H.; Shin, M.K.; Ahn, H.J.; Lee, T.R.; Son, Y.; Kim, K.S. Irritating effects of sodium lauryl sulfate on human primary keratinocytes at subtoxic levels of exposure. Microsc. Res. Tech. 2018, 81, 1339–1346. [Google Scholar] [CrossRef] [PubMed]
Disclaimer/Publisher’s Note: The statements, opinions and data contained in all publications are solely those of the individual author(s) and contributor(s) and not of MDPI and/or the editor(s). MDPI and/or the editor(s) disclaim responsibility for any injury to people or property resulting from any ideas, methods, instructions or products referred to in the content. |
© 2023 by the authors. Licensee MDPI, Basel, Switzerland. This article is an open access article distributed under the terms and conditions of the Creative Commons Attribution (CC BY) license (https://creativecommons.org/licenses/by/4.0/).