
Quantification of Polyethylene Glycol 400 Excreted in the Urine by MALDI-TOF Mass Spectrometry


Abstract
1. Introduction
2. Experimental
2.1. Chemicals
2.2. Collection and Preparation of Urine Samples
2.3. Preparation of Standard and Quality Control Solutions
2.4. Matrix-Assisted Laser Desorption/Ionization Time-of-Flight Mass Spectrometry (MALDI-TOF-MS)
2.5. Method Validation
2.6. Data Analysis
3. Results and Discussion
3.1. Method Development
3.2. Method Validation
3.3. Urinary Excretion Results
4. Conclusions
Supplementary Materials
Author Contributions
Funding
Institutional Review Board Statement
Informed Consent Statement
Data Availability Statement
Conflicts of Interest
References
- Turecek, P.L.; Siekmann, J. 4—PEG–protein conjugates: Nonclinical and clinical toxicity considerations. In Polymer-Protein Conjugates; Pasut, G., Zalipsky, S., Eds.; Elsevier: Amsterdam, The Netherlands, 2020; pp. 61–101. [Google Scholar] [CrossRef]
- Webster, R.; Elliott, V.; Park, B.K.; Walker, D.; Hankin, M.; Taupin, P. PEG and PEG conjugates toxicity: Towards an understanding of the toxicity of PEG and its relevance to PEGylated biologicals. In PEGylated Protein Drugs: Basic Science and Clinical Applications; Veronese, F.M., Ed.; Birkhäuser Basel: Basel, Switzerland, 2009; pp. 127–146. [Google Scholar] [CrossRef]
- Pascal, F. The central role of excipients in drug formulation. Eur. Pharm. Rev. 2013, 18, 67–70. [Google Scholar]
- Daniela, H. Recent Applications of Polyethylene Glycols (PEGs) and PEG Derivatives. Mod. Chem. Appl. 2014, 2, 1–6. [Google Scholar]
- Bunker, A. Poly(Ethylene Glycol) in Drug Delivery, Why Does it Work, and Can We do Better? All Atom Molecular Dynamics Simulation Provides Some Answers. Phys. Procedia 2012, 34, 24–33. [Google Scholar] [CrossRef]
- Nugraha, B. Application of PEG in Drug Delivery System. In Gels Handbook; World Scientific Publishing Company Pte Limited: Singapore, 2016; pp. 137–147. [Google Scholar] [CrossRef]
- Ma, B.-L.; Yang, Y.; Dai, Y.; Li, Q.; Lin, G.; Ma, Y.-M. Polyethylene glycol 400 (PEG400) affects the systemic exposure of oral drugs based on multiple mechanisms: Taking berberine as an example. RSC Adv. 2017, 7, 2435–2442. [Google Scholar] [CrossRef]
- Knop, K.; Hoogenboom, R.; Fischer, D.; Schubert, U.S. Poly(ethylene glycol) in Drug Delivery: Pros and Cons as Well as Potential Alternatives. Angew. Chem. Int. Ed. 2010, 49, 6288–6308. [Google Scholar] [CrossRef] [PubMed]
- Templeton, A.C.; Byrn, S.R.; Haskell, R.J.; Prisinzano, T.E. Discovering and Developing Molecules with Optimal Drug-Like Properties; Springer: New York, NY, USA, 2014. [Google Scholar]
- Ma, T.Y.; Hollander, D.; Krugliak, P.; Katz, K. PEG 400, a hydrophilic molecular probe for measuring intestinal permeability. Gastroenterology 1990, 98, 39–46. [Google Scholar] [CrossRef]
- Krugliak, P.; Hollander, D.; Ma, T.Y.; Tran, D.; Dadufalza, V.D.; Katz, K.D.; Le, K. Mechanisms of polyethylene glycol 400 permeability of perfused rat intestine. Gastroenterology 1989, 97, 1164–1170. [Google Scholar] [CrossRef]
- van Wijck, K.; Bessems, B.A.; van Eijk, H.M.; Buurman, W.A.; Dejong, C.H.; Lenaerts, K. Polyethylene glycol versus dual sugar assay for gastrointestinal permeability analysis: Is it time to choose? Clin. Exp. Gastroenterol. 2012, 5, 139–150. [Google Scholar] [CrossRef][Green Version]
- Robinson, G.M.; Orrego, H.; Israel, Y.; Devenyi, P.; Kapur, B.M. Low-molecular-weight polyethylene glycol as a probe of gastrointestinal permeability after alcohol ingestion. Dig. Dis. Sci. 1981, 26, 971–977. [Google Scholar] [CrossRef]
- Mønsted, M.; Falck, N.D.; Pedersen, K.; Buschard, K.; Holm, L.J.; Haupt-Jorgensen, M. Intestinal permeability in type 1 diabetes: An updated comprehensive overview. J. Autoimmun. 2021, 122, 102674. [Google Scholar] [CrossRef]
- Lewis, C.V.; Taylor, W.R. Intestinal barrier dysfunction as a therapeutic target for cardiovascular disease. Am. J. Physiol. Heart Circ. Physiol. 2020, 319, H1227–H1233. [Google Scholar] [CrossRef] [PubMed]
- Ruttenberg, D.; Young, G.O.; Wright, J.P.; Isaacs, S. PEG-400 excretion in patients with Crohn’s disease, their first-degree relatives, and healthy volunteers. Dig. Dis. Sci. 1992, 37, 705–708. [Google Scholar] [CrossRef] [PubMed]
- Jenkins, R.T.; Goodacre, R.L.; Rooney, P.J.; Bienenstock, J.; Sivakumaran, T.; Walker, W.H.C. Studies of intestinal permeability in inflammatory diseases using polyethylene glycol 400. Clin. Biochem. 1986, 19, 298–302. [Google Scholar] [CrossRef]
- Michielan, A.; D’Incà, R. Intestinal Permeability in Inflammatory Bowel Disease: Pathogenesis, Clinical Evaluation, and Therapy of Leaky Gut. Mediat. Inflamm. 2015, 2015, 628157. [Google Scholar] [CrossRef]
- Irvine, E.J.; Marshall, J.K. Increased intestinal permeability precedes the onset of Crohn’s disease in a subject with familial risk. Gastroenterology 2000, 119, 1740–1744. [Google Scholar] [CrossRef] [PubMed]
- Fukui, H. Increased Intestinal Permeability and Decreased Barrier Function: Does It Really Influence the Risk of Inflammation? Inflamm. Intest. Dis. 2016, 1, 135–145. [Google Scholar] [CrossRef]
- Young, G.O.; Ruttenberg, D.; Wright, J.P. Measurement of polyethylene glycol 400 in urine by direct-injection high-performance liquid chromatography. Clin. Chem. 1990, 36, 1800–1802. [Google Scholar] [CrossRef]
- Fakt, C.; Ervik, M. Determination of low levels of poly(ethylene glycol) 400 in plasma and urine by capillary gas chromatography-selected ion-monitoring mass spectrometry after solid-phase extraction. J. Chromatogr. B Biomed. Sci. Appl. 1997, 700, 93–100. [Google Scholar] [CrossRef]
- Bouska, J.B.; Phillips, S.F. Simple method for gas--liquid chromatographic analysis of polyethylene glycol 400 in biological fluids. J. Chromatogr. 1980, 183, 72–77. [Google Scholar] [CrossRef]
- Zhang, J.; Lin, J.; Anderson, T.A. A flow injection analysis/mass spectrometry method for the quantification of polyethylene glycol 300 in drug formulations. Int. J. Pharm. 2004, 282, 183–187. [Google Scholar] [CrossRef]
- Wu, J.; Wang, Z.; Lin, W.; Chen, S. Investigation of the interaction between poly(ethylene glycol) and protein molecules using low field nuclear magnetic resonance. Acta Biomater. 2013, 9, 6414–6420. [Google Scholar] [CrossRef] [PubMed]
- Ashiru, D.A.; Karu, K.; Zloh, M.; Patel, R.; Basit, A.W. Relative quantification of polyethylene glycol 400 excreted in the urine of male and female volunteers by direct injection electrospray-selected ion monitoring mass spectrometry. Int. J. Pharm. 2011, 414, 35–41. [Google Scholar] [CrossRef] [PubMed]
- Wang, C.-C.; Lai, Y.-H.; Ou, Y.-M.; Chang, H.-T.; Wang, Y.-S. Critical factors determining the quantification capability of matrix-assisted laser desorption/ionization– time-of-flight mass spectrometry. Philos. Trans. R. Soc. A Math. Phys. Eng. Sci. 2016, 374, 20150371. [Google Scholar] [CrossRef]
- Walterová, Z.; Horský, J. Quantification in MALDI-TOF mass spectrometry of modified polymers. Anal. Chim. Acta 2011, 693, 82–88. [Google Scholar] [CrossRef] [PubMed]
- Chen, H.; He, M.; Pei, J.; He, H. Quantitative analysis of synthetic polymers using matrix-assisted laser desorption/ionization time-of-flight mass spectrometry. Anal. Chem. 2003, 75, 6531–6535. [Google Scholar] [CrossRef] [PubMed]
- Somatek Inc. Validation of Analytical Procedures: Text and Methodology. In ICH Harmonised Tripartite Guideline; Somatek Inc.: San Diego, CA, USA, 1996. [Google Scholar]
- Massart, D.L.; Vandeginste, B.G.M.; Buydens, L.M.C.; Jong, S.D.; Lewi, P.J.; Smeyers-Verbeke, J. Handbook of Chemometrics and Qualimetrics: Part A; Elsevier Science: Amsterdam, The Netherlands, 1997. [Google Scholar]


| PEG | Calibration Curve Equation | R2 n = 10 | Adjusted R2 n = 10 | Accuracy (%) n = 10 LQC HQC | Precision (RSD %) n = 10 LQC HQC | LOD n = 5 (μg/mL) | LOQ n = 5 (μg/mL) | ||
|---|---|---|---|---|---|---|---|---|---|
| PEG6 | 319x2 + 8.72x − 0.002 | 0.998 | 0.997 | 99.5 | 95.8 | 12.1 | 5.6 | 0.48 | 1.60 |
| PEG7 | 92.3x2 + 10.9x − 0.022 | 0.998 | 0.997 | 98.0 | 101.8 | 6.4 | 5.1 | 0.51 | 1.70 |
| PEG8 | 47.2x2 + 10.9x − 0.016 | 0.997 | 0.996 | 101.7 | 106.9 | 7.8 | 3.8 | 0.45 | 1.50 |
| PEG9 | 15.5x2 + 12.7x − 0.052 | 0.996 | 0.995 | 94.0 | 108.5 | 11.1 | 3.6 | 0.40 | 1.35 |
| PEG10 | 30.8x2 + 9.45x − 0.044 | 0.998 | 0.997 | 100.0 | 107.8 | 6.0 | 2.8 | 0.58 | 1.92 |
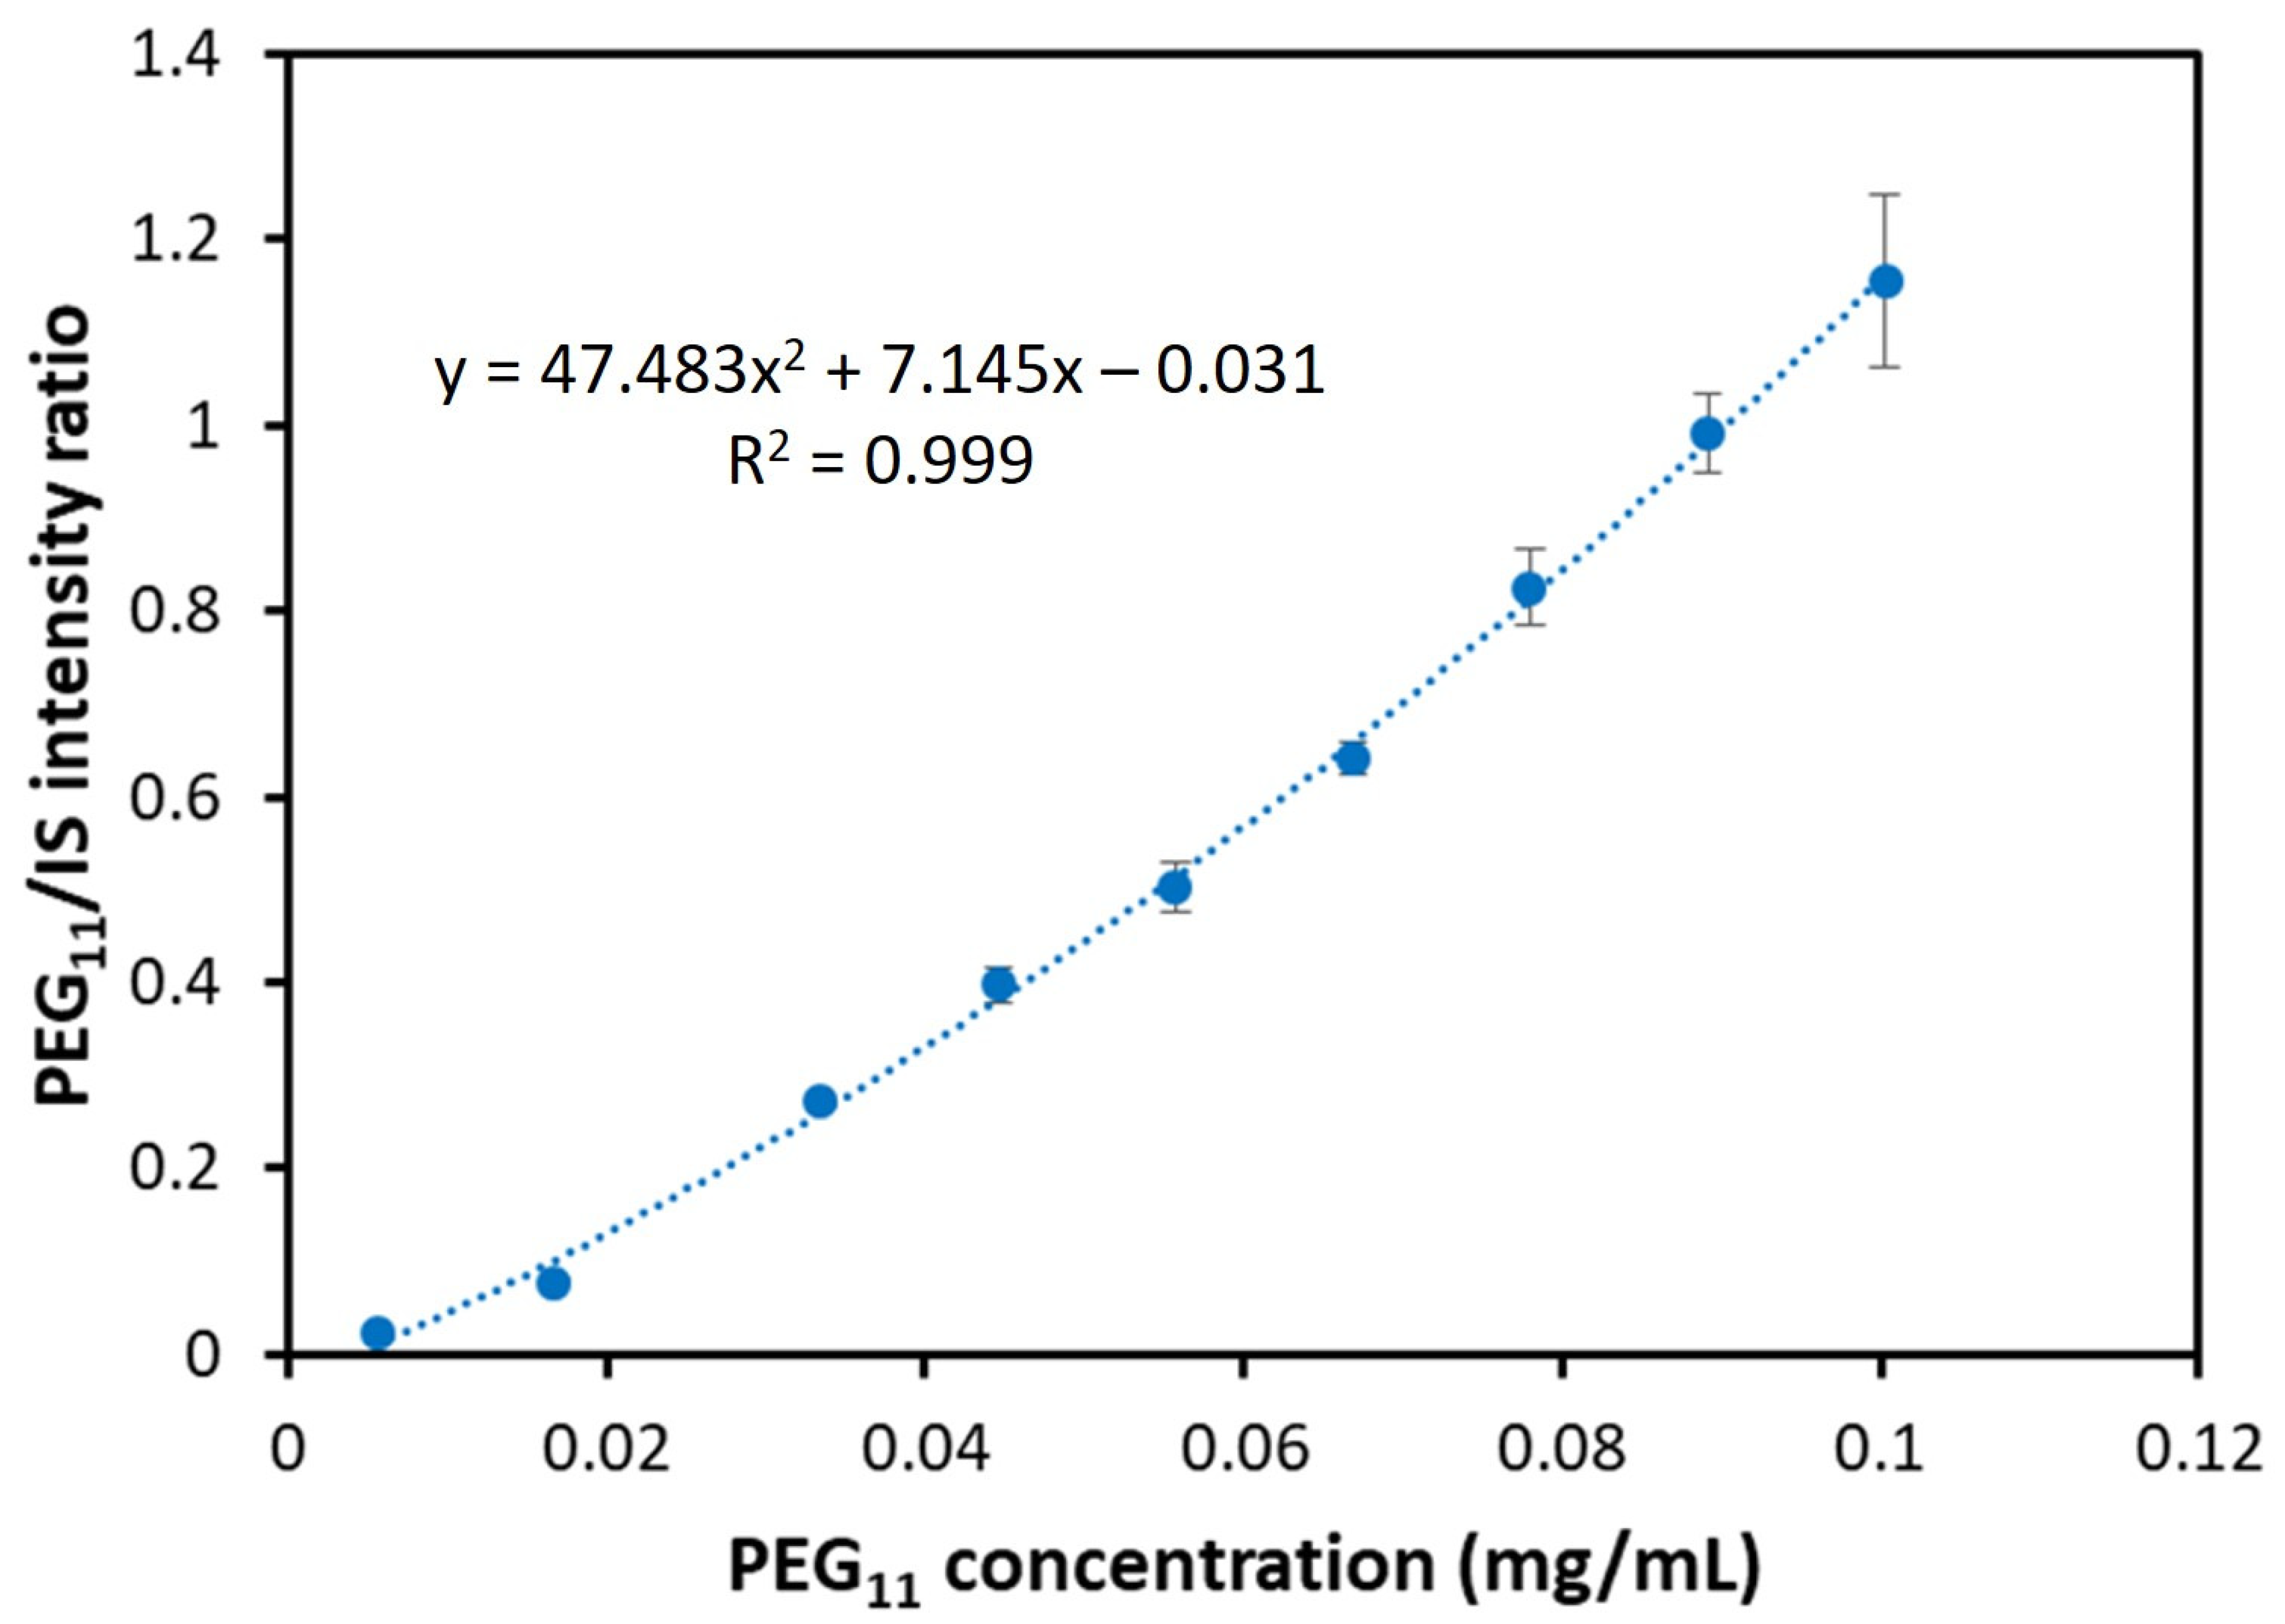
| PEG11 | 47.5x2 + 7.15x − 0.031 | 0.999 | 0.998 | 98.7 | 105.7 | 2.0 | 3.1 | 0.74 | 2.46 |
| PEG12 | 76.2x2 + 5.38x − 0.015 | 0.999 | 0.998 | 94.8 | 103.0 | 2.1 | 2.3 | 0.78 | 2.58 |
| PEG13 | 134x2 + 3.58x − 0.004 | 0.999 | 0.999 | 96.3 | 102.5 | 3.4 | 1.7 | 0.90 | 3.00 |
| PEG14 | 234x2 + 2.69x + 0.000 | 0.999 | 0.999 | 96.6 | 105.1 | 6.5 | 2.4 | 0.71 | 2.63 |
| PEG6 | PEG7 | PEG8 | PEG9 | PEG10 | PEG11 | PEG12 | PEG13 | PEG14 | ||
|---|---|---|---|---|---|---|---|---|---|---|
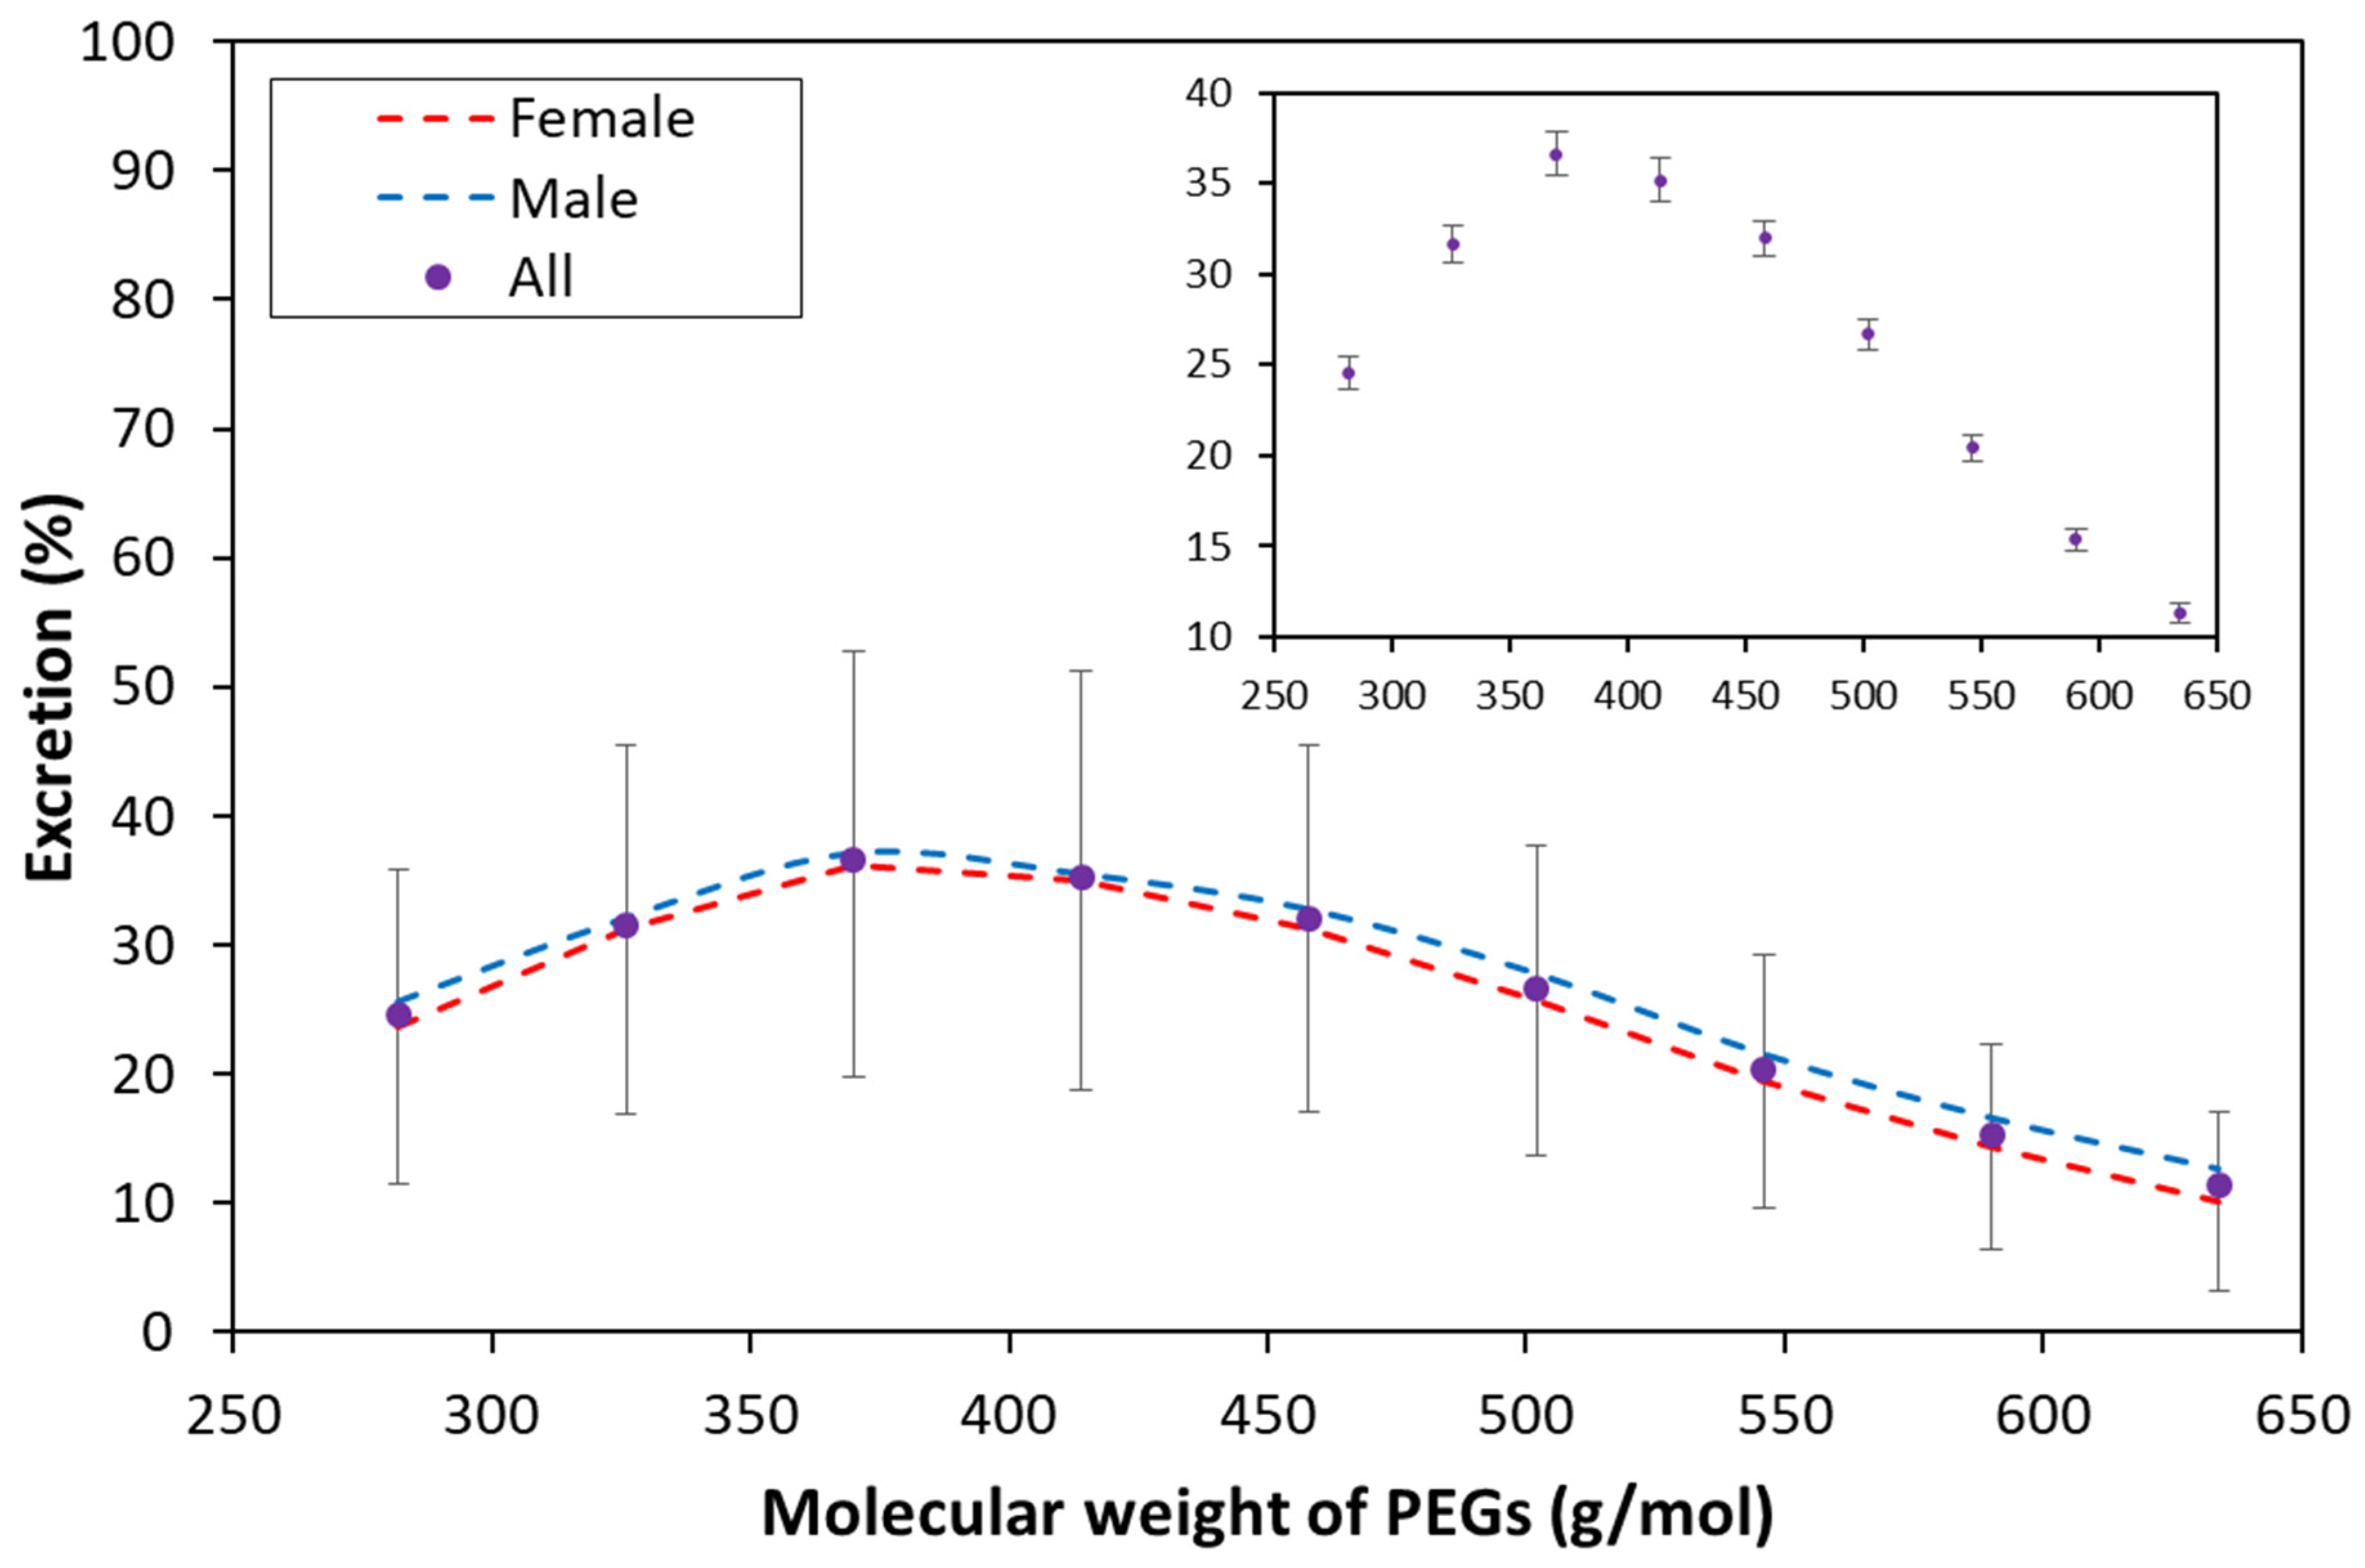
| Mean | Female | 23.6 | 31.2 | 36.3 | 35.0 | 31.3 | 25.7 | 19.4 | 14.3 | 10.2 |
| Male | 25.6 | 32.0 | 37.1 | 35.5 | 32.7 | 27.8 | 21.5 | 16.6 | 12.6 | |
| All | 24.5 | 31.6 | 36.6 | 35.2 | 32.0 | 26.7 | 20.4 | 15.4 | 11.3 | |
| Standard Error | 1.18 | 1.45 | 1.66 | 1.64 | 1.35 | 1.11 | 0.90 | 0.76 | 0.67 | |
| 1.27 | 1.45 | 1.66 | 1.63 | 1.52 | 1.31 | 1.06 | 0.85 | 0.77 | ||
| 0.87 | 1.02 | 1.18 | 1.16 | 1.01 | 0.85 | 0.70 | 0.57 | 0.51 | ||
| Standard Deviation | 12.0 | 14.7 | 16.9 | 16.7 | 13.7 | 11.3 | 9.2 | 7.7 | 6.6 | |
| 12.3 | 14.1 | 16.1 | 15.8 | 14.7 | 12.7 | 10.3 | 8.2 | 7.2 | ||
| 12.1 | 14.4 | 16.5 | 16.2 | 14.2 | 12.0 | 9.8 | 8.0 | 7.0 | ||
| Minimum | 6.2 | 9.3 | 9.5 | 7.8 | 7.2 | 5.8 | 3.9 | 1.3 | 0.0 | |
| 3.7 | 5.1 | 6.8 | 6.0 | 4.4 | 3.1 | 2.2 | 1.9 | 0.0 | ||
| 3.7 | 5.1 | 6.8 | 6.0 | 4.4 | 3.1 | 2.2 | 1.3 | 0.0 | ||
| Maximum | 65.1 | 90.5 | 99.5 | 93.8 | 62.5 | 55.2 | 44.2 | 33.9 | 31.5 | |
| 56.7 | 66.3 | 77.8 | 74.6 | 70.5 | 60.1 | 45.9 | 34.5 | 33.0 | ||
| 65.1 | 90.5 | 99.5 | 93.8 | 70.5 | 60.1 | 45.9 | 34.5 | 33.0 | ||
| Count | 103 | 103 | 103 | 103 | 103 | 103 | 103 | 103 | 97 | |
| 93 | 94 | 94 | 94 | 94 | 94 | 94 | 93 | 86 | ||
| 196 | 197 | 197 | 197 | 197 | 197 | 197 | 196 | 183 | ||
| Confidence Interval (95%) | 2.35 | 2.87 | 3.30 | 3.26 | 2.69 | 2.20 | 1.79 | 1.50 | 1.33 | |
| 2.53 | 2.88 | 3.31 | 3.24 | 3.02 | 2.61 | 2.11 | 1.68 | 1.54 | ||
| 1.71 | 2.02 | 2.32 | 2.28 | 2.00 | 1.69 | 1.37 | 1.12 | 1.01 | ||
| T-test p values (female, male) | 0.27 | 0.69 | 0.73 | 0.84 | 0.48 | 0.24 | 0.16 | 0.048 | 0.019 | |
Publisher’s Note: MDPI stays neutral with regard to jurisdictional claims in published maps and institutional affiliations. |
© 2022 by the authors. Licensee MDPI, Basel, Switzerland. This article is an open access article distributed under the terms and conditions of the Creative Commons Attribution (CC BY) license (https://creativecommons.org/licenses/by/4.0/).
Share and Cite
Kuki, Á.; Hashimov, M.; Nagy, T.; Tóth, C.; Zsuga, M.; Kéki, S. Quantification of Polyethylene Glycol 400 Excreted in the Urine by MALDI-TOF Mass Spectrometry. Pharmaceutics 2022, 14, 1341. https://doi.org/10.3390/pharmaceutics14071341
Kuki Á, Hashimov M, Nagy T, Tóth C, Zsuga M, Kéki S. Quantification of Polyethylene Glycol 400 Excreted in the Urine by MALDI-TOF Mass Spectrometry. Pharmaceutics. 2022; 14(7):1341. https://doi.org/10.3390/pharmaceutics14071341
Chicago/Turabian StyleKuki, Ákos, Mahir Hashimov, Tibor Nagy, Csaba Tóth, Miklos Zsuga, and Sándor Kéki. 2022. "Quantification of Polyethylene Glycol 400 Excreted in the Urine by MALDI-TOF Mass Spectrometry" Pharmaceutics 14, no. 7: 1341. https://doi.org/10.3390/pharmaceutics14071341
APA StyleKuki, Á., Hashimov, M., Nagy, T., Tóth, C., Zsuga, M., & Kéki, S. (2022). Quantification of Polyethylene Glycol 400 Excreted in the Urine by MALDI-TOF Mass Spectrometry. Pharmaceutics, 14(7), 1341. https://doi.org/10.3390/pharmaceutics14071341