Evaluation of the Effect of CYP2D6 Genotypes on Tramadol and O-Desmethyltramadol Pharmacokinetic Profiles in a Korean Population Using Physiologically-Based Pharmacokinetic Modeling

 , ,
, ,
Abstract
1. Introduction
2. Materials and Methods
2.1. Clinical Study Design
2.2. CYP2D6 Genotyping
2.3. Determination of Tramadol and O-Desmethyltramadol (M1) Using LC-MS/MS
2.4. Parallel Artificial Membrane Permeability Assay (PAMPA)
2.5. Assessment of Intrinsic Clearance of M1
2.6. Qunatitaion Methods of M1 in In Vitro Experiments Using LC-QTOF
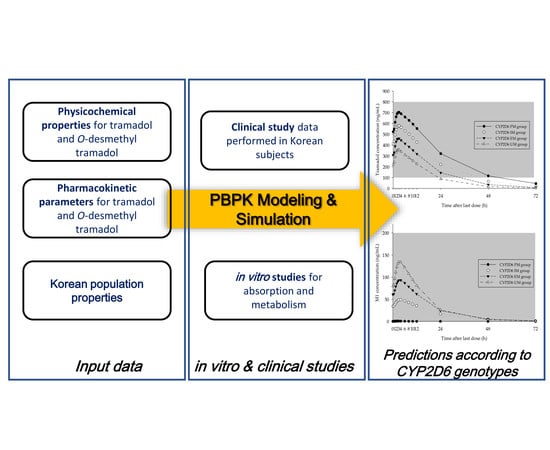
2.7. Development of PBPK Model for Tramadol and M1
2.8. Prediction of Changes in Concentration–Time Profiles for Tramadol and M1 According to CYP2D6 Genotype and Dosing Regimen
3. Results
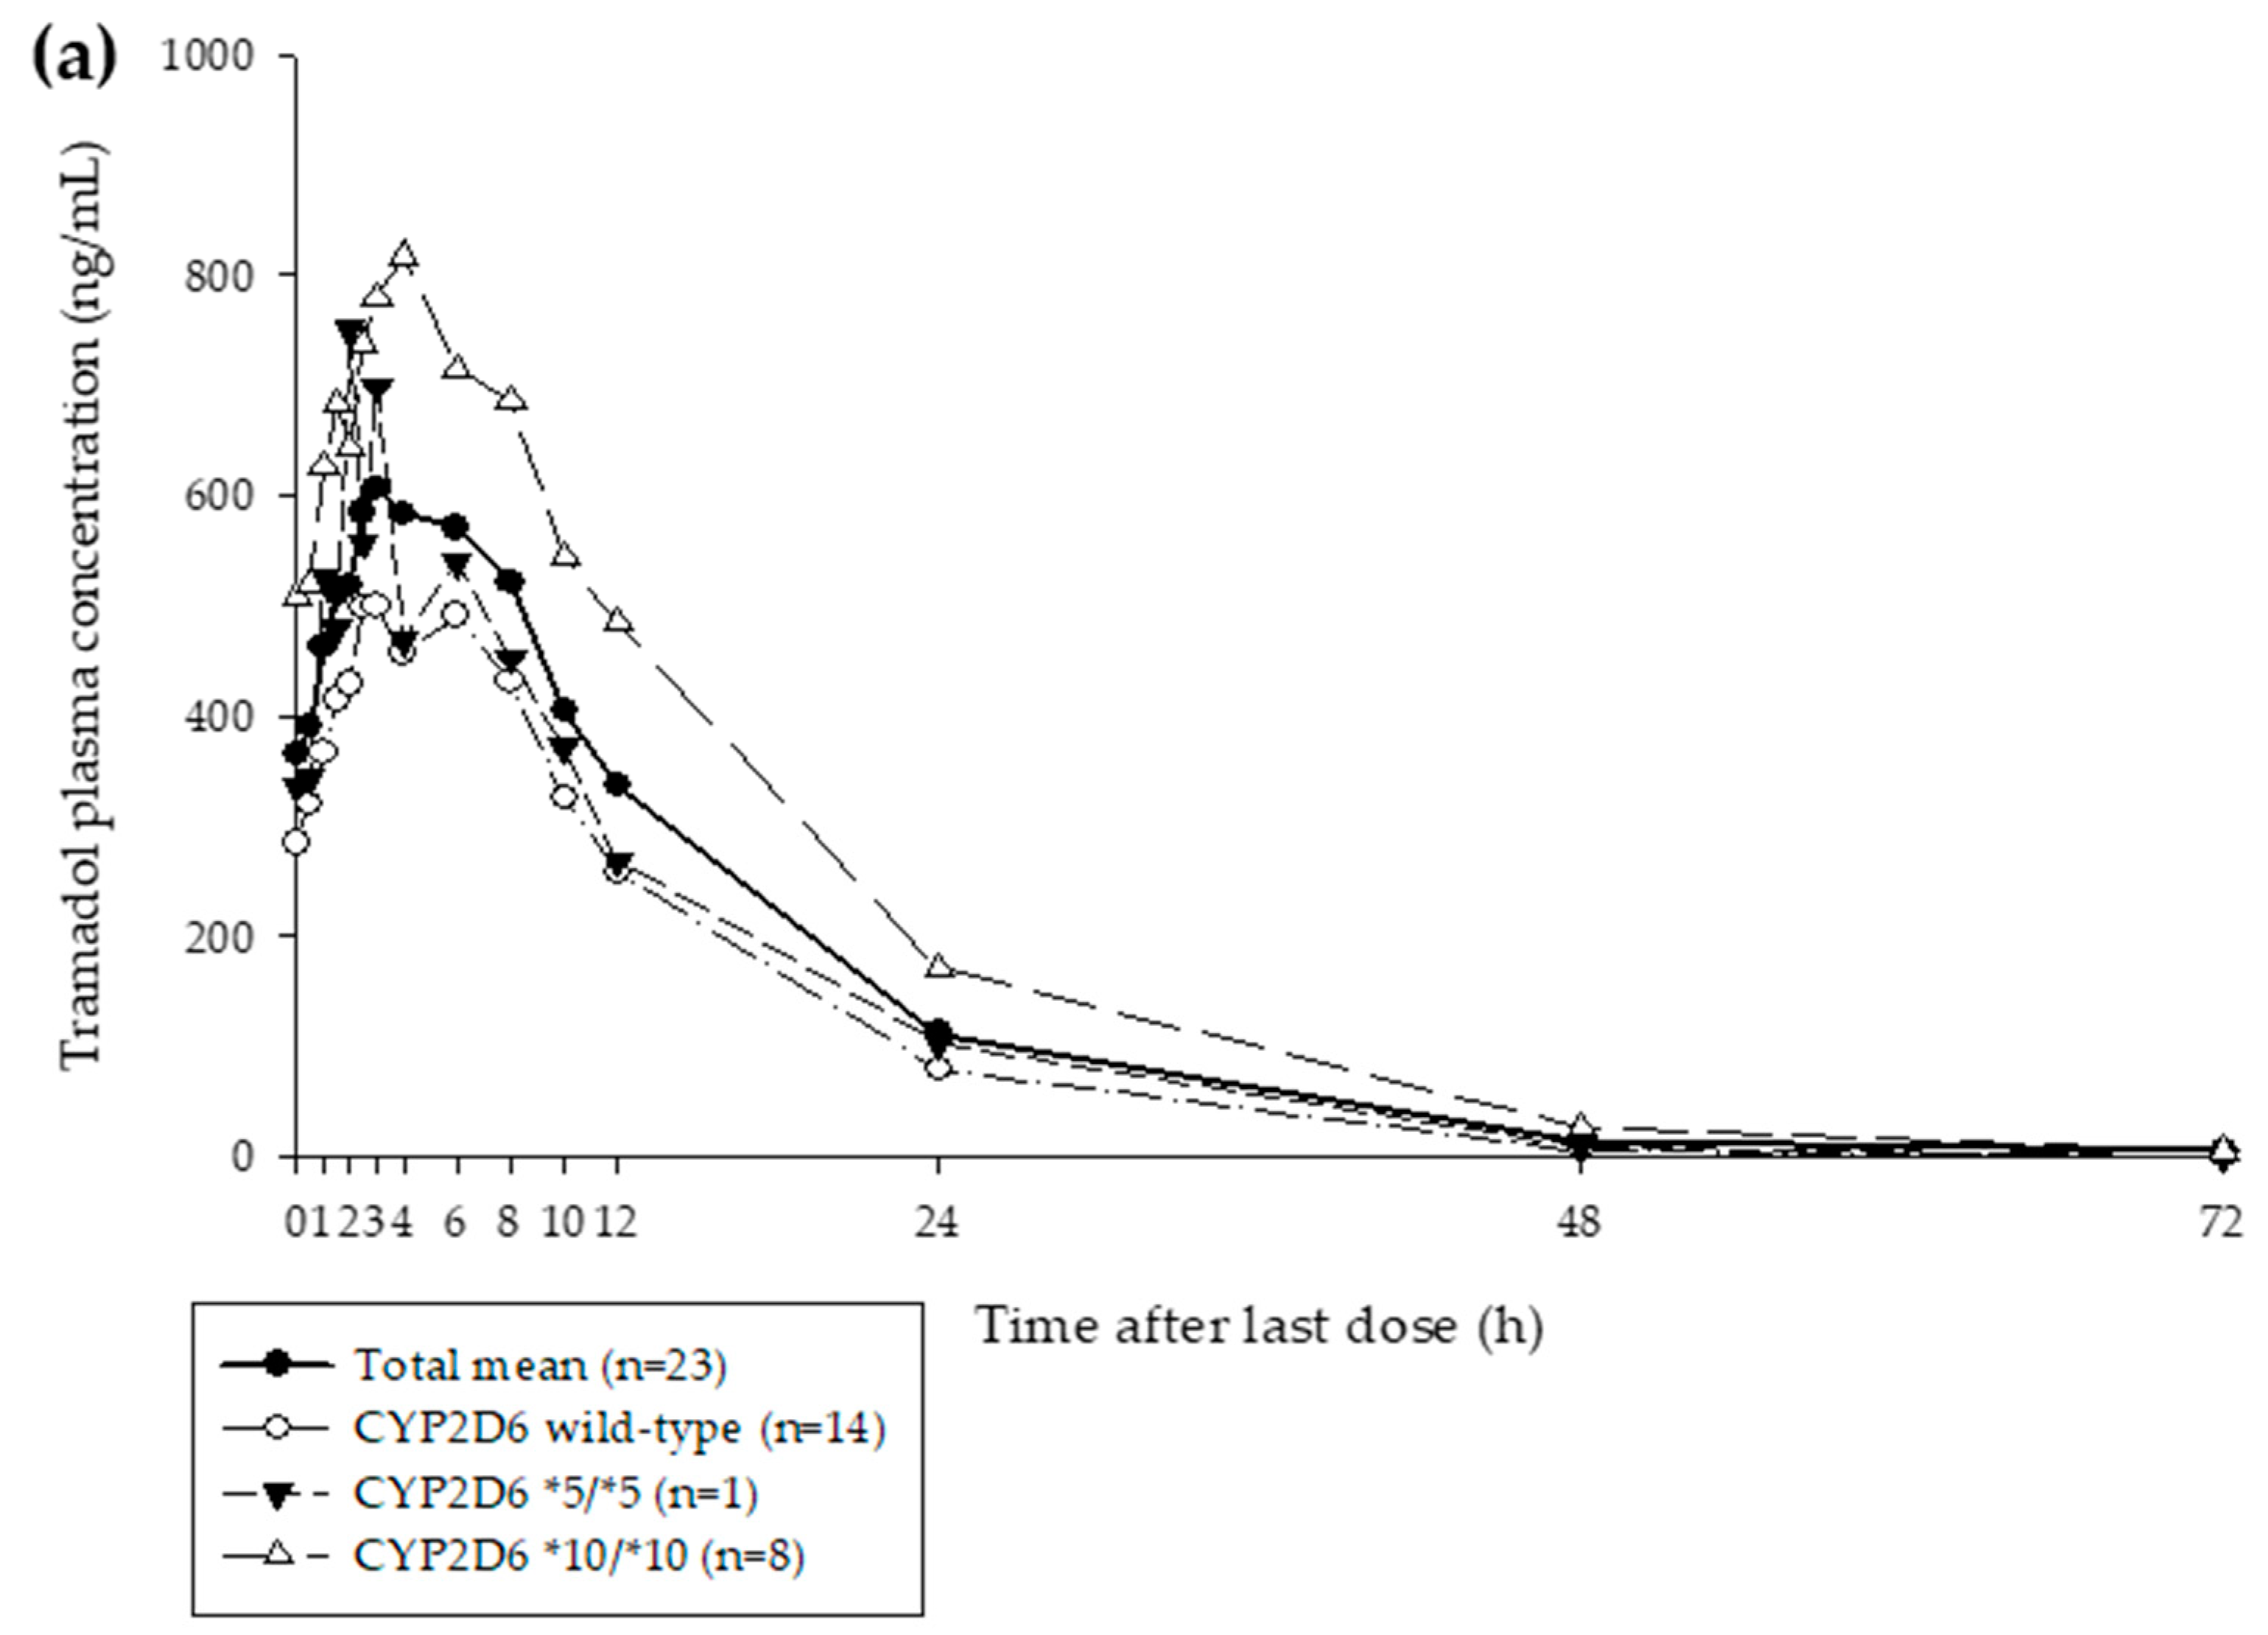
3.1. Clinical Study
3.2. Metabolism Assay for O-Desmethyltramadol (M1)
3.3. PAMPA Results
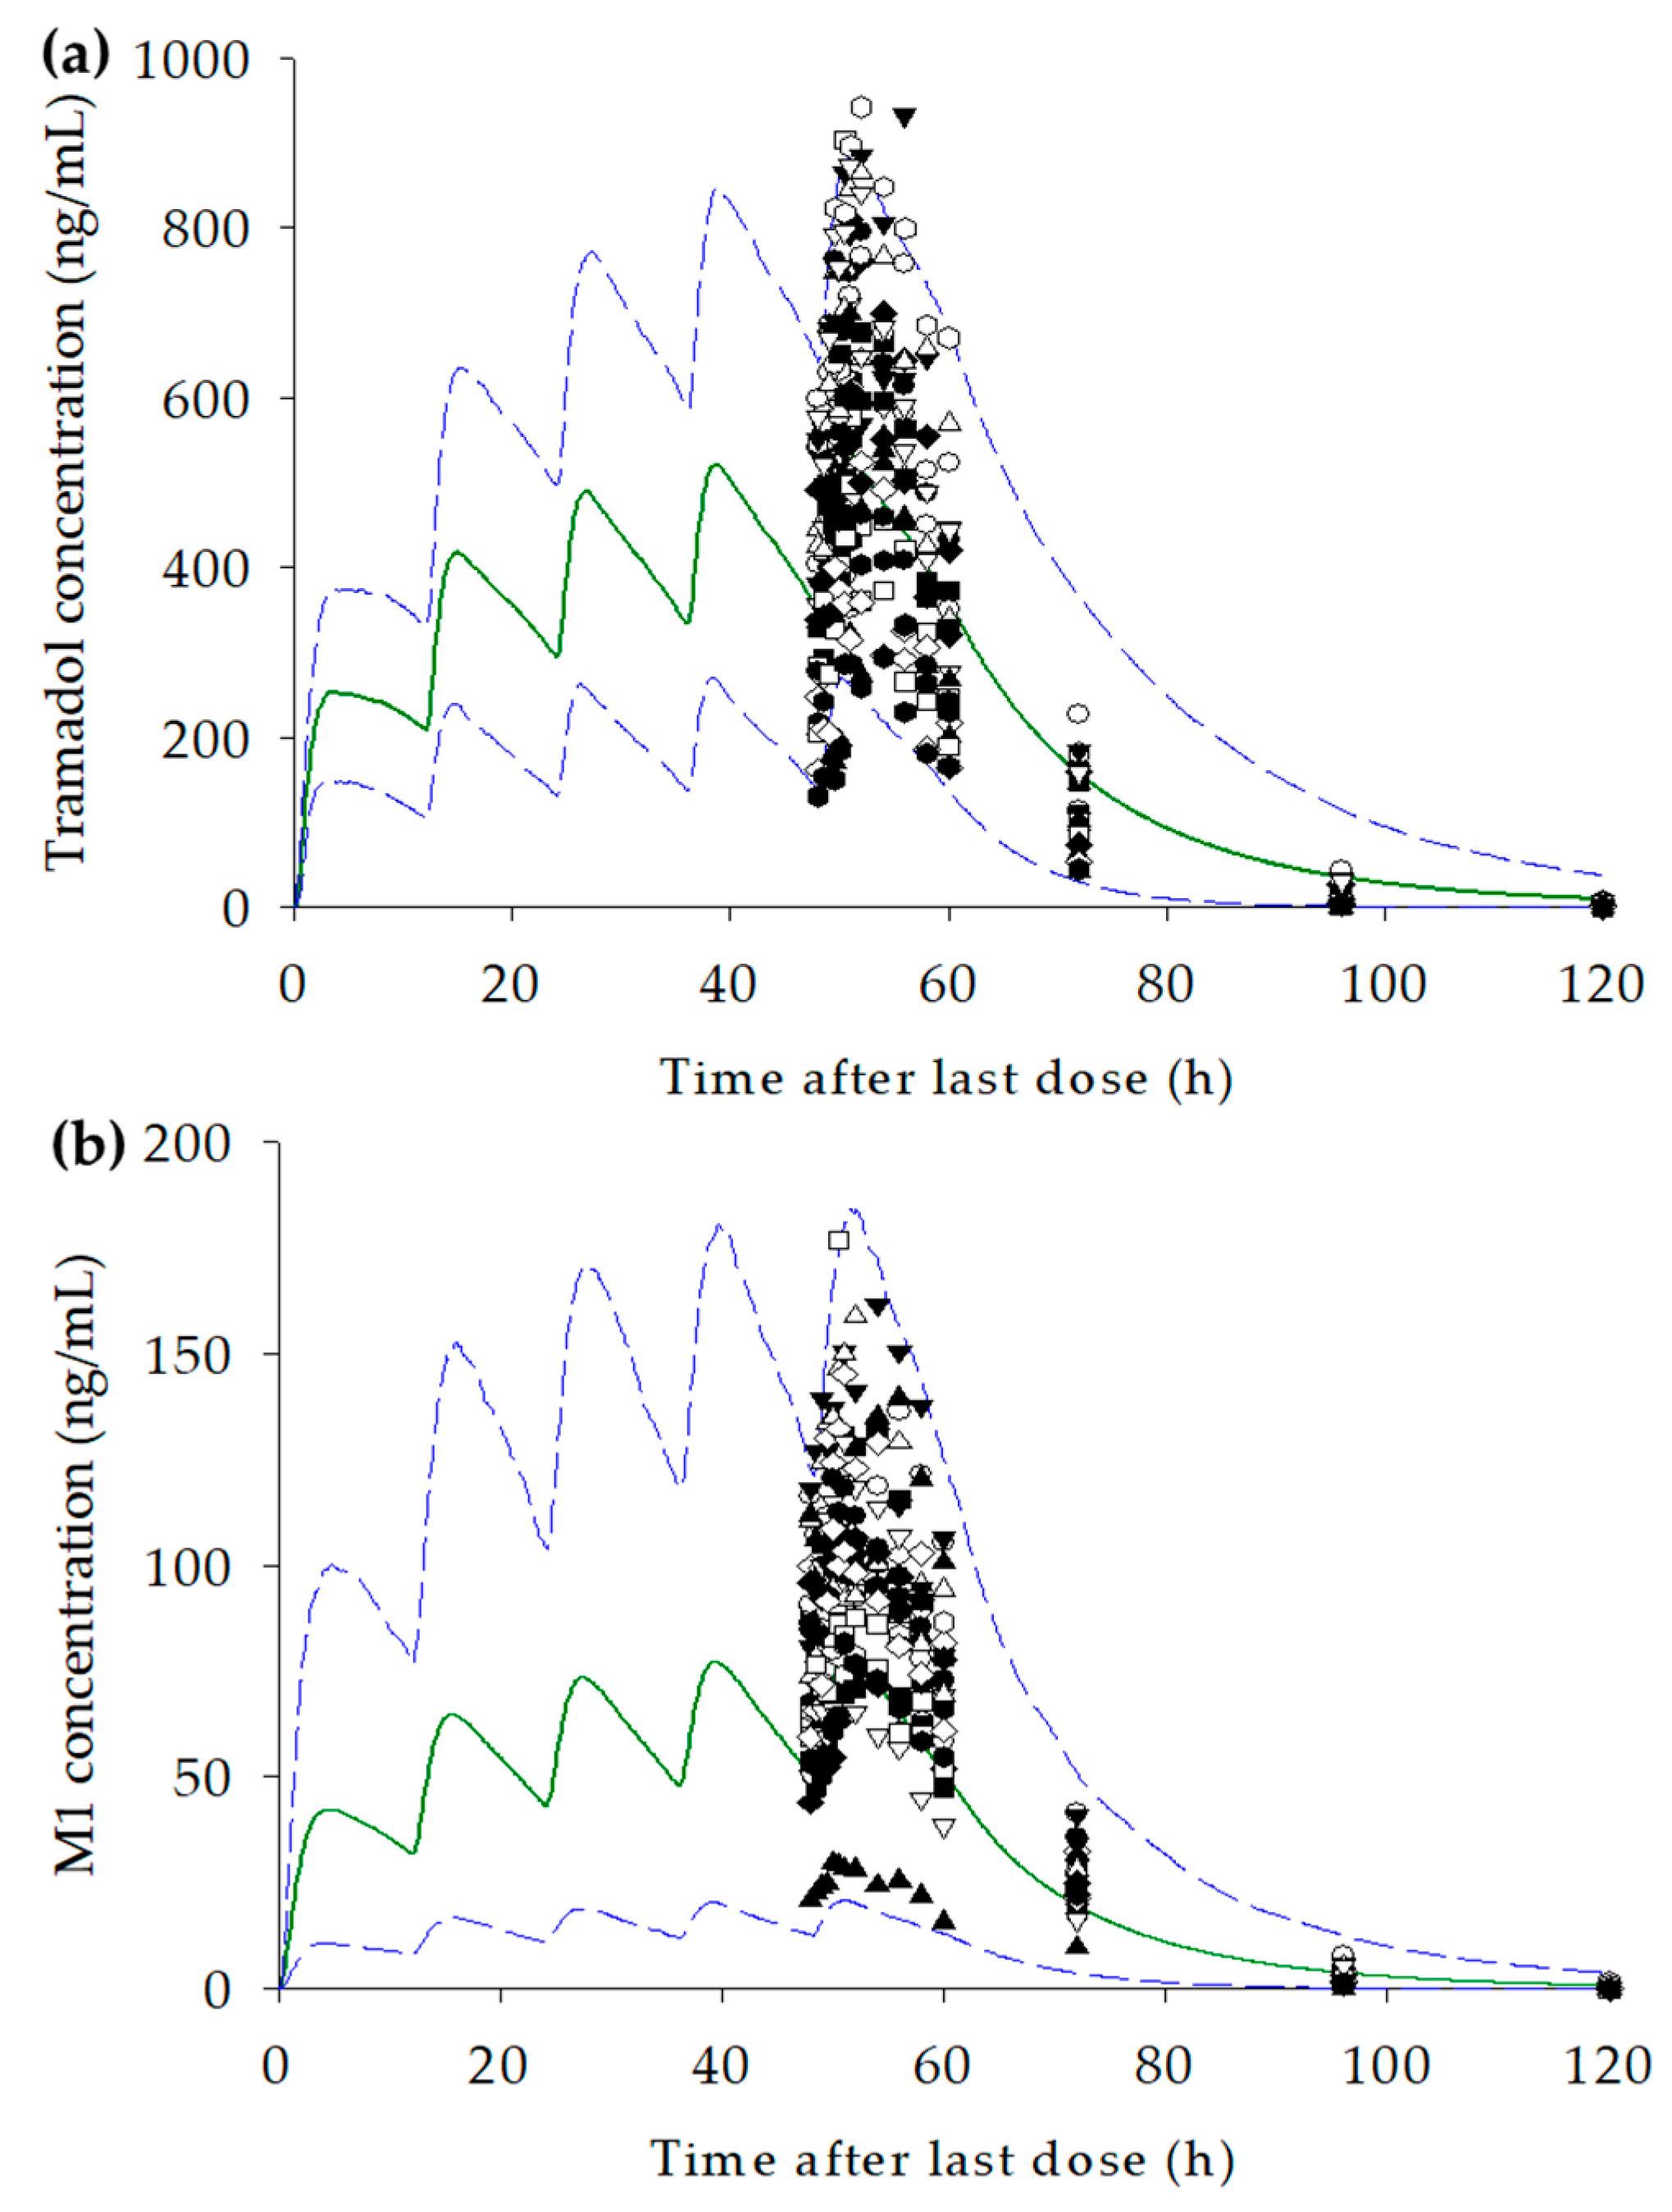
3.4. Development of the PBPK Model for Tramadol and M1
3.5. Prediction of Changes in Concentration–Time Profiles for Tramadol and M1 According to CYP2D6 Genotype and Dosage
4. Discussion
5. Conclusions
Supplementary Materials
Author Contributions
Funding
Conflicts of Interest
References
- Shipton, E. Tramadol—Present and future. Anaesth. Intensive Care 2000, 28, 363–374. [Google Scholar] [CrossRef] [PubMed]
- Miotto, K.; Cho, A.K.; Khalil, M.A.; Blanco, K.; Sasaki, J.D.; Rawson, R. Trends in Tramadol: Pharmacology, Metabolism, and Misuse. Anesth. Analg. 2017, 124, 44–51. [Google Scholar] [CrossRef] [PubMed]
- Lassen, D.; Damkier, P.; Brøsen, K. The Pharmacogenetics of Tramadol. Clin. Pharmacokinet. 2015, 54, 825–836. [Google Scholar] [CrossRef] [PubMed]
- Kaye, A.D. Tramadol, pharmacology, side effects, and serotonin syndrome: A review. Pain Physician 2015, 18, 395–400. [Google Scholar]
- Leppert, W. Tramadol as an analgesic for mild to moderate cancer pain. Pharmacol. Rep. 2009, 61, 978–992. [Google Scholar] [CrossRef]
- Lehtonen, P.; Sten, T.; Aitio, O.; Kurkela, M.; Vuorensola, K.; Finel, M.; Kostiainen, R. Glucuronidation of racemic O-desmethyltramadol, the active metabolite of tramadol. Eur. J. Pharm. Sci. 2010, 41, 523–530. [Google Scholar] [CrossRef]
- Grond, S.; Sablotzki, A. Clinical pharmacology of tramadol. Clin. Pharmacokinet. 2004, 43, 879–923. [Google Scholar] [CrossRef]
- Kostewicz, E.S.; Aarons, L.; Bergstrand, M.; Bolger, M.B.; Galetin, A.; Hatley, O.; Jamei, M.; Lloyd, R.; Pepin, X.; Rostami-Hodjegan, A. PBPK models for the prediction of in vivo performance of oral dosage forms. Eur. J. Pharm. Sci. 2014, 57, 300–321. [Google Scholar] [CrossRef]
- Zhao, P.; Zhang, L.; Grillo, J.; Liu, Q.; Bullock, J.; Moon, Y.; Song, P.; Brar, S.; Madabushi, R.; Wu, T. Applications of physiologically based pharmacokinetic (PBPK) modeling and simulation during regulatory review. Clin. Pharmacol. Ther. 2011, 89, 259–267. [Google Scholar] [CrossRef]
- Abbiati, R.A.; Manca, D. A modeling tool for the personalization of pharmacokinetic predictions. Comput. Chem. Eng. 2016, 91, 28–37. [Google Scholar] [CrossRef]
- Price, P.S.; Conolly, R.B.; Chaisson, C.F.; Gross, E.A.; Young, J.S.; Mathis, E.T.; Tedder, D.R. Modeling interindividual variation in physiological factors used in PBPK models of humans. Crit. Rev. Toxicol. 2003, 33, 469–503. [Google Scholar] [CrossRef] [PubMed]
- Marsousi, N.; Desmeules, J.A.; Rudaz, S.; Daali, Y. Usefulness of PBPK Modeling in Incorporation of Clinical Conditions in Personalized Medicine. J. Pharm. Sci. 2017, 106, 2380–2391. [Google Scholar] [CrossRef] [PubMed]
- T’Jollyn, H.; Snoeys, J.; Colin, P.; Van Bocxlaer, J.; Annaert, P.; Cuyckens, F.; Vermeulen, A.; Van Peer, A.; Allegaert, K.; Mannens, G.; et al. Physiology-Based IVIVE Predictions of Tramadol from in Vitro Metabolism Data. Pharm. Res. 2015, 32, 260–274. [Google Scholar] [CrossRef] [PubMed]
- Salman, S.; Sy, S.K.; Ilett, K.F.; Page-Sharp, M.; Paech, M.J. Population pharmacokinetic modeling of tramadol and its O-desmethyl metabolite in plasma and breast milk. Eur. J. Clin. Pharmacol. 2011, 67, 899–908. [Google Scholar] [CrossRef]
- Garrido, M.J.; Habre, W.; Rombout, F.; Trocóniz, I.F. Population Pharmacokinetic/Pharmacodynamic Modelling of the Analgesic Effects of Tramadol in Pediatrics. Pharm. Res. 2006, 23, 2014–2023. [Google Scholar] [CrossRef]
- Faria, J.; Barbosa, J.; Moreira, R.; Queirós, O.; Carvalho, F.; Dinis-Oliveira, R. Comparative pharmacology and toxicology of tramadol and tapentadol. Eur. J. Pain 2018, 22, 827–844. [Google Scholar] [CrossRef]
- Lee, J.; Yoo, H.D.; Bae, J.W.; Lee, S.; Shin, K.H. Population pharmacokinetic analysis of tramadol and O-desmethyltramadol with genetic polymorphism of CYP2D6. Drug Des. Dev. Ther. 2019, 13, 1751. [Google Scholar] [CrossRef]
- Yu, H.; Hong, S.; Jeong, C.H.; Bae, J.W.; Lee, S. Development of a linear dual column HPLC–MS/MS method and clinical genetic evaluation for tramadol and its phase I and II metabolites in oral fluid. Arch. Pharmacal Res. 2018, 41, 288–298. [Google Scholar] [CrossRef]
- Byeon, J.Y.; Kim, Y.H.; Lee, C.M.; Kim, S.H.; Chae, W.K.; Jung, E.H.; Choi, C.I.; Jang, C.G.; Lee, S.Y.; Bae, J.W. CYP2D6 allele frequencies in Korean population, comparison with East Asian, Caucasian and African populations, and the comparison of metabolic activity of CYP2D6 genotypes. Arch. Pharmacal Res. 2018, 41, 921–930. [Google Scholar] [CrossRef]
- Byeon, J.Y.; Kim, Y.H.; Na, H.S.; Jang, J.H.; Kim, S.H.; Lee, Y.J.; Bae, J.W.; Kim, I.S.; Jang, C.G.; Chung, M.W.; et al. Effects of the CYP2D6* 10 allele on the pharmacokinetics of atomoxetine and its metabolites. Arch. Pharmacal Res. 2015, 38, 2083–2091. [Google Scholar] [CrossRef]
- Doki, K.; Homma, M.; Kuga, K.; Kusano, K.; Watanabe, S.; Yamaguchi, I.; Kohda, Y. Effect of CYP2D6 genotype on flecainide pharmacokinetics in Japanese patients with supraventricular tachyarrhythmia. Eur. J. Clin. Pharmacol. 2006, 62, 919–926. [Google Scholar] [CrossRef] [PubMed]
- Findling, R.L.; Nucci, G.; Piergies, A.A.; Gomeni, R.; Bartolic, E.I.; Fong, R.; Carpenter, D.J.; Leeder, J.S.; Gaedigk, A.; Danoff, T.M. Multiple dose pharmacokinetics of paroxetine in children and adolescents with major depressive disorder or obsessive–compulsive disorder. Neuropsychopharmacology 2006, 31, 1274. [Google Scholar] [CrossRef] [PubMed]
- Yoo, H.D.; Lee, S.N.; Kang, H.A.; Cho, H.Y.; Lee, I.K.; Lee, Y.B. Influence of ABCB1 genetic polymorphisms on the pharmacokinetics of risperidone in healthy subjects with CYP2D6* 10/* 10. Br. J. Pharmacol. 2011, 164, 433–443. [Google Scholar] [CrossRef] [PubMed]
- Chen, X.; Murawski, A.; Patel, K.; Crespi, C.L.; Balimane, P.V. A Novel Design of Artificial Membrane for Improving the PAMPA Model. Pharm. Res. 2008, 25, 1511–1520. [Google Scholar] [CrossRef]
- Bae, S.H.; Kwon, M.J.; Park, J.B.; Kim, D.; Kim, D.H.; Kang, J.S.; Kim, C.G.; Oh, E.; Bae, S.K. Metabolic drug-drug interaction potential of macrolactin A and 7-O-succinyl macrolactin A assessed by evaluating cytochrome P450 inhibition and induction and UDP-glucuronosyltransferase inhibition in vitro. Antimicrob. Agents Chemother. 2014, 58, 5036–5046. [Google Scholar] [CrossRef]
- Li, A.P. In vitro approaches to evaluate ADMET drug properties. Curr. Top. Med. Chem. 2004, 4, 701–706. [Google Scholar] [CrossRef]
- Kanaan, M.; Daali, Y.; Dayer, P.; Desmeules, J. Uptake/Efflux Transport of Tramadol Enantiomers and O-Desmethyl-Tramadol: Focus on P-Glycoprotein. Basic Clin. Pharmacol. Toxicol. 2009, 105, 199–206. [Google Scholar] [CrossRef]
- Saarikoski, T.; Saari, T.I.; Hagelberg, N.M.; Backman, J.T.; Neuvonen, P.J.; Scheinin, M.; Olkkola, K.T.; Laine, K. Effects of terbinafine and itraconazole on the pharmacokinetics of orally administered tramadol. Eur. J. Clin. Pharmacol. 2015, 71, 321–327. [Google Scholar] [CrossRef]
- Mattia, C.; Coluzzi, F. Once-daily tramadol in rheumatological pain. Expert Opin. Pharmacother. 2006, 7, 1811–1823. [Google Scholar] [CrossRef]
- T’jollyn, H.; Vermeulen, A.; Van Bocxlaer, J. PBPK and its virtual populations: The impact of physiology on pediatric pharmacokinetic predictions of tramadol. AAPS J. 2019, 21, 8. [Google Scholar] [CrossRef]
- Pubchem. O-Desmethyltramadol. Available online: https://pubchem.ncbi.nlm.nih.gov/compound/9838803 (accessed on 31 January 2019).
- Wojsławski, J.; Białk-Bielińska, A.; Stepnowski, P.; Dołżonek, J. Leaching behavior of pharmaceuticals and their metabolites in the soil environment. Chemosphere 2019, 231, 269–275. [Google Scholar] [CrossRef] [PubMed]
- T’jollyn, H.; Snoeys, J.; Vermeulen, A.; Michelet, R.; Cuyckens, F.; Mannens, G.; Van Peer, A.; Annaert, P.; Allegaert, K.; Van Bocxlaer, J.; et al. Physiologically Based Pharmacokinetic Predictions of Tramadol Exposure Throughout Pediatric Life: An Analysis of the Different Clearance Contributors with Emphasis on CYP2D6 Maturation. AAPS J. 2015, 17, 1376–1387. [Google Scholar] [CrossRef] [PubMed]
- Barbera, N.; Fisichella, M.; Bosco, A.; Indorato, F.; Spadaro, G.; Romano, G. A suicidal poisoning due to tramadol. A metabolic approach to death investigation. J. Forensic Leg. Med. 2013, 20, 555–558. [Google Scholar] [CrossRef] [PubMed]
- Perdreau, E.; Iriart, X.; Mouton, J.B.; Jalal, Z.; Thambo, J.B. Cardiogenic shock due to acute tramadol intoxication. Cardiovasc. Toxicol. 2015, 15, 100–103. [Google Scholar] [CrossRef]
- Lee, S.Y.; Sohn, K.M.; Ryu, J.Y.; Yoon, Y.R.; Shin, J.G.; Kim, J.W. Sequence-based CYP2D6 genotyping in the Korean population. Ther. Drug Monit. 2006, 28, 382–387. [Google Scholar] [CrossRef]
- Vazzana, M.; Andreani, T.; Fangueiro, J.; Faggio, C.; Silva, C.; Santini, A.; Garcia, M.; Silva, A.; Souto, E. Tramadol hydrochloride: Pharmacokinetics, pharmacodynamics, adverse side effects, co-administration of drugs and new drug delivery systems. Biomed. Pharmacother. 2015, 70, 234–238. [Google Scholar] [CrossRef]
- Costa, I.; Oliveira, A.; Guedes de Pinho, P.; Teixeira, H.M.; Moreira, R.; Carvalho, F.; Jorge Dinis-Oliveira, R. Postmortem Redistribution of Tramadol and O-Desmethyltramadol. J. Anal. Toxicol. 2013, 37, 670–675. [Google Scholar] [CrossRef]
- Tzvetkov, M.V.; Saadatmand, A.R.; Lötsch, J.; Tegeder, I.; Stingl, J.C.; Brockmöller, J. Genetically polymorphic OCT1: Another piece in the puzzle of the variable pharmacokinetics and pharmacodynamics of the opioidergic drug tramadol. Clin. Pharmacol. Ther. 2011, 90, 143–150. [Google Scholar] [CrossRef]
- Stamer, U.M.; Frank, M.; Stuber, F.; Brockmoller, J.; Steffens, M.; Tzvetkov, M.V. Loss-of-function polymorphisms in the organic cation transporter OCT1 are associated with reduced postoperative tramadol consumption. Pain 2016, 157, 2467–2475. [Google Scholar] [CrossRef]
- Slanar, O.; Nobilis, M.; Kvétina, J.; Matousková, O.; Idle, J.R.; Perlík, F. Pharmacokinetics of tramadol is affected by MDR1 polymorphism C3435T. Eur. J. Clin. Pharmacol. 2007, 63, 419–421. [Google Scholar] [CrossRef]


| Characteristic | Mean (SD) |
|---|---|
| Age (years) | 24.78 (4.80) |
| Height (cm) | 176.51 (5.64) |
| Weight (kg) | 71.61 (8.87) |
| CYP2D6 genotypes (no. of subjects) | |
| Wild-type | 14 |
| *5/*5 | 1 |
| *10/*10 | 8 |
| Parameters | Tramadol | M1 * | ||
|---|---|---|---|---|
| Value | Source | Value | Source | |
| Physicochemical properties and blood binding | ||||
| Molecular weight (g/mol) | 263.4 | [30] | 249.354 | [31] |
| Log P | 1.35 | [30] | 2.26 | [32] |
| pKa | 9.41 (Monoprotic base) | [30] | 9.62 (Monoprotic base) | [32] |
| fup | 0.8 | [33] | 0.525 | Predicted in SimCYP |
| Absorption | ||||
| Absorption type | PAMPA | - | n/a | - |
| Papp (×10−6 cm/s) | 10.2 | Experimental data | n/a | - |
| Distribution | ||||
| Kp scalar | 0.946 | Adjusted using Vss | 0.107 | Estimated |
| Vss (L/kg) | 2.6 | Observed data | 0.628 | Estimated |
| Elimination | ||||
| CLint (μL/min/pmol or mg protein) | CYP2D6: 0.447; CYP2B6: 0.028; CYP3A4: 0.020 | Retrograde model | 52.92 (WOMC–HLM) | Experimental data |
| CLR | 1.850 | Estimated | 0.481 | Estimated |
| Parameters | Mean (Range) |
|---|---|
| Age (years) | 28.9 (20.2–40.0) |
| Height (cm) | 166.2 (147.6–188.0) |
| Weight (kg) | 62.3 (42.9–93.9) |
| The percentage of female | 50% |
| Parameters | Observed (Range) | Simulated (Range) | Ratio (90% CI) |
|---|---|---|---|
| Tramadol | |||
| Geometric mean Cmax,ss (ng/mL) | 643.8; (294.0–942.1) | 508.4; (122.1–1226) | 0.79; (0.69–0.91) |
| Geometric mean AUClast,ss (ng/mL·h) | 8965; (4127–16,038) | 9346; (1217–42,462) | 1.04; (0.85–1.28) |
| M1 | |||
| Geometric mean Cmax,ss (ng/mL) | 103.8; (29.8–176.7) | 65.68; (1.07–368.1) | 0.63; (0.51–0.79) |
| Geometric mean AUClast,ss (ng/mL·h) | 1775; (445.3–2875) | 1.187; (6.236–7522) | 0.67; (0.54–0.84) |
| Organ | Maximum Concentration at Steady-State in Each Organ (ng/mL) | |
|---|---|---|
| Tramadol | M1 | |
| Adipose tissue | 400.6 | 12.89 |
| Bone | 899.8 | 23.88 |
| Brain | 1034 | 19.74 |
| Gut | 2741 | 88.38 |
| Heart | 763.0 | 94.97 |
| Kidney | 1452 | 78.46 |
| Liver | 3034 | 157.5 |
| Lung | 991.0 | 21.09 |
| Muscle | 2411 | 79.13 |
| Pancreas | 2000 | 56.25 |
| Skin | 1355 | 42.03 |
| Spleen | 2821 | 88.53 |
| Parameters | UM | EM | IM | PM | ||||
|---|---|---|---|---|---|---|---|---|
| Tramadol | M1 | Tramadol | M1 | Tramadol | M1 | Tramadol | M1 | |
| Tramadol 100 mg | ||||||||
| Cmax,ss (ng/mL) (range) | 357.2 (72.43–927.6) | 126.8 (21.39–449.0) | 469.6 (122.2–1117) | 83.80 (12.62–368.1) | 593.8 (165.8–1379) | 40.93 (5.511–240.9) | 721.3 (209.5–1675) | 0.6433 (0.0975–5.312) |
| AUClast,ss (ng/mL·h) (range) | 5353 (648.7–25,267) | 1881 (278.6–8560) | 8206 (1217–34,213) | 1445 (175.2–7522) | 12,049 (1932–42,462) | 813.5 (79.54–5234) | 16,795 (2682–61,319) | 2.919 (0.3351–34.42) |
| Tramadol 200 mg | ||||||||
| Cmax,ss (ng/mL) (range) | 714.3 (144.9–1855) | 253.5 # (42.77–898.0) | 939.1 * (244.3–2235) | 167.6 (25.24–736.3) | 1188 ** (331.7–2758) | 81.86 (11.02–481.7) | 1443 ** (418.9–3349) | 1.287 (0.1950–10.62) |
| AUClast,ss (ng/mL·h) (range) | 10,706 (1297–50,533) | 3761 (557.1–17,119) | 16,411 (2434–68,426) | 2890 (350.3–15,044) | 24,097 (3864–84,923) | 1627 (159.1–10,467) | 33,591 (5365–122,637) | 5.839 (0.67–68.83) |
| Tramadol | EM | IM | PM | ||||||
| Observed (n = 13) | Predicted (n = 1000) | Ratio (90% CI) | Observed (n = 8) | Predicted (n = 1000) | Ratio (90% CI) | Observed (n = 1) | Predicted (n = 1000) | Ratio (90% CI) | |
| Cmax,ss (ng/mL) (range) | 551.2 (294.0–904.4) | 469.6 (122.2–1117) | 0.85 (0.72–1.01) | 828.5 (676.6–942.1) | 593.8 (165.8–1379) | 0.72 (0.59–0.87) | 751.10 | 721.3 (209.5–1675) | 0.96 |
| AUClast,ss (ng/mL·h) (range) | 7116 (4127–9345) | 8206 (1217–34,213) | 1.15 (0.90–1.48) | 13,501 (10,527–16,038) | 12,049 (1932–42,462) | 0.89 (0.66–1.20) | 8591.72 | 16,795 (2682–61,319) | 1.95 |
| M1 | EM | IM | PM | ||||||
| Observed (n = 13) | Predicted (n = 1000) | Ratio (90% CI) | Observed (n = 8) | Predicted (n = 1000) | Ratio (90% CI) | Observed (n = 1) | Predicted (n = 1000) | Ratio (90% CI) | |
| Cmax,ss (ng/mL) (range) | 125.0 (81.8–176.7) | 83.80 (12.62–368.1) | 0.67 (0.52–0.86) | 87.79 (66.0–114.1) | 40.93 (5.511–240.9) | 0.47 (0.32–0.69) | 29.8 | 0.6433 (0.0975–5.312) | 0.02 |
| AUClast,ss (ng/mL·h) (range) | 1996 (1373–2875) | 1445 (175.2–7522) | 0.72 (0.56–0.94) | 1718 (1223–2199) | 813.5 (79.54–5234) | 0.47 (0.31–0.72) | 445.3 | 2.919 (0.3351–34.42) | 0.01 |
© 2019 by the authors. Licensee MDPI, Basel, Switzerland. This article is an open access article distributed under the terms and conditions of the Creative Commons Attribution (CC BY) license (http://creativecommons.org/licenses/by/4.0/).
Share and Cite
Jeong, H.-C.; Bae, S.H.; Bae, J.-W.; Lee, S.; Kim, A.; Jang, Y.; Shin, K.-H. Evaluation of the Effect of CYP2D6 Genotypes on Tramadol and O-Desmethyltramadol Pharmacokinetic Profiles in a Korean Population Using Physiologically-Based Pharmacokinetic Modeling. Pharmaceutics 2019, 11, 618. https://doi.org/10.3390/pharmaceutics11110618
Jeong H-C, Bae SH, Bae J-W, Lee S, Kim A, Jang Y, Shin K-H. Evaluation of the Effect of CYP2D6 Genotypes on Tramadol and O-Desmethyltramadol Pharmacokinetic Profiles in a Korean Population Using Physiologically-Based Pharmacokinetic Modeling. Pharmaceutics. 2019; 11(11):618. https://doi.org/10.3390/pharmaceutics11110618
Chicago/Turabian StyleJeong, Hyeon-Cheol, Soo Hyeon Bae, Jung-Woo Bae, Sooyeun Lee, Anhye Kim, Yoojeong Jang, and Kwang-Hee Shin. 2019. "Evaluation of the Effect of CYP2D6 Genotypes on Tramadol and O-Desmethyltramadol Pharmacokinetic Profiles in a Korean Population Using Physiologically-Based Pharmacokinetic Modeling" Pharmaceutics 11, no. 11: 618. https://doi.org/10.3390/pharmaceutics11110618
APA StyleJeong, H.-C., Bae, S. H., Bae, J.-W., Lee, S., Kim, A., Jang, Y., & Shin, K.-H. (2019). Evaluation of the Effect of CYP2D6 Genotypes on Tramadol and O-Desmethyltramadol Pharmacokinetic Profiles in a Korean Population Using Physiologically-Based Pharmacokinetic Modeling. Pharmaceutics, 11(11), 618. https://doi.org/10.3390/pharmaceutics11110618