
Equine Parvovirus-Hepatitis Population Dynamics in a Single Horse over 16 Years

Abstract
1. Introduction
2. Materials and Methods
2.1. Samples
2.2. Luminescent Immunoprecipitation System (LIPS)
2.3. Viral Nucleic Acid Detection
2.4. Sequencing and Data Preparation
2.5. Phylogenetic Analyses
2.6. Statistical Analyses
3. Results
3.1. Target Region Identification
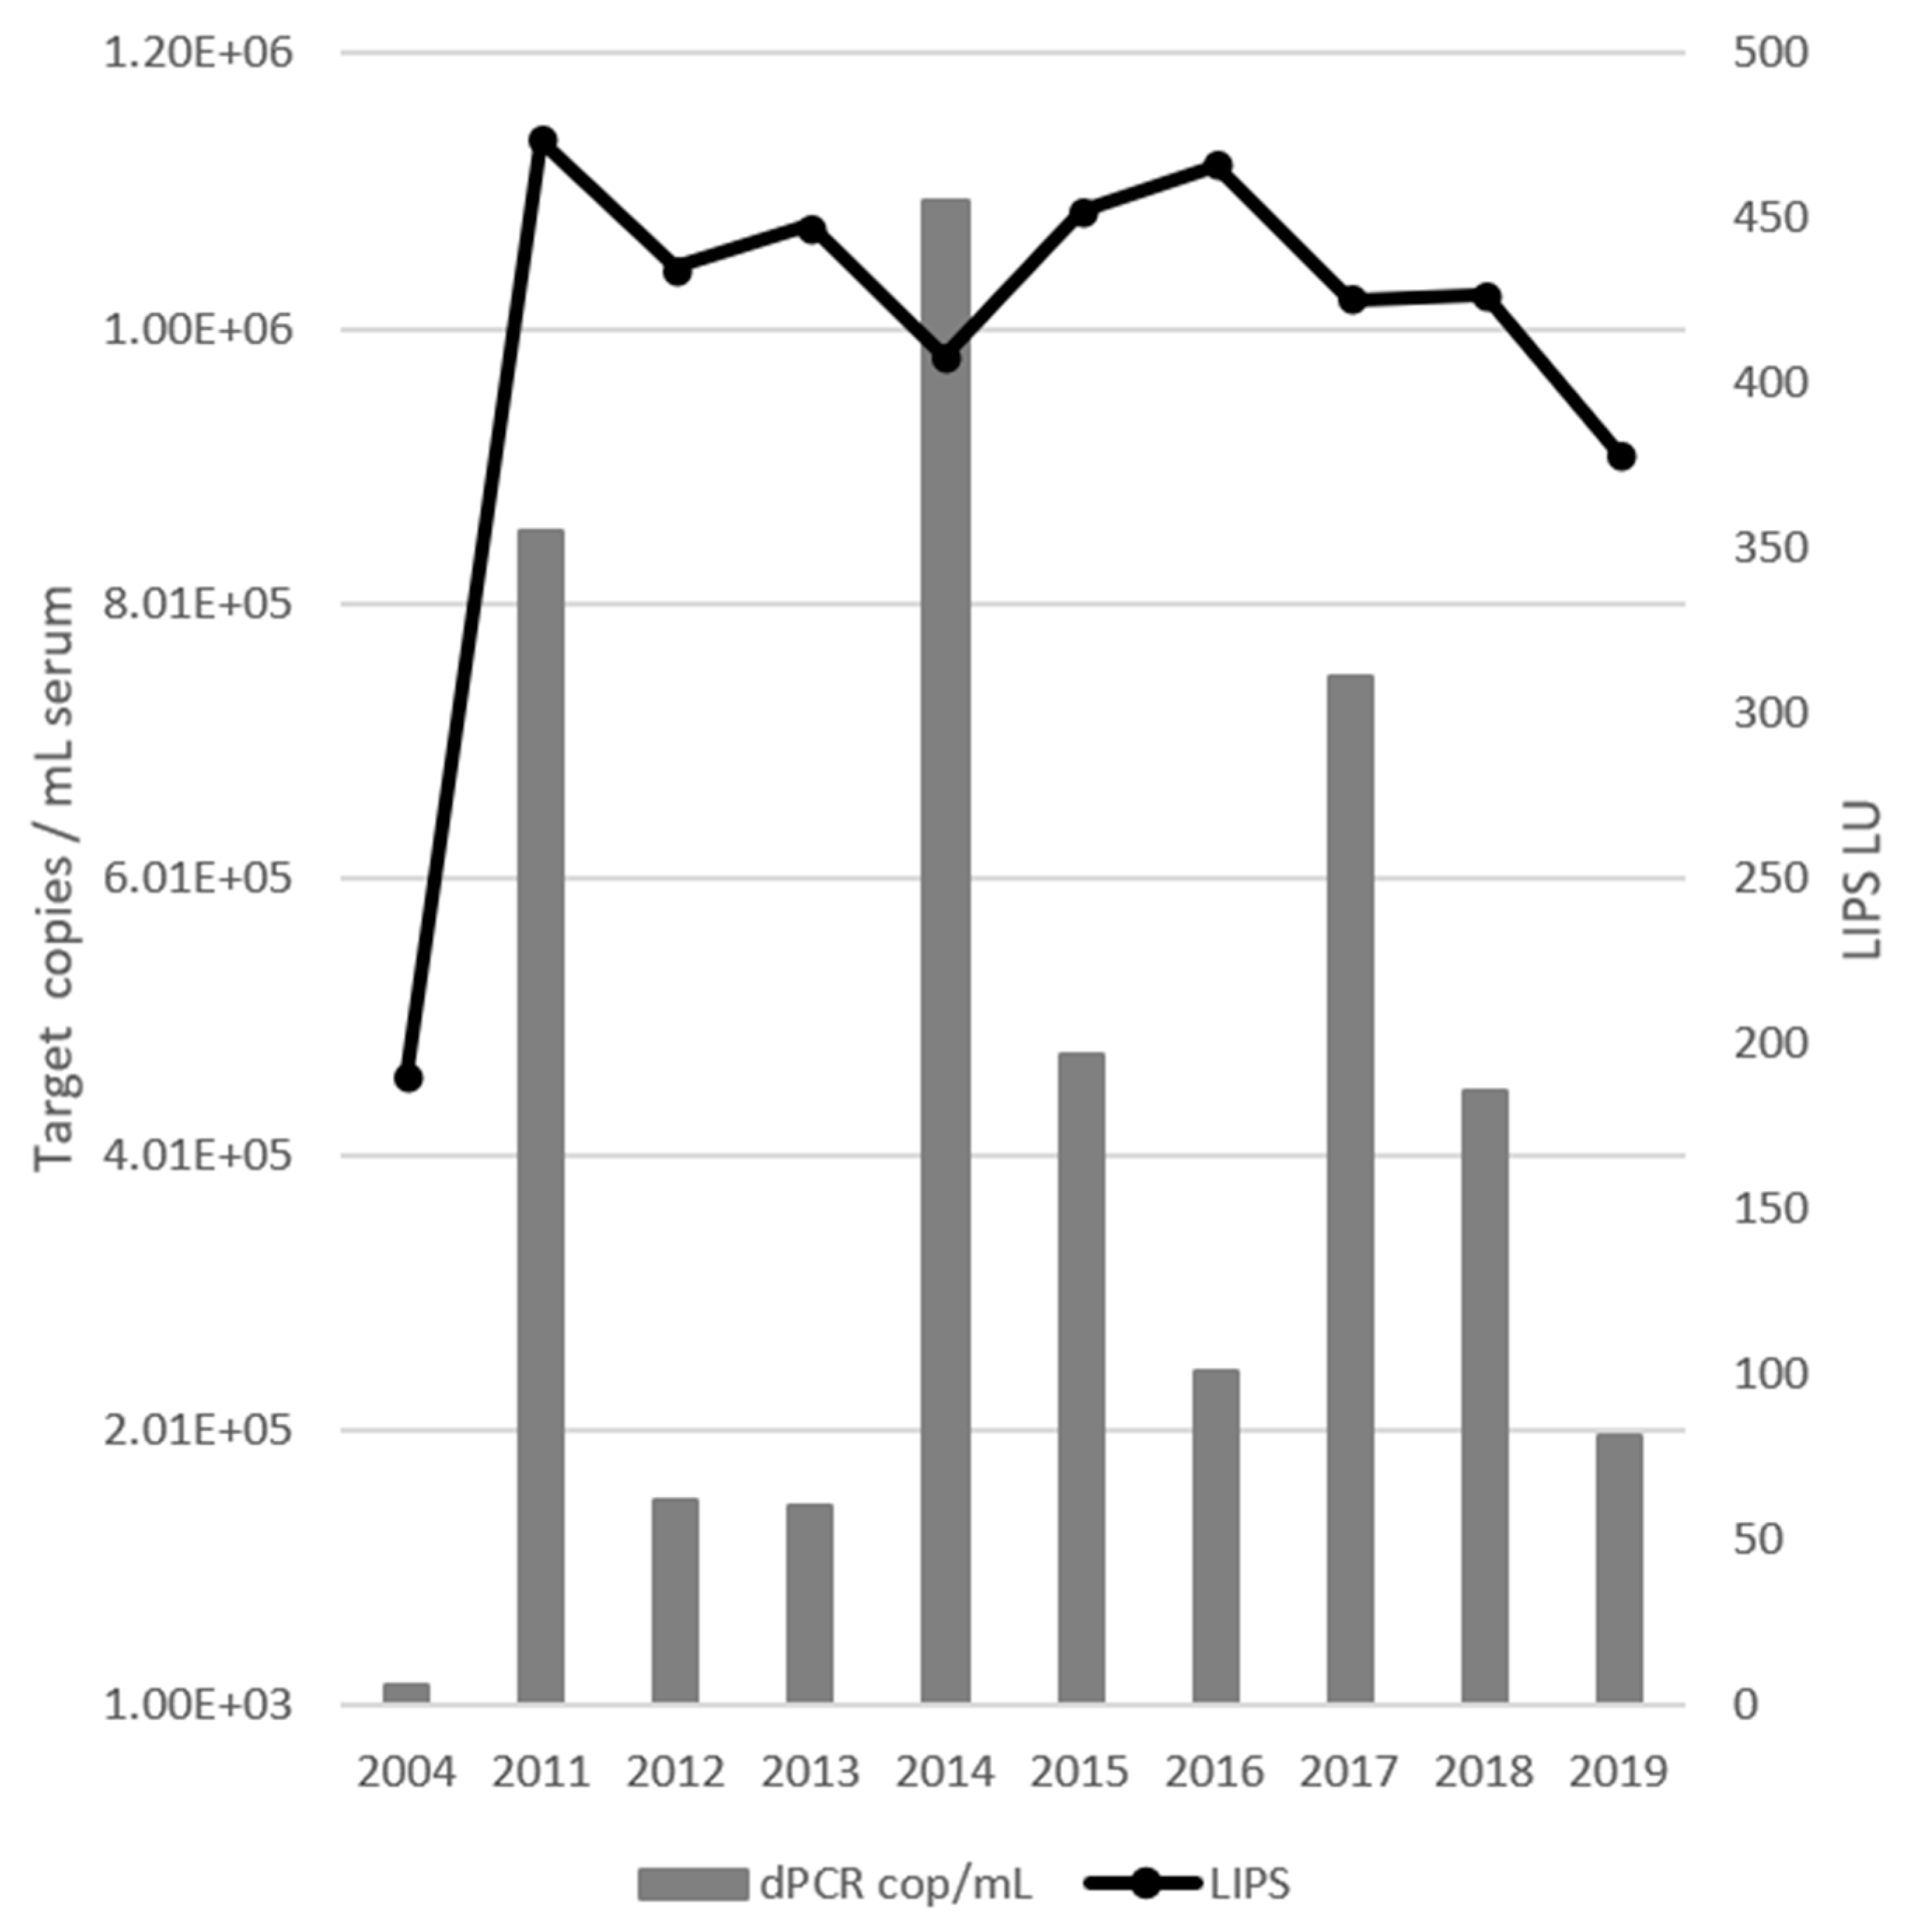
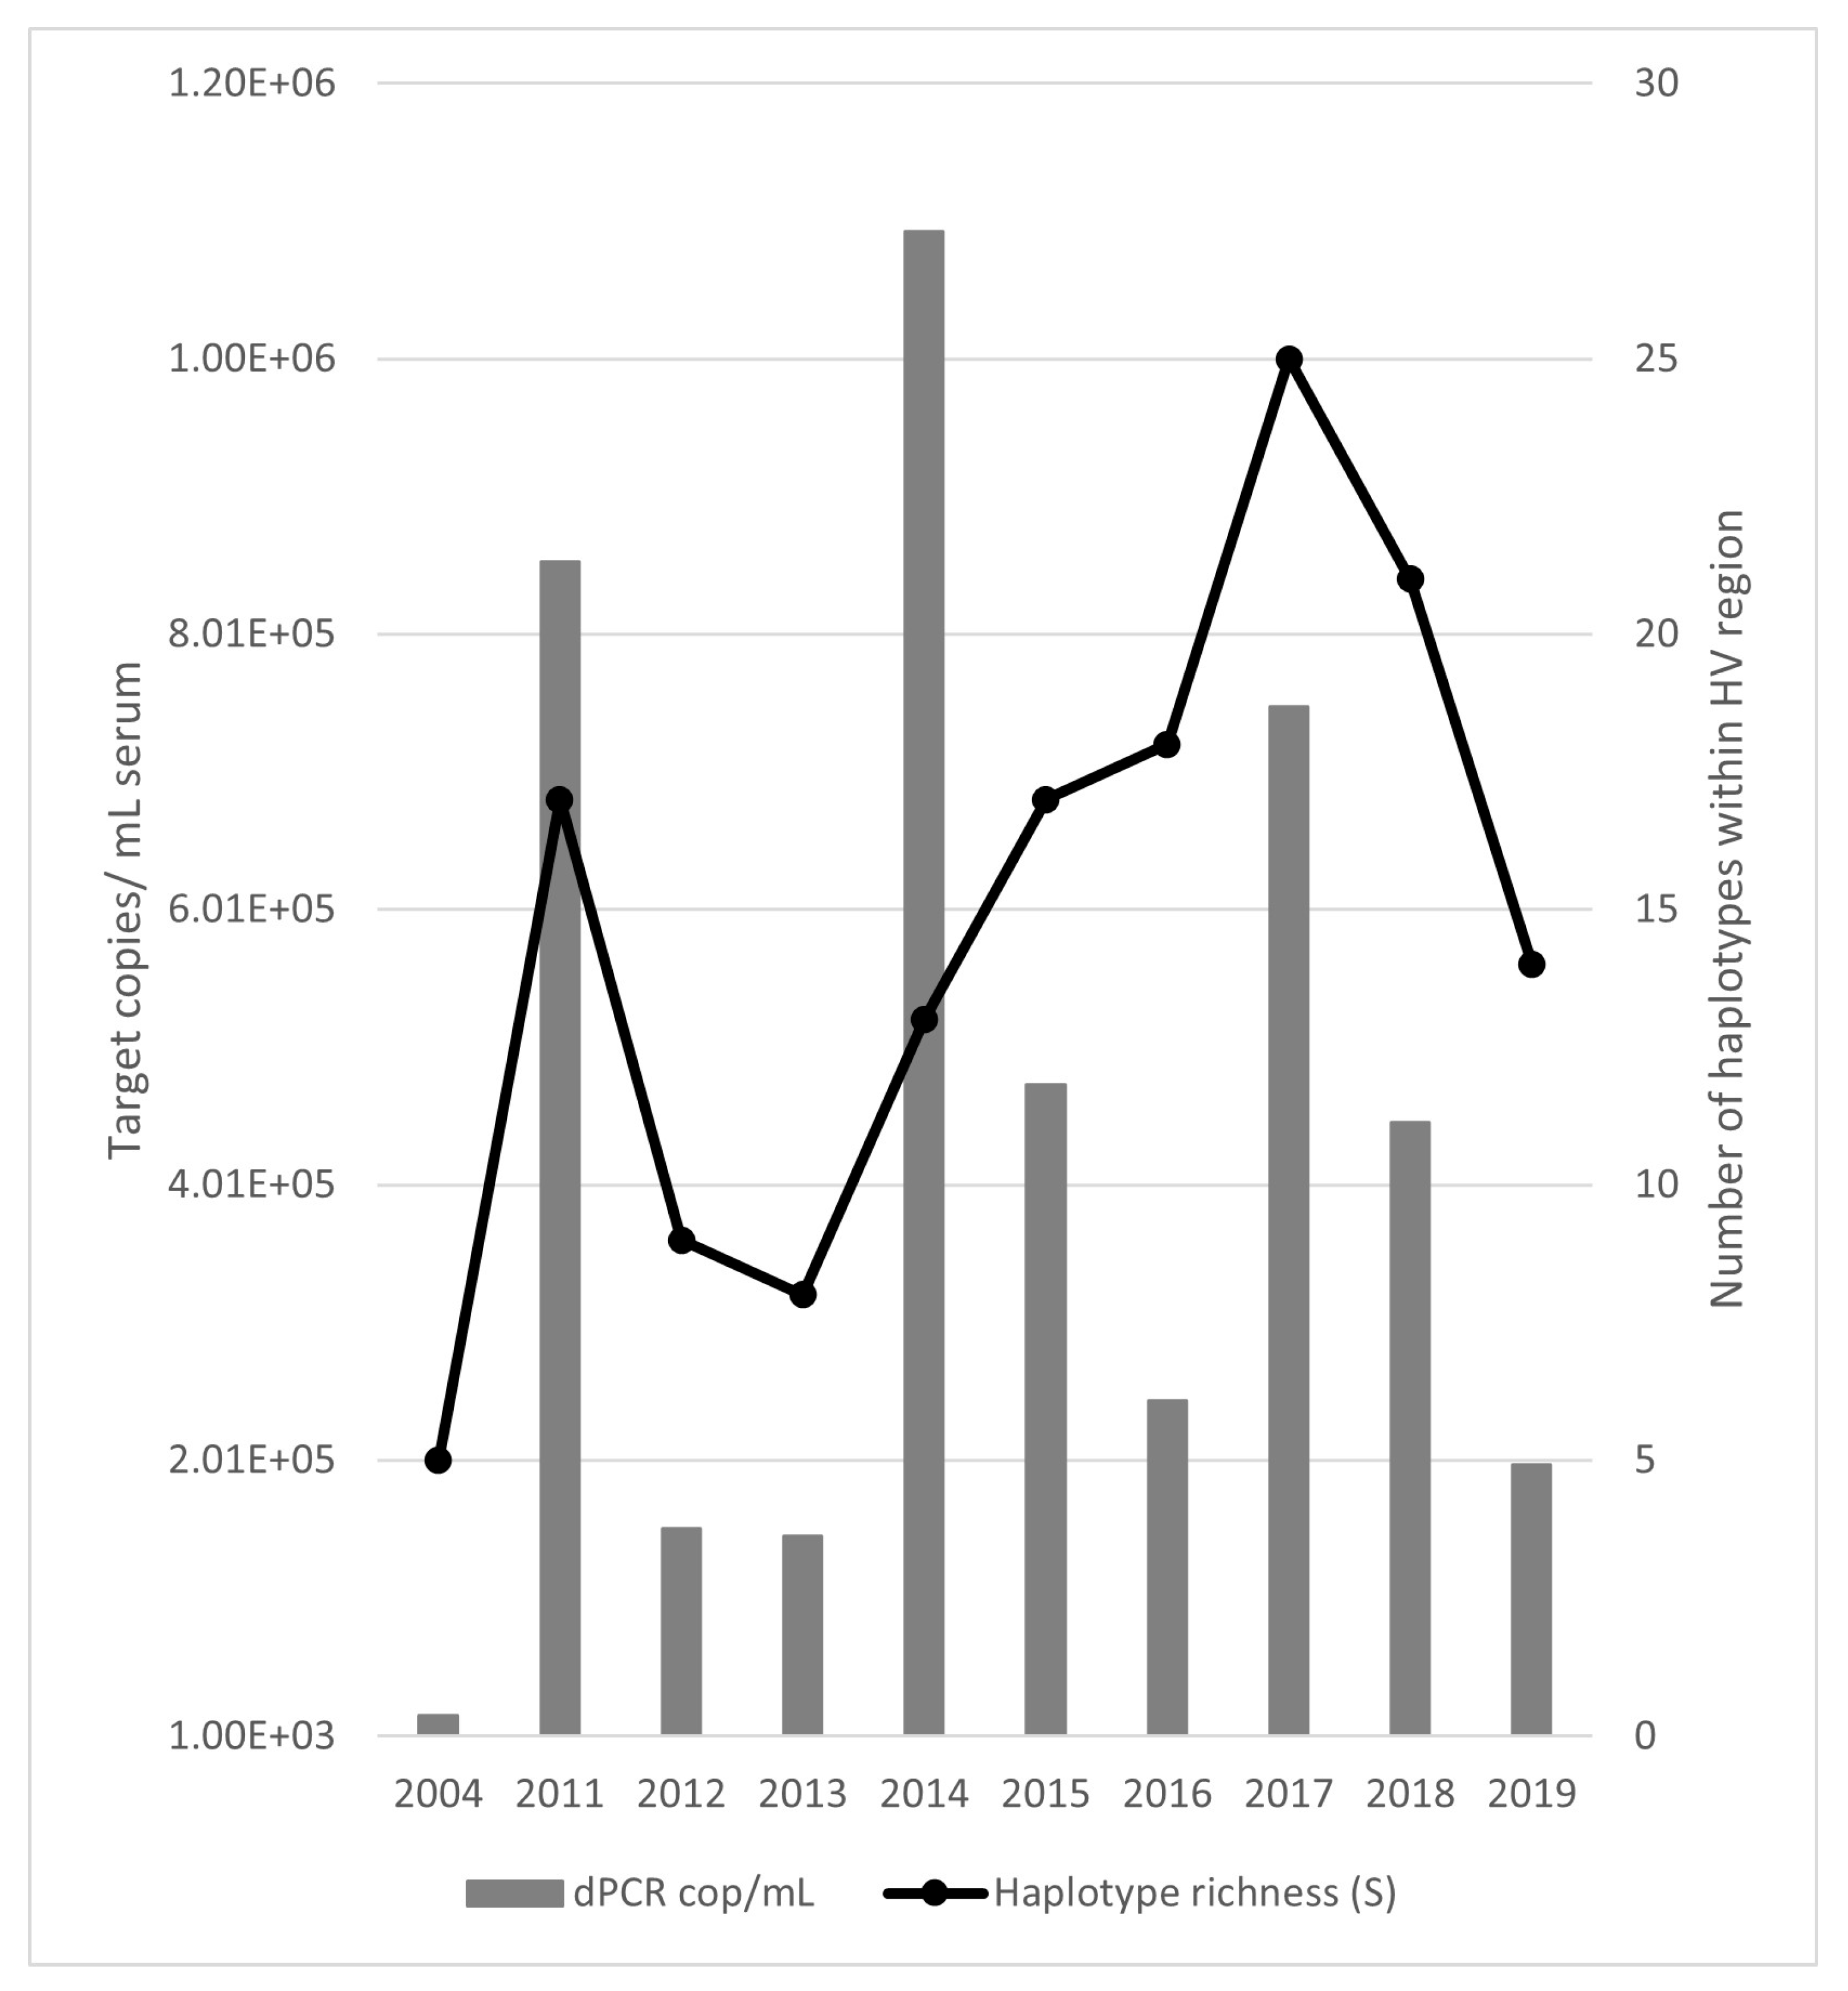
3.2. Viral Load and Antibody Response
3.3. HTS Analysis
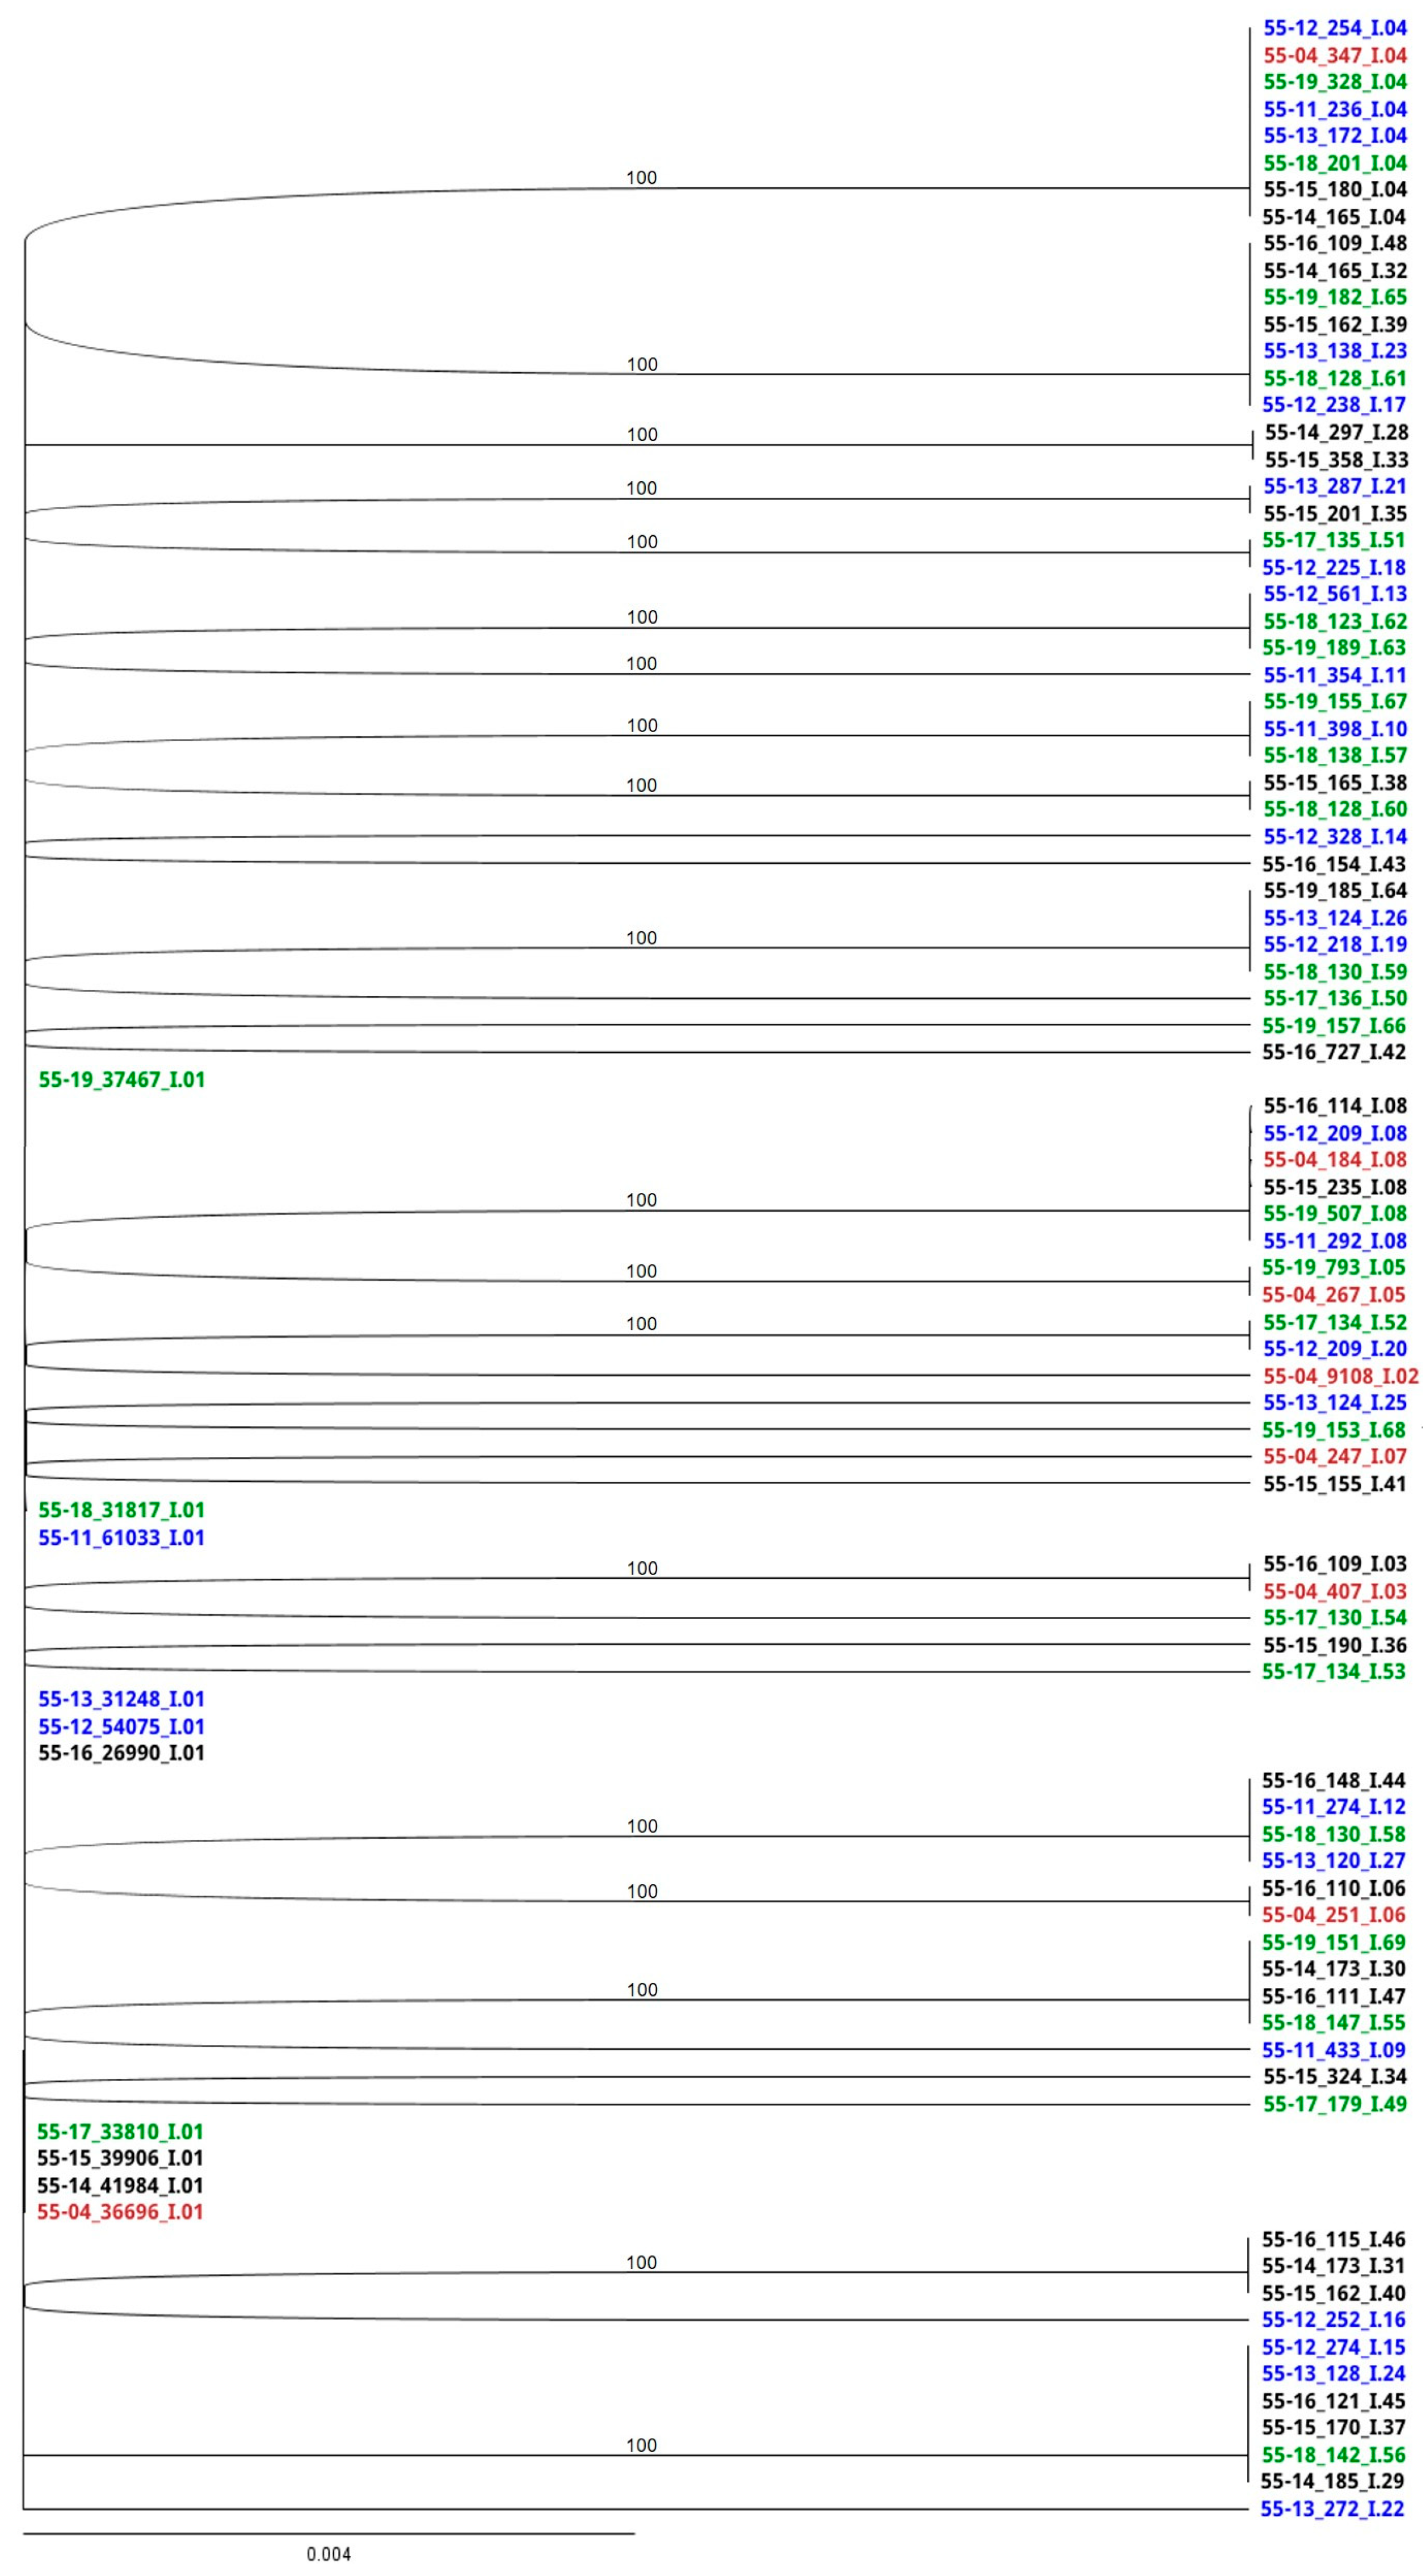
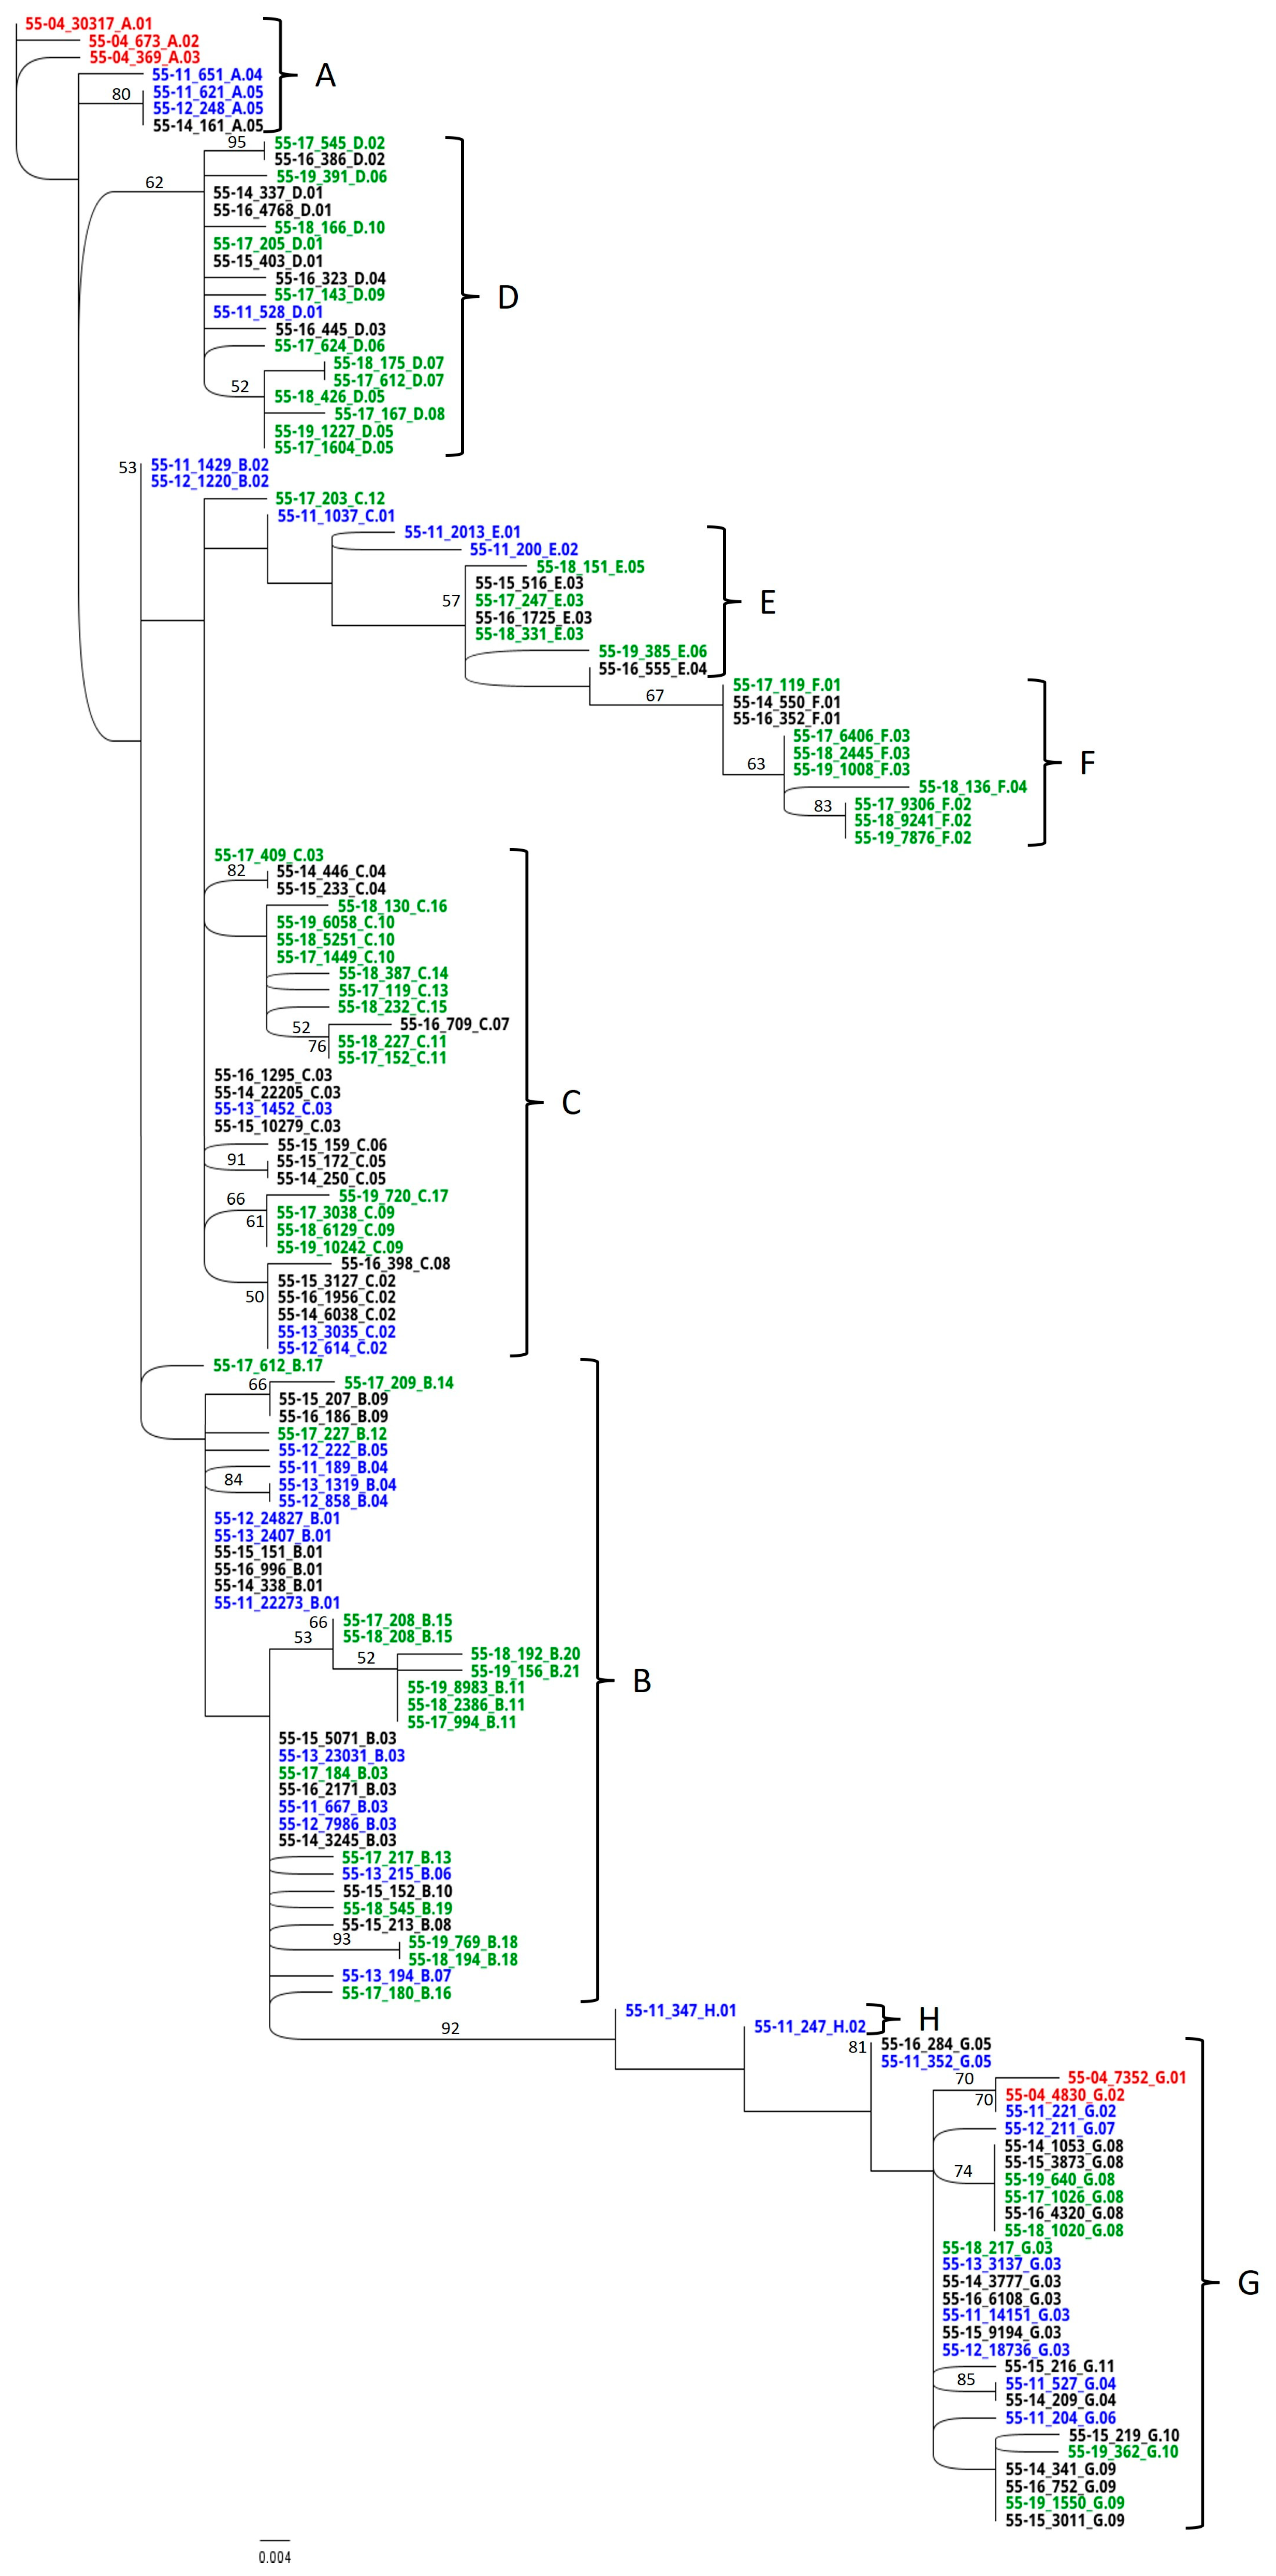
3.4. RAxML Trees
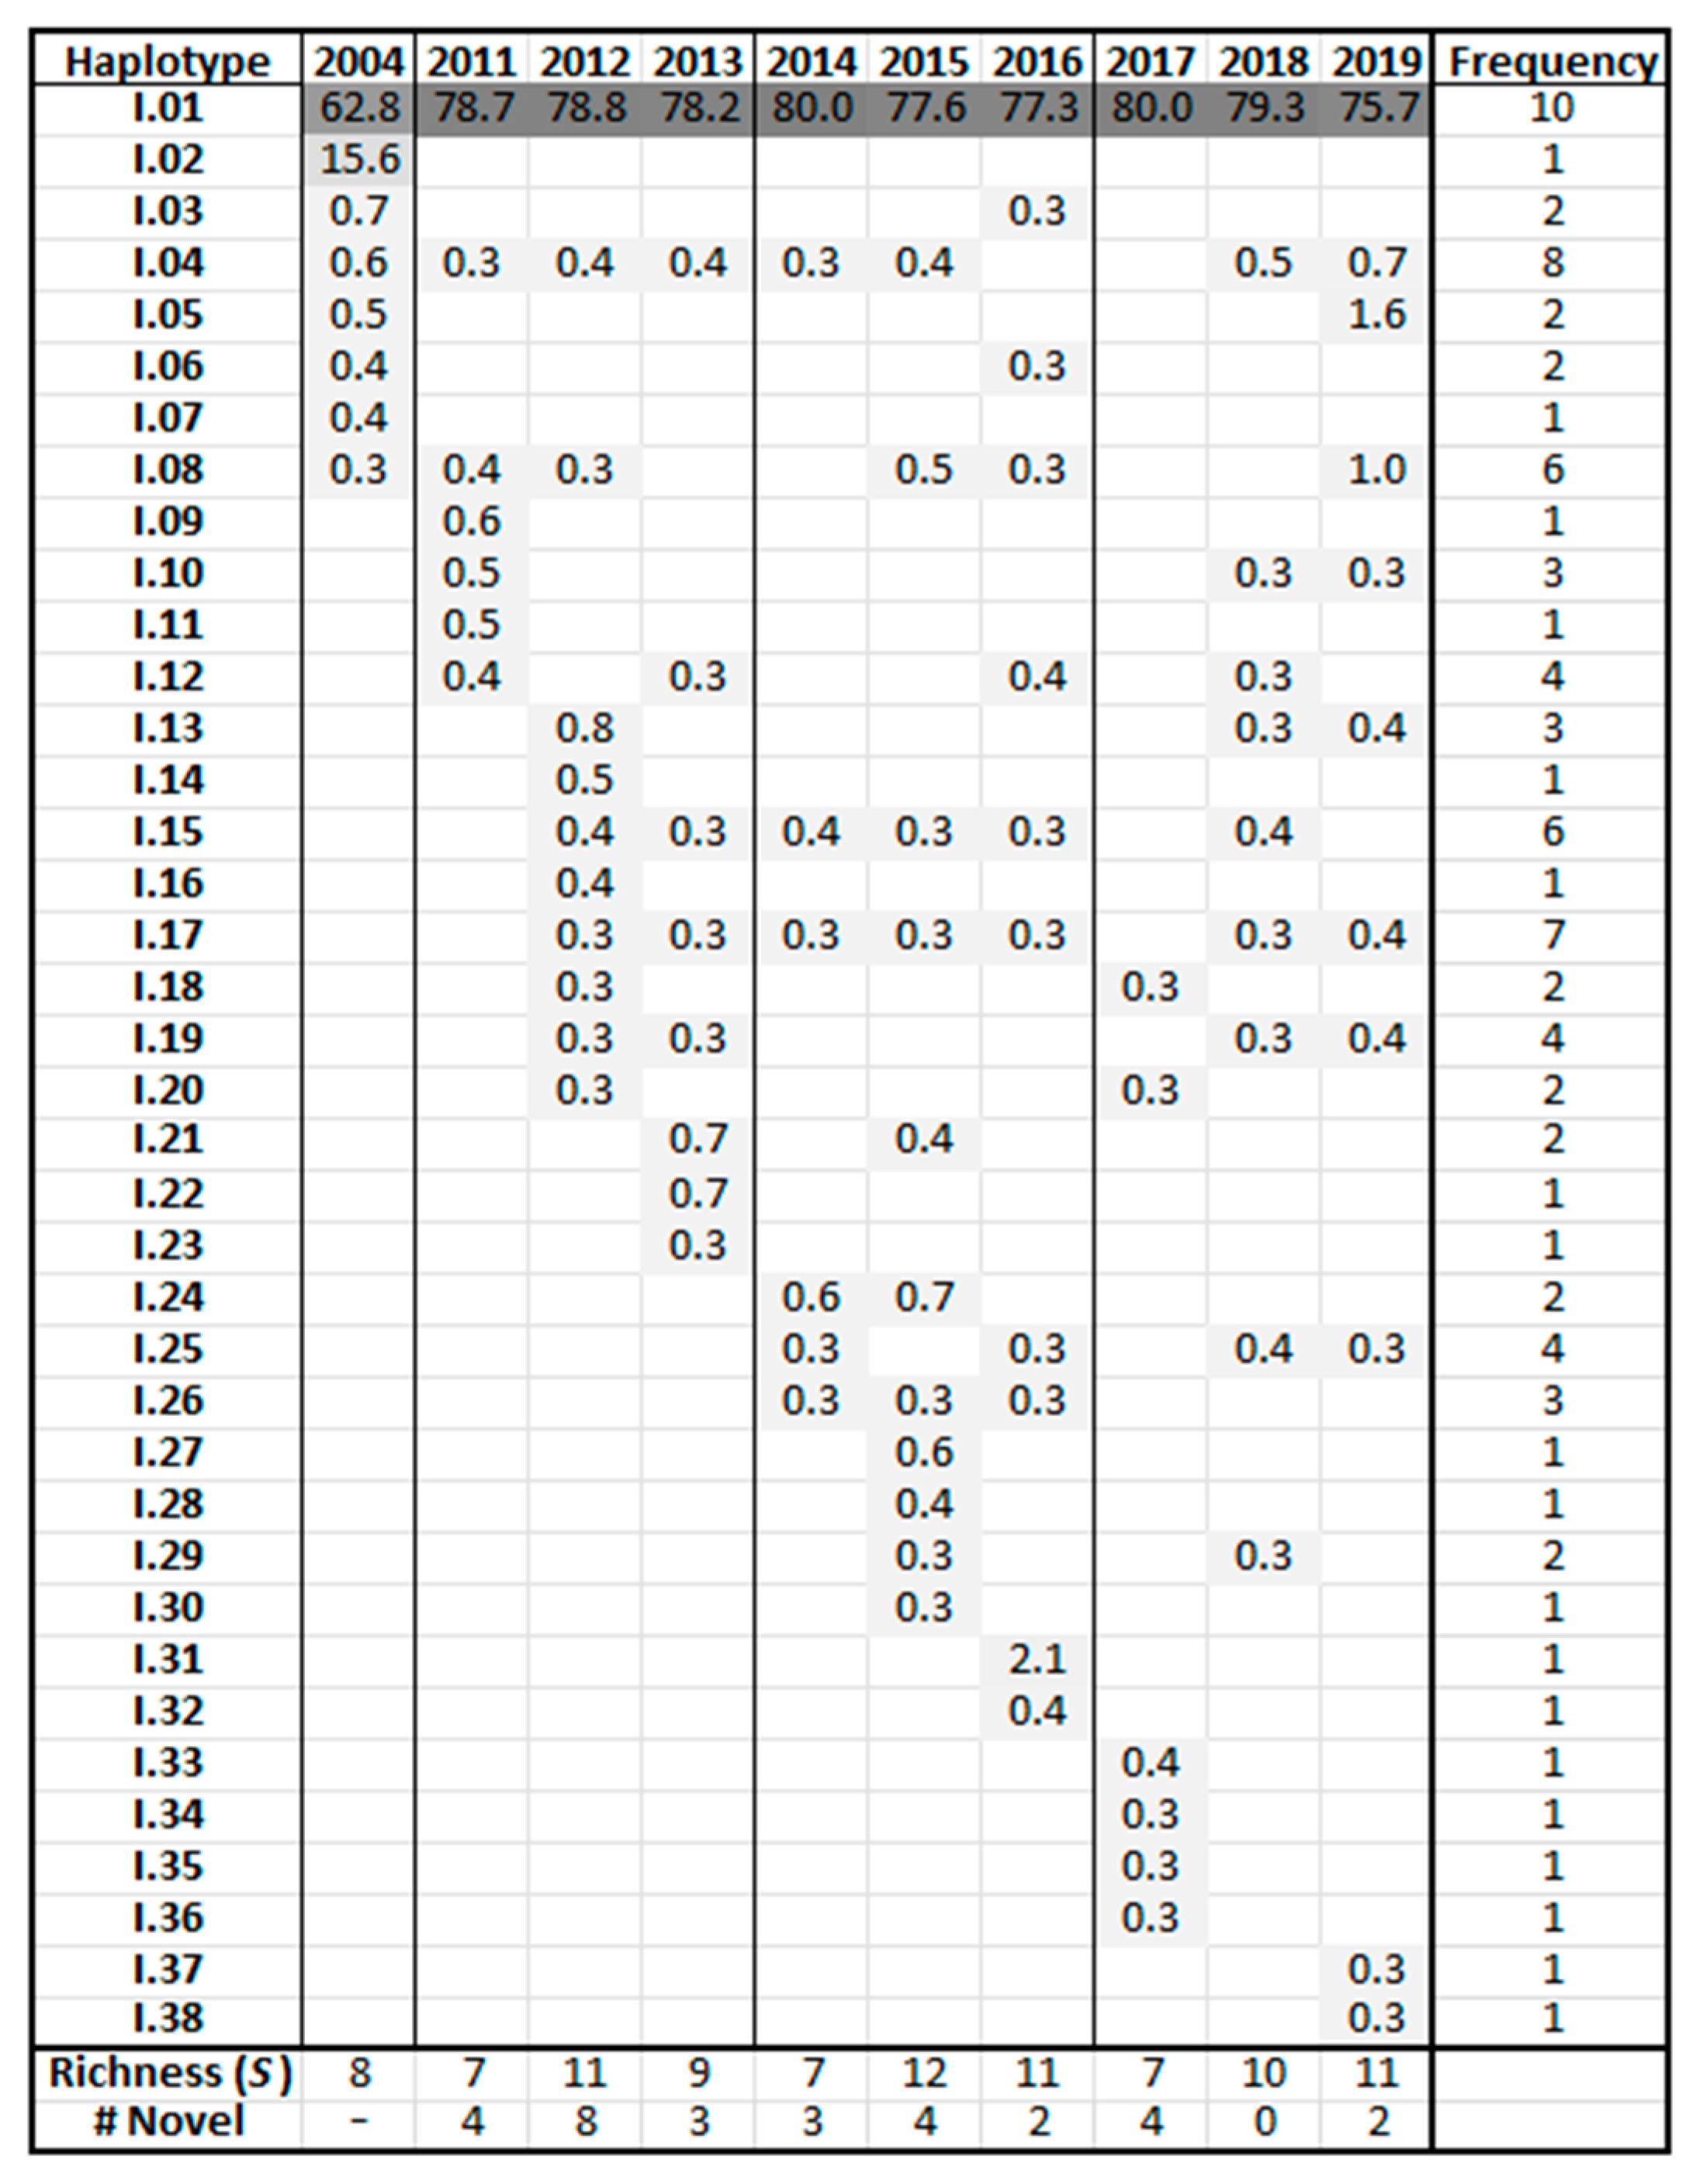
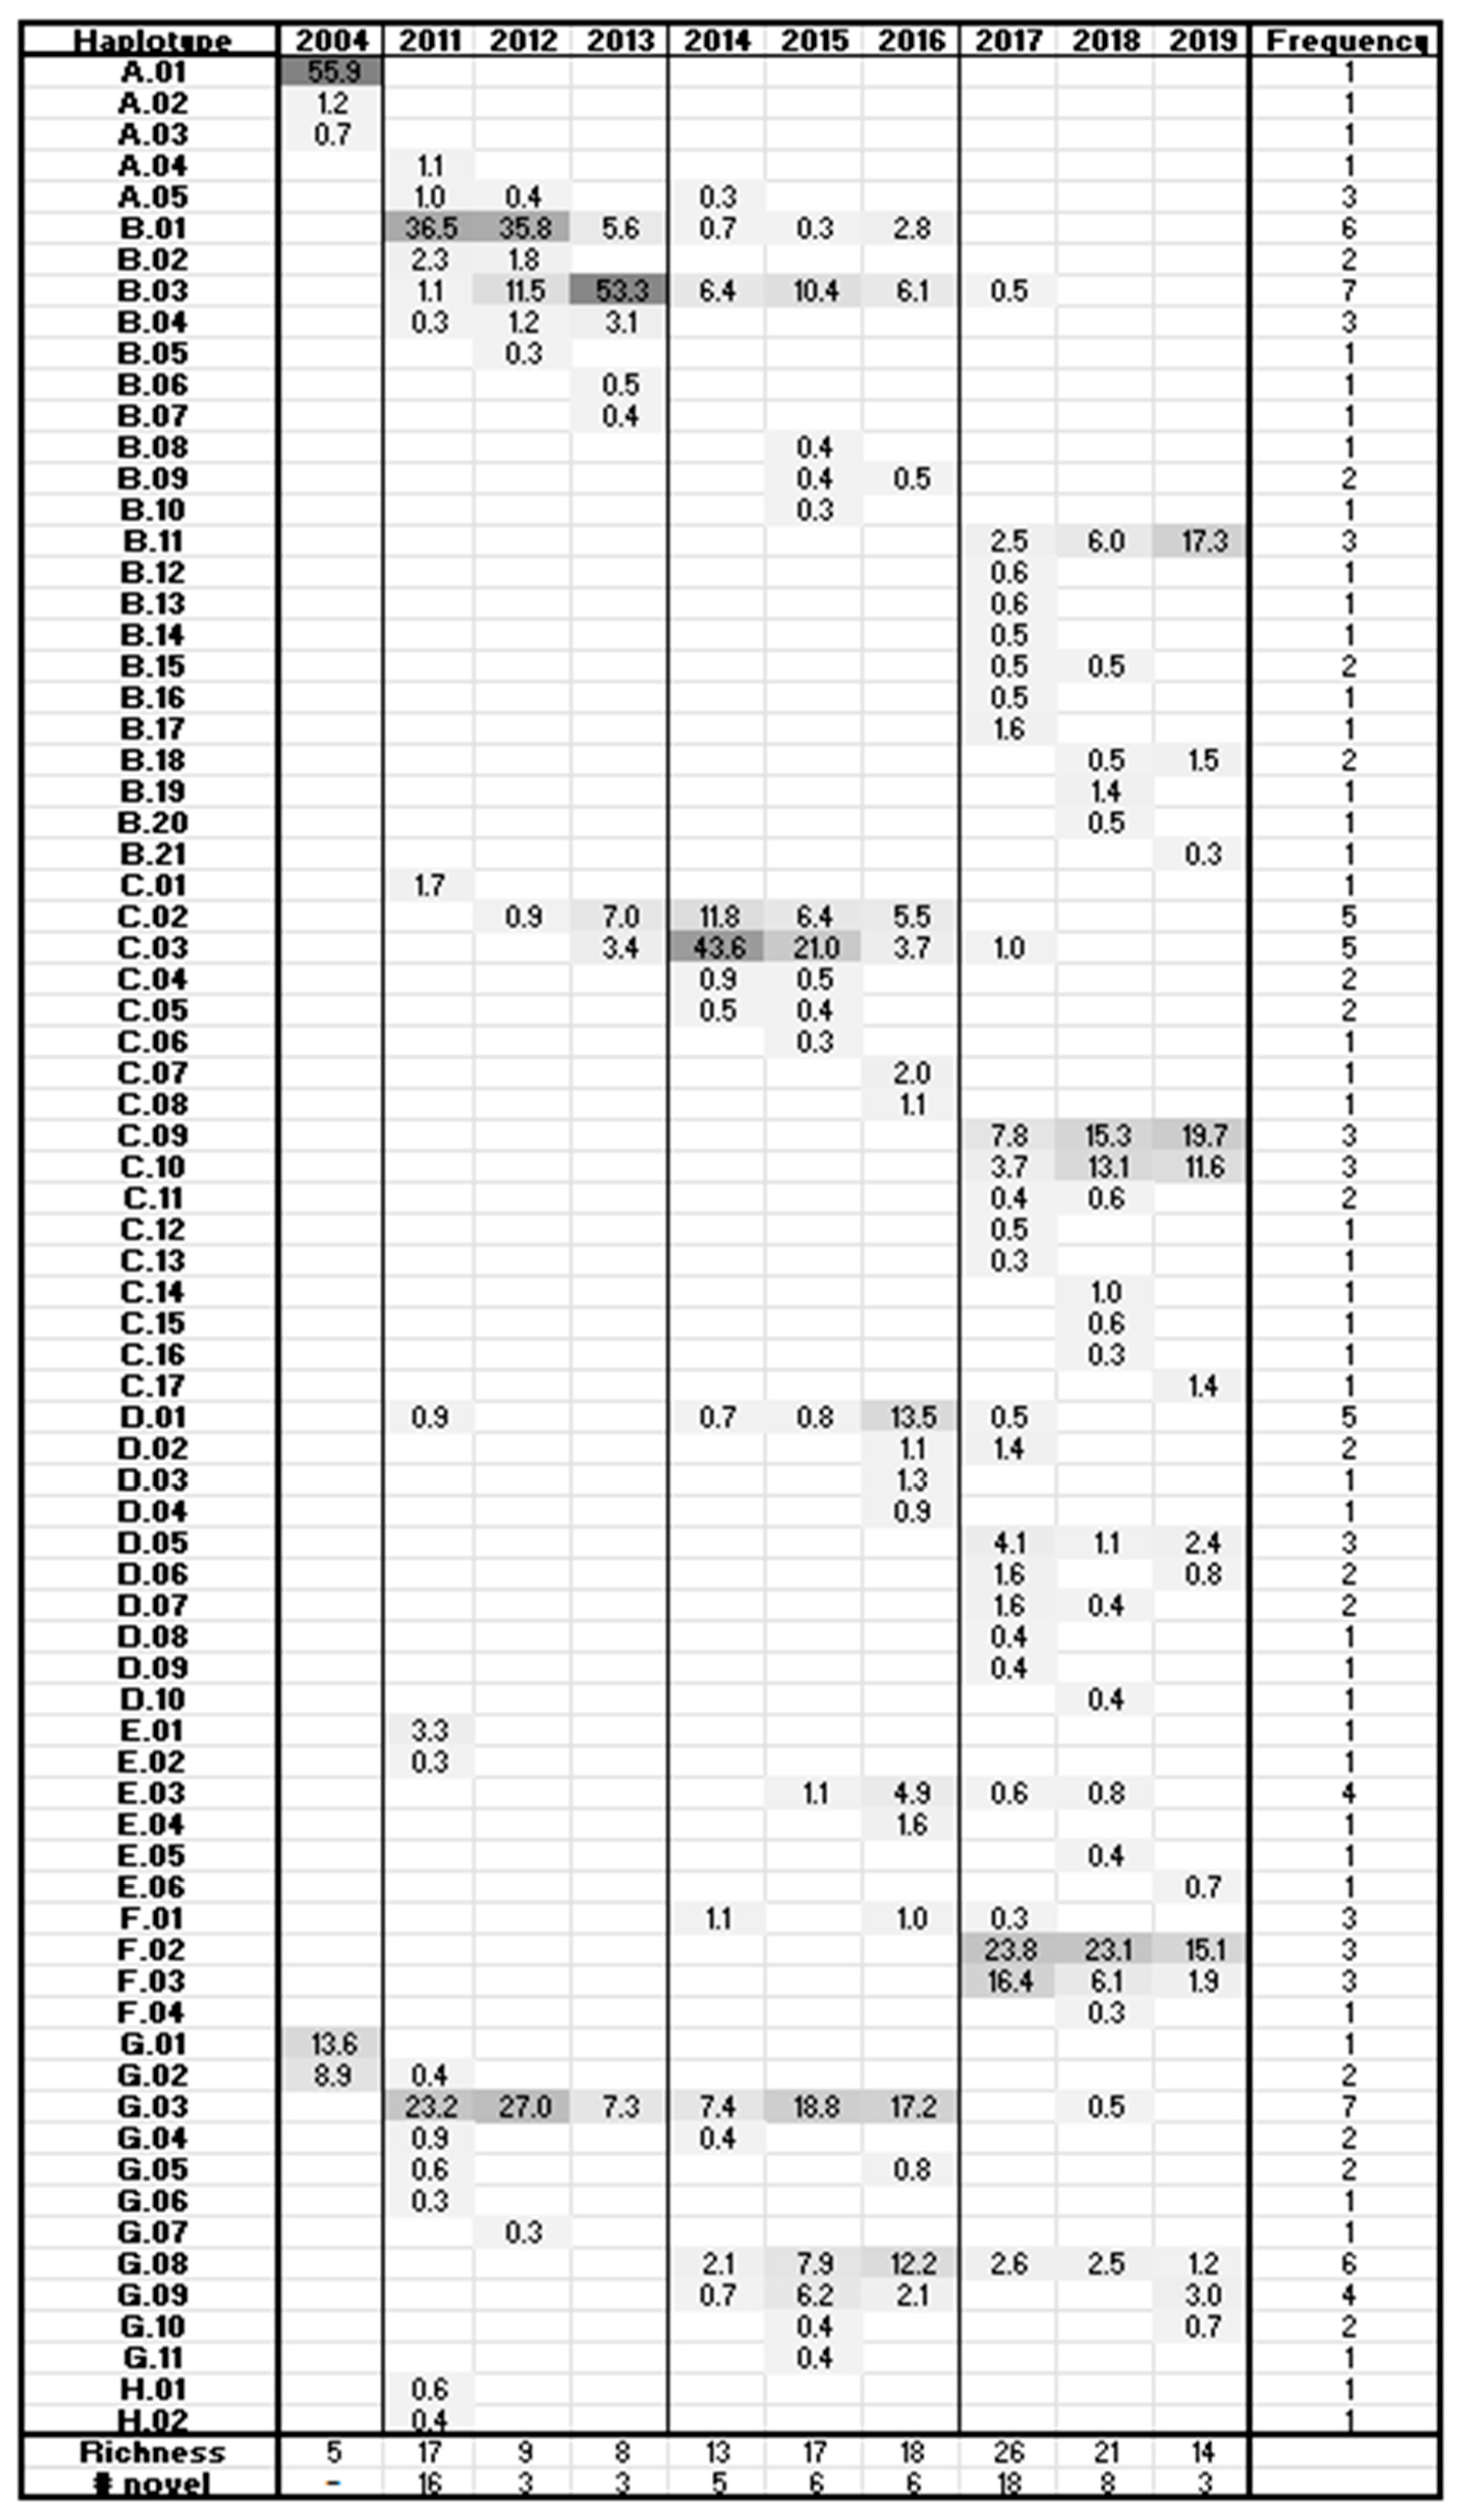
3.5. Frequency Charts
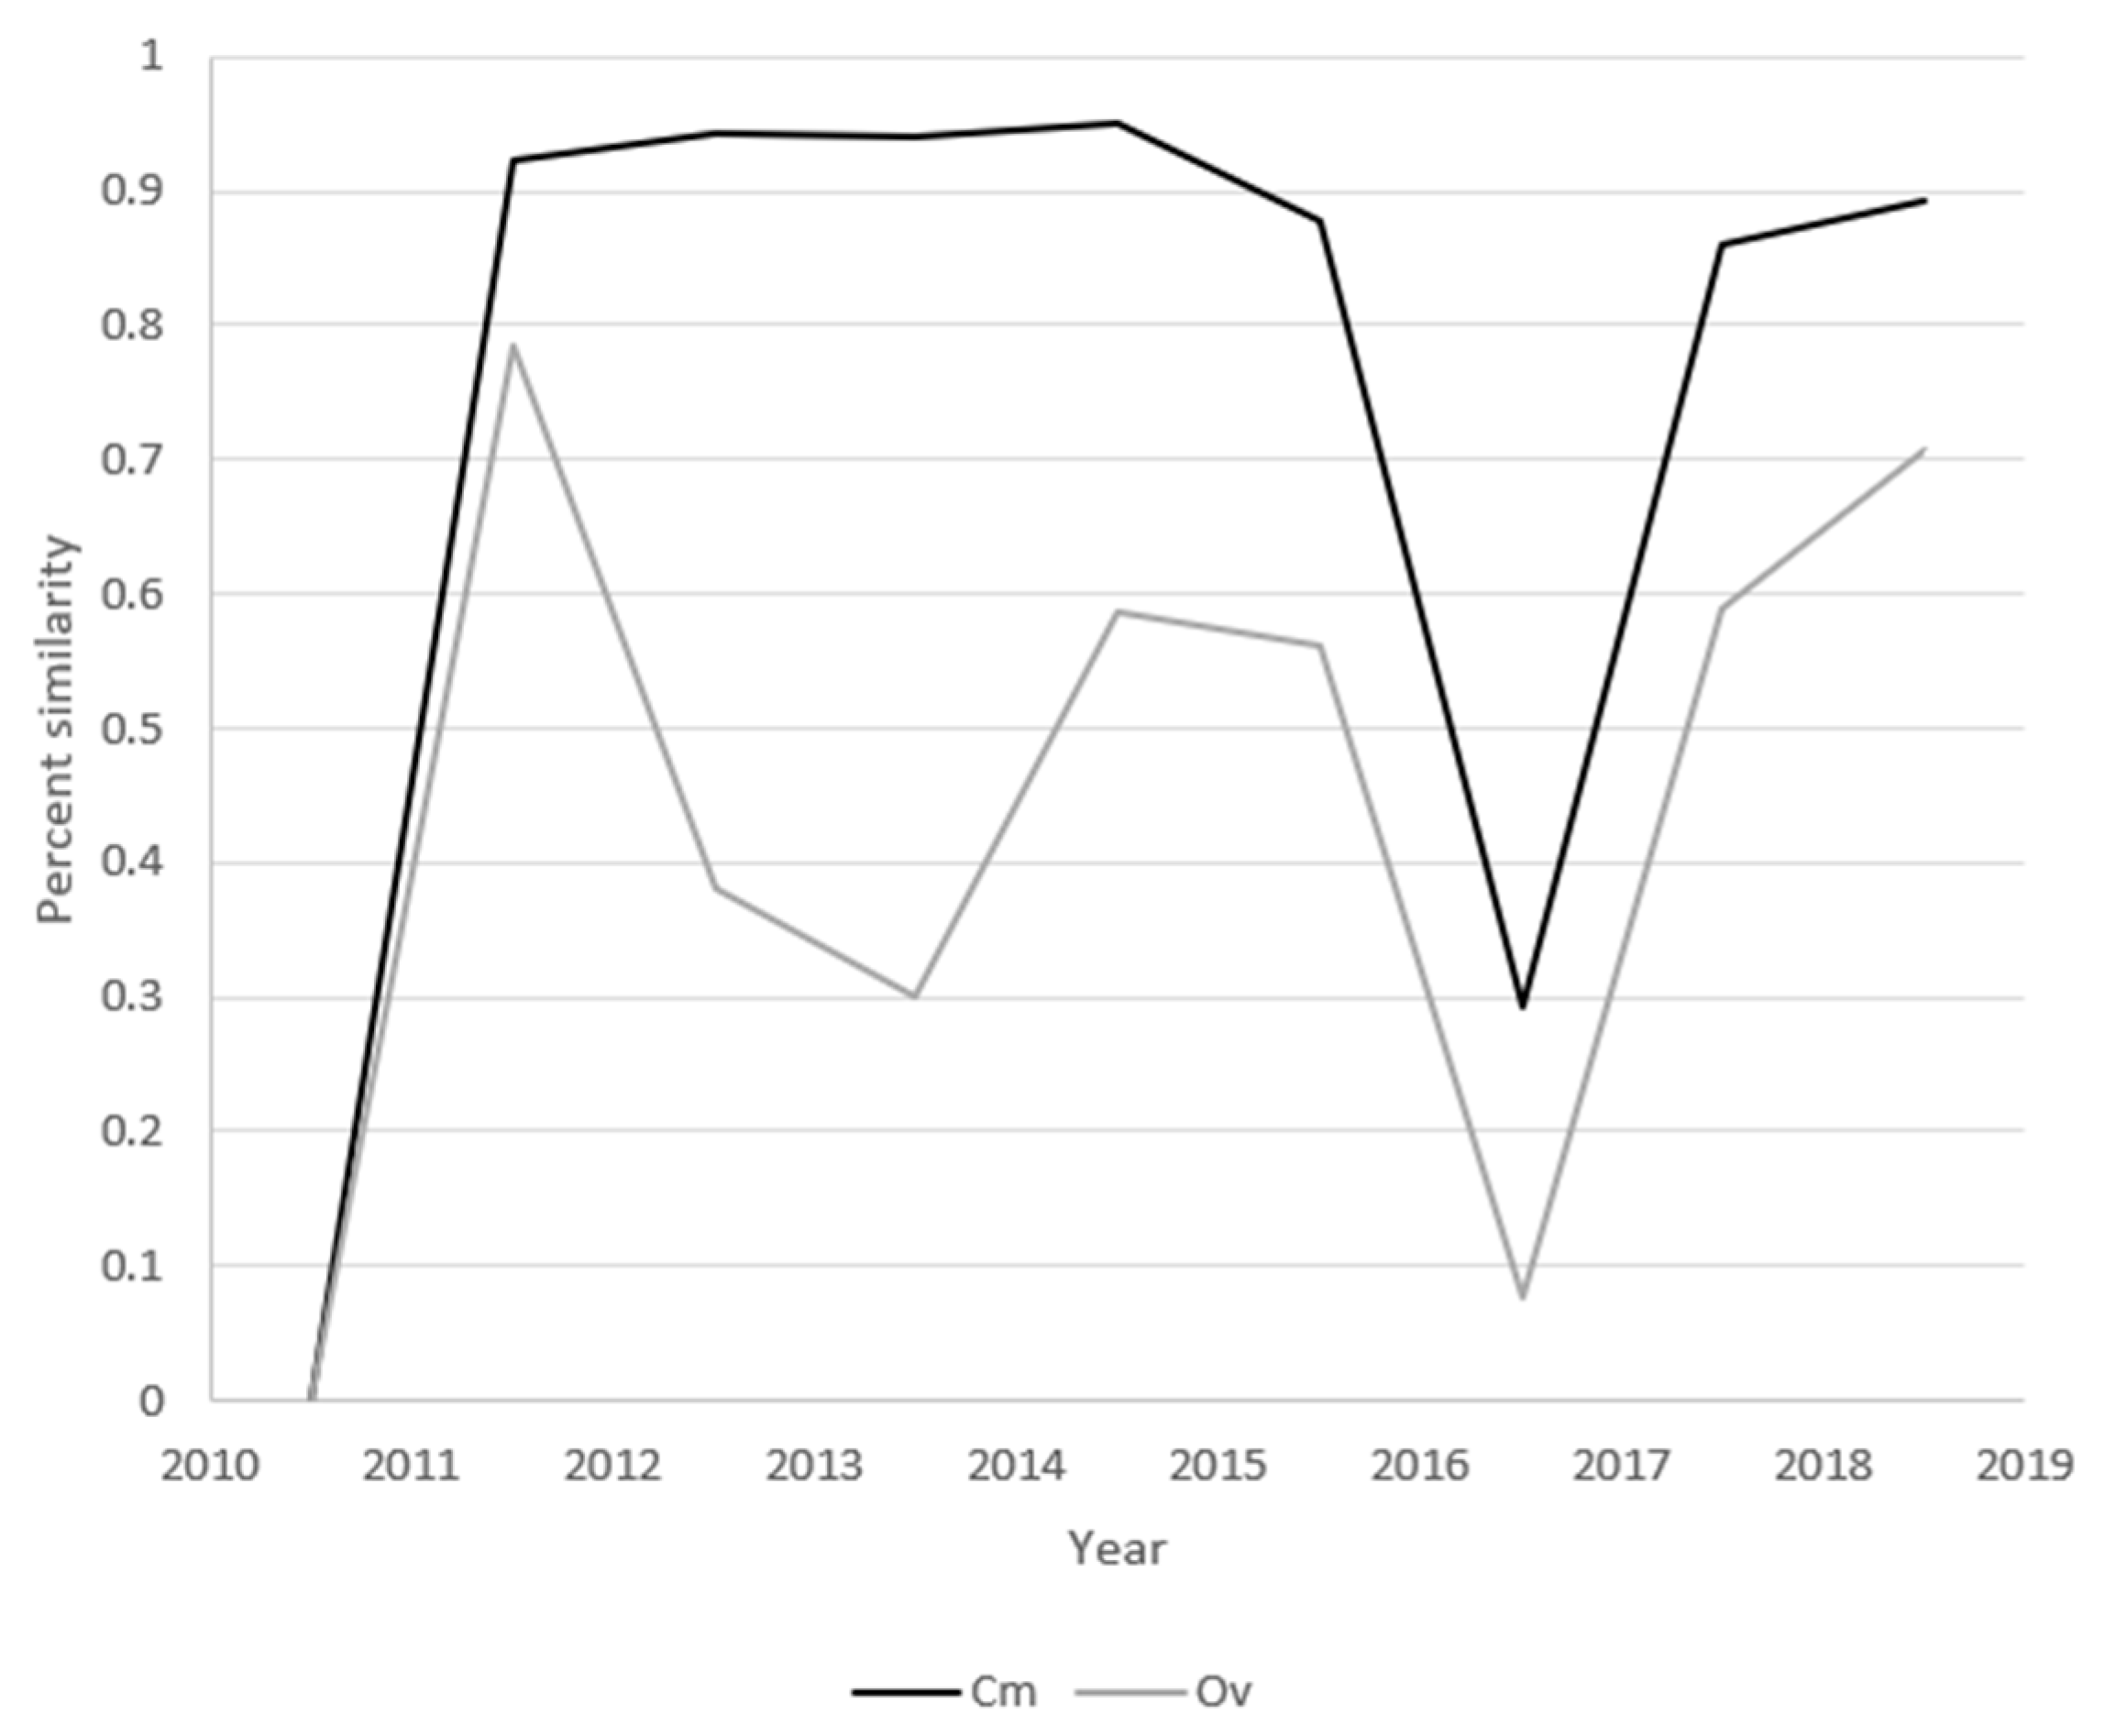
3.6. Distribution Similarities
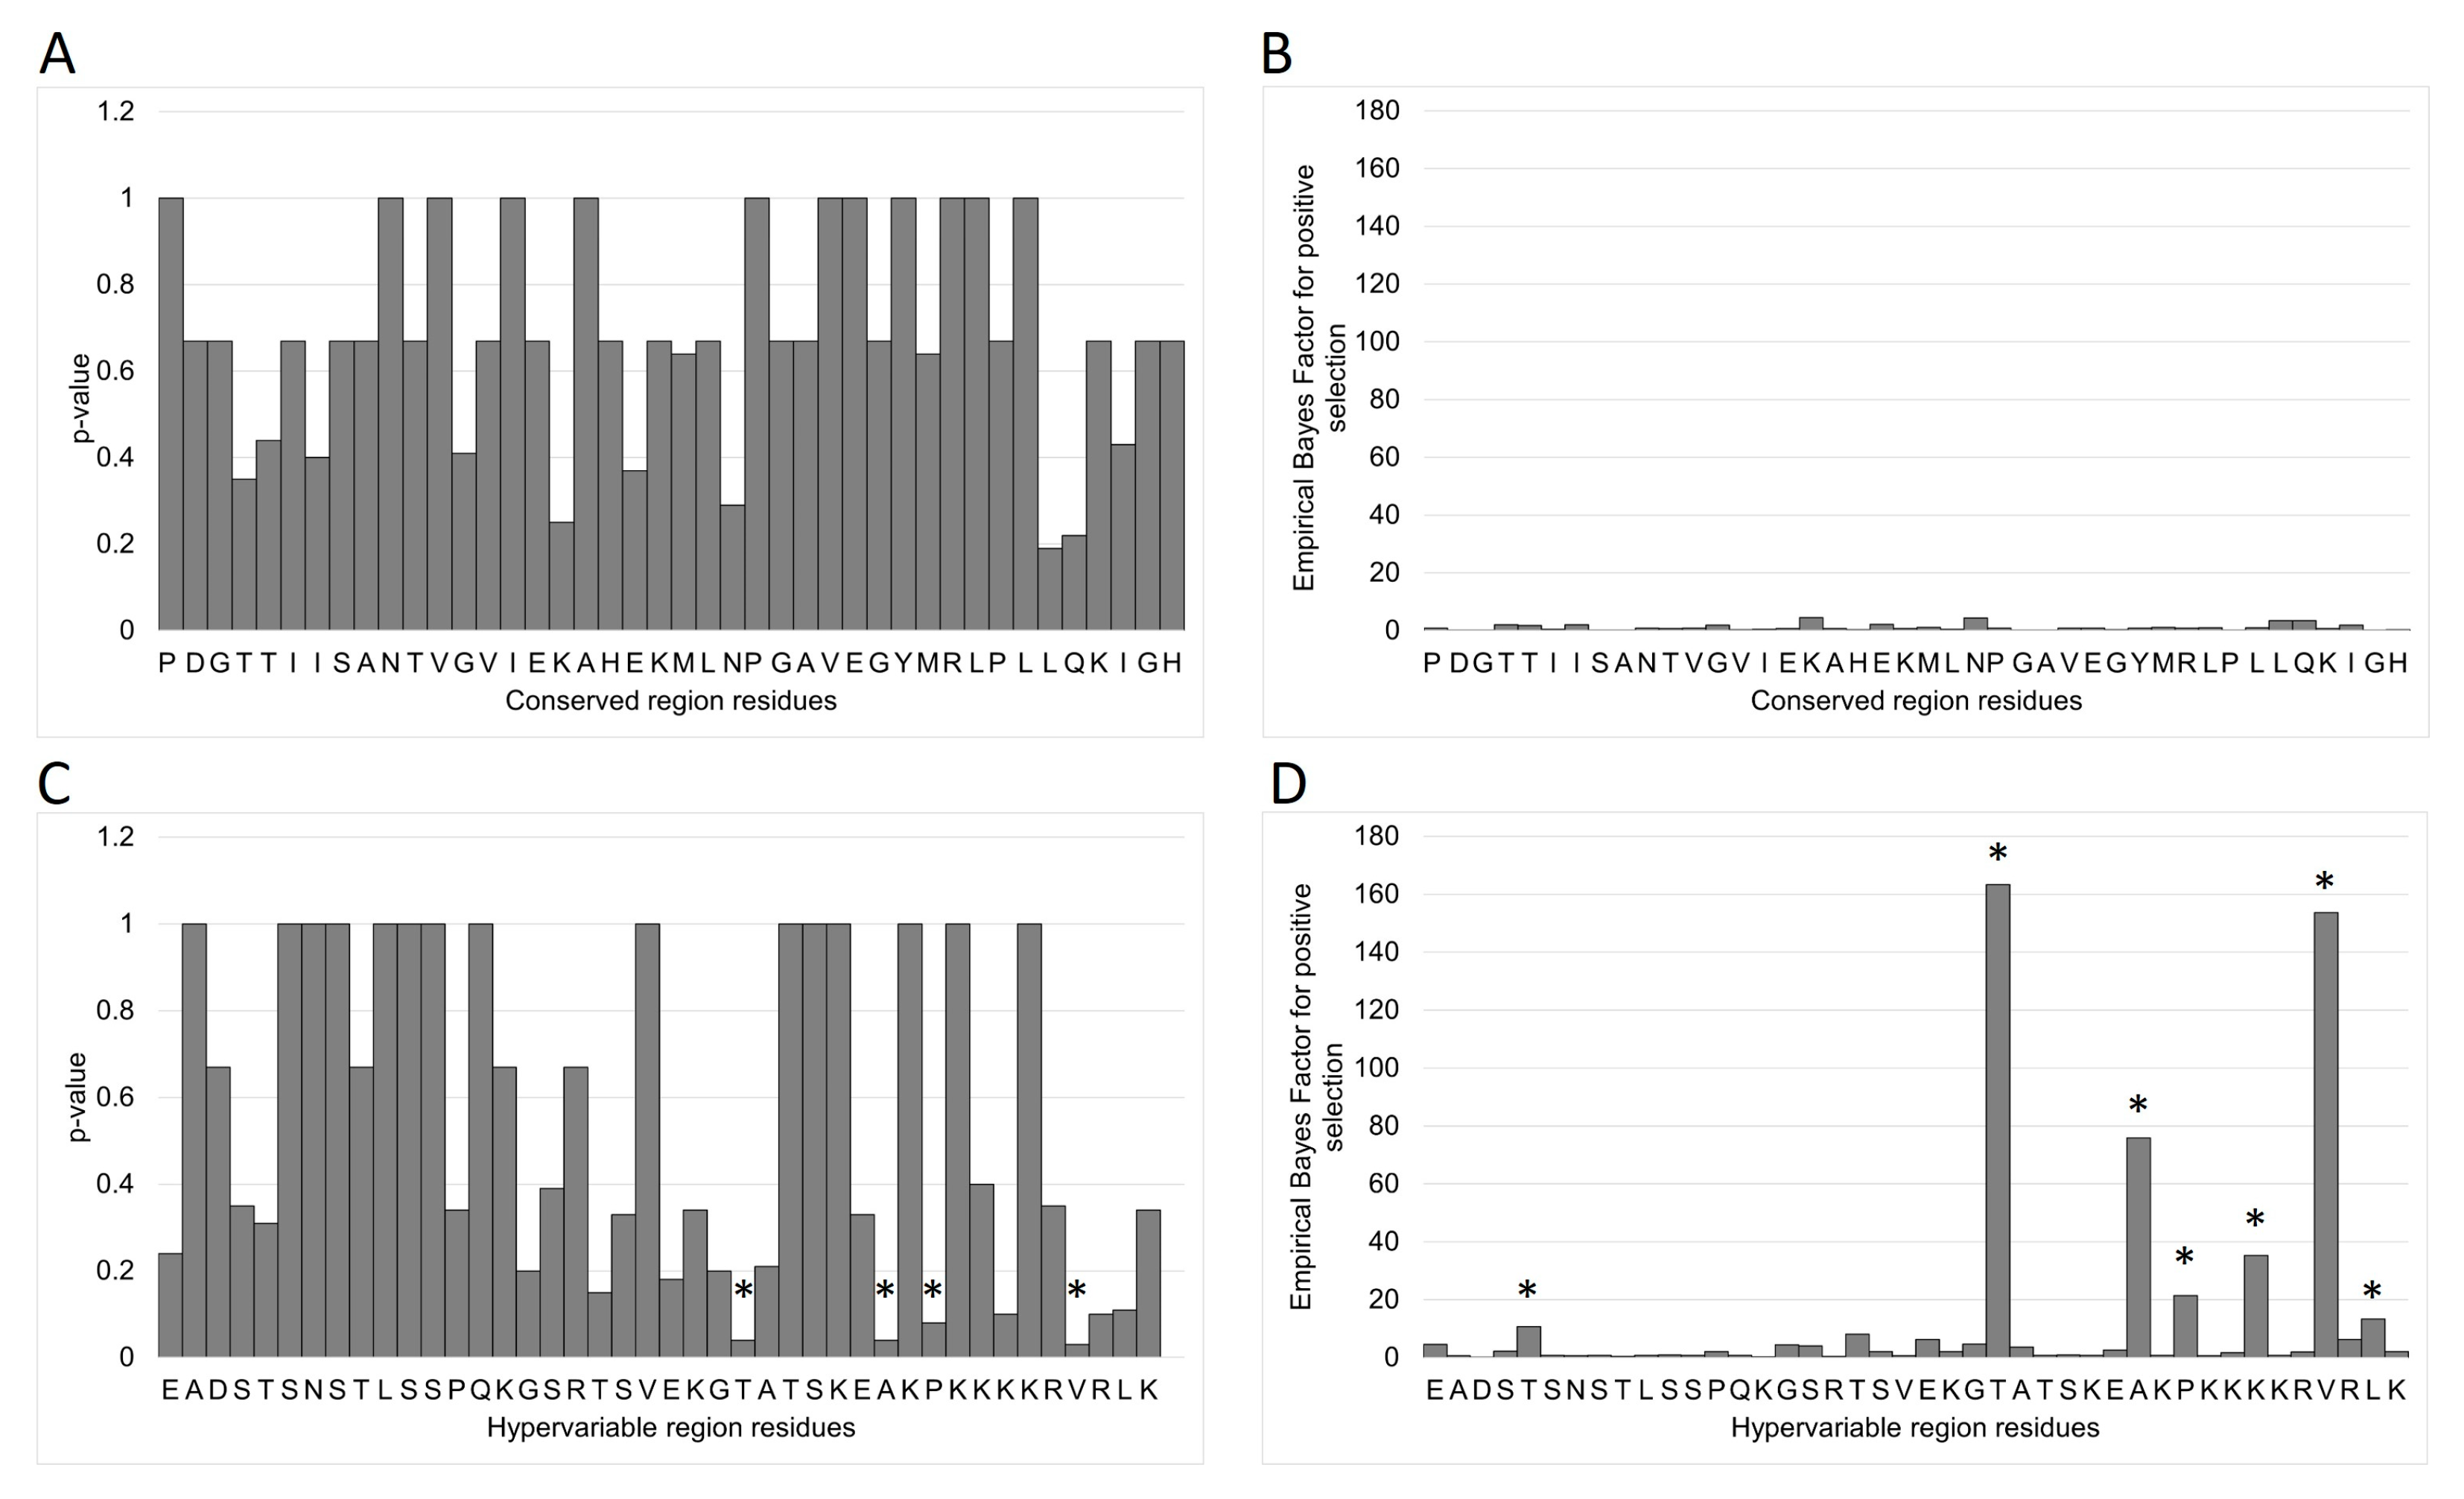
3.7. MEME/FUBAR
4. Discussion
Supplementary Materials
Funding
Institutional Review Board Statement
Informed Consent Statement
Data Availability Statement
Acknowledgments
Conflicts of Interest
References
- Theiler, A. Acute liver-atrophy and parenchymatus hepatitis in horses. In 5th and 6th Reports of the Director of Veterinary Research; Dept. of Agriculture, Union of South Africa: Pretoria, South Africa, 1918; pp. 7–164. [Google Scholar]
- Ramsauer, A.S.; Badenhorst, M.; Cavalleri, J.V. Equine Parvovirus Hepatitis. Equine Vet. J. 2021, 53, 886–894. [Google Scholar] [CrossRef]
- Divers, T.J.; Tennant, B.C.; Kumar, A.; McDonough, S.; Cullen, J.; Bhuva, N.; Jain, K.; Chauhan, L.S.; Scheel, T.K.H.; Lipkin, W.I.; et al. New Parvovirus Associated with Serum Hepatitis in Horses after Inoculation of Common Biological Product. Emerg. Infect. Dis. 2018, 24, 303–310. [Google Scholar] [CrossRef] [PubMed]
- Tomlinson, J.E.; Zan de Walle, G.R.; Divers, T.J. What Do We Know About Hepatitis Viruses in Horses? Vet. Clin. N. Am. Equine Pract. 2019, 35, 351–362. [Google Scholar] [CrossRef]
- Tomlinson, J.E.; Kapoor, A.; Kumar, A.; Tennant, B.C.; Laverack, M.A.; Beard, L.; Delph, K.; Davis, E.; Schott Ii, H.; Lascola, K.; et al. Viral testing of 18 consecutive cases of equine serum hepatitis: A prospective study (2014–2018). J. Vet. Intern. Med. 2018, 33, 251–257. [Google Scholar] [CrossRef] [PubMed]
- Tomlinson, J.E.; Tennant, B.C.; Struzyna, A.; Mrad, D.; Browne, N.; Whelchel, D.; Johnson, P.J.; Jamieson, C.; Lohr, C.V.; Bildfell, R.; et al. Viral testing of 10 cases of Theiler’s disease and 37 in-contact horses in the absence of equine biologic product administration: A prospective study (2014–2018). J. Vet. Intern. Med. 2018, 33, 258–265. [Google Scholar] [CrossRef] [PubMed]
- Jager, M.C.; Choi, E.; Tomlinson, J.E.; Van de Walle, G. Naturally acquired equine parvovirus-hepatitis is associated with a wide range of hepatic lesions in horses. Vet. Pathol. 2023, 61, 442–452. [Google Scholar] [CrossRef]
- Baird, J.; Tegtmeyer, B.; Arroyo, L.; Stang, A.; Bruggemann, Y.; Hazlett, M.; Steinmann, E. The association of Equine Parvovirus-Hepatitis (EqPV-H) with cases of non-biologic-associated Theiler’s disease on a farm in Ontario, Canada. Vet. Microbiol. 2020, 242, 108575. [Google Scholar] [CrossRef]
- Mietzsch, M.; Penzes, J.J.; Agbandje-McKenna, M. Twenty-Five Years of Structural Parvovirology. Viruses 2019, 11, 362. [Google Scholar] [CrossRef]
- Ros, C.; Gerber, M.; Kempf, C. Conformational changes in the VP1-unique region of native human parvovirus B19 lead to exposure of internal sequences that play a role in virus neutralization and infectivity. J. Virol. 2006, 80, 12017–12024. [Google Scholar] [CrossRef]
- Lakshmanan, R.V.; Hull, J.A.; Berry, L.; Burg, M.; Bothner, B.; McKenna, R.; Agbandje-McKenna, M. Structural Dynamics and Activity of B19V VP1u during the pHs of Cell Entry and Endosomal Trafficking. Viruses 2022, 14, 1922. [Google Scholar] [CrossRef]
- Ros, C.; Bieri, J.; Leisi, R. The VP1u of Human Parvovirus B19: A Multifunctional Capsid Protein with Biotechnological Applications. Viruses 2020, 12, 1463. [Google Scholar] [CrossRef]
- Domingo, E.; Sabo, D.; Taniguchi, T.; Weissmann, C. Nucleotide sequence heterogeneity of an RNA phage population. Cell 1978, 13, 735–744. [Google Scholar] [CrossRef] [PubMed]
- Domingo, E.; Soria, M.E.; Gallego, I.; de Avila, A.I.; Garcia-Crespo, C.; Martinez-Gonzalez, B.; Gomez, J.; Briones, C.; Gregori, J.; Quer, J.; et al. A new implication of quasispecies dynamics: Broad virus diversification in absence of external perturbations. Infect. Genet. Evol. 2020, 82, 104278. [Google Scholar] [CrossRef] [PubMed]
- Duffy, S.; Shackelton, L.A.; Holmes, E.C. Rates of evolutionary change in viruses: Patterns and determinants. Nat. Rev. Genet. 2008, 9, 267–276. [Google Scholar] [CrossRef] [PubMed]
- Li, C.; Candotti, D.; Allain, J.P. Production and characterization of monoclonal antibodies specific for a conserved epitope within hepatitis C virus hypervariable region 1. J. Virol. 2001, 75, 12412–12420. [Google Scholar] [CrossRef]
- Hijikata, M.; Kato, N.; Ootsuyama, Y.; Nakagawa, M.; Ohkoshi, S.; Shimotohno, K. Hypervariable regions in the putative glycoprotein of hepatitis C virus. Biochem. Biophys. Res. Commun. 1991, 175, 220–228. [Google Scholar] [CrossRef]
- Martell, M.; Esteban, J.I.; Quer, J.; Genesca, J.; Weiner, A.; Esteban, R.; Guardia, J.; Gomez, J. Hepatitis C virus (HCV) circulates as a population of different but closely related genomes: Quasispecies nature of HCV genome distribution. J. Virol. 1992, 66, 3225–3229. [Google Scholar] [CrossRef]
- Higashi, Y.; Kakumu, S.; Yoshioka, K.; Wakita, T.; Mizokami, M.; Ohba, K.; Ito, Y.; Ishikawa, T.; Takayanagi, M.; Nagai, Y. Dynamics of genome change in the E2/NS1 region of hepatitis C virus in vivo. Virology 1993, 197, 659–668. [Google Scholar] [CrossRef]
- Eigen, M.; Schuster, P. The hypercycle. A principle of natural self-organization. Naturwissenschaften 1978, 65, 7–41. [Google Scholar] [CrossRef]
- Epstein, I.R.; Eigen, M. Selection and self-organization of self-reproducing macromolecules under the constraint of constant flux. Biophys. Chem. 1979, 10, 153–160. [Google Scholar] [CrossRef]
- Lu, G.; Wu, L.; Ou, J.; Li, S. Equine Parvovirus-Hepatitis in China: Characterization of Its Genetic Diversity and Evidence for Natural Recombination Events Between the Chinese and American Strains. Front. Vet. Sci. 2020, 7, 121. [Google Scholar] [CrossRef] [PubMed]
- Lu, G.; Sun, L.; Ou, J.; Xu, H.; Wu, L.; Li, S. Identification and genetic characterization of a novel parvovirus associated with serum hepatitis in horses in China. Emerg. Microbes Infect. 2018, 7, 170. [Google Scholar] [CrossRef] [PubMed]
- Yoon, J.; Park, T.; Kim, A.; Song, H.; Park, B.J.; Ahn, H.S.; Go, H.J.; Kim, D.H.; Lee, J.B.; Park, S.Y.; et al. First report of equine parvovirus-hepatitis and equine hepacivirus coinfection in horses in Korea. Transbound. Emerg. Dis. 2022, 69, 2735–2746. [Google Scholar] [CrossRef] [PubMed]
- Vengust, M.; Jager, M.C.; Zalig, V.; Cociancich, V.; Laverack, M.; Renshaw, R.W.; Dubovi, E.; Tomlinson, J.E.; Van de Walle, G.R.; Divers, T.J. First report of equine parvovirus-hepatitis-associated Theiler’s disease in Europe. Equine Vet. J. 2020, 52, 841–847. [Google Scholar] [CrossRef]
- Stamenkovic, G.G.; Cirkovic, V.S.; Siljic, M.M.; Blagojevic, J.V.; Knezevic, A.M.; Joksic, I.D.; Stanojevic, M.P. Substitution rate and natural selection in parvovirus B19. Sci. Rep. 2016, 6, 35759. [Google Scholar] [CrossRef]
- Shackelton, L.A.; Parrish, C.R.; Truyen, U.; Holmes, E.C. High rate of viral evolution associated with the emergence of carnivore parvovirus. Proc. Natl. Acad. Sci. USA 2005, 102, 379–384. [Google Scholar] [CrossRef]
- Gregori, J.; Rodriguez-Frias, F.; Quer, J. Viral Quasispecies Diversity and Evolution. A Bioinformatics Molecular Approach; Il Pensiero Scientifico Editore: Rome, Italy, 2023. [Google Scholar]
- Domingo, E. Quasispecies: From Theory to Experimental Systems; Springer: Cham, Switzerland, 2016; Volume 392, p. 360. [Google Scholar]
- Kariuki, S.M.; Selhorst, P.; Arien, K.K.; Dorfman, J.R. The HIV-1 transmission bottleneck. Retrovirology 2017, 14, 22. [Google Scholar] [CrossRef]
- Wang, G.P.; Sherrill-Mix, S.A.; Chang, K.M.; Quince, C.; Bushman, F.D. Hepatitis C virus transmission bottlenecks analyzed by deep sequencing. J. Virol. 2010, 84, 6218–6228. [Google Scholar] [CrossRef]
- Escarmis, C.; Lazaro, E.; Manrubia, S.C. Population bottlenecks in quasispecies dynamics. Curr. Top. Microbiol. Immunol. 2006, 299, 141–170. [Google Scholar]
- Lahner, E.; Brigatti, C.; Marzinotto, I.; Carabotti, M.; Scalese, G.; Davidson, H.W.; Wenzlau, J.M.; Bosi, E.; Piemonti, L.; Annibale, B.; et al. Luminescent Immunoprecipitation System (LIPS) for Detection of Autoantibodies Against ATP4A and ATP4B Subunits of Gastric Proton Pump H+,K+-ATPase in Atrophic Body Gastritis Patients. Clin. Transl. Gastroenterol. 2017, 8, e215. [Google Scholar] [CrossRef]
- Burbelo, P.D.; Goldman, R.; Mattson, T.L. A simplified immunoprecipitation method for quantitatively measuring antibody responses in clinical sera samples by using mammalian-produced Renilla luciferase-antigen fusion proteins. BMC Biotechnol. 2005, 5, 22. [Google Scholar] [CrossRef]
- Lahner, E.; Marzinotto, I.; Brigatti, C.; Davidson, H.; Wenzlau, J.; Piemonti, L.; Annibale, B.; Lampasona, V. Measurement of Autoantibodies to Gastric H+,K+-ATPase (ATP4A/B) Using a Luciferase Immunoprecipitation System (LIPS). Methods Mol. Biol. 2019, 1901, 113–131. [Google Scholar]
- Scupham, A.J.; Tong, C. Detection of Equine parvovirus-hepatitis and efficacy of governmental regulation for equine biologics purity. J. Vet. Diagn. Investig. 2024, 37, 79–85. [Google Scholar] [CrossRef] [PubMed]
- Bushnell, B.; Rood, J.; Singer, E. BBMerge—Accurate paired shotgun read merging via overlap. PLoS ONE 2017, 12, e0185056. [Google Scholar] [CrossRef]
- Katoh, K.; Misawa, K.; Kuma, K.; Miyata, T. MAFFT: A novel method for rapid multiple sequence alignment based on fast Fourier transform. Nucleic Acids Res. 2002, 30, 3059–3066. [Google Scholar] [CrossRef] [PubMed]
- Stamatakis, A. RAxML version 8: A tool for phylogenetic analysis and post-analysis of large phylogenies. Bioinformatics 2014, 30, 1312–1313. [Google Scholar] [CrossRef] [PubMed]
- Pielou, E.C. The measurement of diversity in different types of biological collectio. J. Theor. Biol. 1966, 13, 131–144. [Google Scholar] [CrossRef]
- Gregori, J.; Perales, C.; Rodriguez-Frias, F.; Esteban, J.I.; Quer, J.; Domingo, E. Viral quasispecies complexity measures. Virology 2016, 493, 227–237. [Google Scholar] [CrossRef]
- Ramirez, C.; Gregori, J.; Buti, M.; Tabernero, D.; Camos, S.; Casillas, R.; Quer, J.; Esteban, R.; Homs, M.; Rodriguez-Frias, F. A comparative study of ultra-deep pyrosequencing and cloning to quantitatively analyze the viral quasispecies using hepatitis B virus infection as a model. Antivir. Res. 2013, 98, 273–283. [Google Scholar] [CrossRef]
- Murrell, B.; Moola, S.; Mabona, A.; Weighill, T.; Sheward, D.; Kosakovsky Pond, S.L.; Scheffler, K. FUBAR: A fast, unconstrained bayesian approximation for inferring selection. Mol. Biol. Evol. 2013, 30, 1196–1205. [Google Scholar] [CrossRef]
- Murrell, B.; Wertheim, J.O.; Moola, S.; Weighill, T.; Scheffler, K.; Kosakovsky Pond, S.L. Detecting individual sites subject to episodic diversifying selection. PLoS Genet. 2012, 8, e1002764. [Google Scholar] [CrossRef] [PubMed]
- Gregori, J.; Ibanez-Lligona, M.; Quer, J. Quantifying In-Host Quasispecies Evolution. Int. J. Mol. Sci. 2023, 24, 1301. [Google Scholar] [CrossRef]
- Xie, Q.; Chapman, M.S. Canine parvovirus capsid structure, analyzed at 2.9 A resolution. J. Mol. Biol. 1996, 264, 497–520. [Google Scholar] [CrossRef] [PubMed]
- Venkatakrishnan, B.; Yarbrough, J.; Domsic, J.; Bennett, A.; Bothner, B.; Kozyreva, O.G.; Samulski, R.J.; Muzyczka, N.; McKenna, R.; Agbandje-McKenna, M. Structure and dynamics of adeno-associated virus serotype 1 VP1-unique N-terminal domain and its role in capsid trafficking. J. Virol. 2013, 87, 4974–4984. [Google Scholar] [CrossRef]
- Zadori, Z.; Szelei, J.; Lacoste, M.C.; Li, Y.; Gariepy, S.; Raymond, P.; Allaire, M.; Nabi, I.R.; Tijssen, P. A viral phospholipase A2 is required for parvovirus infectivity. Dev. Cell 2001, 1, 291–302. [Google Scholar] [CrossRef] [PubMed]
- Carter, B.J. Variant and Defective Interfering Parvoviruses. In The Parvoviruses; Berns, K.I., Ed.; Springer: Boston, MA, USA, 1984. [Google Scholar]
- Battilani, M.; Balboni, A.; Ustulin, M.; Giunti, M.; Scagliarini, A.; Prosperi, S. Genetic complexity and multiple infections with more Parvovirus species in naturally infected cats. Vet. Res. 2011, 42, 43. [Google Scholar] [CrossRef]
- Battilani, M.; Scagliarini, A.; Ciulli, S.; Morganti, L.; Prosperi, S. High genetic diversity of the VP2 gene of a canine parvovirus strain detected in a domestic cat. Virology 2006, 352, 22–26. [Google Scholar] [CrossRef]
- Domingo, E. Quasispecies: Concepts and Implications for Virology; Springer: New York, NY, USA, 2006. [Google Scholar]
- Woo, H.J.; Reifman, J. A quantitative quasispecies theory-based model of virus escape mutation under immune selection. Proc. Natl. Acad. Sci. USA 2012, 109, 12980–12985. [Google Scholar] [CrossRef]
- Lange, A.; Mills, R.E.; Lange, C.J.; Stewart, M.; Devine, S.E.; Corbett, A.H. Classical nuclear localization signals: Definition, function, and interaction with importin alpha. J. Biol. Chem. 2007, 282, 5101–5105. [Google Scholar] [CrossRef]
- Lu, J.; Wu, T.; Zhang, B.; Liu, S.; Song, W.; Qiao, J.; Ruan, H. Types of nuclear localization signals and mechanisms of protein import into the nucleus. Cell Commun. Signal. 2021, 19, 60. [Google Scholar] [CrossRef]
- Boisvert, M.; Bouchard-Levesque, V.; Fernandes, S.; Tijssen, P. Classic nuclear localization signals and a novel nuclear localization motif are required for nuclear transport of porcine parvovirus capsid proteins. J. Virol. 2014, 88, 11748–11759. [Google Scholar] [CrossRef] [PubMed]
- Liu, P.; Chen, S.; Wang, M.; Cheng, A. The role of nuclear localization signal in parvovirus life cycle. Virol. J. 2017, 14, 80. [Google Scholar] [CrossRef] [PubMed]
- Lombardo, E.; Ramirez, J.C.; Garcia, J.; Almendral, J.M. Complementary roles of multiple nuclear targeting signals in the capsid proteins of the parvovirus minute virus of mice during assembly and onset of infection. J. Virol. 2002, 76, 7049–7059. [Google Scholar] [CrossRef]
- Xie, H.L.; Wang, Z.; Cui, S.J.; Zhang, C.F.; Cui, Y.D. The epitope of the VP1 protein of porcine parvovirus. Virol. J. 2010, 7, 161. [Google Scholar] [CrossRef]
- Kattenbelt, J.A.; Stevens, M.P.; Gould, A.R. Sequence variation in the Newcastle disease virus genome. Virus Res. 2006, 116, 168–184. [Google Scholar] [CrossRef]
- Nie, Z.; Bergeron, D.; Subbramanian, R.A.; Yao, X.J.; Checroune, F.; Rougeau, N.; Cohen, E.A. The putative alpha helix 2 of human immunodeficiency virus type 1 Vpr contains a determinant which is responsible for the nuclear translocation of proviral DNA in growth-arrested cells. J. Virol. 1998, 72, 4104–4115. [Google Scholar] [CrossRef]
- Pellerin, M.; Lopez-Aguirre, Y.; Penin, F.; Dhumeaux, D.; Pawlotsky, J.M. Hepatitis C virus quasispecies variability modulates nonstructural protein 5A transcriptional activation, pointing to cellular compartmentalization of virus-host interactions. J. Virol. 2004, 78, 4617–4627. [Google Scholar] [CrossRef] [PubMed]
- Lopez de Turiso, J.A.; Cortes, E.; Ranz, A.; Garcia, J.; Sanz, A.; Vela, C.; Casal, J.I. Fine mapping of canine parvovirus B cell epitopes. J. Gen. Virol. 1991, 72 Pt 10, 2445–2456. [Google Scholar] [CrossRef]
- Saikawa, T.; Anderson, S.; Momoeda, M.; Kajigaya, S.; Young, N.S. Neutralizing linear epitopes of B19 parvovirus cluster in the VP1 unique and VP1-VP2 junction regions. J. Virol. 1993, 67, 3004–3009. [Google Scholar] [CrossRef]
- Rimmelzwaan, G.F.; Poelen, M.C.; Meloen, R.H.; Carlson, J.; UytdeHaag, F.G.; Osterhaus, A.D. Delineation of canine parvovirus T cell epitopes with peripheral blood mononuclear cells and T cell clones from immunized dogs. J. Gen. Virol. 1990, 71 Pt 10, 2321–2329. [Google Scholar] [CrossRef]
- de Souza, A.R.; Yamin, M.; Gava, D.; Zanella, J.R.C.; Gatti, M.S.V.; Bonafe, C.F.S.; de Lima Neto, D.F. Porcine parvovirus VP1/VP2 on a time series epitope mapping: Exploring the effects of high hydrostatic pressure on the immune recognition of antigens. Virol. J. 2019, 16, 75. [Google Scholar] [CrossRef] [PubMed]
- Bonsch, C.; Zuercher, C.; Lieby, P.; Kempf, C.; Ros, C. The globoside receptor triggers structural changes in the B19 virus capsid that facilitate virus internalization. J. Virol. 2010, 84, 11737–11746. [Google Scholar] [CrossRef] [PubMed]
- Kawase, M.; Momoeda, M.; Young, N.S.; Kajigaya, S. Most of the VP1 unique region of B19 parvovirus is on the capsid surface. Virology 1995, 211, 359–366. [Google Scholar] [CrossRef] [PubMed]
- Rosenfeld, S.J.; Yoshimoto, K.; Kajigaya, S.; Anderson, S.; Young, N.S.; Field, A.; Warrener, P.; Bansal, G.; Collett, M.S. Unique region of the minor capsid protein of human parvovirus B19 is exposed on the virion surface. J. Clin. Investig. 1992, 89, 2023–2029. [Google Scholar] [CrossRef]
- Kaufmann, B.; Chipman, P.R.; Kostyuchenko, V.A.; Modrow, S.; Rossmann, M.G. Visualization of the externalized VP2 N termini of infectious human parvovirus B19. J. Virol. 2008, 82, 7306–7312. [Google Scholar] [CrossRef]
- Wilke, C.O.; Wang, J.L.; Ofria, C.; Lenski, R.E.; Adami, C. Evolution of digital organisms at high mutation rates leads to survival of the flattest. Nature 2001, 412, 331–333. [Google Scholar] [CrossRef]

| Sample | Total # Reads From 2 HTS Runs | # Reads Mapped to CS Locus | # Unique Haplotypes Before Trimming | Haplotype Richness (S) | Gini–Simpson Index (GSI) | Evenness (J) |
|---|---|---|---|---|---|---|
| 2004 | 4,358,836 | 58,460 | 1835 | 8 | 0.37 | 0.34 |
| 2011 | 4,091,698 | 77,565 | 1999 | 7 | 0.06 | 0.10 |
| 2012 | 5,450,603 | 68,591 | 1758 | 11 | 0.09 | 0.13 |
| 2013 | 3,797,702 | 39,964 | 1281 | 9 | 0.08 | 0.12 |
| 2014 | 4,103,750 | 52,498 | 1359 | 7 | 0.05 | 0.09 |
| 2015 | 3,982,446 | 51,411 | 1546 | 12 | 0.11 | 0.14 |
| 2016 | 3,067,378 | 34,916 | 1176 | 11 | 0.12 | 0.15 |
| 2017 | 3,927,682 | 42,277 | 1237 | 7 | 0.05 | 0.08 |
| 2018 | 3,664,280 | 40,133 | 1214 | 10 | 0.07 | 0.11 |
| 2019 | 4,569,344 | 49,490 | 1558 | 11 | 0.13 | 0.17 |
| Total | 41,013,719 | 515,305 | NA ‡ | 38 * | NA | NA |
| Average | 4,101,372 | 51,531 | 1496 | 9 | NA | NA |
| StDev | 623,835 | 13,529 | 290 | 2 | NA | NA |
| CV | 14 | 25 | 18 | 20 | NA | NA |
| Sample | Total # Reads From 2 HTS Runs | # Reads Mapped to HV Locus | # Unique Haplotypes Before Trimming | Haplotype Richness (S) | Gini–Simpson Index (GSI) | Evenness (J) |
|---|---|---|---|---|---|---|
| 2004 | 4,358,836 | 54,232 | 1932 | 5 | 0.48 | 0.43 |
| 2011 | 4,091,698 | 61,031 | 3759 | 17 | 0.67 | 0.51 |
| 2012 | 5,450,148 | 69,370 | 2842 | 9 | 0.66 | 0.51 |
| 2013 | 3,797,702 | 43,201 | 2005 | 8 | 0.53 | 0.57 |
| 2014 | 4,103,750 | 50,979 | 2831 | 13 | 0.64 | 0.52 |
| 2015 | 3,982,446 | 48,838 | 3137 | 17 | 0.82 | 0.67 |
| 2016 | 3,067,378 | 35,448 | 2814 | 18 | 0.87 | 0.82 |
| 2017 | 3,927,682 | 39,047 | 3342 | 25 | 0.98 | 0.69 |
| 2018 | 3,664,280 | 40,082 | 3063 | 21 | 0.82 | 0.67 |
| 2019 | 4,556,164 | 52,073 | 3187 | 14 | 0.82 | 0.72 |
| Total | 41,000,084 | 494,301 | NA ‡ | 95 * | NA | NA |
| Average | 4,100,008 | 49,430 | 2891 | 15 | NA | NA |
| StDev | 660,640 | 10,512 | 563 | 6 | NA | NA |
| CV | 14 | 20 | 18 | 40 | NA | NA |
Disclaimer/Publisher’s Note: The statements, opinions and data contained in all publications are solely those of the individual author(s) and contributor(s) and not of MDPI and/or the editor(s). MDPI and/or the editor(s) disclaim responsibility for any injury to people or property resulting from any ideas, methods, instructions or products referred to in the content. |
© 2025 by the author. Licensee MDPI, Basel, Switzerland. This article is an open access article distributed under the terms and conditions of the Creative Commons Attribution (CC BY) license (https://creativecommons.org/licenses/by/4.0/).
Share and Cite
Scupham, A.J. Equine Parvovirus-Hepatitis Population Dynamics in a Single Horse over 16 Years. Viruses 2025, 17, 947. https://doi.org/10.3390/v17070947
Scupham AJ. Equine Parvovirus-Hepatitis Population Dynamics in a Single Horse over 16 Years. Viruses. 2025; 17(7):947. https://doi.org/10.3390/v17070947
Chicago/Turabian StyleScupham, Alexandra J. 2025. "Equine Parvovirus-Hepatitis Population Dynamics in a Single Horse over 16 Years" Viruses 17, no. 7: 947. https://doi.org/10.3390/v17070947
APA StyleScupham, A. J. (2025). Equine Parvovirus-Hepatitis Population Dynamics in a Single Horse over 16 Years. Viruses, 17(7), 947. https://doi.org/10.3390/v17070947