


Evaluation of Food-Grade Additives on the Viability of Ten Shigella flexneri Phages in Food to Improve Safety in Agricultural Products

Abstract

1. Introduction
2. Materials and Methods
2.1. Bacterial Strains and Phages
2.2. Phage Viability Against Food Additives and Biocides
2.3. Phage Viability Against Food Additives in Food
2.4. Statistical Analysis
3. Results
3.1. Phage Viability Against Food Additives
3.2. Phage Viability Against Food Additives in Food
3.3. Phage Viability Against Biocides
4. Discussion
5. Conclusions
Author Contributions
Funding
Institutional Review Board Statement
Informed Consent Statement
Data Availability Statement
Acknowledgments
Conflicts of Interest
References
- Maurelli, A.T. Chapter 7—Shigella and enteroinvasive Escherichia coli: Paradigms for pathogen evolution and host–parasite interactions. In Escherichia coli, 2nd ed.; Donnenberg, M.S., Ed.; Academic Press: Boston, MA, USA, 2013; pp. 215–245. [Google Scholar]
- Tack, D.M.; Marder, E.P.; Griffin, P.M.; Cieslak, P.R.; Dunn, J.; Hurd, S.; Scallan, E.; Lathrop, S.; Alison Muse, M.; Ryan, P.; et al. Preliminary incidence and trends of infections with pathogens transmitted commonly through food-foodborne diseases active Surveillance network, 10 U.S. sites, 2015–2018. MMWR Morb. Mortal. Wkly. Rep. 2019, 68, 369–372. [Google Scholar] [PubMed]
- World Health Organization. Guidelines for the Control of Shigellosis, Including Epidemics Due to Shigella dysenteriae Type 1; WHO Document Production Services; WHO: Geneva, Switzerland, 2005. [Google Scholar]
- Ahmed, A.M.; Shimamoto, T. Isolation and molecular characterization of Salmonella enterica, Escherichia coli O157:H7 and Shigella spp. from meat and dairy products in Egypt. Int. J. Food Microbiol. 2014, 168, 57–62. [Google Scholar]
- Hsu, B.-M.; Wu, S.-F.; Huang, S.-W.; Tseng, Y.-J.; Ji, D.-D.; Chen, J.-S.; Shih, F.-C. Differentiation and identification of Shigella spp. and enteroinvasive Escherichia coli in environmental waters by a molecular method and biochemical test. Water Res. 2010, 44, 949–955. [Google Scholar] [CrossRef]
- Zafar, A.; Sabir, N.; Bhutta, Z.A. Frequency of isolation of Shigella serogroups/serotypes and their antimicrobial susceptibility pattern in children from slum areas in Karachi. J. Pak. Med. Assoc. 2005, 55, 184–188. [Google Scholar]
- Havelaar, A.H.; Kirk, M.D.; Torgerson, P.R.; Gibb, H.J.; Hald, T.; Lake, R.J.; Praet, N.; Bellinger, D.C.; de Silva, N.R.; Gargouri, N.; et al. World Health Organization global estimates and regional comparisons of the burden of foodborne disease in 2010. PLoS Med. 2015, 12, e1001923. [Google Scholar]
- Torrez Lamberti, M.F.; Lopez, F.E.; Valdez, P.; Bianchi, A.; Barrionuevo Medina, E.; Pescaretti, M.L.M.; Delgado, M.A. Epidemiological study of prevalent pathogens in the Northwest region of Argentina (NWA). PLoS ONE 2020, 15, e0240404. [Google Scholar]
- Lee, H.; Ku, H.-J.; Lee, D.-H.; Kim, Y.-T.; Shin, H.; Ryu, S.; Lee, J.-H. Characterization and genomic study of the novel bacteriophage HY01 infecting both Escherichia coli O157:H7 and Shigella flexneri: Potential as a biocontrol agent in food. PLoS ONE 2016, 11, e0168985. [Google Scholar]
- Rubinstein, A.; Aruachan, D.; Burgos, M.; Angeleri, P.I. Direccion Nacional de Epidemiologia y Analisis de la Situacion de Salud Ministerio de Salud de la Nacion Argentina. Boletın Integr. Vigil. 2018, 417, 1–90. [Google Scholar]
- Tetteh, G.L.; Beuchat, L.R. Exposure of Shigella flexneri to acid stress and heat shock enhances acid tolerance. Food Microbiol. 2003, 20, 179–185. [Google Scholar] [CrossRef]
- Small, P.; Blankenhorn, D.; Welty, D.; Zinser, E.; Slonczewski, J.L. Acid and base resistance in Escherichia coli and Shigella flexneri: Role of rpoS and growth pH. J. Bacteriol. 1994, 176, 1729–1737. [Google Scholar]
- Lin, J.; Lee, I.; Frey, J.; Slonczewski, J.L.; Foster, J.W. Comparative analysis of extreme acid survival in Salmonella typhimurium, Shigella flexneri, and Escherichia coli. J. Bacteriol. 1995, 177, 4097–4104. [Google Scholar]
- Zhang, H.; Wang, R.; Bao, H.D. Phage inactivation of foodborne Shigella on ready-to-eat spiced chicken. Poul. Sci. 2013, 92, 211–217. [Google Scholar]
- Shahin, K.; Zhang, L.; Soleimani Delfan, A.; Komijani, M.; Hedayatkhah, A.; Bao, H.; Barazandeh, M.; Mansoorianfar, M.; Pang, M.; He, T.; et al. Effective control of Shigella contamination in different foods using a novel six-phage cocktail. LWT-Food Sci. Technol. 2021, 144, 111137. [Google Scholar]
- Shahin, K.; Bao, H.; Zhu, S.; Soleimani-Delfan, A.; He, T.; Mansoorianfar, M.; Wang, R. Bio-control of O157:H7, and colistin-resistant MCR-1-positive Escherichia coli using a new designed broad host range phage cocktail. LWT-Food Sci. Technol. 2022, 154, 112836. [Google Scholar]
- Tomat, D.; Gonzales, A.; Aquili, V.; Casabonne, C.; Quiberoni, A. Characterization of ten newly isolated phages against the foodborne pathogen Shigella flexneri. J. Food Process. Preserv. 2022, 46, e15676. [Google Scholar]
- Tomat, D.; Aquili, V.; Casabonne, C.; Quiberoni, A. Influence of physicochemical factors on adsorption of ten Shigella flexneri phages. Viruses 2022, 14, 2815. [Google Scholar] [CrossRef]
- Magnone, J.P.; Marek, P.J.; Sulakvelidze, A.; Senecal, A.G. Additive approach for inactivation of Escherichia coli O157:H7, Salmonella, and Shigella spp. on contaminated fresh fruits and vegetables using bacteriophage cocktail and produce wash. J. Food Protect. 2013, 76, 1336–1341. [Google Scholar]
- Soffer, N.; Woolston, J.; Li, M.; Das, C.; Sulakvelidze, A. Bacteriophage preparation lytic for Shigella significantly reduces Shigella sonnei contamination in various foods. PLoS ONE 2017, 12, e0175256. [Google Scholar]
- Aditivos Alimentarios. Capítulo XVIII. Código Alimentario Argentino. Available online: https://www.argentina.gob.ar/sites/default/files/anmat-cap-18-aditivos.pdf (accessed on 24 February 2025).
- Tomat, D.; Mercanti, D.; Balague, C.; Quiberoni, A. Phage biocontrol of enteropathogenic and Shiga toxin-producing Escherichia coli during milk fermentation. Lett. Appl. Microbiol. 2013, 57, 3–10. [Google Scholar] [CrossRef]
- Lewis, R.; Hill, C. Overcoming barriers to phage application in food and feed. Curr. Opin. Biotechnol. 2020, 61, 38–44. [Google Scholar]
- Huang, C.; Shi, J.; Ma, W.; Li, Z.; Wang, J.; Li, J.; Wang, X. Isolation, characterization, and application of a novel specific Salmonella bacteriophage in different food matrices. Food Res. Int. 2018, 111, 631–641. [Google Scholar] [CrossRef]
- Humphrey, T.J.; Richardson, N.P.; Statton, K.M.; Rowbury, R.J. Effects of temperature shift on acid and heat tolerance in Salmonella enteritidis phage type 4. Appl. Environ. Microbiol. 1993, 59, 3120–3122. [Google Scholar]
- Tomat, D.; Casabonne, C.; Aquili, V.; Balague, C.; Quiberoni, A. Evaluation of a novel cocktail of six lytic bacteriophages against Shiga toxin producing Escherichia coli in broth, milk and meat. Food Microbiol. 2018, 76, 434–442. [Google Scholar]
- Gorden, J.; Small, P.L.C. Acid resistance in enteric bacteria. Infect. Immun. 1993, 61, 364–367. [Google Scholar]
- Tomat, D.; Balague, C.; Casabonne, C.; Verdini, R.; Quiberoni, A. Resistance of foodborne pathogen coliphages to additives applied in food manufacture. LWT-Food Sci. Technol. 2016, 67, 50–54. [Google Scholar]
- Sukumaran, A.T.; Nannapaneni, R.; Kiess, A.; Sharma, C.S. Reduction of Salmonella on chicken meat and chicken skin by combined or sequential application of lytic bacteriophage with chemical antimicrobials. Int. J. Food Microbiol. 2015, 207, 8–15. [Google Scholar]
- Rodriguez, E.; Seguer, J.; Rocabayera, X.; Manresa, A. Cellular effects of monohydrochloride of L-arginine, Nα-lauroyl ethylester (LAE) on exposure to Salmonella typhimurium and Staphylococcus aureus. J. Appl. Microbiol. 2004, 96, 903–912. [Google Scholar]
- Mercanti, D.J.; Guglielmotti, D.M.; Patrignani, F.; Reinheimer, J.A.; Quiberoni, A. Resistance of two temperate Lactobacillus paracasei bacteriophages to high pressure homogenization, thermal treatments and chemical biocides of industrial application. Food Microbiol. 2012, 29, 99.e104. [Google Scholar]
- Tomat, D.; Balague, C.; Aquili, V.; Verdini, R.; Quiberoni, A. Resistance of phages lytic to pathogenic Escherichia coli to sanitisers used by the food industry and in home settings. Int. J. Food Sci. Technol. 2017, 53, 533–540. [Google Scholar]
 ) of acetic acid after 5 min (filled), 15 min (filled and dashed), 30 min (filled and bricks), and 60 min (filled and arrows) of incubation. Values are the mean ± standard deviation (error bars) of three determinations (treatment: phage, phage concentration, incubation time) were compared against controls using Student’s t test at p < 0.05.
) of acetic acid after 5 min (filled), 15 min (filled and dashed), 30 min (filled and bricks), and 60 min (filled and arrows) of incubation. Values are the mean ± standard deviation (error bars) of three determinations (treatment: phage, phage concentration, incubation time) were compared against controls using Student’s t test at p < 0.05.
) of acetic acid after 5 min (filled), 15 min (filled and dashed), 30 min (filled and bricks), and 60 min (filled and arrows) of incubation. Values are the mean ± standard deviation (error bars) of three determinations (treatment: phage, phage concentration, incubation time) were compared against controls using Student’s t test at p < 0.05.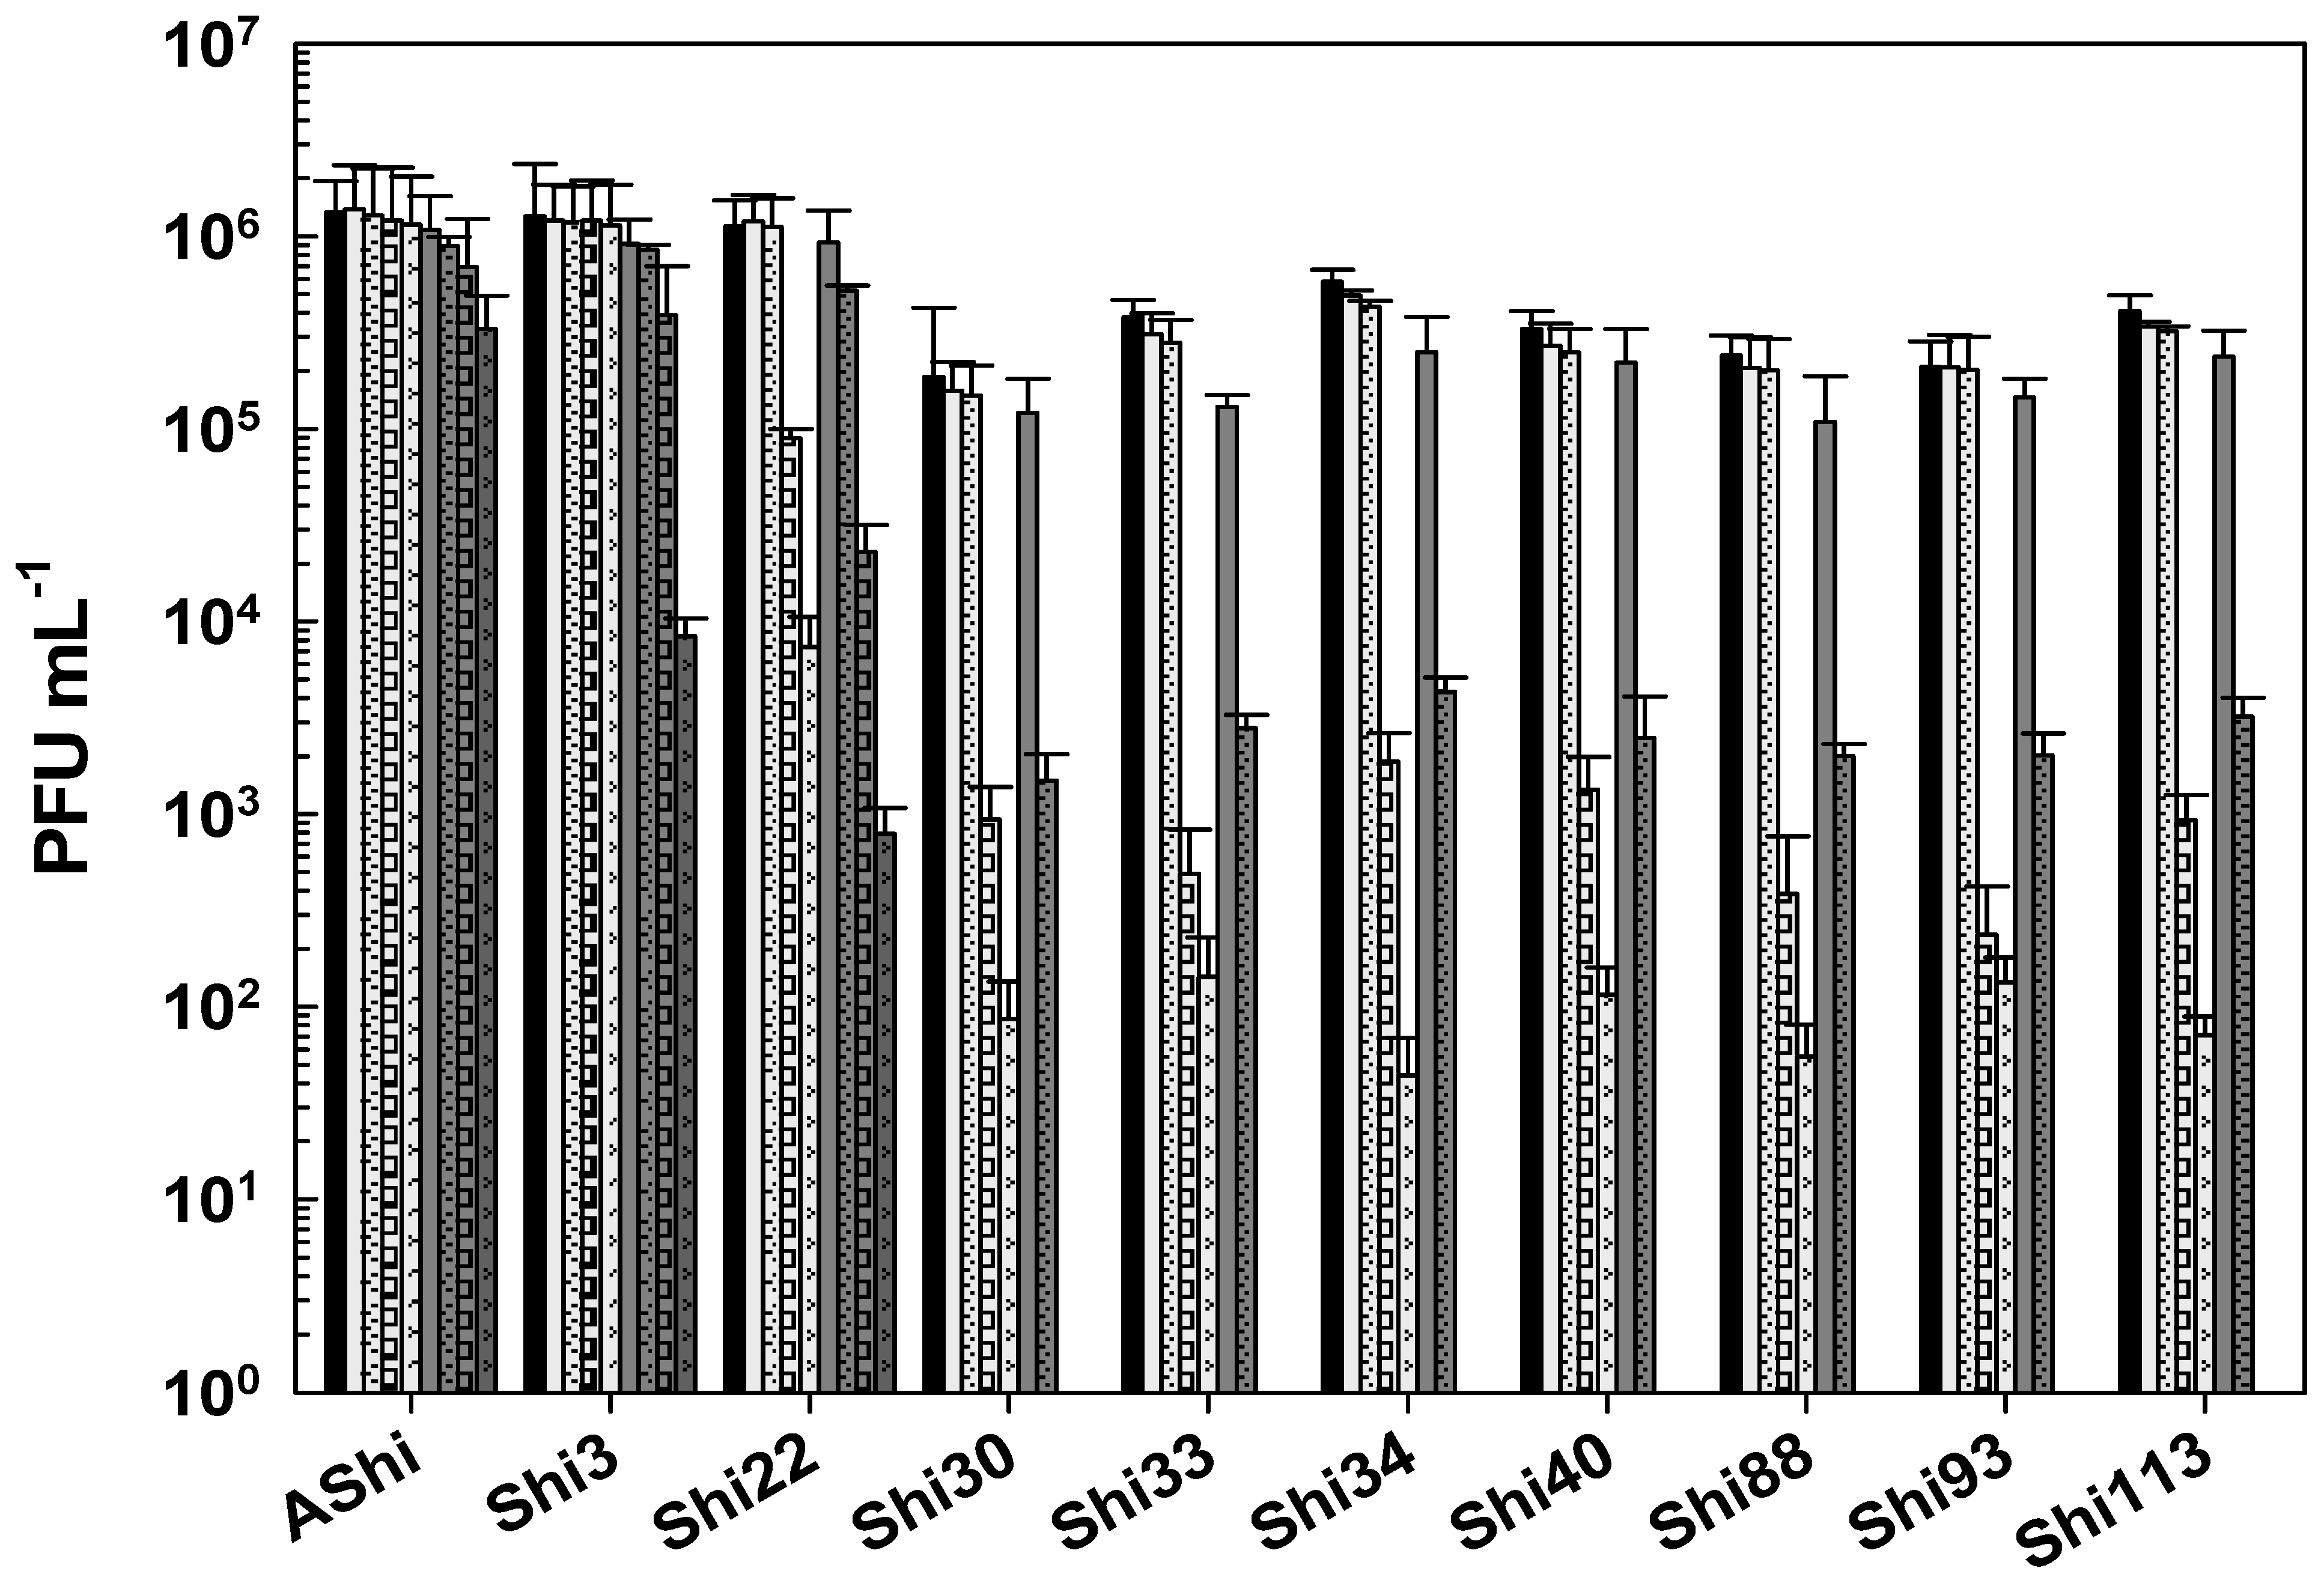 ) of lactic acid after 5 min (filled), 15 min (filled and dashed), 30 min (filled and bricks), and 60 min (filled and arrows) of incubation. Values are the mean ± standard deviation (error bars) of three determinations (treatment: phage, phage concentration, incubation time) were compared against controls using Student’s t test at p < 0.05.
) of lactic acid after 5 min (filled), 15 min (filled and dashed), 30 min (filled and bricks), and 60 min (filled and arrows) of incubation. Values are the mean ± standard deviation (error bars) of three determinations (treatment: phage, phage concentration, incubation time) were compared against controls using Student’s t test at p < 0.05.
) of lactic acid after 5 min (filled), 15 min (filled and dashed), 30 min (filled and bricks), and 60 min (filled and arrows) of incubation. Values are the mean ± standard deviation (error bars) of three determinations (treatment: phage, phage concentration, incubation time) were compared against controls using Student’s t test at p < 0.05.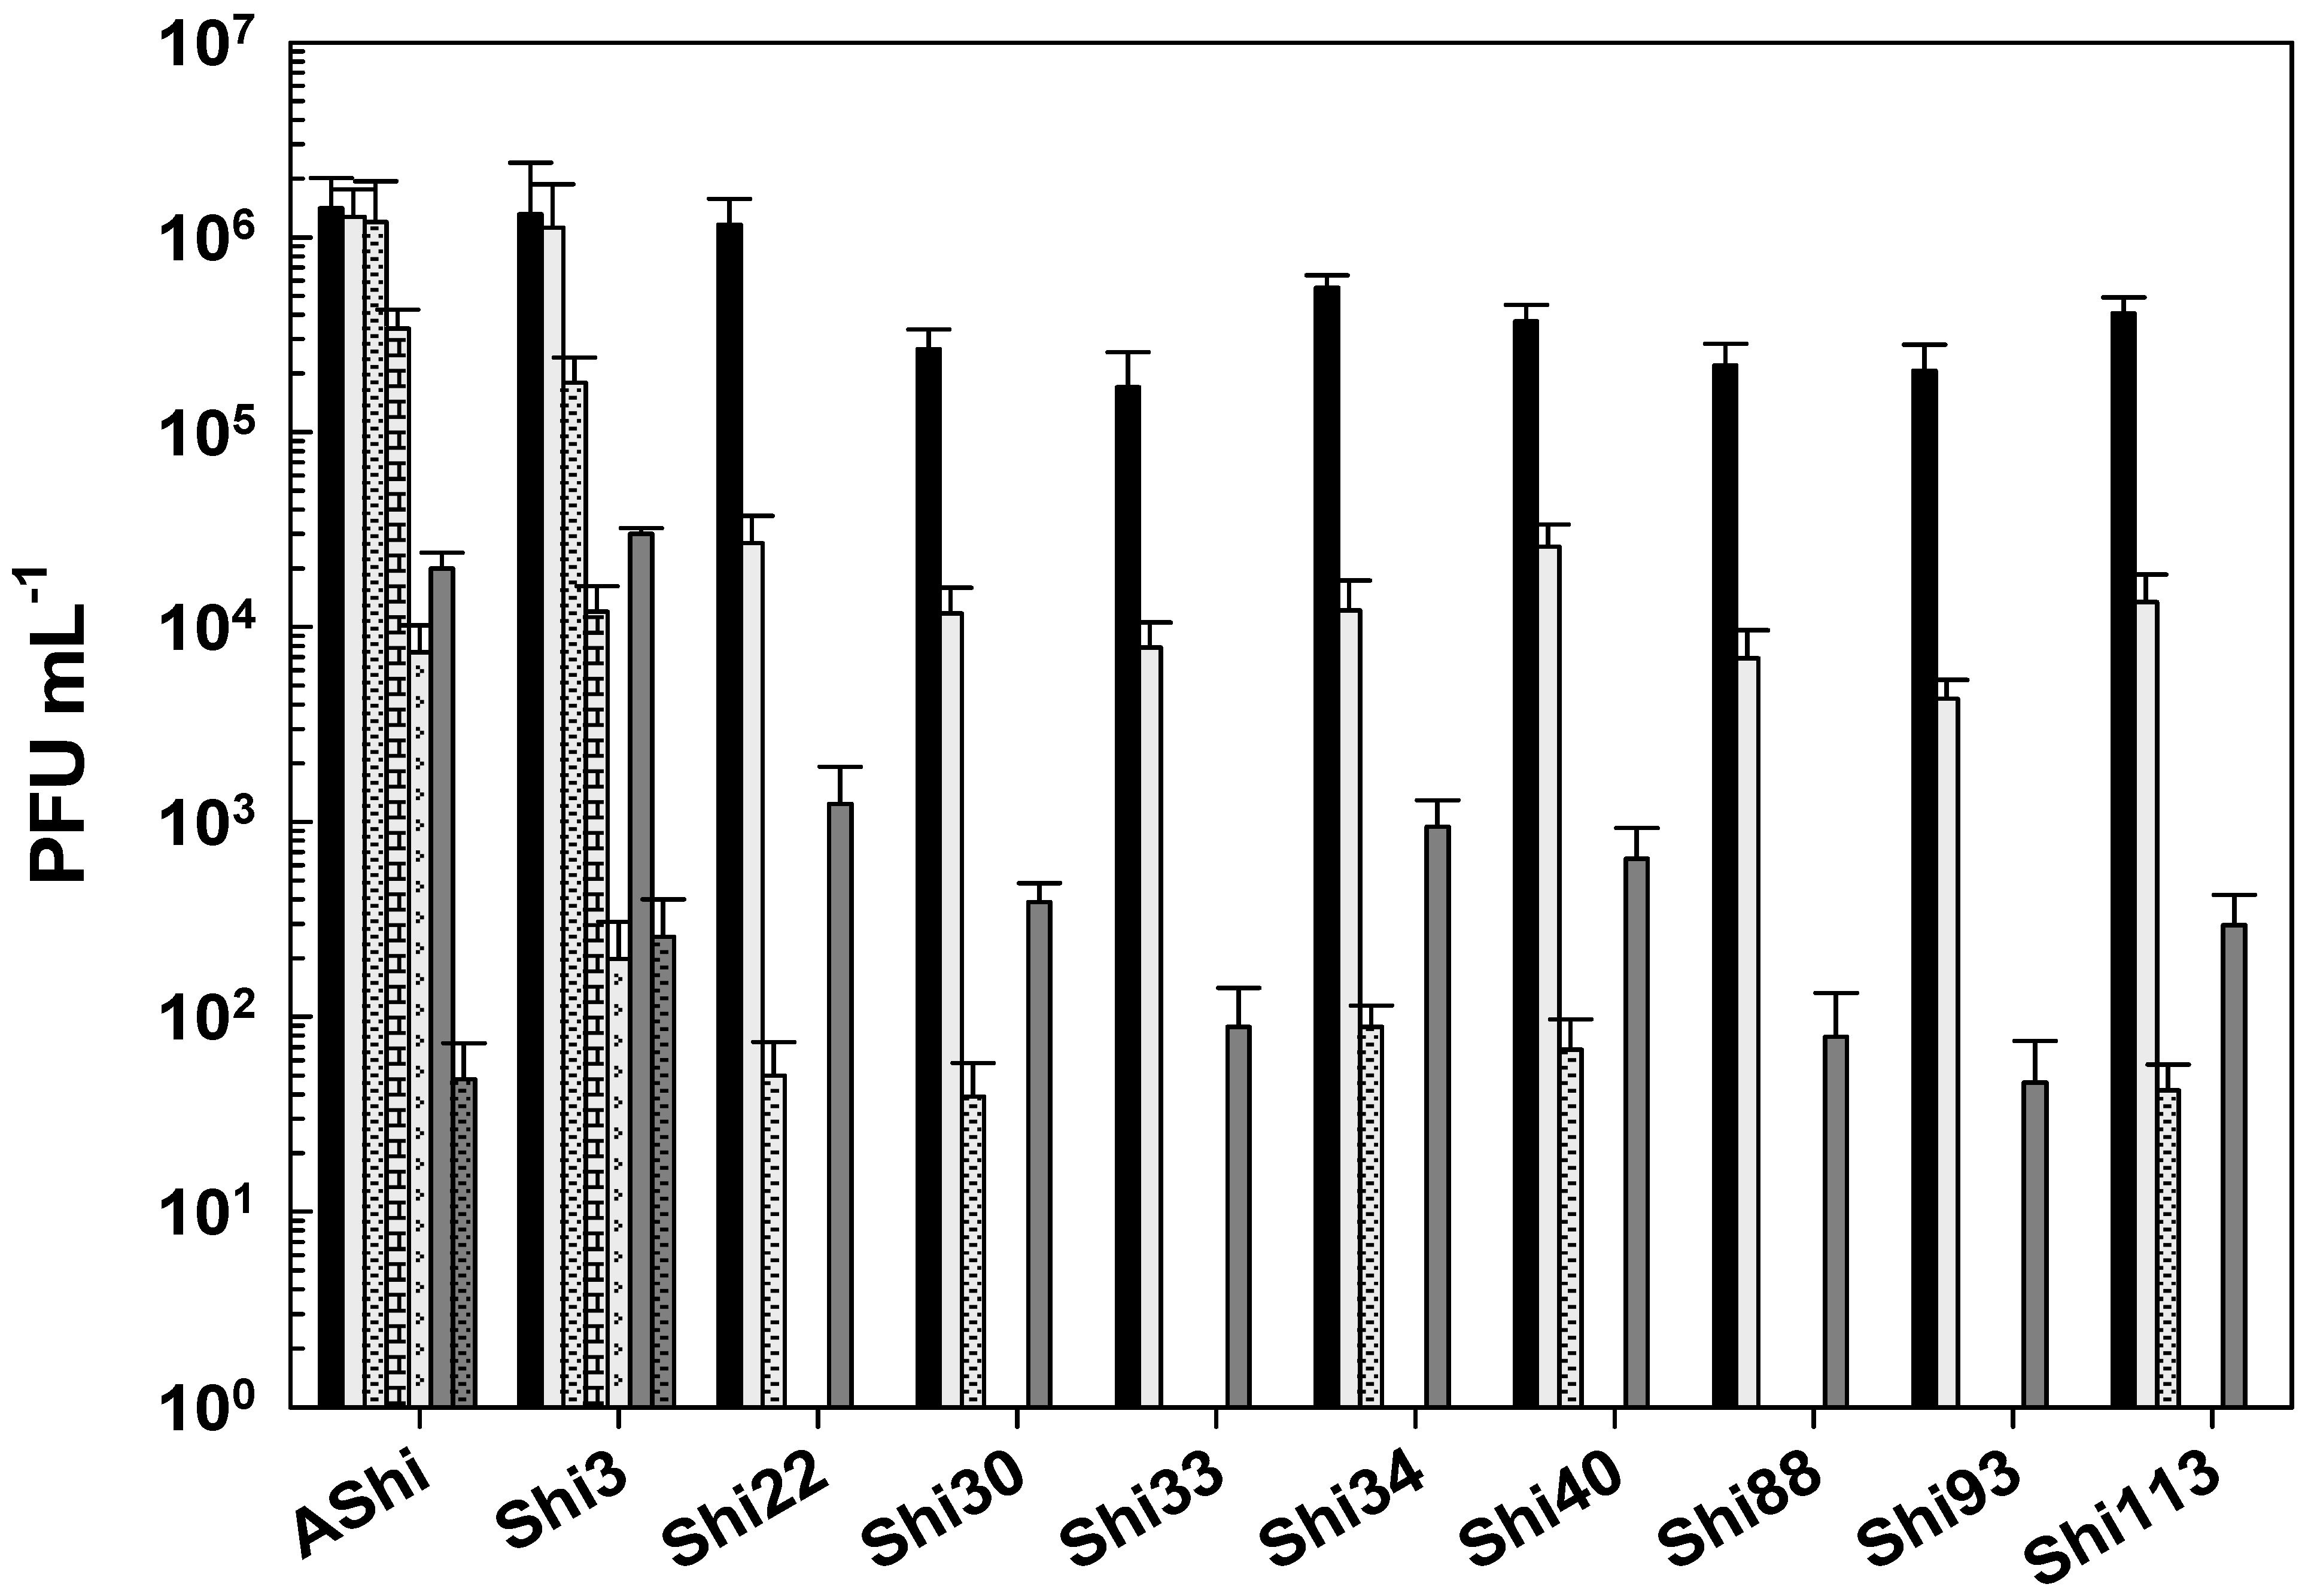 ) of citric acid after 5 min (filled), 15 min (filled and dashed), and 30 min (filled and bricks) of incubation. Values are the mean ± standard deviation (error bars) of three determinations (treatment: phage, phage concentration, incubation time) were compared against controls using Student’s t test at p < 0.05.
) of citric acid after 5 min (filled), 15 min (filled and dashed), and 30 min (filled and bricks) of incubation. Values are the mean ± standard deviation (error bars) of three determinations (treatment: phage, phage concentration, incubation time) were compared against controls using Student’s t test at p < 0.05.
) of citric acid after 5 min (filled), 15 min (filled and dashed), and 30 min (filled and bricks) of incubation. Values are the mean ± standard deviation (error bars) of three determinations (treatment: phage, phage concentration, incubation time) were compared against controls using Student’s t test at p < 0.05.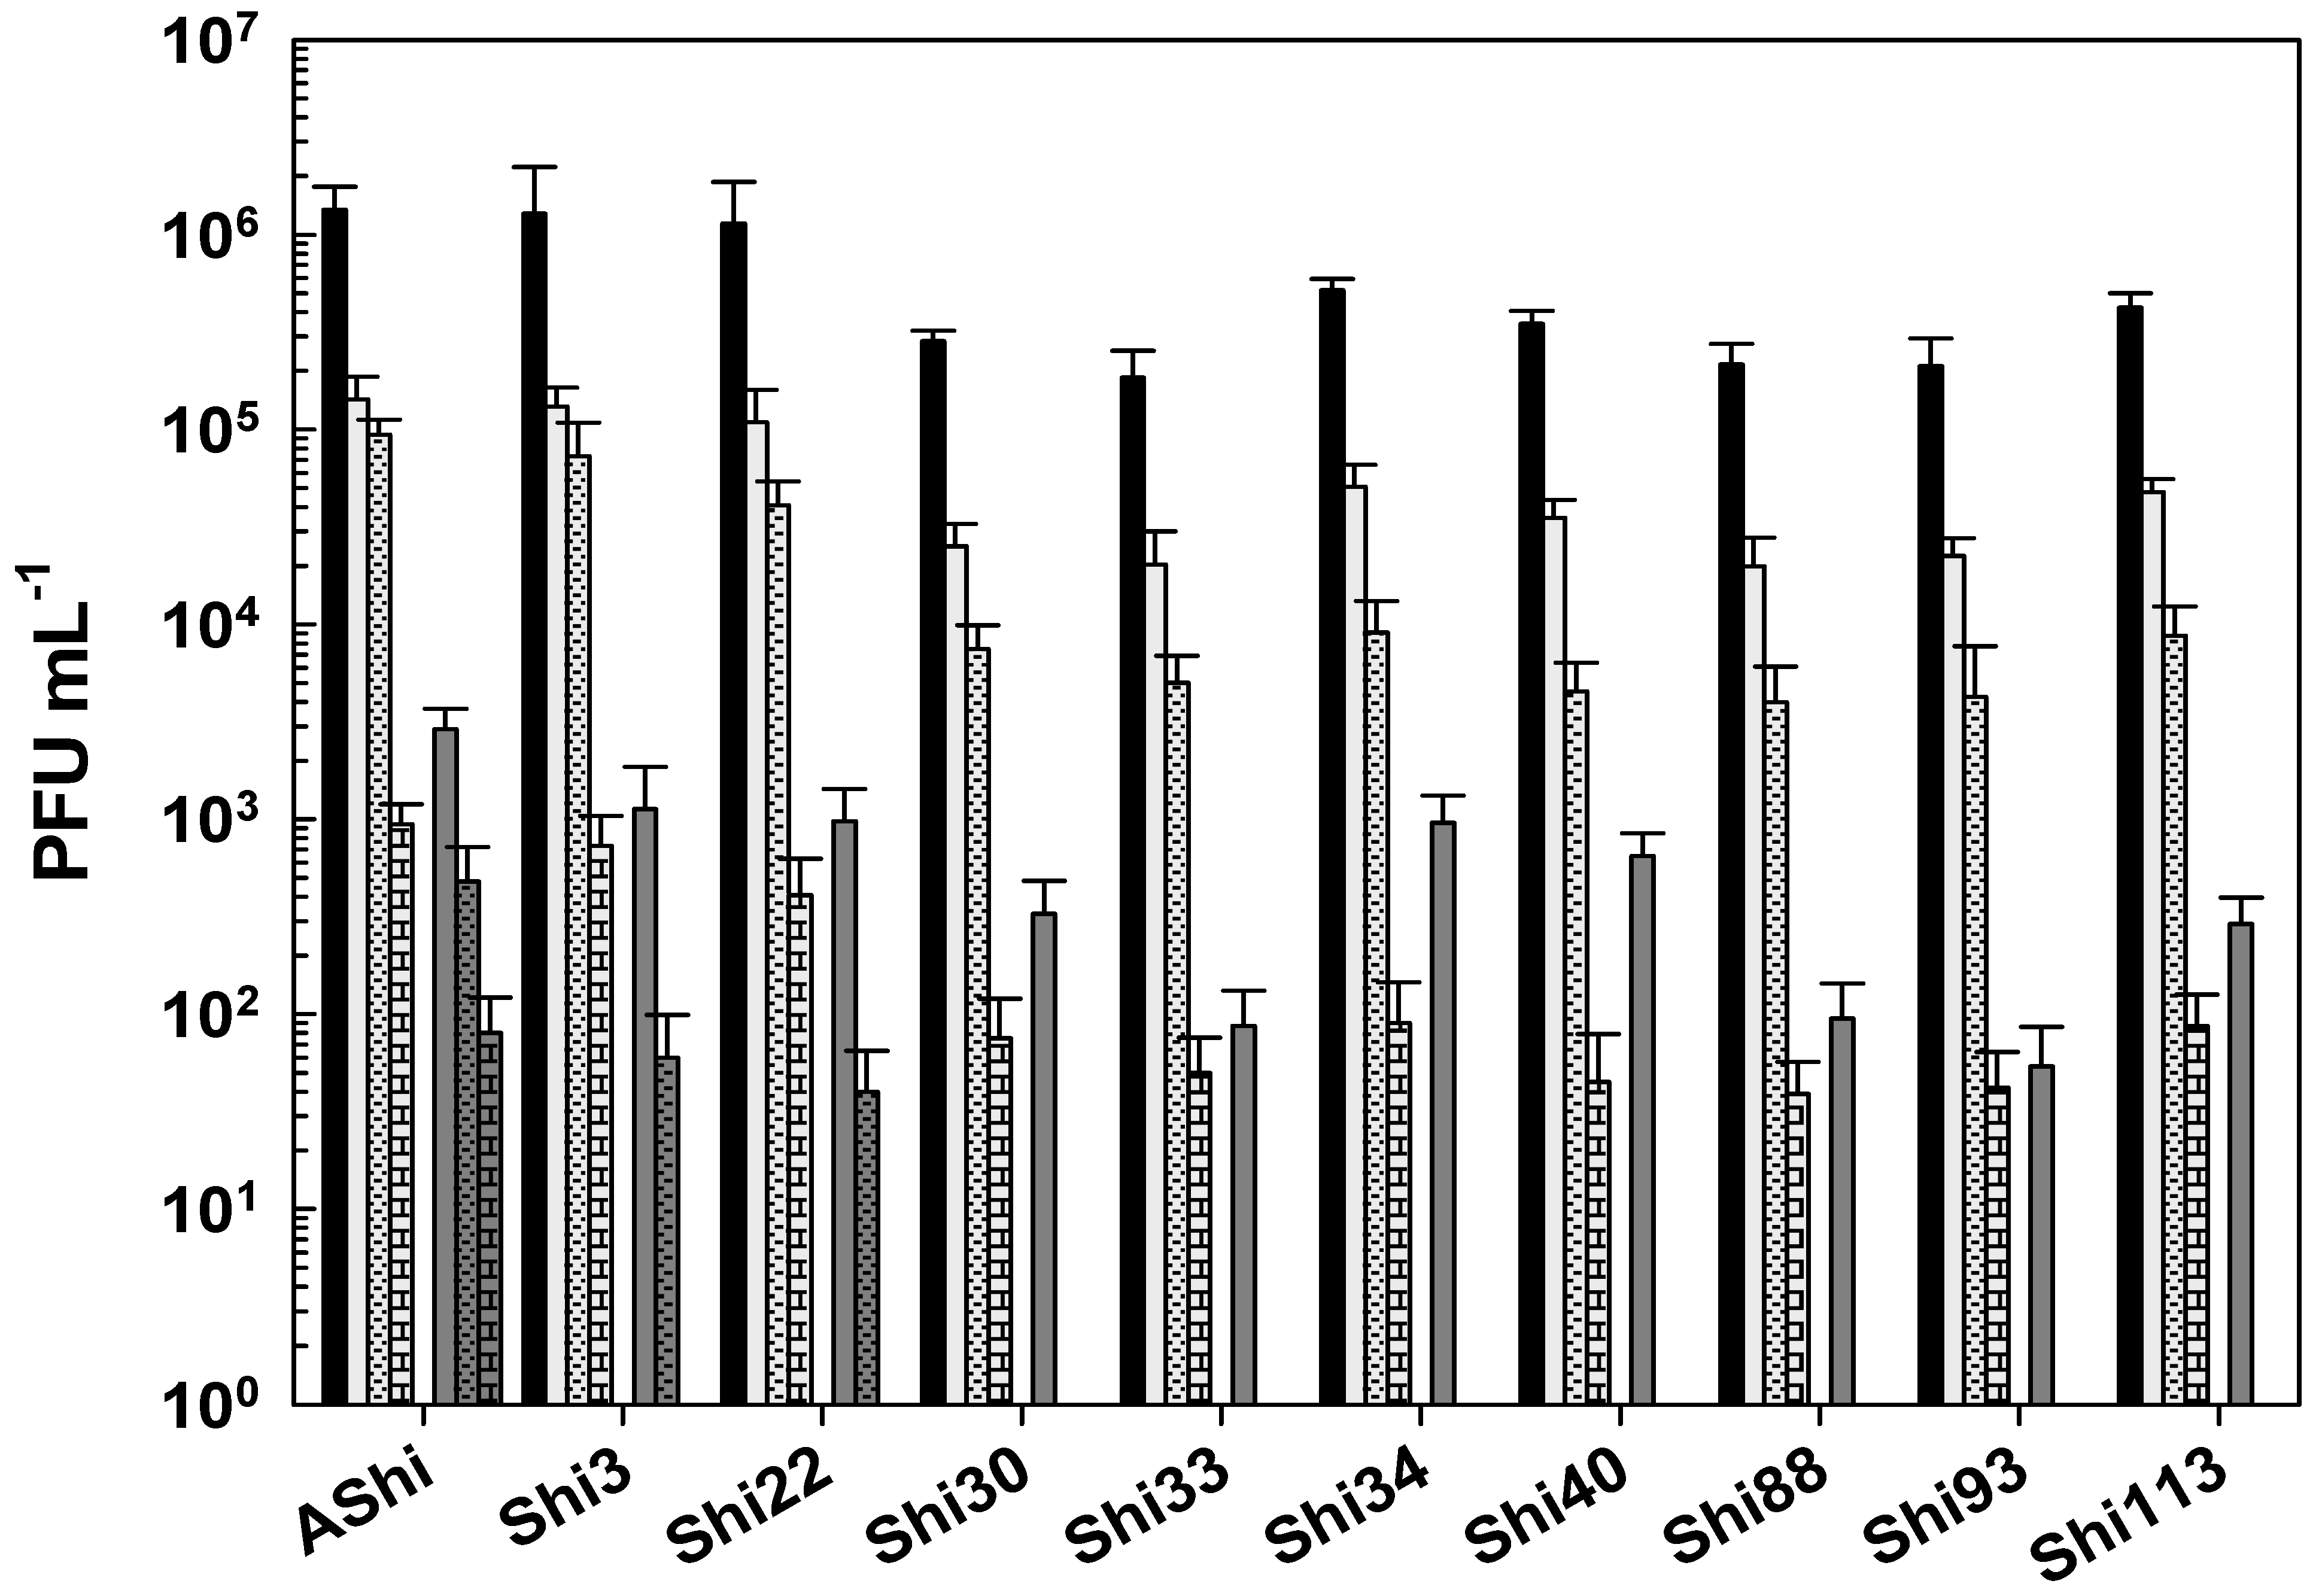
 ), and citric () acid after 30 min (filled), and 60 min (filled and dashed) of incubation. Values are the mean ± standard deviation (error bars) of three determinations (treatment: phage, phage concentration, incubation time) were compared against controls using Student’s t test at p < 0.05.
), and citric () acid after 30 min (filled), and 60 min (filled and dashed) of incubation. Values are the mean ± standard deviation (error bars) of three determinations (treatment: phage, phage concentration, incubation time) were compared against controls using Student’s t test at p < 0.05.
), and citric () acid after 30 min (filled), and 60 min (filled and dashed) of incubation. Values are the mean ± standard deviation (error bars) of three determinations (treatment: phage, phage concentration, incubation time) were compared against controls using Student’s t test at p < 0.05. ), and 500 ppm () residual-free chlorine (sodium hypochlorite) after 1 min (filled) and 10 min (filled and dashed) of incubation. Values are the mean ± standard deviation (error bars) of three determinations (treatment: phage, phage concentration, incubation time) were compared against controls using Student’s t test at p < 0.05.
), and 500 ppm () residual-free chlorine (sodium hypochlorite) after 1 min (filled) and 10 min (filled and dashed) of incubation. Values are the mean ± standard deviation (error bars) of three determinations (treatment: phage, phage concentration, incubation time) were compared against controls using Student’s t test at p < 0.05.
), and 500 ppm () residual-free chlorine (sodium hypochlorite) after 1 min (filled) and 10 min (filled and dashed) of incubation. Values are the mean ± standard deviation (error bars) of three determinations (treatment: phage, phage concentration, incubation time) were compared against controls using Student’s t test at p < 0.05.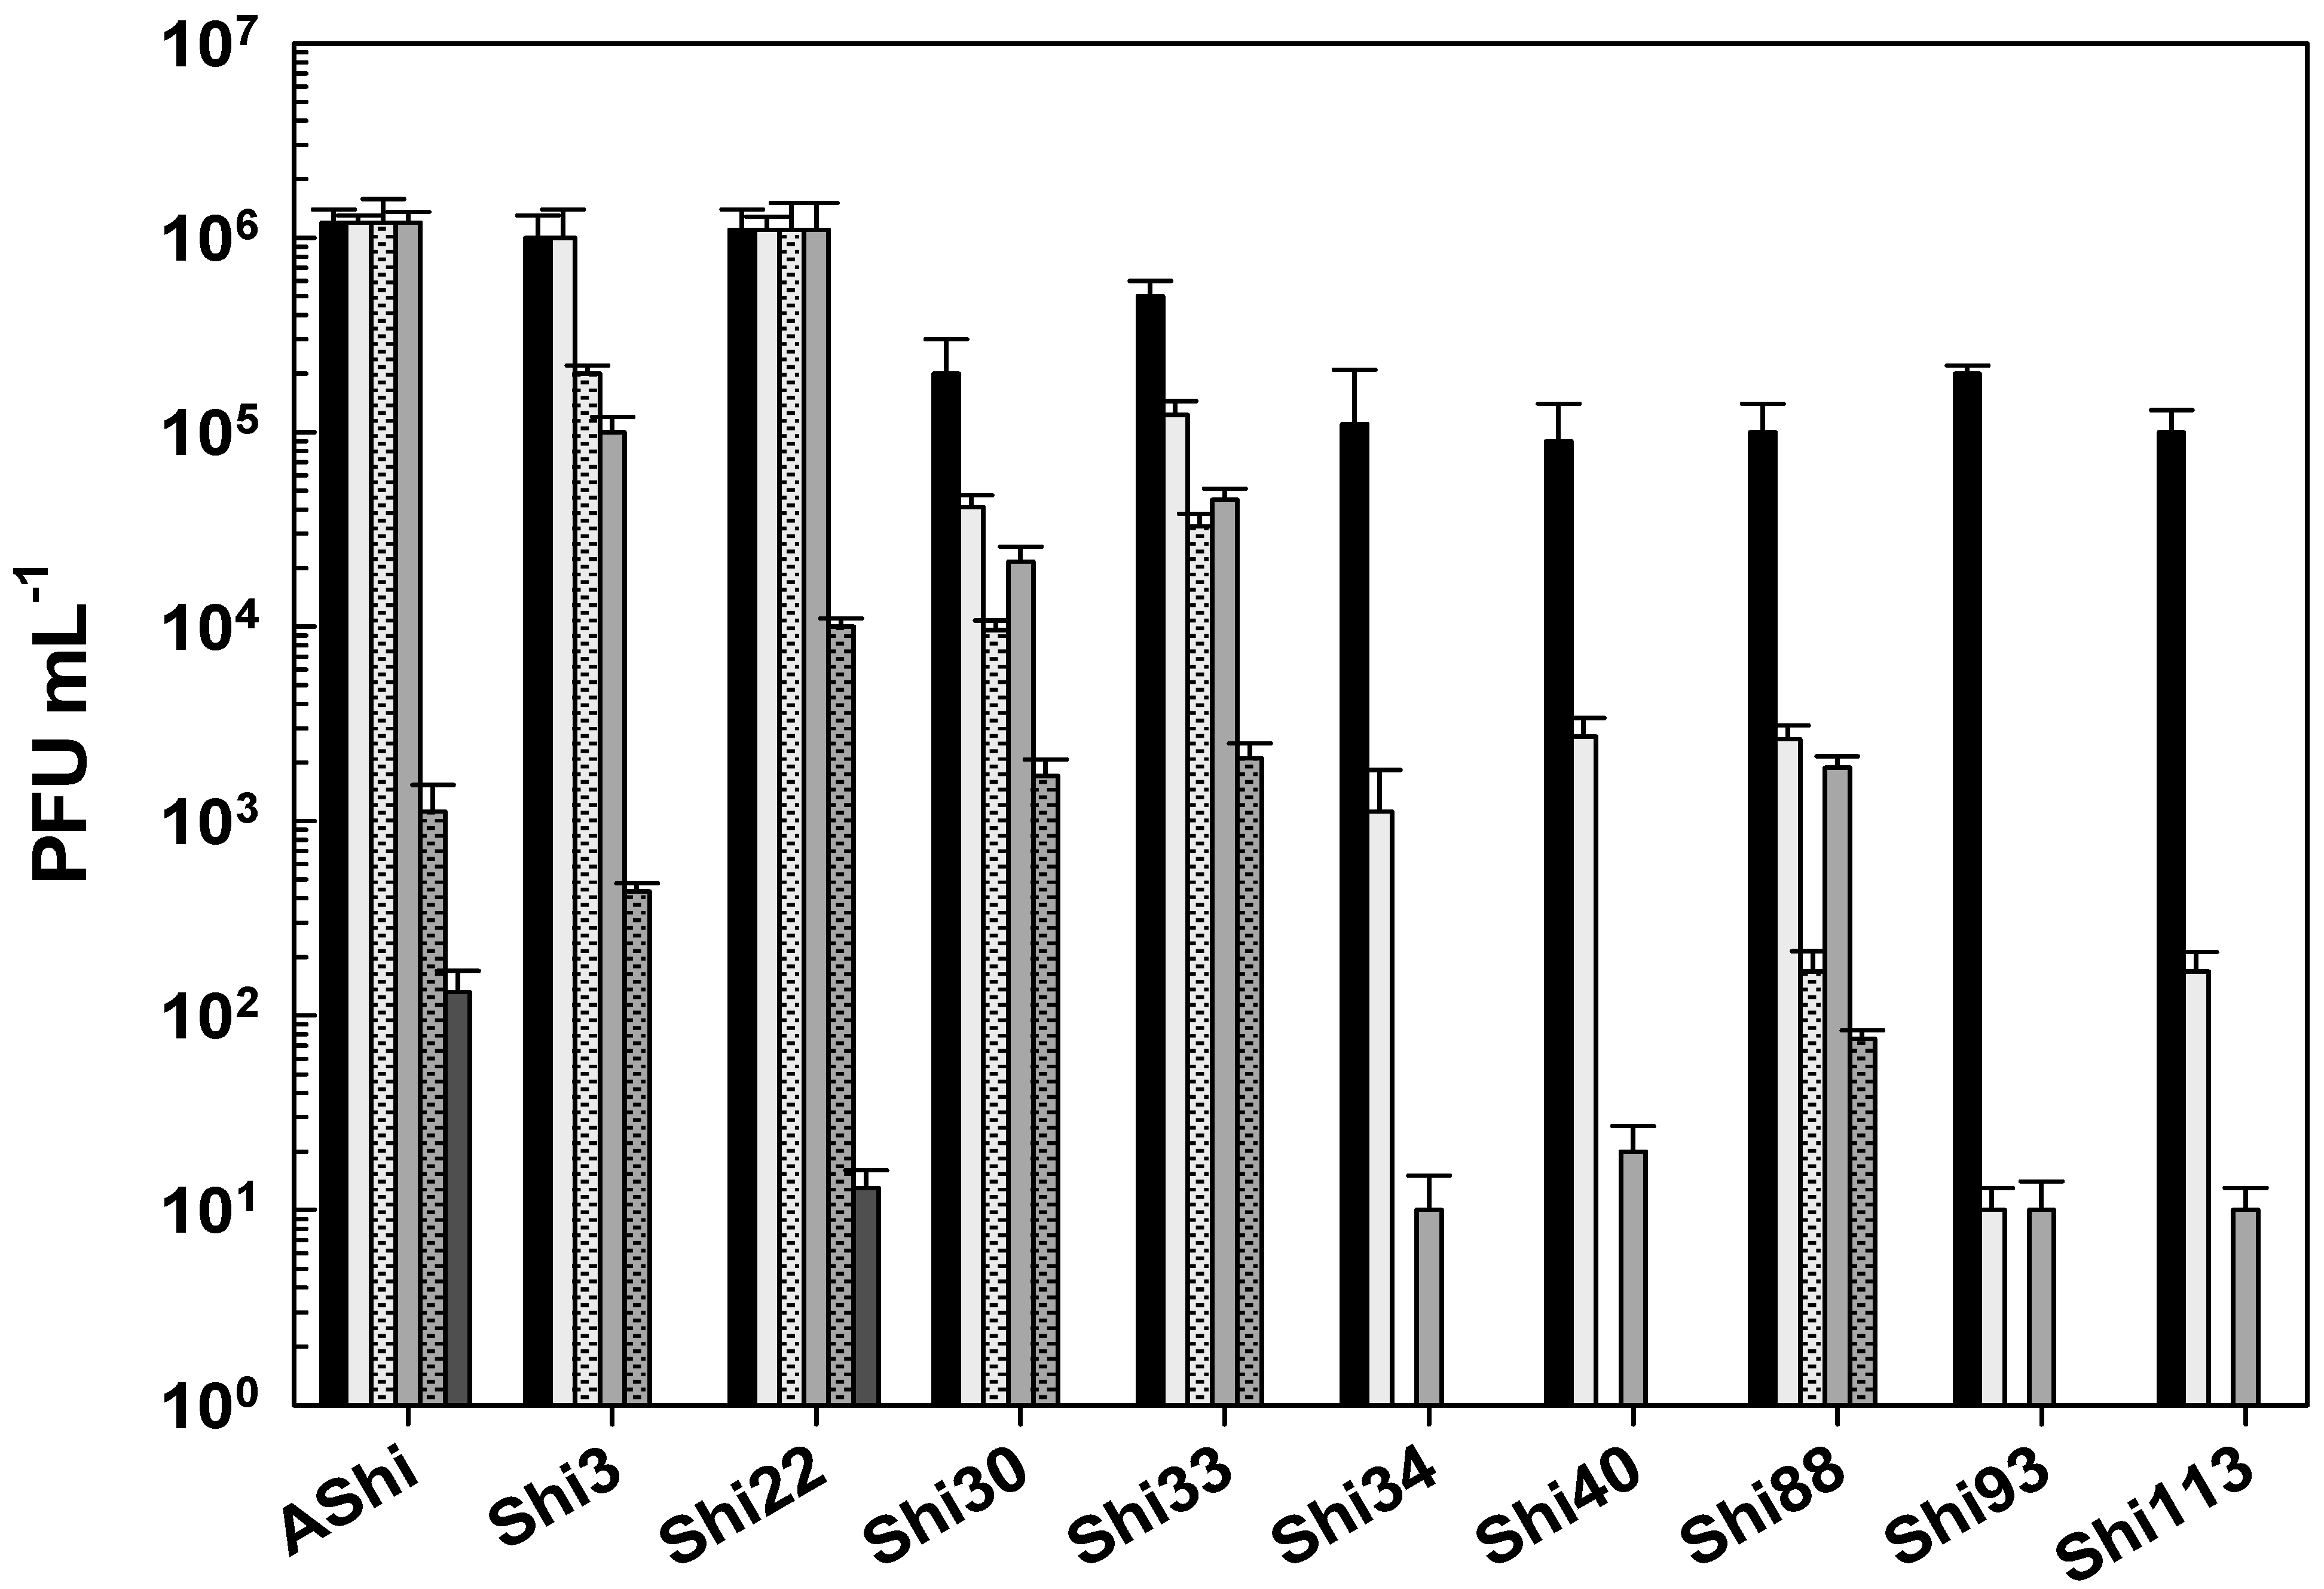 ) of ethanol after 15 min (filled), 30 min (filled and dashed), and 60 min (filled and bricks) of incubation. Values are the mean ± standard deviation (error bars) of three determinations (treatment: phage, phage concentration, incubation time) were compared against controls using Student’s t test at p < 0.05.
) of ethanol after 15 min (filled), 30 min (filled and dashed), and 60 min (filled and bricks) of incubation. Values are the mean ± standard deviation (error bars) of three determinations (treatment: phage, phage concentration, incubation time) were compared against controls using Student’s t test at p < 0.05.
) of ethanol after 15 min (filled), 30 min (filled and dashed), and 60 min (filled and bricks) of incubation. Values are the mean ± standard deviation (error bars) of three determinations (treatment: phage, phage concentration, incubation time) were compared against controls using Student’s t test at p < 0.05.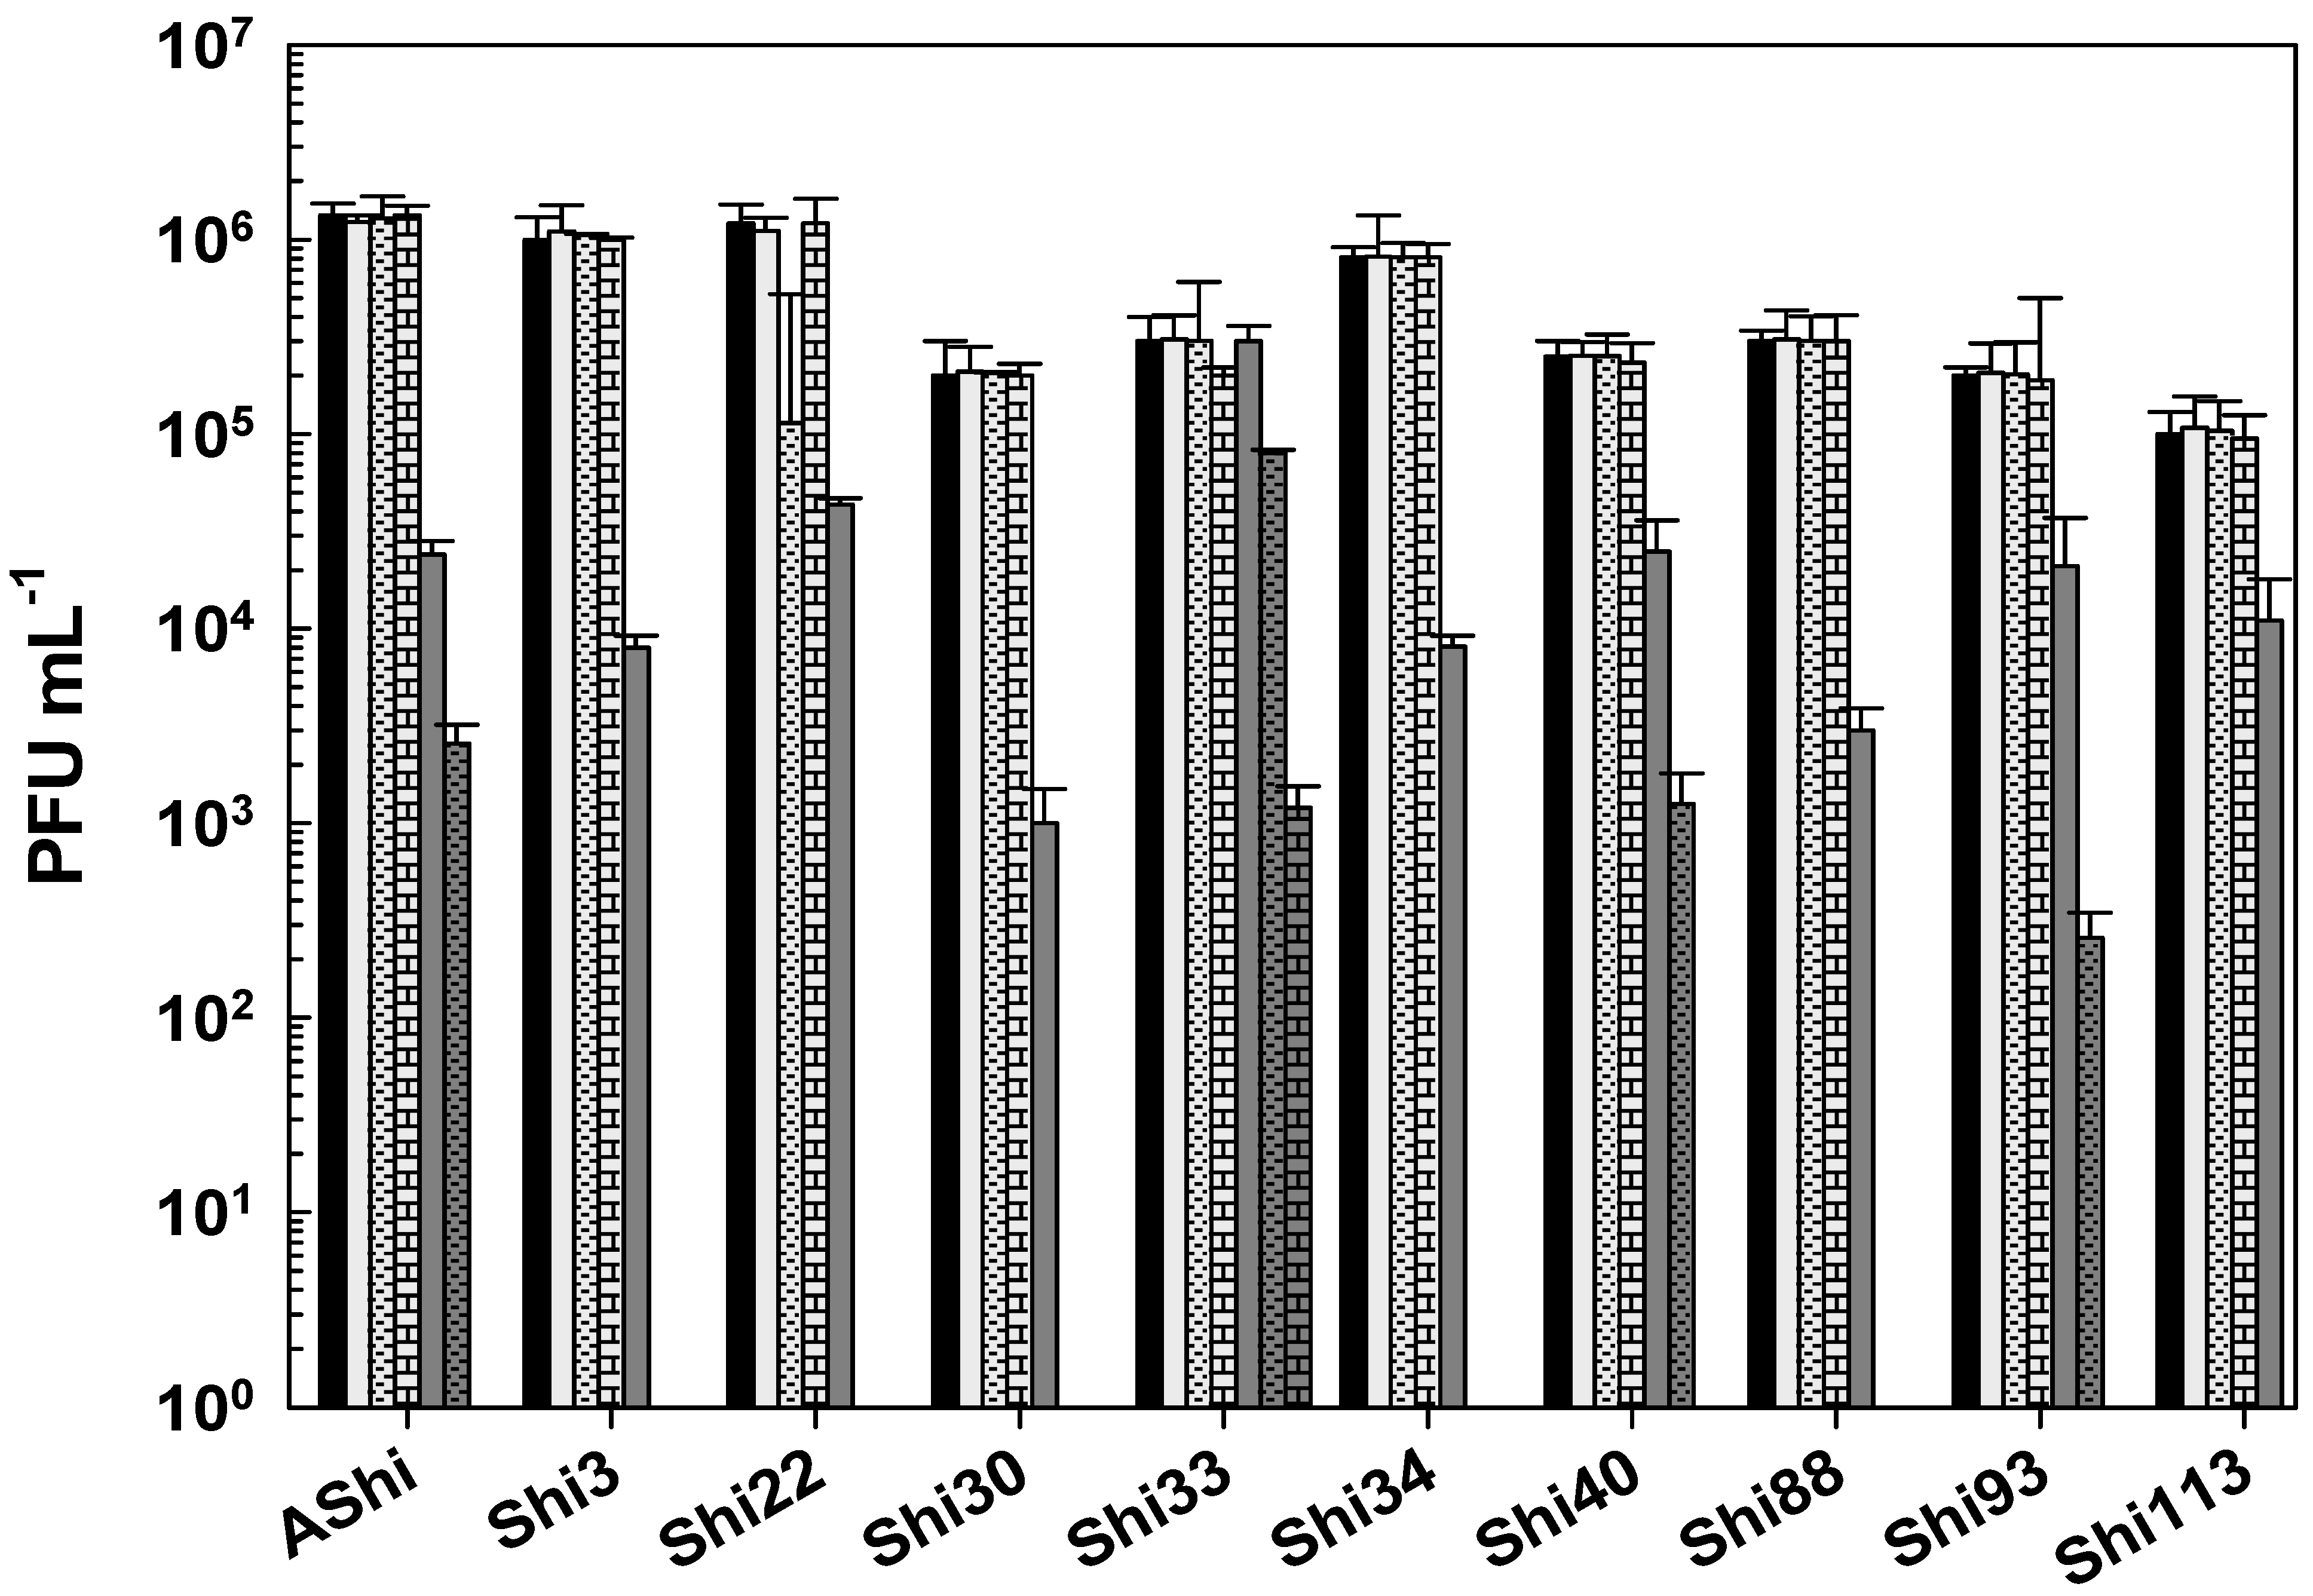 ) of quaternary ammonium chloride (QAC) after 15 min (filled), 30 min (filled and dashed), and 60 min (filled and bricks) of incubation. Values are the mean ± standard deviation (error bars) of three determinations (treatment: phage, phage concentration, incubation time) were compared against controls using Student’s t test at p < 0.05.
) of quaternary ammonium chloride (QAC) after 15 min (filled), 30 min (filled and dashed), and 60 min (filled and bricks) of incubation. Values are the mean ± standard deviation (error bars) of three determinations (treatment: phage, phage concentration, incubation time) were compared against controls using Student’s t test at p < 0.05.
) of quaternary ammonium chloride (QAC) after 15 min (filled), 30 min (filled and dashed), and 60 min (filled and bricks) of incubation. Values are the mean ± standard deviation (error bars) of three determinations (treatment: phage, phage concentration, incubation time) were compared against controls using Student’s t test at p < 0.05.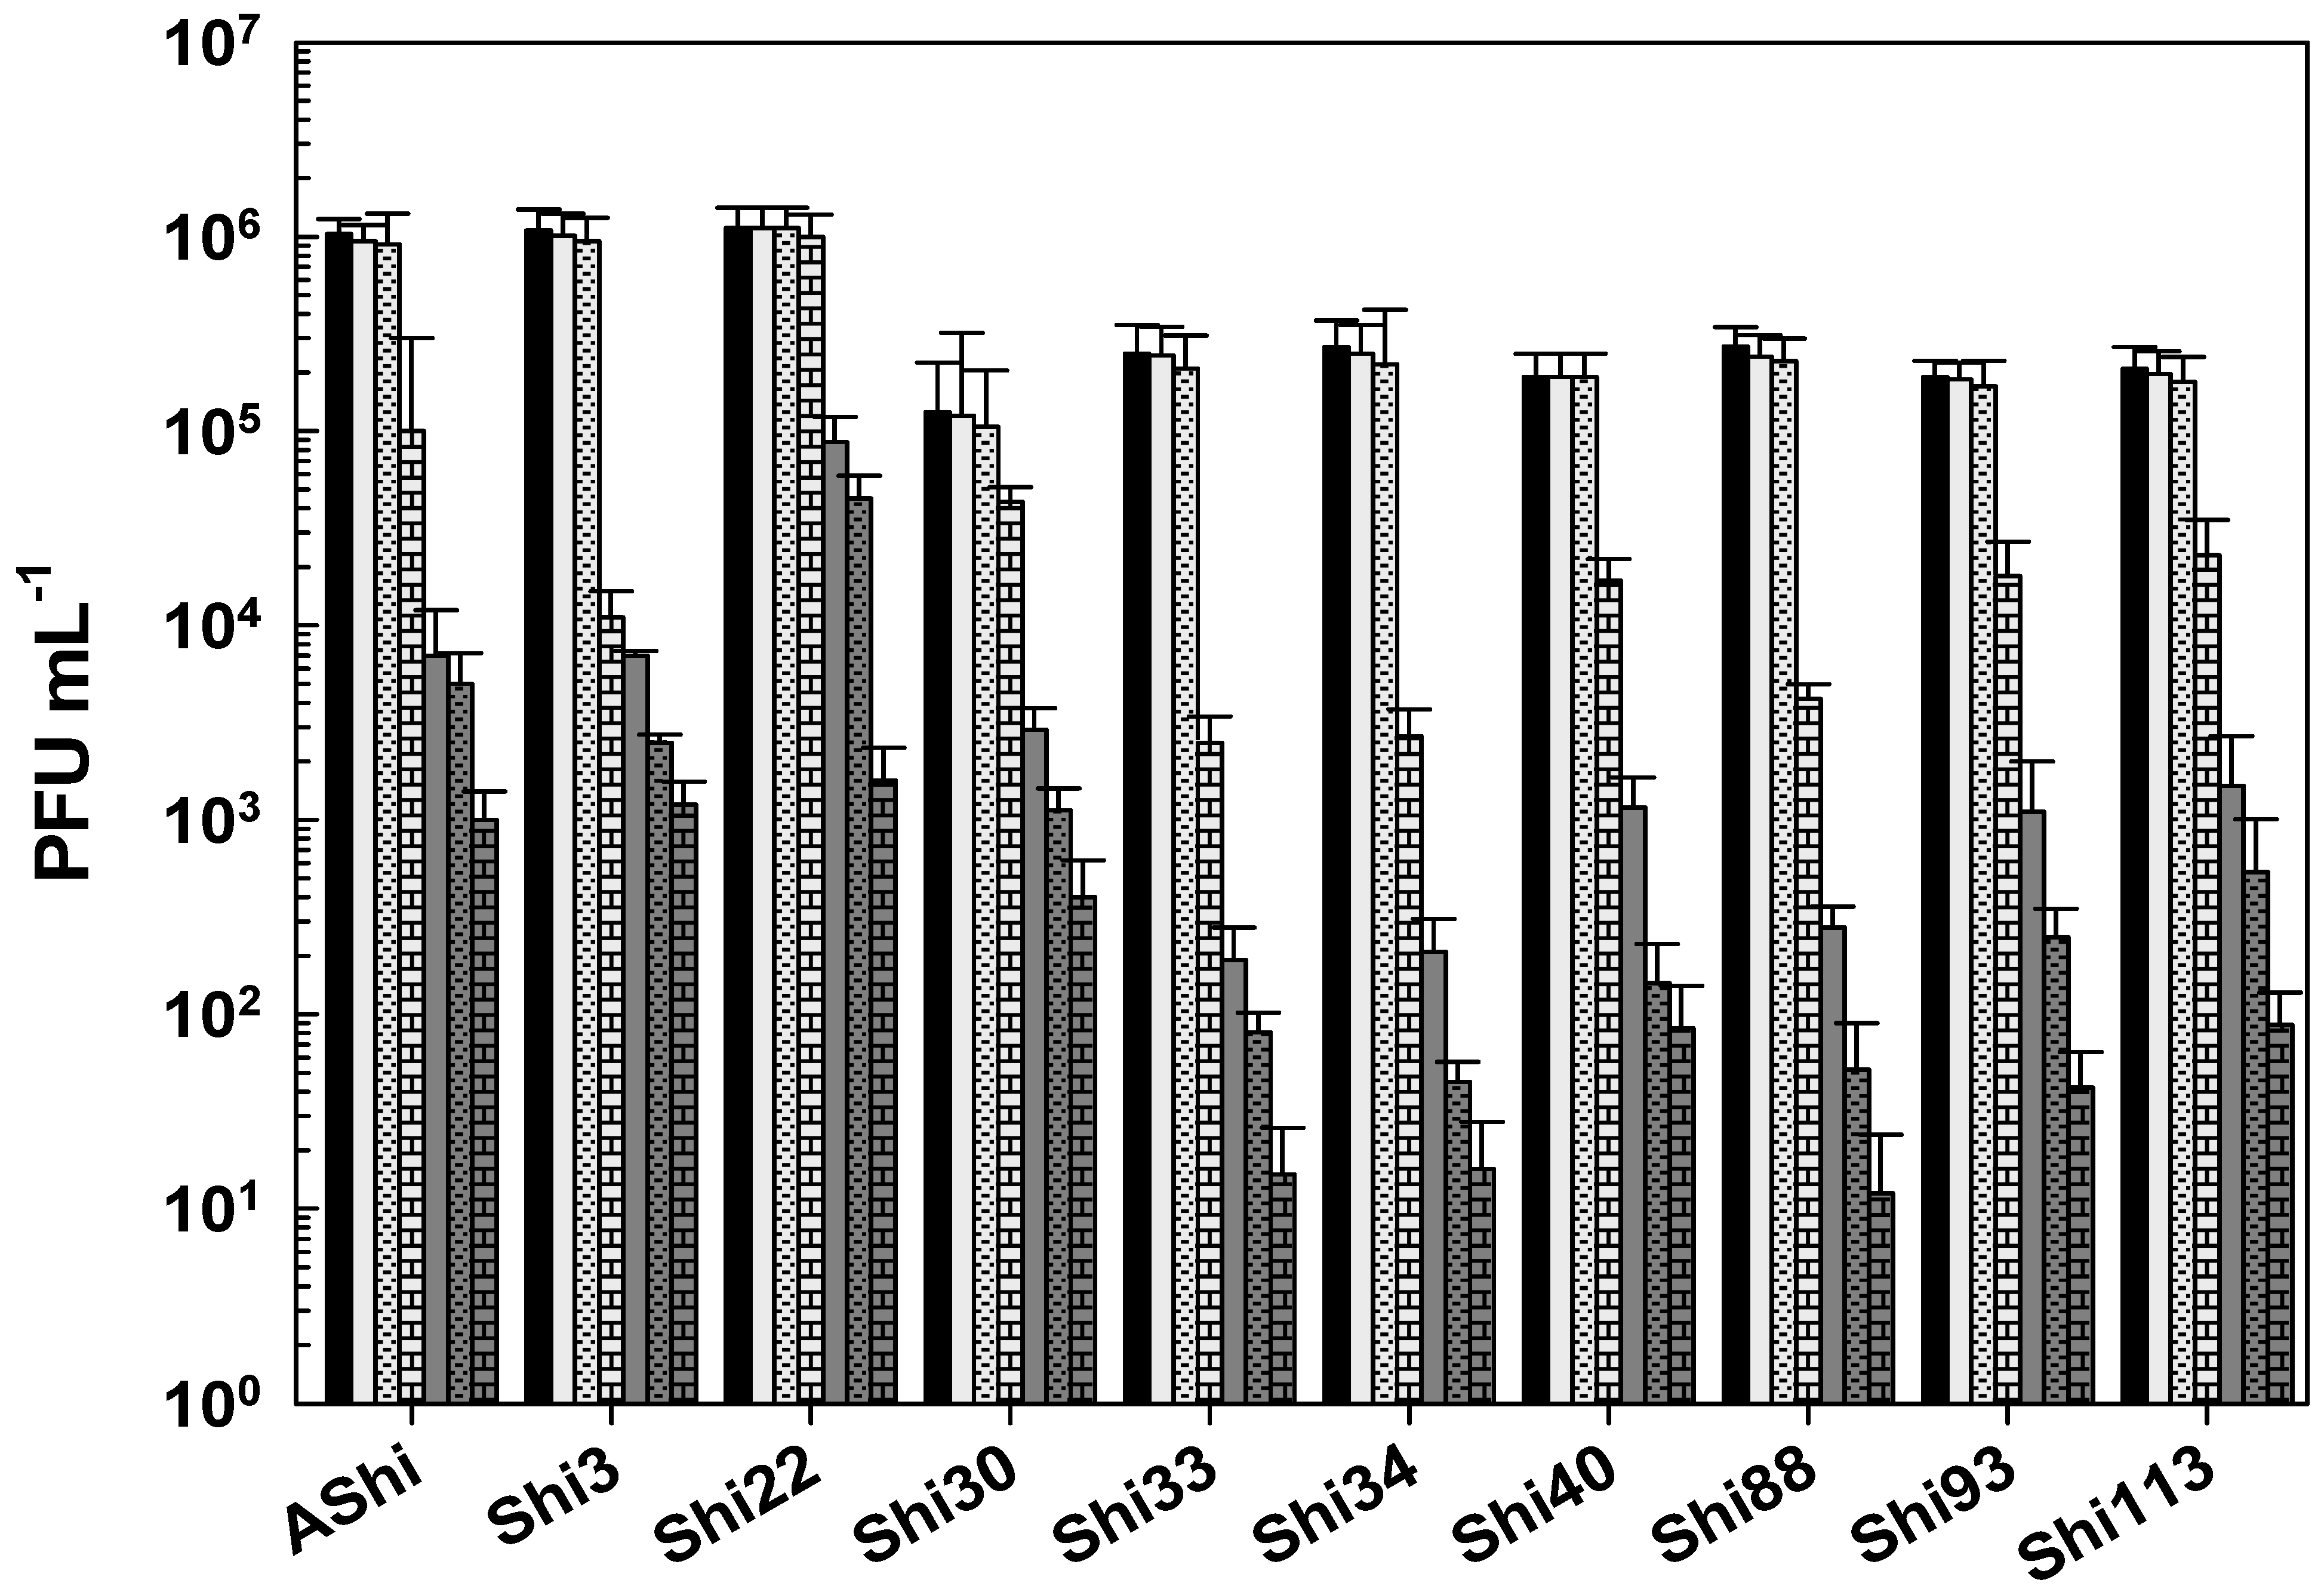 ) of hydrogen peroxide (H2O2) after 15 min (filled), 30 min (filled and dashed), and 60 min (filled and bricks) of incubation. Values are the mean ± standard deviation (error bars) of three determinations (treatment: phage, phage concentration, incubation time) were compared against controls using Student’s t test at p < 0.05.
) of hydrogen peroxide (H2O2) after 15 min (filled), 30 min (filled and dashed), and 60 min (filled and bricks) of incubation. Values are the mean ± standard deviation (error bars) of three determinations (treatment: phage, phage concentration, incubation time) were compared against controls using Student’s t test at p < 0.05.
) of hydrogen peroxide (H2O2) after 15 min (filled), 30 min (filled and dashed), and 60 min (filled and bricks) of incubation. Values are the mean ± standard deviation (error bars) of three determinations (treatment: phage, phage concentration, incubation time) were compared against controls using Student’s t test at p < 0.05.

| Additive or Biocide | Concentration | Time of Incubation |
|---|---|---|
| acetic acid | 2 and 4% | 5 min, 15 min, 30 min, 60 min and 24 h |
| lactic acid | 2 and 4% | 5 min, 15 min, 30 min, 60 min |
| citric acid | 2 and 4% | 5 min, 15 min, 30 min, 60 min |
| acetate | 2 and 4% | 60 min, 120 min and 24 h |
| lactate | 2 and 4% | 60 min, 120 min and 24 h |
| citrate | 2 and 4% | 60 min, 120 min and 24 h |
| benzoate | 0.1% | 60 min, 120 min and 24 h |
| sorbate | 0.3% | 60 min, 120 min and 24 h |
| propionate | 0.32% | 60 min, 120 min and 24 h |
| sodium hypochlorite | 50, 100 and 500 ppm | 1 min and 10 min |
| ethanol | 10, 70 and 96% | 15 min, 30 min, 60 min and 24 h |
| QAC | 2, 3 and 4% | 15 min, 30 min, 60 min and 24 h |
| H2O2 | 2, 3 and 4% | 15 min, 30 min, 60 min and 24 h |
Disclaimer/Publisher’s Note: The statements, opinions and data contained in all publications are solely those of the individual author(s) and contributor(s) and not of MDPI and/or the editor(s). MDPI and/or the editor(s) disclaim responsibility for any injury to people or property resulting from any ideas, methods, instructions or products referred to in the content. |
© 2025 by the authors. Licensee MDPI, Basel, Switzerland. This article is an open access article distributed under the terms and conditions of the Creative Commons Attribution (CC BY) license (https://creativecommons.org/licenses/by/4.0/).
Share and Cite
Tomat, D.; Casabonne, C.; Aquili, V.; Quiberoni, A. Evaluation of Food-Grade Additives on the Viability of Ten Shigella flexneri Phages in Food to Improve Safety in Agricultural Products. Viruses 2025, 17, 474. https://doi.org/10.3390/v17040474
Tomat D, Casabonne C, Aquili V, Quiberoni A. Evaluation of Food-Grade Additives on the Viability of Ten Shigella flexneri Phages in Food to Improve Safety in Agricultural Products. Viruses. 2025; 17(4):474. https://doi.org/10.3390/v17040474
Chicago/Turabian StyleTomat, David, Cecilia Casabonne, Virginia Aquili, and Andrea Quiberoni. 2025. "Evaluation of Food-Grade Additives on the Viability of Ten Shigella flexneri Phages in Food to Improve Safety in Agricultural Products" Viruses 17, no. 4: 474. https://doi.org/10.3390/v17040474
APA StyleTomat, D., Casabonne, C., Aquili, V., & Quiberoni, A. (2025). Evaluation of Food-Grade Additives on the Viability of Ten Shigella flexneri Phages in Food to Improve Safety in Agricultural Products. Viruses, 17(4), 474. https://doi.org/10.3390/v17040474