
Promoter Methylation of HIV Coreceptor-Related Genes CCR5 and CXCR4: Original Research

 ,
,  ,
,  , , , , , and
Abstract
1. Introduction
2. Materials and Methods
2.1. Study Population
2.2. Biological Samples
2.3. CpG Loci Selection
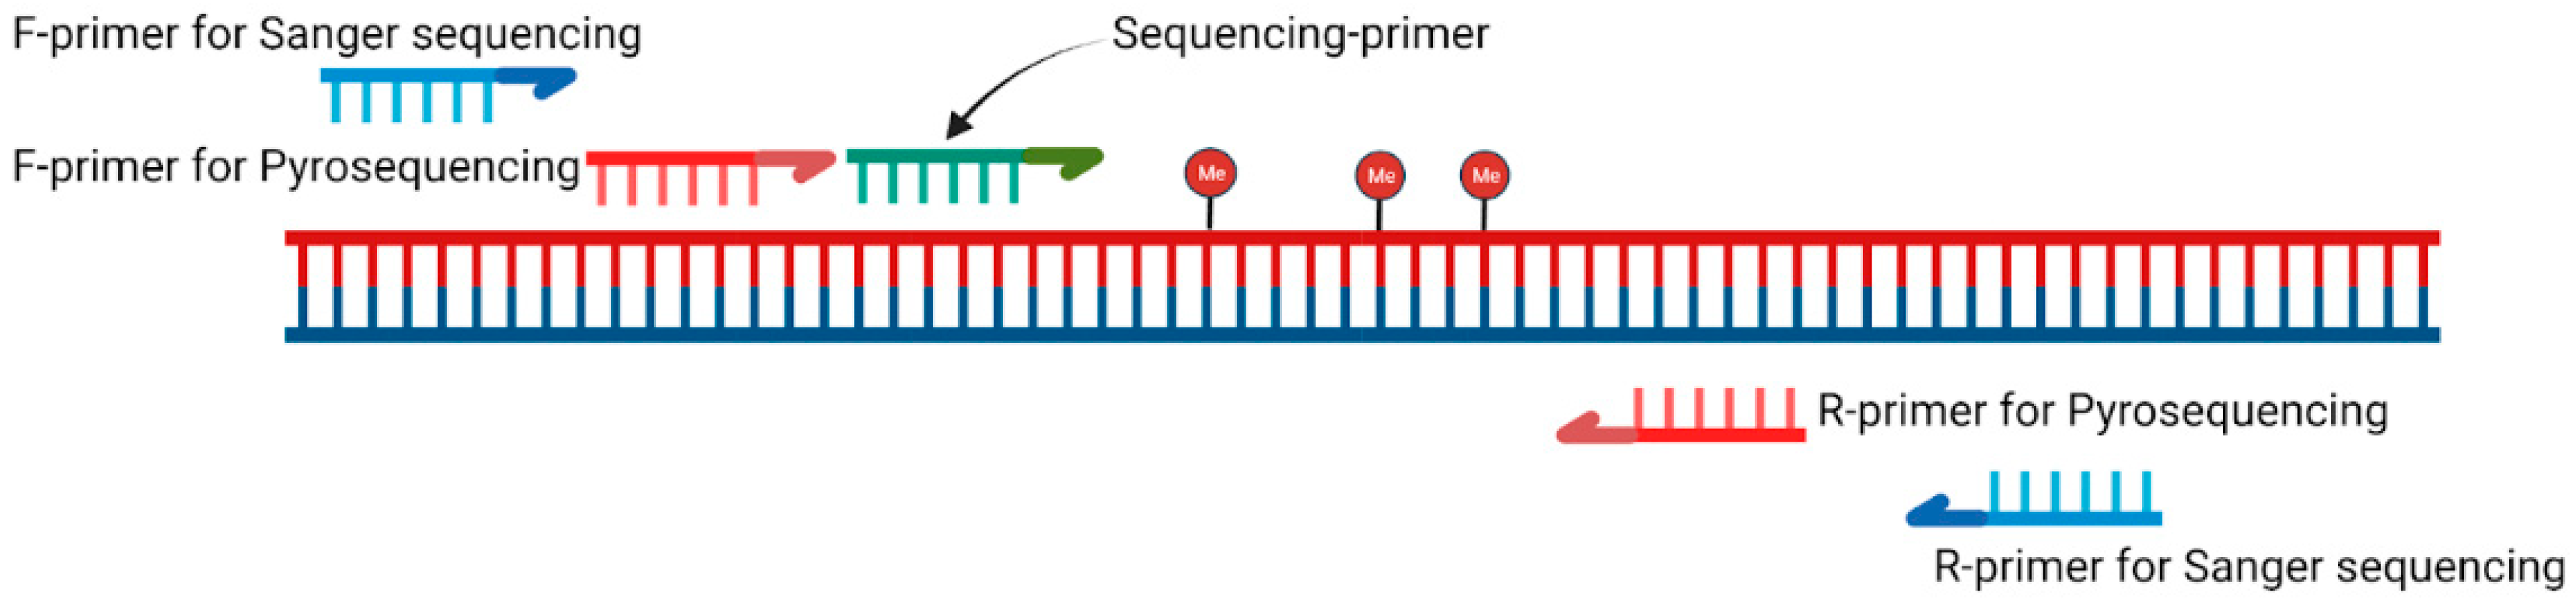
2.4. Primer Design
2.5. PCR Conditions
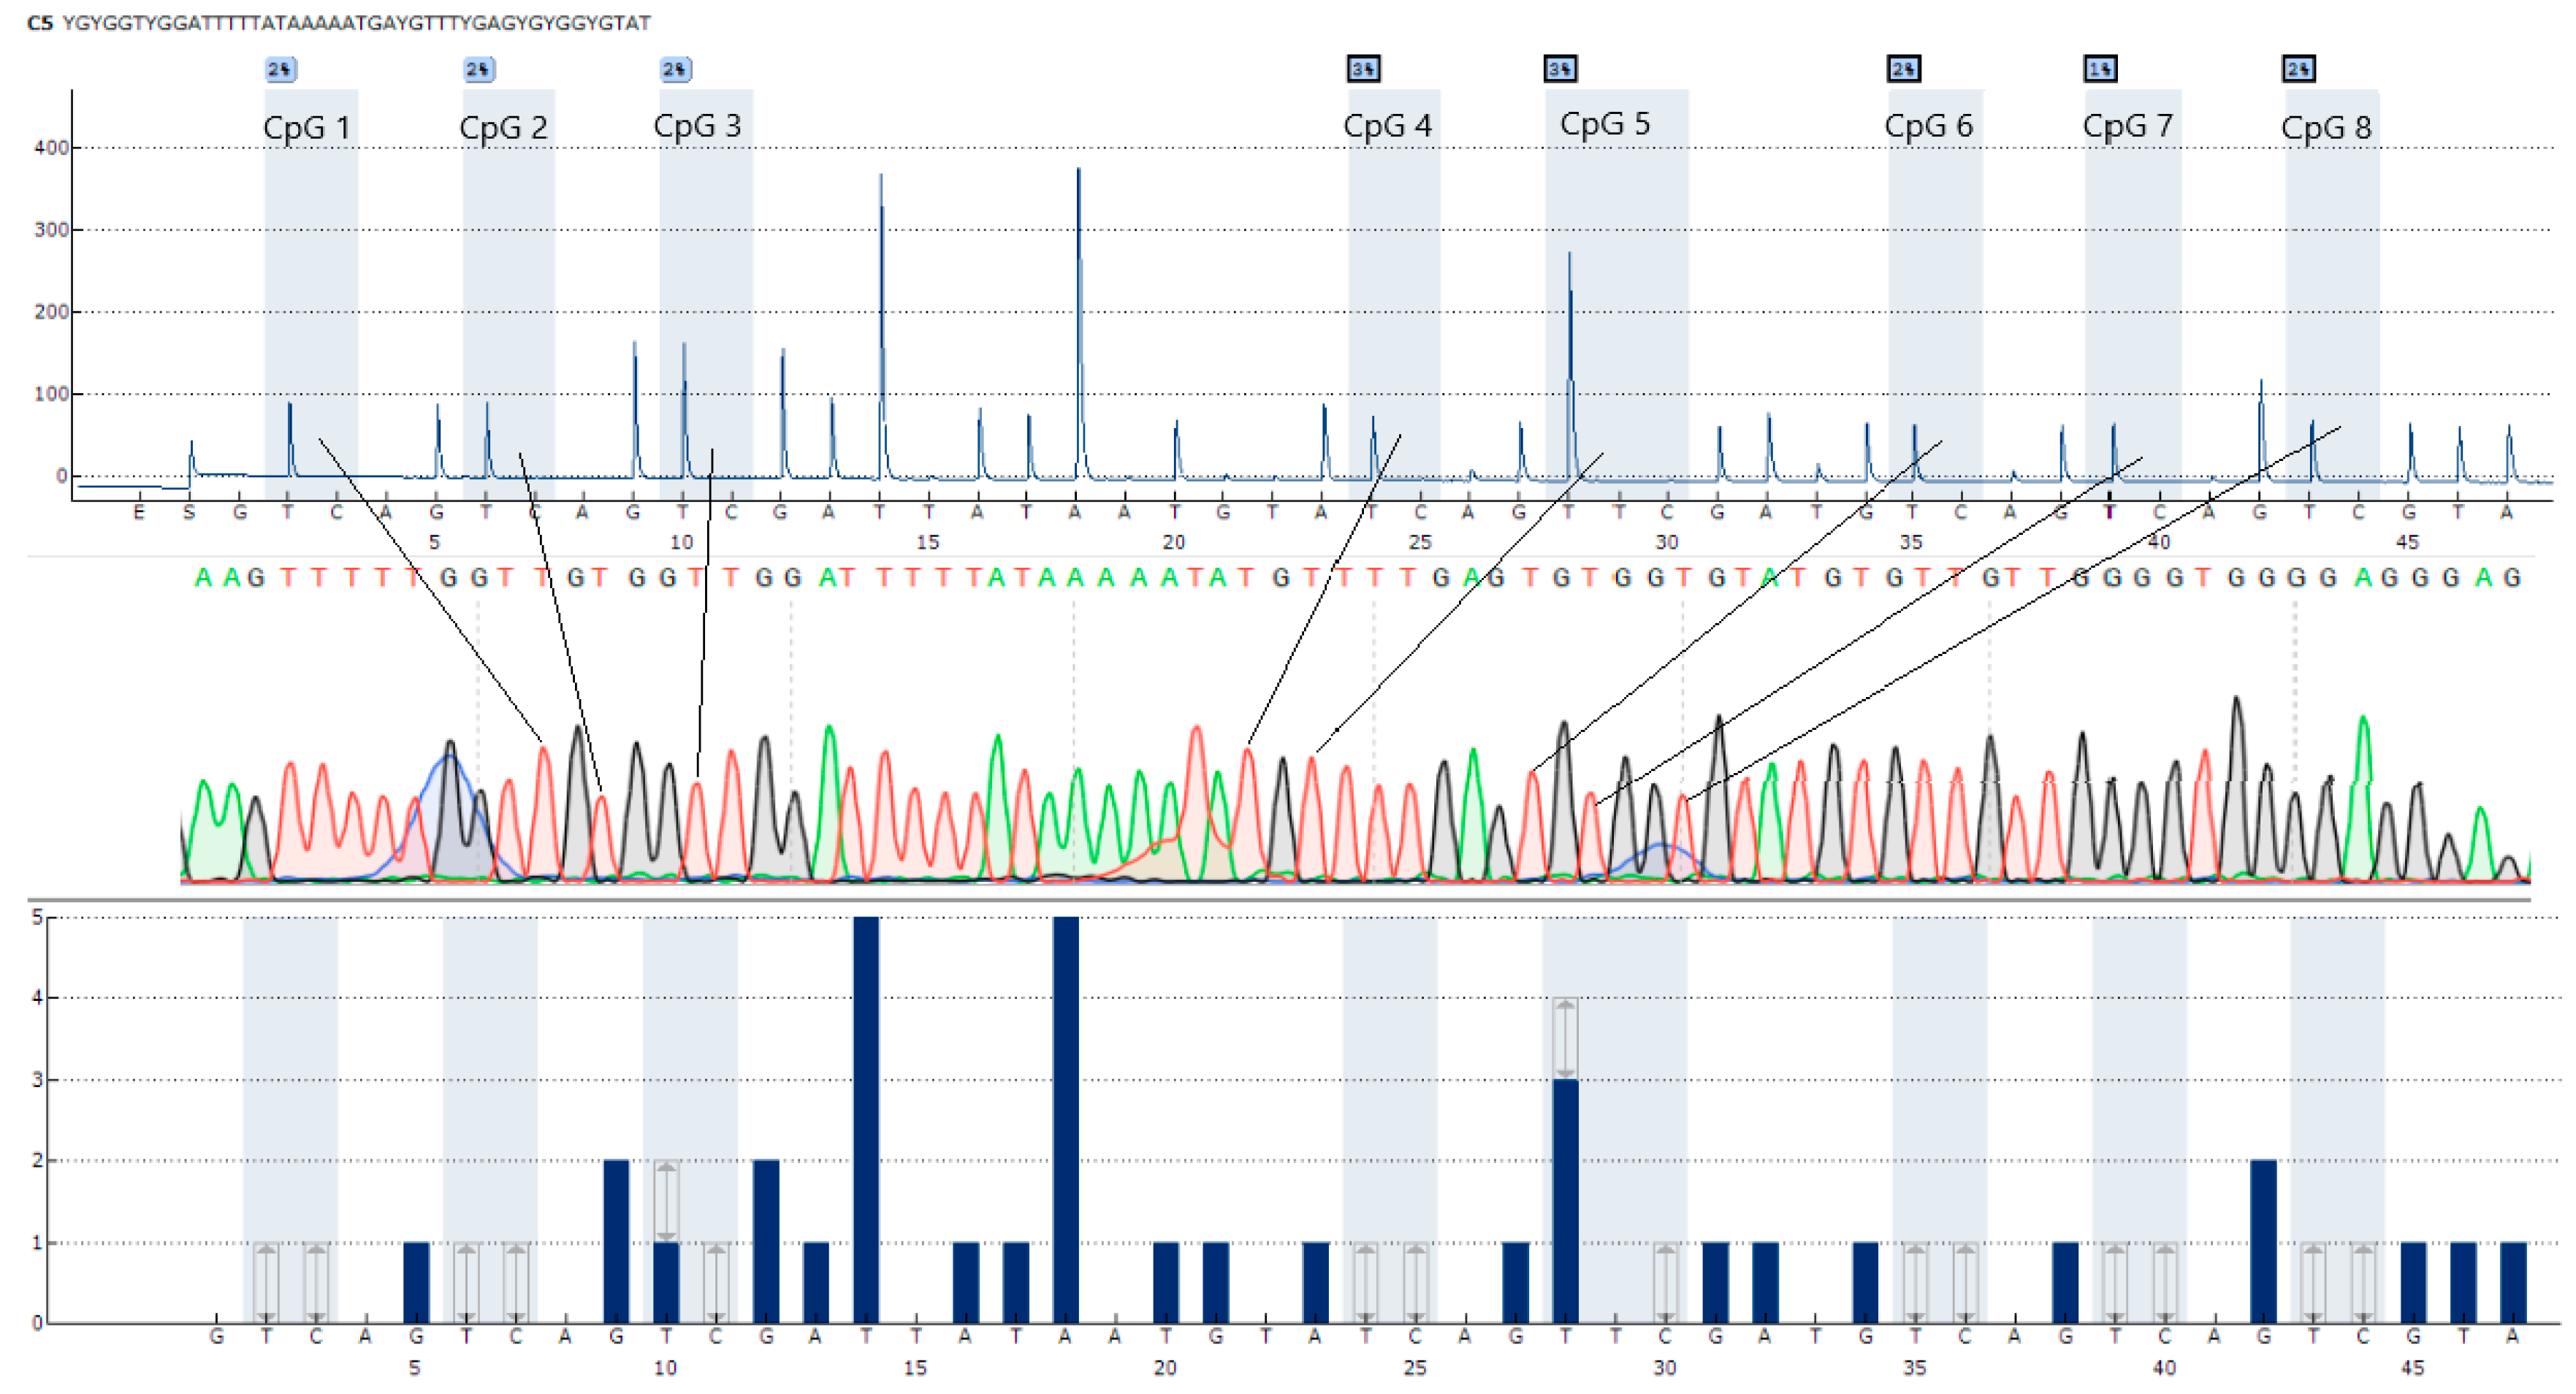
2.6. Pyrosequencing Conditions
2.7. Sanger Sequencing Conditions
2.8. Tropism Assay
2.9. Statistical Methods
3. Results
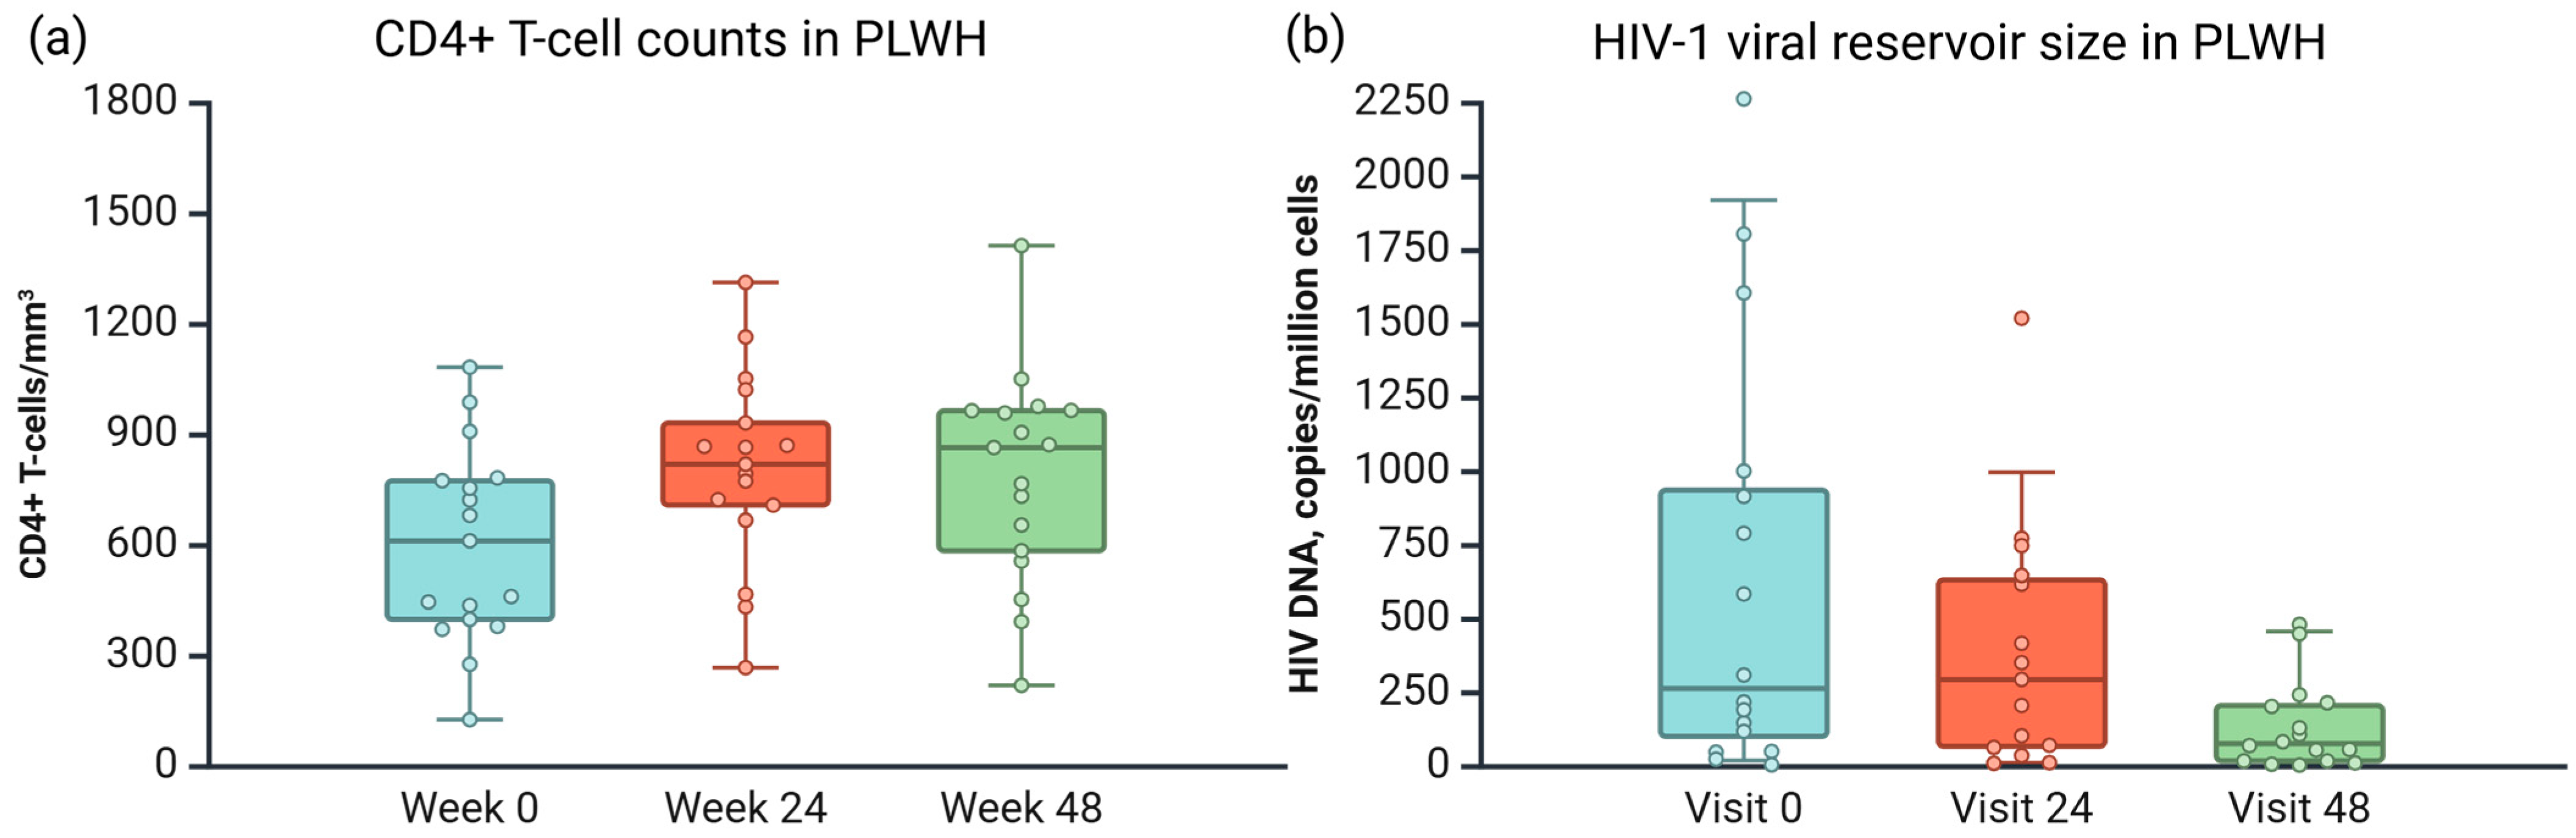
3.1. Sample Description
3.2. Development of CpG Locus Methylation Techniques
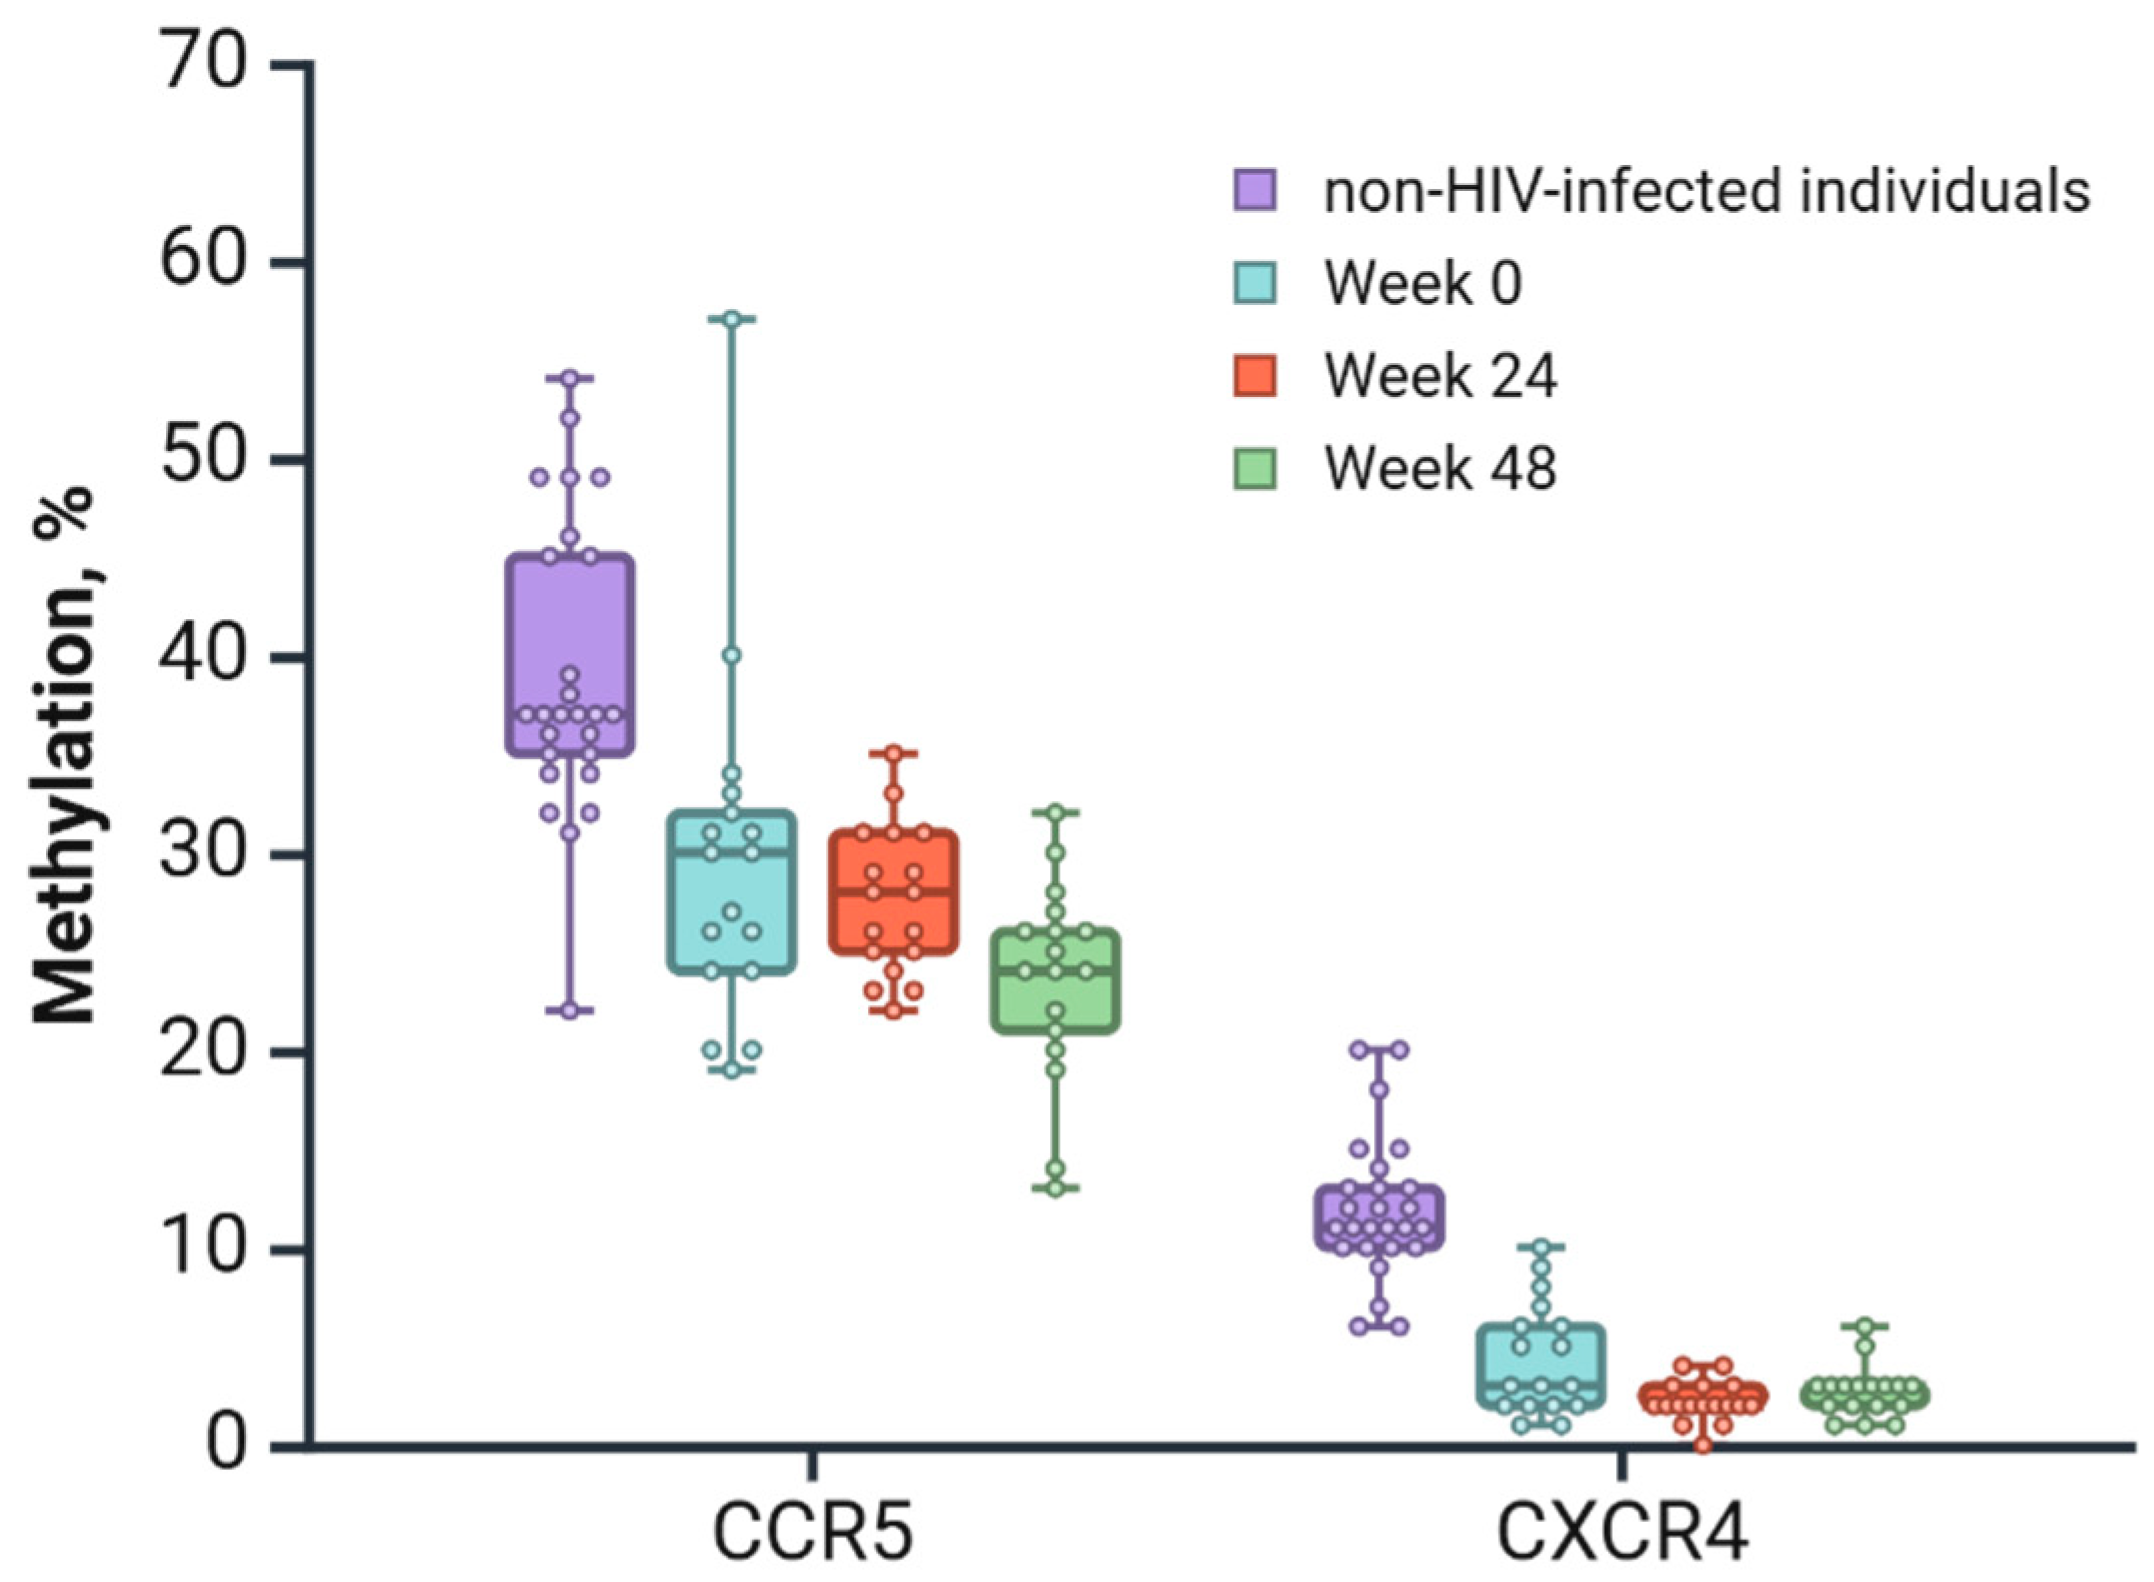
3.3. Application Results of the Developed Techniques
4. Discussion
Author Contributions
Funding
Institutional Review Board Statement
Informed Consent Statement
Data Availability Statement
Acknowledgments
Conflicts of Interest
Abbreviations
| HIV | Human immunodeficiency virus |
| ART | Antiretroviral therapy |
| CRIE | Central Research Institute of Epidemiology |
| DNA | Deoxyribonucleic acid |
| PCR | Polymerase chain reaction |
| ELISA | Enzyme-Linked Immunosorbent Assay |
| UCSC | University of California, Santa Cruz |
| EPD | Eukaryotic Promoter Database |
| NCBI | National Center for Biotechnology Information |
| ANOVA | Analysis of variance |
References
- Cohen, M.S.; Chen, Y.Q.; McCauley, M.; Gamble, T.; Hosseinipour, M.C.; Kumarasamy, N.; Hakim, J.G.; Kumwenda, J.; Grinsztejn, B.; Pilotto, J.H.S.; et al. Prevention of HIV-1 Infection with Early Antiretroviral Therapy. N. Engl. J. Med. 2011, 365, 493–505. [Google Scholar] [CrossRef] [PubMed]
- Rodger, A.J.; Cambiano, V.; Bruun, T.; Vernazza, P.; Collins, S.; Degen, O.; Corbelli, G.M.; Estrada, V.; Geretti, A.M.; Beloukas, A.; et al. Risk of HIV Transmission through Condomless Sex in Serodifferent Gay Couples with the HIV-Positive Partner Taking Suppressive Antiretroviral Therapy (PARTNER): Final Results of a Multicentre, Prospective, Observational Study. Lancet 2019, 393, 2428–2438. [Google Scholar] [CrossRef] [PubMed]
- Lima, V.D.; Lourenço, L.; Yip, B.; Hogg, R.S.; Phillips, P.; Montaner, J.S.G. AIDS Incidence and AIDS-Related Mortality in British Columbia, Canada, between 1981 and 2013: A Retrospective Study. Lancet HIV 2015, 2, e92–e97. [Google Scholar] [CrossRef] [PubMed]
- Bradley, H.; Mattson, C.L.; Beer, L.; Huang, P.; Shouse, R.L. Increased Antiretroviral Therapy Prescription and HIV Viral Suppression among Persons Receiving Clinical Care for HIV Infection. Aids 2016, 30, 2117–2124. [Google Scholar] [CrossRef]
- Davey, R.T.; Bhat, N.; Yoder, C.; Chun, T.-W.; Metcalf, J.A.; Dewar, R.; Natarajan, V.; Lempicki, R.A.; Adelsberger, J.W.; Miller, K.D.; et al. HIV-1 and T Cell Dynamics after Interruption of Highly Active Antiretroviral Therapy (HAART) in Patients with a History of Sustained Viral Suppression. Proc. Natl. Acad. Sci. USA 1999, 96, 15109–15114. [Google Scholar] [CrossRef]
- Pan, X.; Baldauf, H.-M.; Keppler, O.T.; Fackler, O.T. Restrictions to HIV-1 Replication in Resting CD4+ T Lymphocytes. Cell Res. 2013, 23, 876–885. [Google Scholar] [CrossRef]
- Siliciano, J.D.; Siliciano, R.F. Recent Developments in the Search for a Cure for HIV-1 Infection: Targeting the Latent Reservoir for HIV-1. J. Allergy Clin. Immunol. 2014, 134, 12–19. [Google Scholar] [CrossRef]
- Bleul, C.C.; Wu, L.; Hoxie, J.A.; Springer, T.A.; Mackay, C.R. The HIV Coreceptors CXCR4 and CCR5 Are Differentially Expressed and Regulated on Human T Lymphocytes. Proc. Natl. Acad. Sci. USA 1997, 94, 1925–1930. [Google Scholar] [CrossRef]
- Dai, J.; Agosto, L.M.; Baytop, C.; Yu, J.J.; Pace, M.J.; Liszewski, M.K.; O’Doherty, U. Human Immunodeficiency Virus Integrates Directly into Naïve Resting CD4 + T Cells but Enters Naïve Cells Less Efficiently than Memory Cells. J. Virol. 2009, 83, 4528–4537. [Google Scholar] [CrossRef]
- Vicenzi, E.; Liò, P.; Poli, G. The Puzzling Role of CXCR4 in Human Immunodeficiency Virus Infection. Theranostics 2013, 3, 18–25. [Google Scholar] [CrossRef]
- Bermejo, M.; Martín-Serrano, J.; Oberlin, E.; Pedraza, M.-A.; Serrano, A.; Santiago, B.; Caruz, A.; Loetscher, P.; Baggiolini, M.; Arenzana-Seisdedos, F.; et al. Activation of Blood T Lymphocytes Down-Regulates CXCR4 Expression and Interferes with Propagation of X4 HIV Strains. Eur. J. Immunol. 1998, 28, 3192–3204. [Google Scholar] [CrossRef]
- Grande, F.; Occhiuzzi, M.; Rizzuti, B.; Ioele, G.; De Luca, M.; Tucci, P.; Svicher, V.; Aquaro, S.; Garofalo, A. CCR5/CXCR4 Dual Antagonism for the Improvement of HIV Infection Therapy. Molecules 2019, 24, 550. [Google Scholar] [CrossRef]
- Schweighardt, B.; Roy, A.-M.; Meiklejohn, D.A.; Grace, E.J.; Moretto, W.J.; Heymann, J.J.; Nixon, D.F. R5 Human Immunodeficiency Virus Type 1 (HIV-1) Replicates More Efficiently in Primary CD4+ T-Cell Cultures Than X4 HIV-1. J. Virol. 2004, 78, 9164–9173. [Google Scholar] [CrossRef] [PubMed]
- Hunt, J.S.; Romanelli, F. Maraviroc, a CCR5 Coreceptor Antagonist That Blocks Entry of Human Immunodeficiency Virus Type 1. Pharmacotherapy 2009, 29, 295–304. [Google Scholar] [CrossRef]
- Archer, J.; Braverman, M.S.; Taillon, B.E.; Desany, B.; James, I.; Harrigan, P.R.; Lewis, M.; Robertson, D.L. Detection of Low-Frequency Pretherapy Chemokine (CXC Motif) Receptor 4 (CXCR4)-Using HIV-1 with Ultra-Deep Pyrosequencing. AIDS 2009, 23, 1209–1218. [Google Scholar] [CrossRef]
- Brumme, Z.L.; Goodrich, J.; Mayer, H.B.; Brumme, C.J.; Henrick, B.M.; Wynhoven, B.; Asselin, J.J.; Cheung, P.K.; Hogg, R.S.; Montaner, J.S.G.; et al. Molecular and Clinical Epidemiology of CXCR4-Using HIV-1 in a Large Population of Antiretroviral-Naive Individuals. J. Infect. Dis. 2005, 192, 466–474. [Google Scholar] [CrossRef]
- Ostrowski, M.A.; Justement, S.J.; Catanzaro, A.; Hallahan, C.A.; Ehler, L.A.; Mizell, S.B.; Kumar, P.N.; Mican, J.A.; Chun, T.W.; Fauci, A.S. Expression of Chemokine Receptors CXCR4 and CCR5 in HIV-1-Infected and Uninfected Individuals. J. Immunol. 1998, 161, 3195–3201. [Google Scholar] [CrossRef]
- Nazari, R.; Joshi, S. CCR5 as Target for HIV-1 Gene Therapy. Curr. Gene Ther. 2008, 8, 264–272. [Google Scholar] [CrossRef]
- Catano, G.; Chykarenko, Z.A.; Mangano, A.; Anaya, J.-M.; He, W.; Smith, A.; Bologna, R.; Sen, L.; Clark, R.A.; Lloyd, A.; et al. Concordance of CCR5 Genotypes That Influence Cell-Mediated Immunity and HIV-1 Disease Progression Rates. J. Infect. Dis. 2011, 203, 263–272. [Google Scholar] [CrossRef]
- Gornalusse, G.G.; Mummidi, S.; Gaitan, A.A.; Jimenez, F.; Ramsuran, V.; Picton, A.; Rogers, K.; Manoharan, M.S.; Avadhanam, N.; Murthy, K.K.; et al. Epigenetic Mechanisms, T-Cell Activation, and CCR5 Genetics Interact to Regulate T-Cell Expression of CCR5, the Major HIV-1 Coreceptor. Proc. Natl. Acad. Sci. USA 2015, 112, E4762–E4771. [Google Scholar] [CrossRef]
- Zhao, W.; Pahar, B.; Borda, J.T.; Alvarez, X.; Sestak, K. A Decline in CCL3-5 Chemokine Gene Expression during Primary Simian-Human Immunodeficiency Virus Infection. PLoS ONE 2007, 2, e726. [Google Scholar] [CrossRef] [PubMed]
- Ni, J.; Wang, D.; Wang, S. The CCR5-Delta32 Genetic Polymorphism and HIV-1 Infection Susceptibility: A Meta-Analysis. Open Med. 2018, 13, 467–474. [Google Scholar] [CrossRef] [PubMed]
- Lacal, I.; Ventura, R. Epigenetic Inheritance: Concepts, Mechanisms and Perspectives. Front. Mol. Neurosci. 2018, 11, 292. [Google Scholar] [CrossRef] [PubMed]
- Tseng, C.-C.; Wong, M.-C.; Liao, W.-T.; Chen, C.-J.; Lee, S.-C.; Yen, J.-H.; Chang, S.-J. Genetic Variants in Transcription Factor Binding Sites in Humans: Triggered by Natural Selection and Triggers of Diseases. Int. J. Mol. Sci. 2021, 22, 4187. [Google Scholar] [CrossRef]
- Jones, P.A.; Takai, D. The Role of DNA Methylation in Mammalian Epigenetics. Science 2001, 293, 1068–1070. [Google Scholar] [CrossRef]
- Issa, J.-P.J. Methylation and Prognosis: Of Molecular Clocks and Hypermethylator Phenotypes. Clin. Cancer Res. 2003, 9, 2879–2881. [Google Scholar]
- Novik, K.L.; Nimmrich, I.; Genc, B.; Maier, S.; Piepenbrock, C.; Olek, A.; Beck, S. Epigenomics: Genome-Wide Study of Methylation Phenomena. Curr. Issues Mol. Biol. 2002, 4, 111–128. [Google Scholar] [CrossRef]
- Garinis, G.A.; Patrinos, G.P.; Spanakis, N.E.; Menounos, P.G. DNA Hypermethylation: When Tumour Suppressor Genes Go Silent. Hum. Genet. 2002, 111, 115–127. [Google Scholar] [CrossRef]
- Zou, H.-Z.; Yu, B.-M.; Wang, Z.-W.; Sun, J.-Y.; Cang, H.; Gao, F.; Li, D.H.; Zhao, R.; Feng, G.-G.; Yi, J. Detection of Aberrant P16 Methylation in the Serum of Colorectal Cancer Patients. Clin. Cancer Res. 2002, 8, 188–191. [Google Scholar]
- Blazkova, J.; Trejbalova, K.; Gondois-Rey, F.; Halfon, P.; Philibert, P.; Guiguen, A.; Verdin, E.; Olive, D.; Van Lint, C.; Hejnar, J.; et al. CpG Methylation Controls Reactivation of HIV from Latency. PLoS Pathog. 2009, 5, e1000554. [Google Scholar] [CrossRef]
- Corbeau, P.; Reynes, J. CCR5 Antagonism in HIV Infection: Ways, Effects, and Side Effects. Aids 2009, 23, 1931–1943. [Google Scholar] [CrossRef] [PubMed]
- Claireaux, M.; Robinot, R.; Kervevan, J.; Patgaonkar, M.; Staropoli, I.; Brelot, A.; Nouël, A.; Gellenoncourt, S.; Tang, X.; Héry, M.; et al. Low CCR5 Expression Protects HIV-Specific CD4+ T Cells of Elite Controllers from Viral Entry. Nat. Commun. 2022, 13, 521. [Google Scholar] [CrossRef] [PubMed]
- Lan, X.; Cheng, K.; Chandel, N.; Lederman, R.; Jhaveri, A.; Husain, M.; Malhotra, A.; Singhal, P.C. High Glucose Enhances HIV Entry into T Cells through Upregulation of CXCR4. J. Leukoc. Biol. 2013, 94, 769–777. [Google Scholar] [CrossRef] [PubMed]
- WHO. WHO Guidelines Approved by the Guidelines Review Committee//Global Recommendations on Physical Activity for Health; WHO: Geneva, Switzerland, 2010. [Google Scholar]
- Consolidated Guidelines on HIV Testing Services for a Changing Epidemic. Available online: https://www.who.int/publications/i/item/who-cds-hiv-19.31 (accessed on 1 March 2025).
- Copy Number Calculator for Realtime PCR|Science Primer. Available online: http://scienceprimer.com/copy-number-calculator-for-realtime-pcr (accessed on 1 February 2024).
- Rother, K.I.; Silke, J.; Georgiev, O.; Schaffner, W.; Matsuo, K. Influence of DNA Sequence and Methylation Status on Bisulfite Conversion of Cytosine Residues. Anal. Biochem. 1995, 231, 263–265. [Google Scholar] [CrossRef]
- University of California Santa Cruz (UCSC). Available online: http://genome.ucsc.edu/ (accessed on 1 March 2025).
- Mummidi, S.; Adams, L.M.; VanCompernolle, S.E.; Kalkonde, M.; Camargo, J.F.; Kulkarni, H.; Bellinger, A.S.; Bonello, G.; Tagoh, H.; Ahuja, S.S.; et al. Production of Specific mRNA Transcripts, Usage of an Alternate Promoter, and Octamer-Binding Transcription Factors Influence the Surface Expression Levels of the HIV Coreceptor CCR5 on Primary T Cells. J. Immunol. 2007, 178, 5668–5681. [Google Scholar] [CrossRef]
- The Eukaryotic Promoter Database. Available online: https://epd.expasy.org/epd/ (accessed on 4 October 2024).
- GEO Accession Viewer. Available online: https://www.ncbi.nlm.nih.gov/geo/query/acc.cgi?acc=GPL13534 (accessed on 1 February 2024).
- National Center for Biotechnology Information. Available online: https://www.ncbi.nlm.nih.gov/ (accessed on 1 February 2024).
- Hattori, N.; Liu, Y.-Y.; Ushijima, T. DNA Methylation Analysis. In Inflammation and Cancer; Jenkins, B.J., Ed.; Springer: New York, NY, USA, 2023; Volume 2691, pp. 165–183. ISBN 978-1-07-163330-4. [Google Scholar]
- Scientific Image and Illustration Software|BioRender. Available online: https://www.biorender.com/ (accessed on 3 February 2024).
- OligoAnalyzer Tool—Primer Analysis and Tm Calculator|IDT. Available online: https://www.idtdna.com/pages/tools/oligoanalyzer (accessed on 1 February 2024).
- Kristensen, L.S.; Mikeska, T.; Krypuy, M.; Dobrovic, A. Sensitive Melting Analysis after Real Time-Methylation Specific PCR (SMART-MSP): High-Throughput and Probe-Free Quantitative DNA Methylation Detection. Nucleic Acids Res. 2008, 36, e42. [Google Scholar] [CrossRef]
- Rand, K.; Qu, W.; Ho, T.; Clark, S.J.; Molloy, P. Conversion-Specific Detection of DNA Methylation Using Real-Time Polymerase Chain Reaction (ConLight-MSP) to Avoid False Positives. Methods 2002, 27, 114–120. [Google Scholar] [CrossRef]
- Geno2pheno Coreceptor. Available online: https://coreceptor.geno2pheno.org/ (accessed on 1 March 2025).
- Parrish, R.R.; Day, J.J.; Lubin, F.D. Direct Bisulfite Sequencing for Examination of DNA Methylation with Gene and Nucleotide Resolution from Brain Tissues. Curr. Protoc. Neurosci. 2012, 60, 7–24. [Google Scholar] [CrossRef]
- Esman, A.; Salamaikina, S.; Vinokurov, M.; Saleeva, D.; Kirichenko, A.; Sikamov, K.; Syrkina, A.; Pokrovskaya, A.; Akimkin, V.G. DTG 3TC HIV EPI study.xlsx. figshare. Dataset. Available online: https://figshare.com/articles/dataset/DTG_3TC_HIV_EPI_study_xlsx/25239601/1?file=49645956 (accessed on 1 March 2025).
- R: The R Project for Statistical Computing. Available online: https://www.r-project.org/ (accessed on 6 February 2024).
- Wickham, H. Ggplot2 Elegant Graphics for Data Analysis; Use R!; Springer International Publishing: Cham, Switzerland, 2016; ISBN 978-3-319-24275-0. [Google Scholar]
- Poulin, M.; Zhou, J.Y.; Yan, L.; Shioda, T. Pyrosequencing Methylation Analysis. In Cancer Epigenetics for Precision Medicine; Dumitrescu, R.G., Verma, M., Eds.; Springer: New York, NY, USA, 2018; Volume 1856, pp. 283–296. ISBN 978-1-4939-8750-4. [Google Scholar]
- Jones, P.A. Functions of DNA Methylation: Islands, Start Sites, Gene Bodies and Beyond. Nat. Rev. Genet. 2012, 13, 484–492. [Google Scholar] [CrossRef]
- Reed, K.; Poulin, M.L.; Yan, L.; Parissenti, A.M. Comparison of Bisulfite Sequencing PCR with Pyrosequencing for Measuring Differences in DNA Methylation. Anal. Biochem. 2010, 397, 96–106. [Google Scholar] [CrossRef]
- Dalecki, A.G.; Greer, B.D.; Duverger, A.; Strange, E.L.; Carlin, E.; Wagner, F.; Shi, B.; Lowman, K.E.; Perez, M.; Tidwell, C.; et al. Host T Cell Dedifferentiation Effects Drive HIV-1 Latency Stability. J. Virol. 2022, 96, e01974-21. [Google Scholar] [CrossRef] [PubMed]
- Buescher, J.L.; Martinez, L.B.; Sato, S.; Okuyama, S.; Ikezu, T. YY1 and FoxD3 Regulate Antiretroviral Zinc Finger Protein OTK18 Promoter Activation Induced by HIV-1 Infection. J. Neuroimmune Pharmacol. 2009, 4, 103–115. [Google Scholar] [CrossRef] [PubMed]
- Taracha, A.; Kotarba, G.; Wilanowski, T. Neglected Functions of TFCP2/TFCP2L1/UBP1 Transcription Factors May Offer Valuable Insights into Their Mechanisms of Action. Int. J. Mol. Sci. 2018, 19, 2852. [Google Scholar] [CrossRef] [PubMed]
- Moriuchi, M.; Moriuchi, H.; Turner, W.; Fauci, A.S. Cloning and Analysis of the Promoter Region of CXCR4, a Coreceptor for HIV-1 Entry. J. Immunol. 1997, 159, 4322–4329. [Google Scholar] [CrossRef] [PubMed]


| CCR5 (GRCh37.p13) Chr 3—NC_000003.12 | |||||
|---|---|---|---|---|---|
| cg22984586 * | CpG 1 | CpG 2 | CpG 3 | CpG 4 | cg07616471 * |
| 46411541 | 46412248 | 46412333 | 46412454 | 46412478 | 46413711 |
| JASPAR CORE-predicted transcription factors | |||||
| REL, FOXD3, FOXF2 | – | – | ZNF784 | ||
| CXCR4 (GRCh37.p13) Chr 2—NC_000002.12 | |||||||||
|---|---|---|---|---|---|---|---|---|---|
| cg25982140 * | CpG 1 | CpG 2 | CpG 3 | CpG 4 | CpG 5 | CpG 6 | CpG 7 | CpG 8 | cg12311057 * |
| 136875681 | 136875732 | 136875734 | 136875738 | 136875756 | 136875761 | 136875765 | 136875767 | 136875770 | 136875897 |
| JASPAR CORE-predicted transcription factors | |||||||||
| ERF::NHLH1, Tfcp2l1 | ERF::NHLH1, Tfcp2l1 | ERF::NHLH1, Tfcp2l1 | FOXE1 | — | — | Nrf1 | Nrf1 | ||
| Gene | Primers | P/S | 5′-Sequence-3′ | Amplicon Size | Dispensation Order for Pyrosequencing |
|---|---|---|---|---|---|
| CCR5 | CCR5-Fp | P | TATGATTGATTTGTATAGTTTATTTGGTTA | Fp + Rp 121 | – |
| CCR5-Rp | P | biotin-CTCATCTCAAAAACTAACTAAC | |||
| CCR5-F1p | P | GTAGTGGGATGAGTAGAGAATA | F1p + Rp 331 | – | |
| CCR5-S2 | P | GAAGAATTGTTTTTTGATTTTTTT | – | YGTTTTTAATATAT | |
| CCR5-S3 | P | GGTTAGAAGAGTTGAGATATT | – | YGTTTTTTTATAAGAAATTTTTTTYGGTAAG | |
| CCR5-Fs | S | GTGGGTTTTTGATTAGATGAATGTA | Fs + Rs 517 | – | |
| CCR5-Rs | S | CCAAACTATAACCCTTTCCTTATCTT | |||
| CXCR4 | CXCR4-Fp | P | GTG GTT ATT GGA GTA TTT AGG T | Fp + Rp 168 | – |
| CXCR4-Rp | P | biotin-TCT ACC CCT CTC CCC CA | |||
| CXCR4-S | P | GTTAATAAATTGAAGTTTTTGGT | – | YGYGGTYGGATTTTTATAAAAATAYGTTTYGAGYGYGGYGTAT | |
| CXCR4-Fs | S | ATGATAAAGTAGGTTGAAATTGGATTT | Fs + Rs 376 | – | |
| CXCR4-Rs | S | TCCCTCAAACTTAAAAAATACCTCTA |
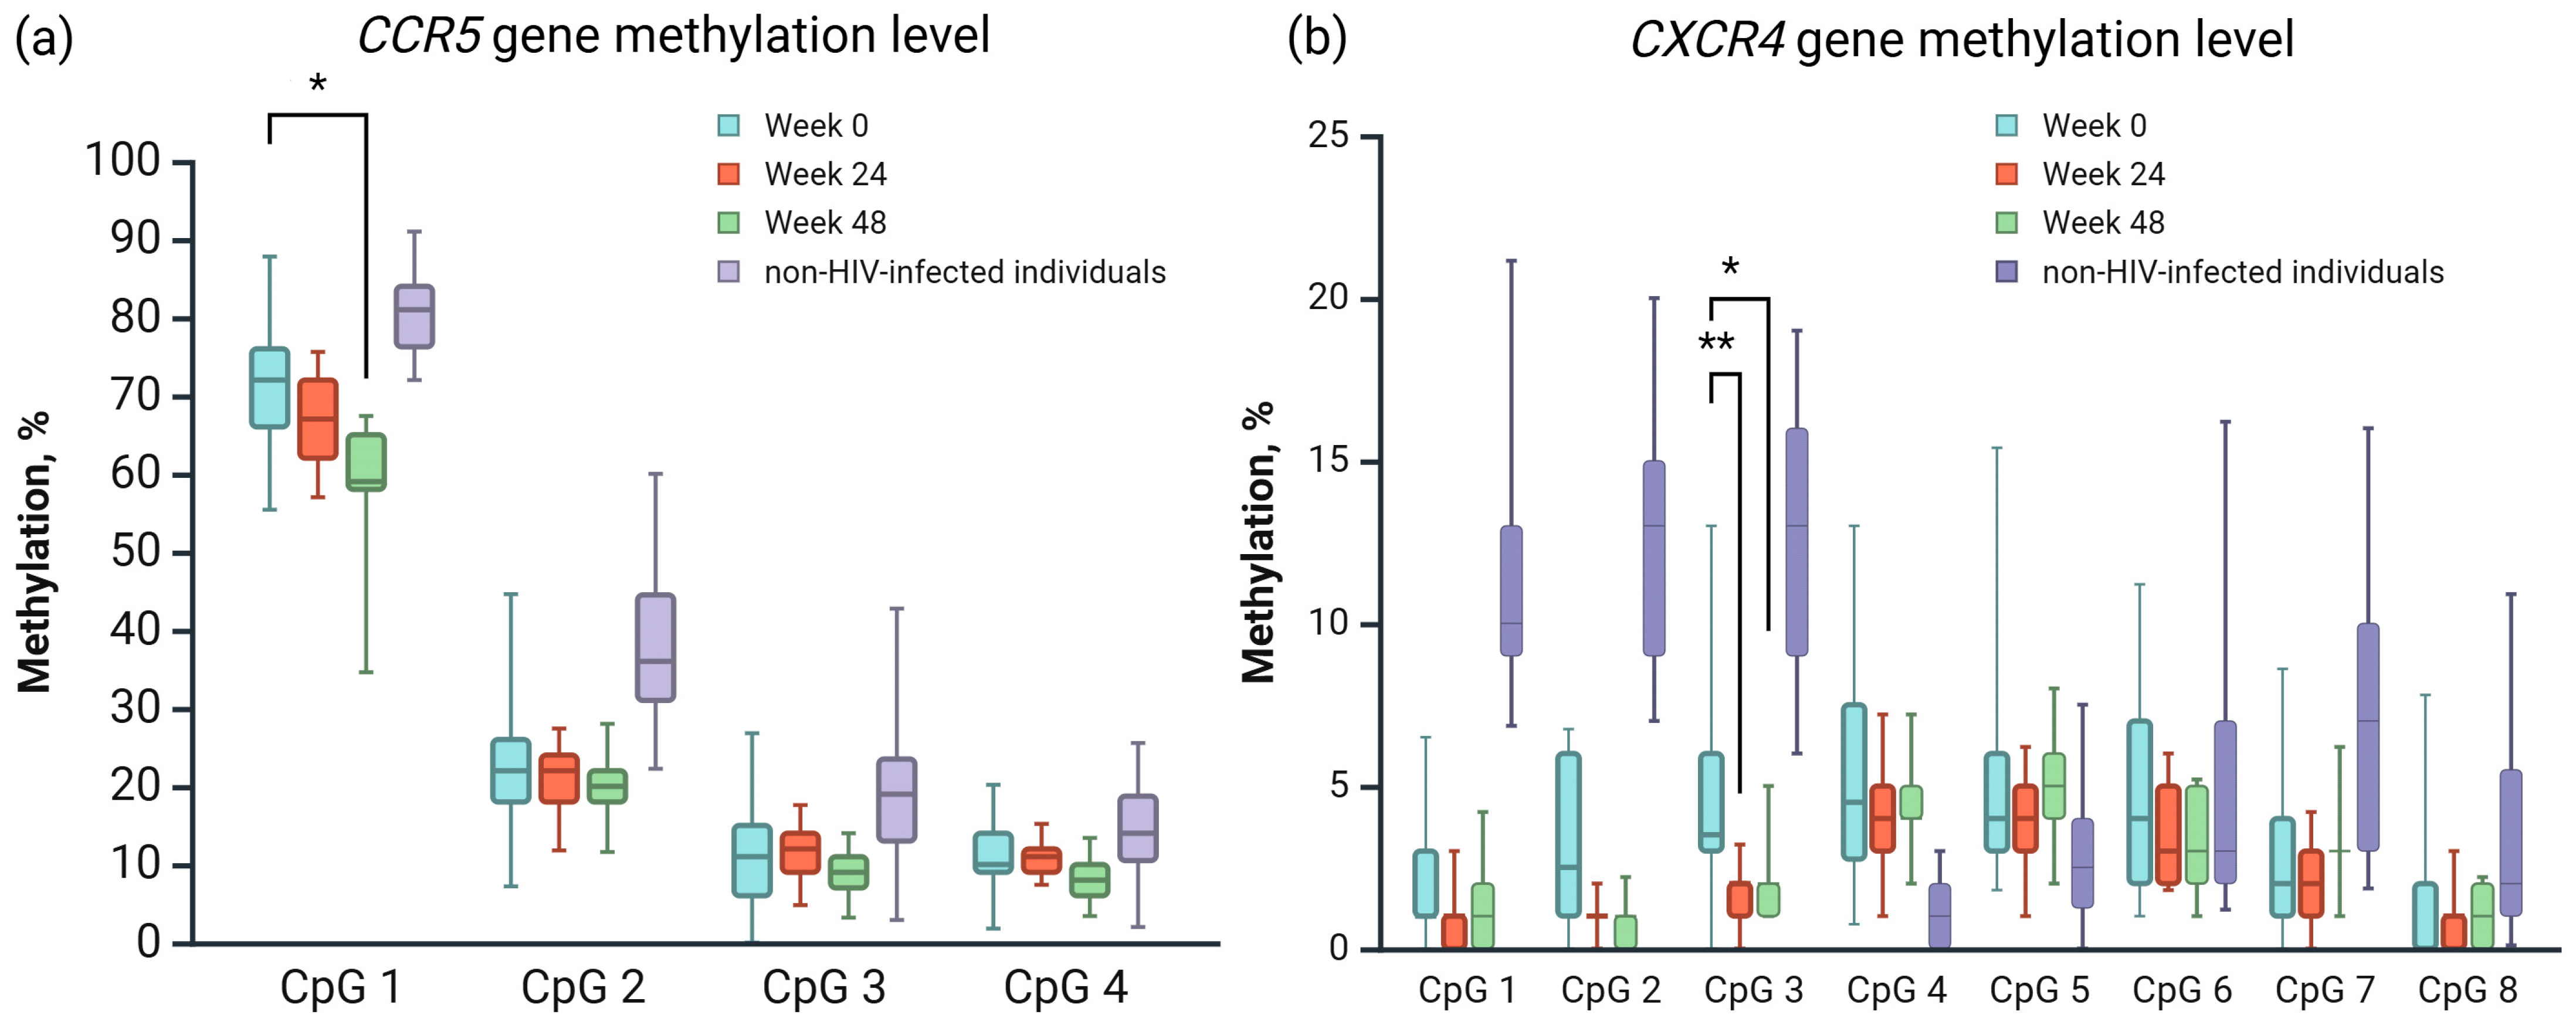
| Week 0 | Week 24 | Week 48 | p-Val | CI 95% | |
|---|---|---|---|---|---|
| CCR5 (CpG 1) | 71.24 | 66.88 | 58.24 | 0.0059 * | 2.3473–23.6527 |
| CXCR4 (CpG 3) | 4.75 | 1.53 | 2.12 | 0.0013 ** | 0.8614–5.5798 |
| 0.0169 * | 0.2731–4.9916 |
Disclaimer/Publisher’s Note: The statements, opinions and data contained in all publications are solely those of the individual author(s) and contributor(s) and not of MDPI and/or the editor(s). MDPI and/or the editor(s) disclaim responsibility for any injury to people or property resulting from any ideas, methods, instructions or products referred to in the content. |
© 2025 by the authors. Licensee MDPI, Basel, Switzerland. This article is an open access article distributed under the terms and conditions of the Creative Commons Attribution (CC BY) license (https://creativecommons.org/licenses/by/4.0/).
Share and Cite
Esman, A.; Salamaikina, S.; Kirichenko, A.; Vinokurov, M.; Fomina, D.; Sikamov, K.; Syrkina, A.; Pokrovskaya, A.; Akimkin, V. Promoter Methylation of HIV Coreceptor-Related Genes CCR5 and CXCR4: Original Research. Viruses 2025, 17, 465. https://doi.org/10.3390/v17040465
Esman A, Salamaikina S, Kirichenko A, Vinokurov M, Fomina D, Sikamov K, Syrkina A, Pokrovskaya A, Akimkin V. Promoter Methylation of HIV Coreceptor-Related Genes CCR5 and CXCR4: Original Research. Viruses. 2025; 17(4):465. https://doi.org/10.3390/v17040465
Chicago/Turabian StyleEsman, Anna, Svetlana Salamaikina, Alina Kirichenko, Michael Vinokurov, Darya Fomina, Kirill Sikamov, Arina Syrkina, Anastasia Pokrovskaya, and Vasily Akimkin. 2025. "Promoter Methylation of HIV Coreceptor-Related Genes CCR5 and CXCR4: Original Research" Viruses 17, no. 4: 465. https://doi.org/10.3390/v17040465
APA StyleEsman, A., Salamaikina, S., Kirichenko, A., Vinokurov, M., Fomina, D., Sikamov, K., Syrkina, A., Pokrovskaya, A., & Akimkin, V. (2025). Promoter Methylation of HIV Coreceptor-Related Genes CCR5 and CXCR4: Original Research. Viruses, 17(4), 465. https://doi.org/10.3390/v17040465