
Neutralizing Antibody Titers in Hospitalized Patients with Acute Puumala Orthohantavirus Infection Do Not Associate with Disease Severity

 ,
,  , , , , , , and
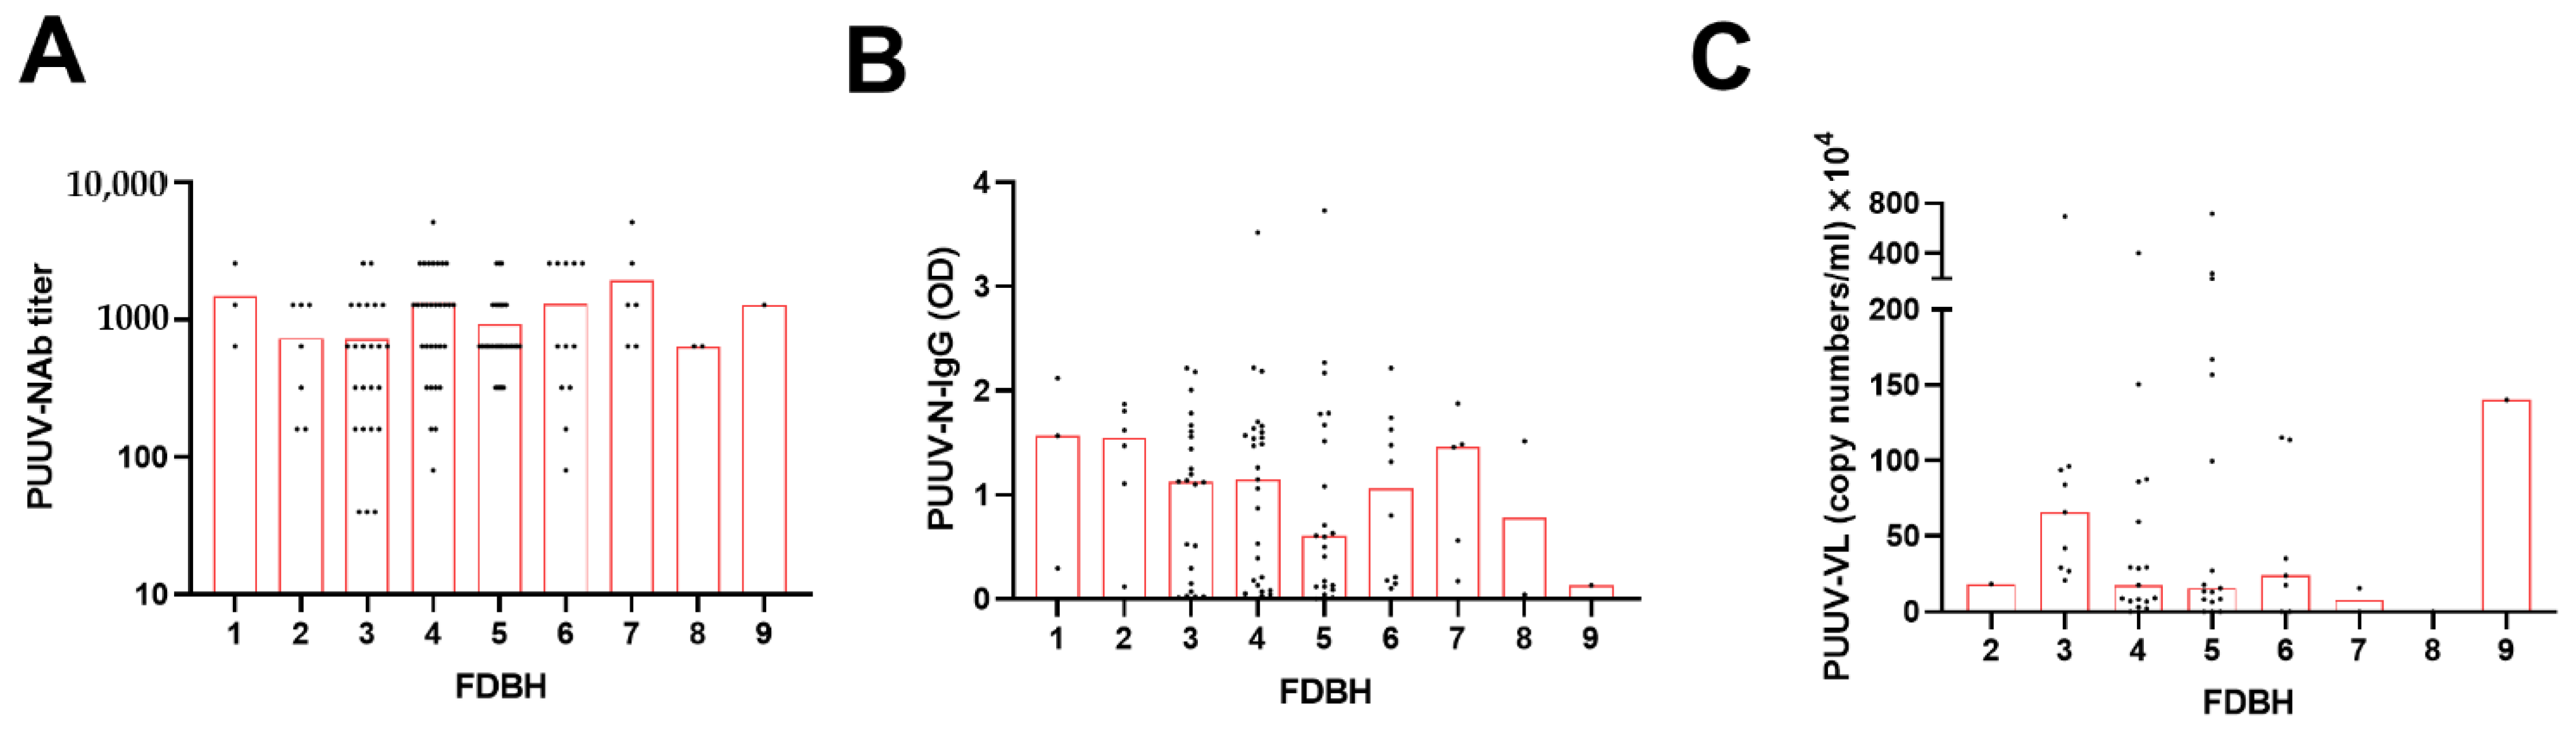
Abstract
:1. Introduction
2. Materials and Methods
2.1. Cells
2.2. Patient Samples
2.3. Real-Time RT-PCR
2.4. Neutralization Assay (pFRNT)
2.5. PUUV Nucleocapsid Protein (PUUV-N) Antibody ELISA
2.6. Statistical Analysis
2.6.1. Preliminary Data Processing
2.6.2. Associative Analyses Using Kruskal–Wallis and General Linear Models
2.6.3. Time Series Analysis and Hierarchical Cluster Analysis
2.6.4. Statistical Software
3. Results
3.1. Patient Characteristics
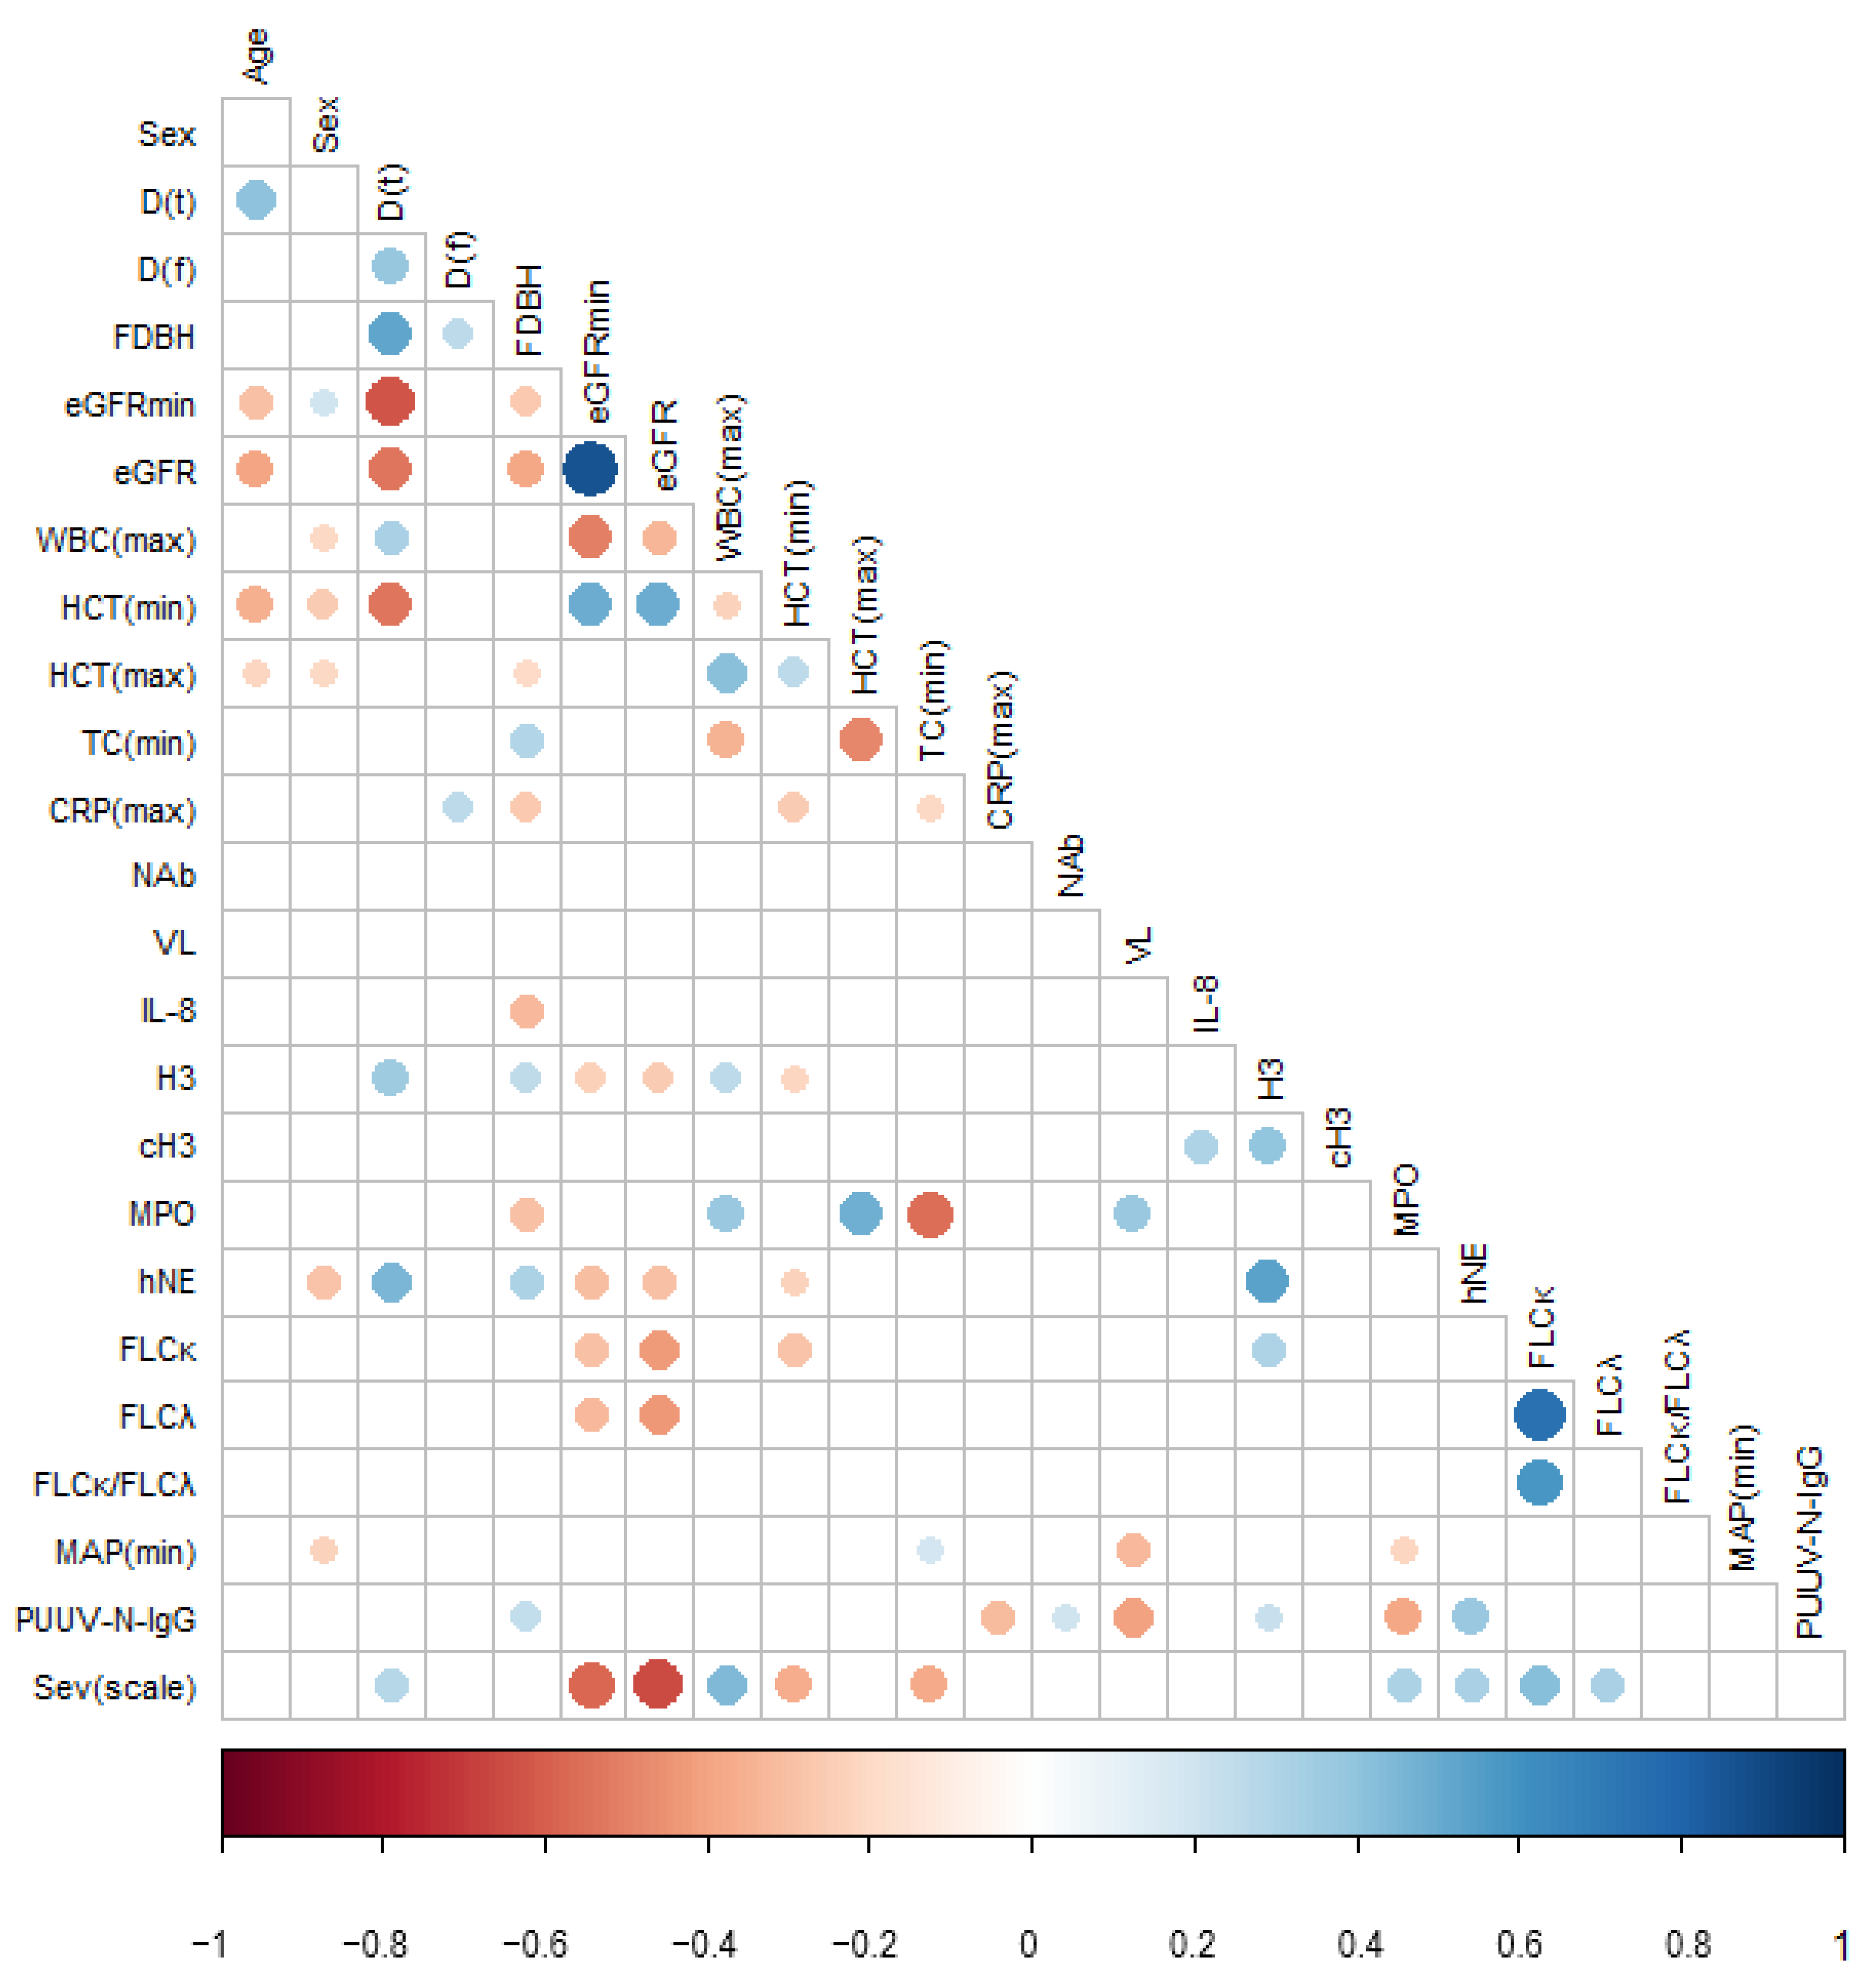
3.2. Pairwise Correlations between PUUV Neutralizing and Nucleocapsid Protein-Specific Antibody Levels, Viral Load, and Disease Severity Parameters
3.3. Extended Statistical Analysis of the Association between PUUV–NAb1, PUUV–N–IgG1 and PUUV–VL1, and Disease Severity
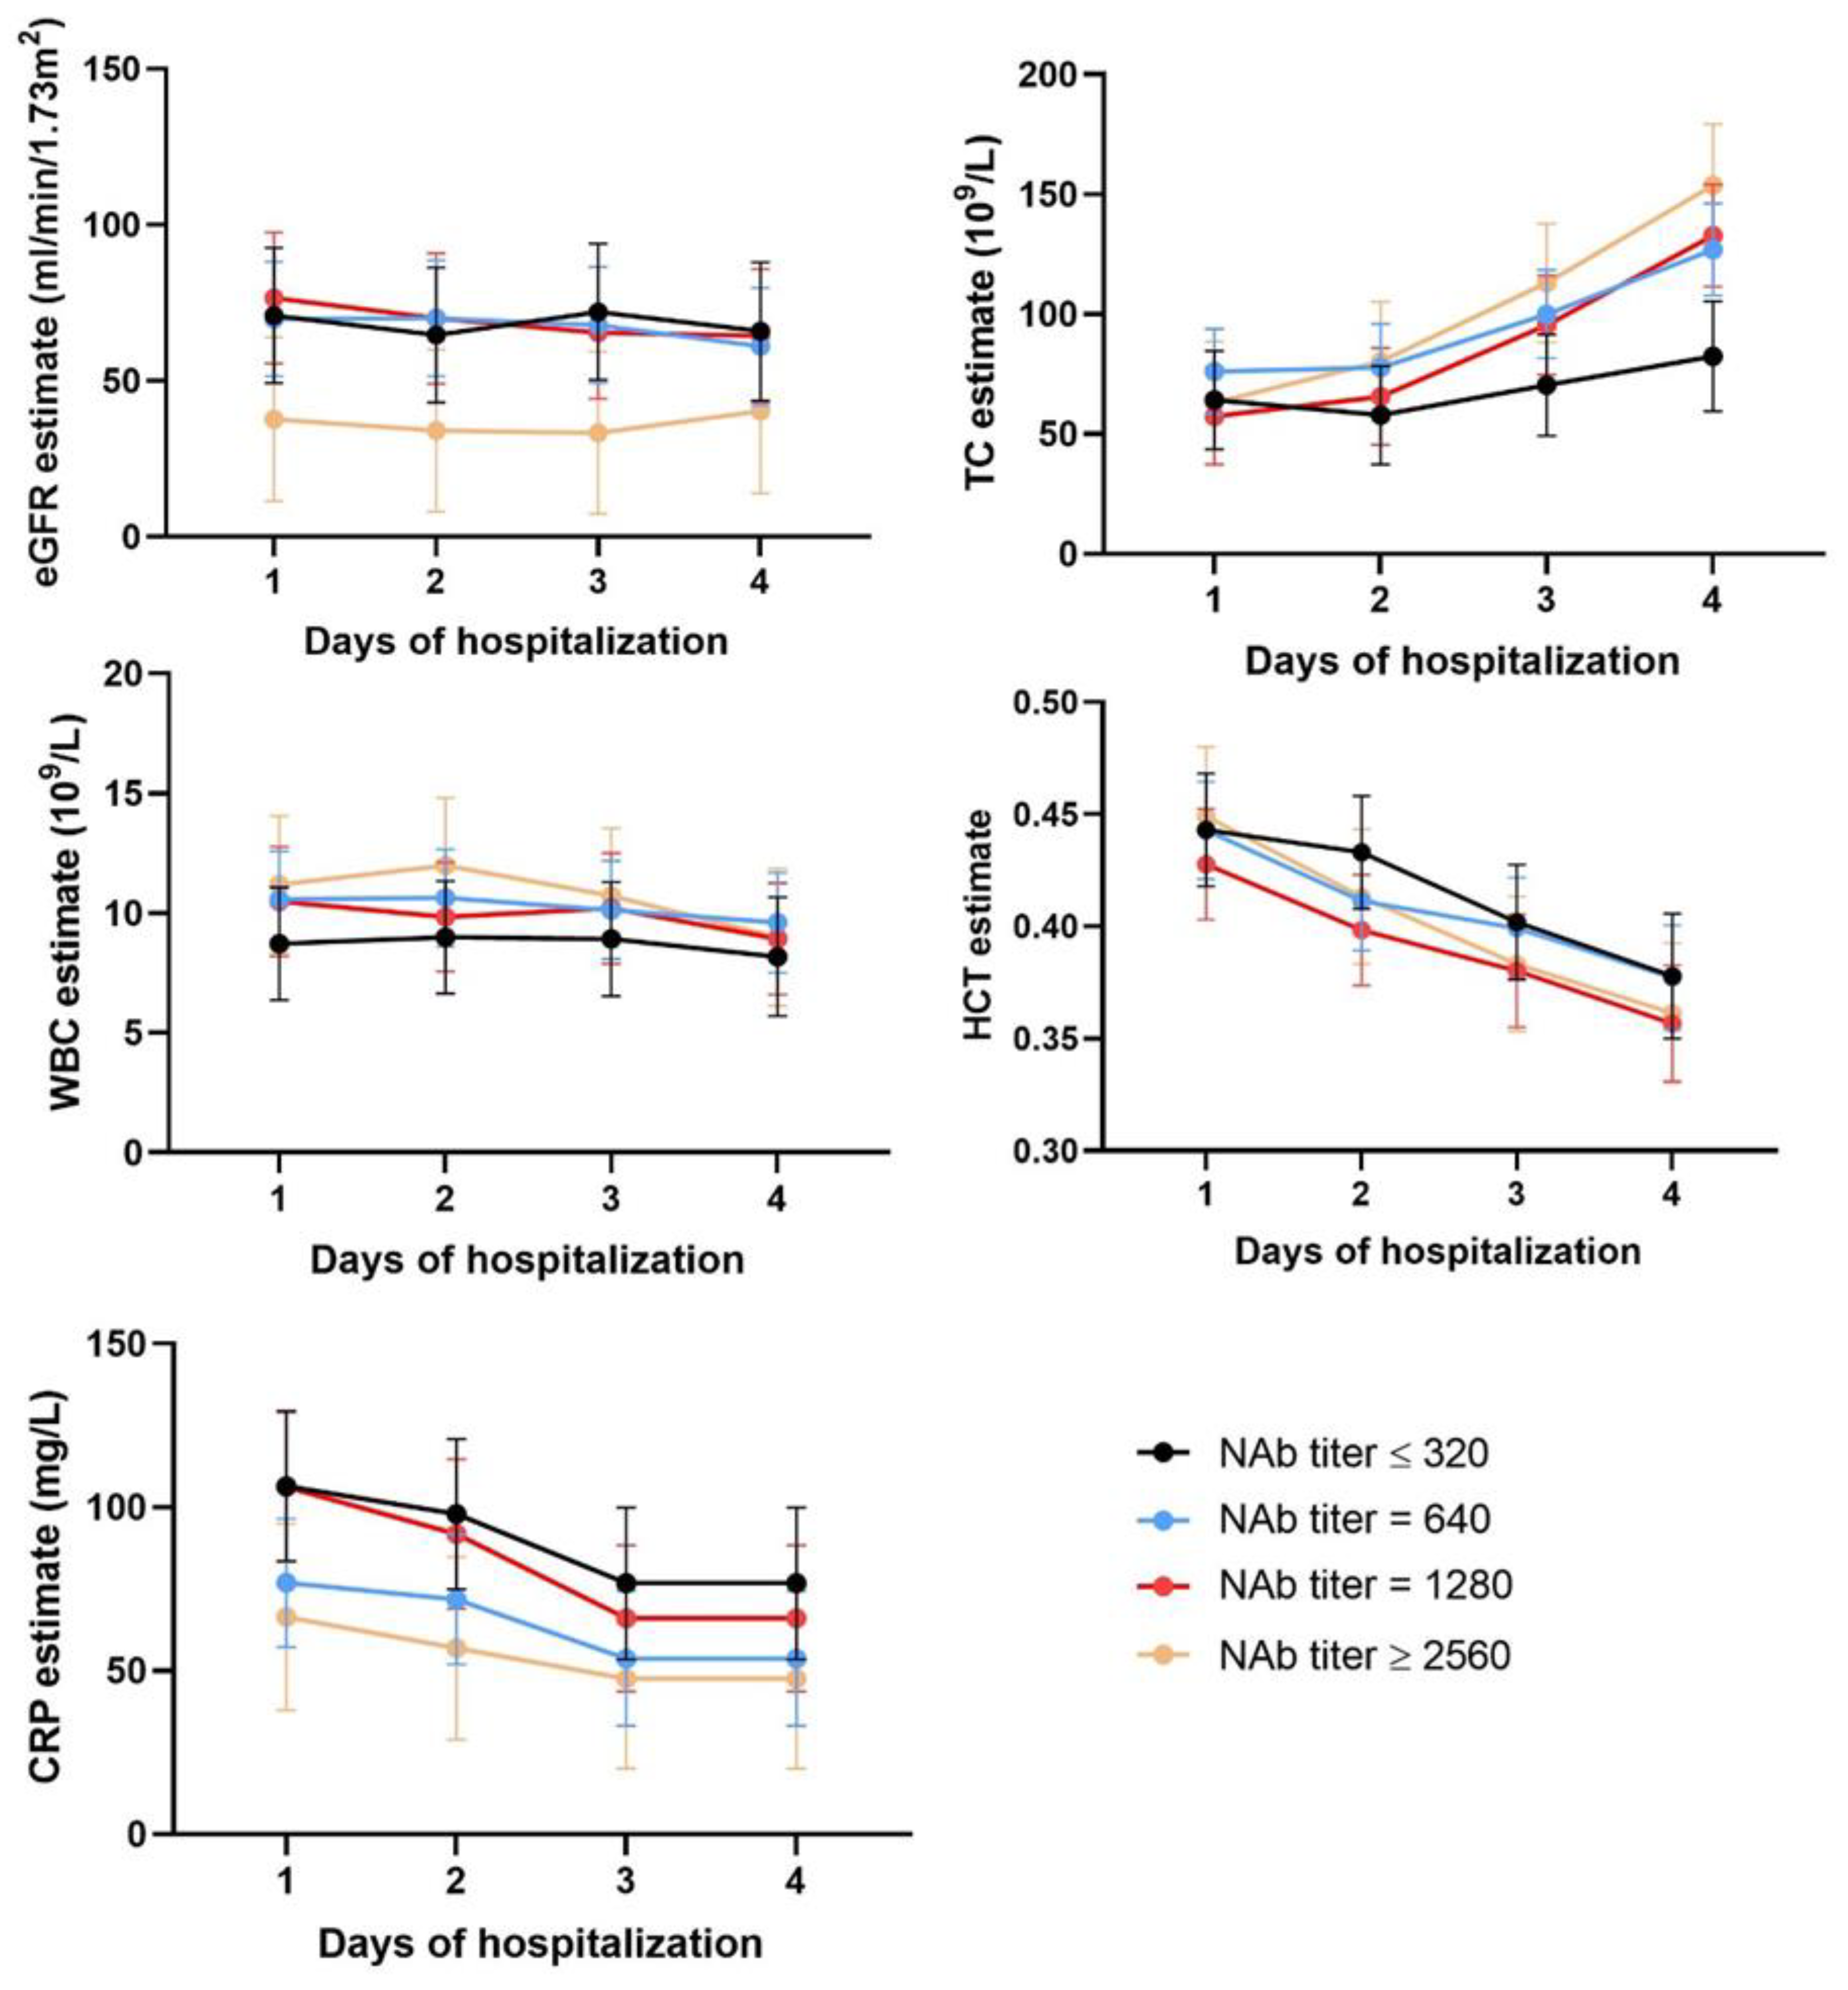
3.4. Time Series Analysis
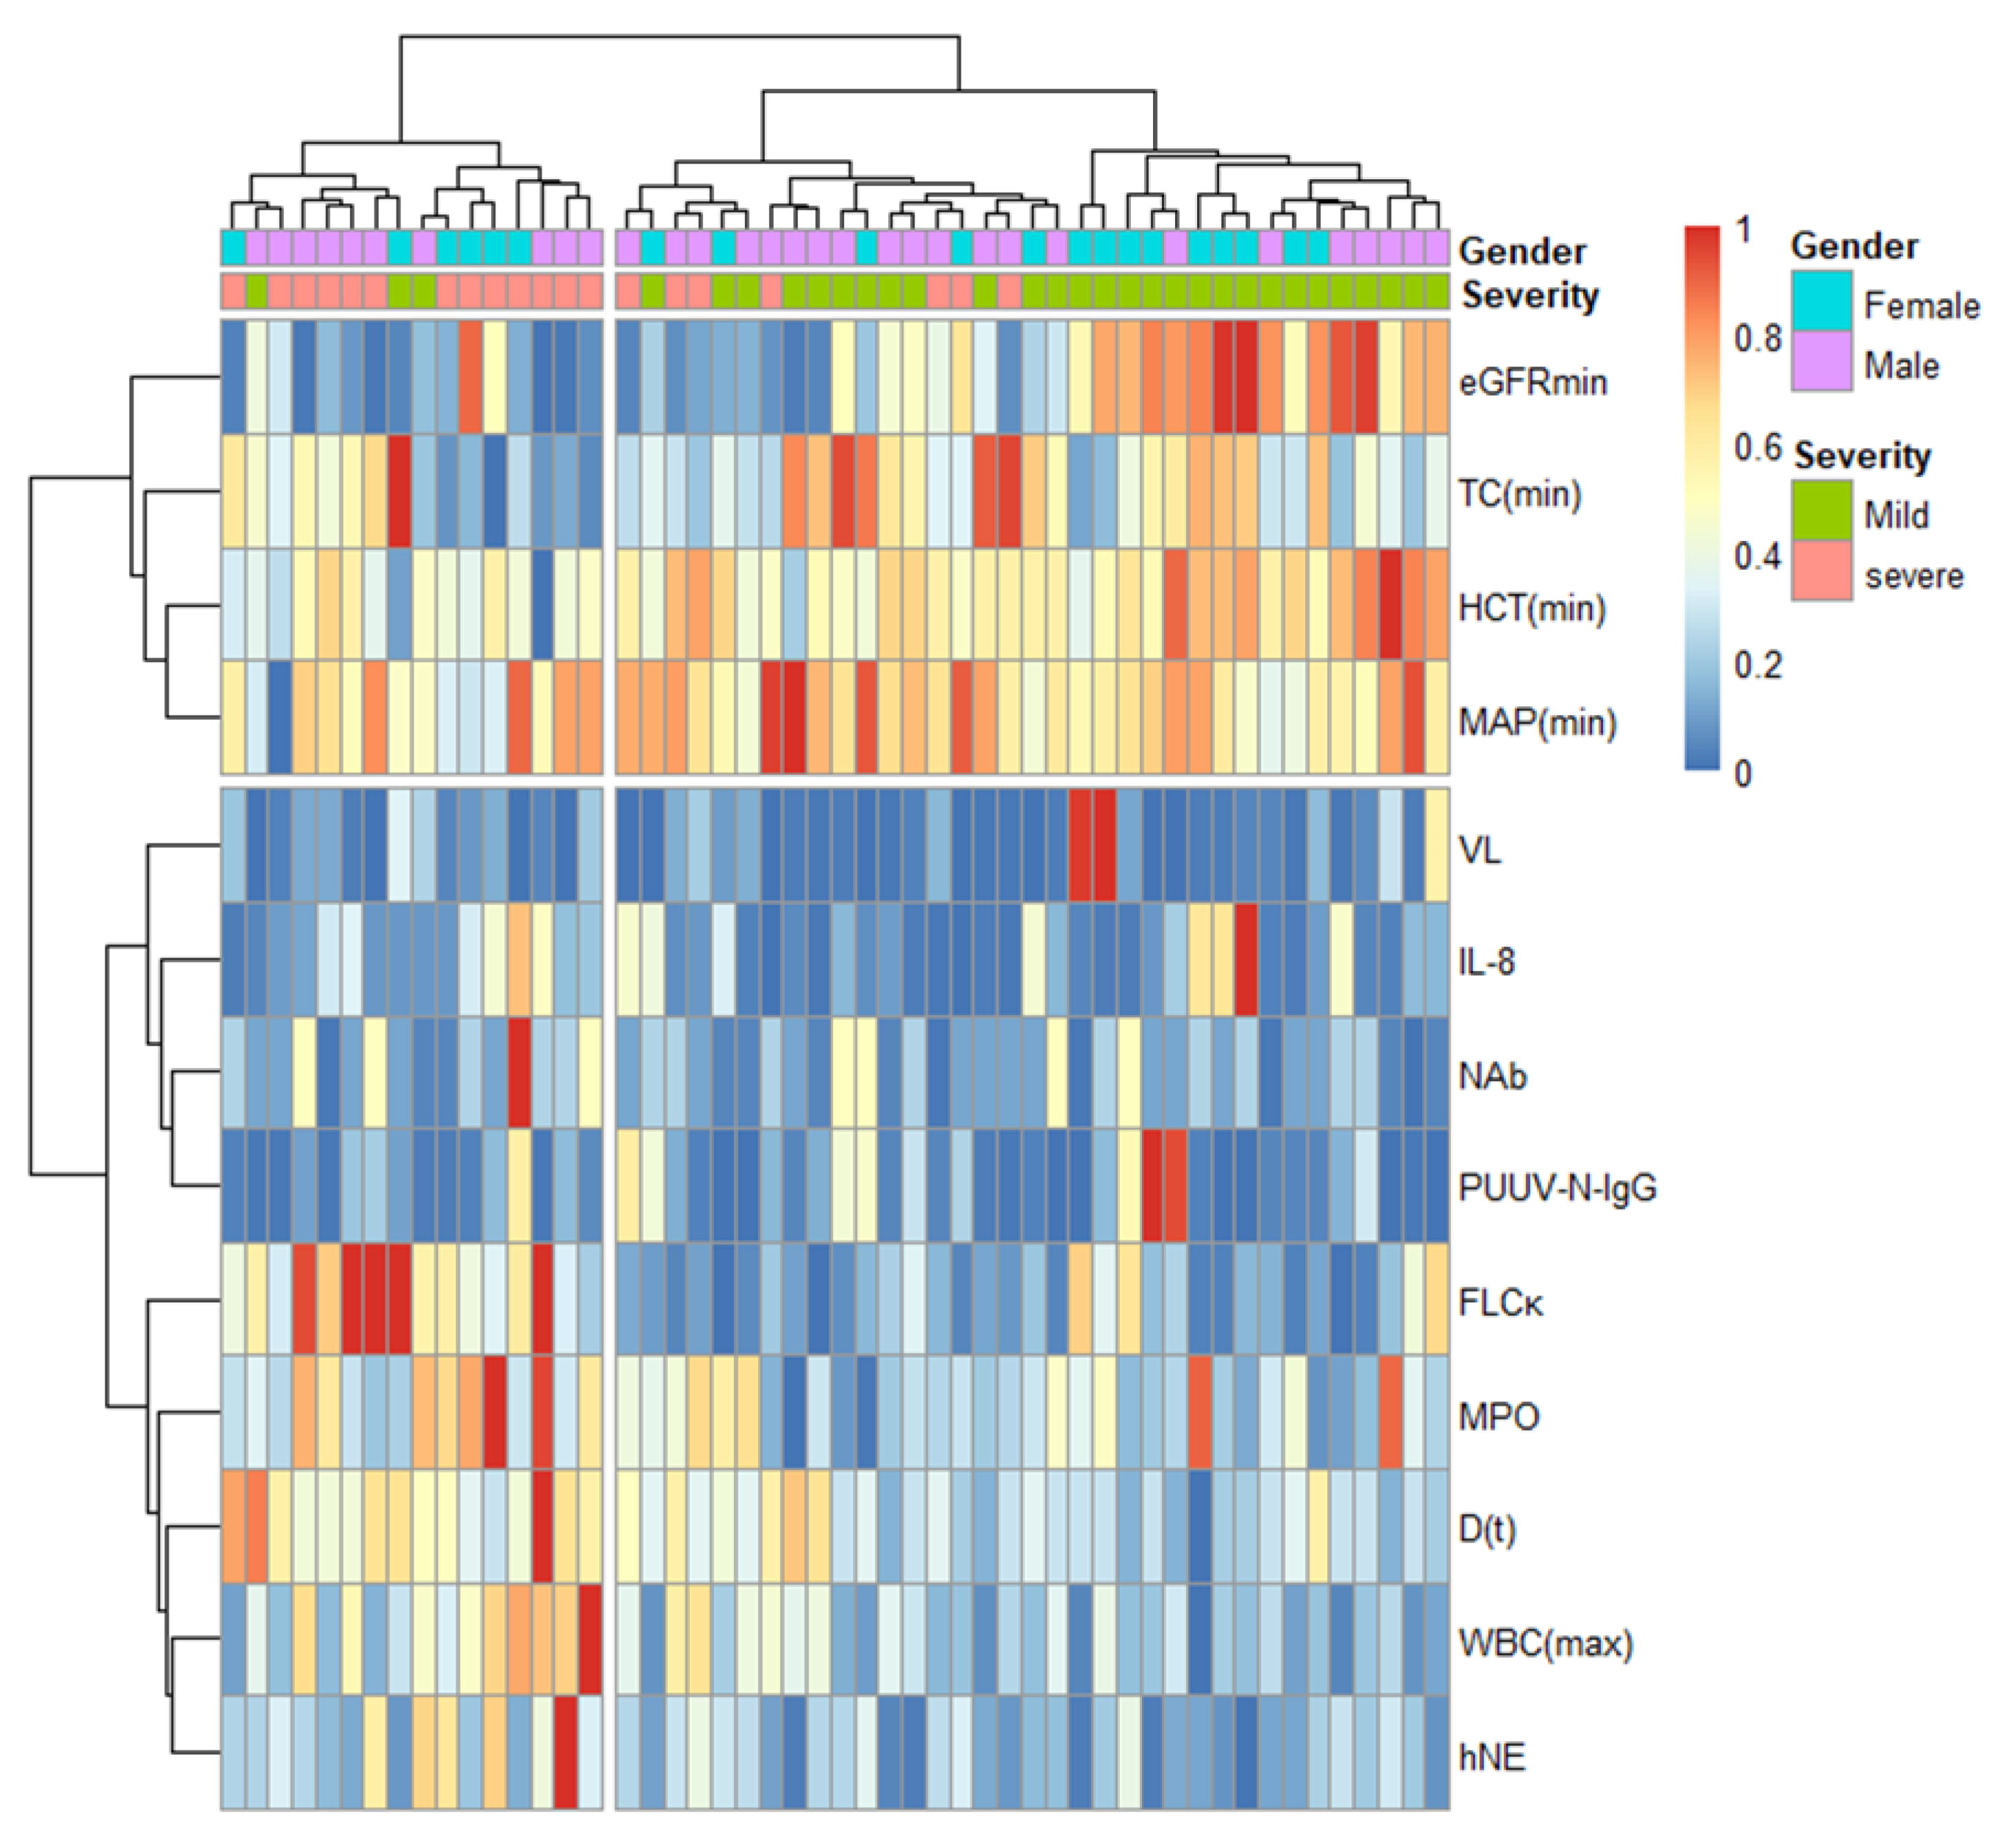
3.5. Hierarchical Cluster Analysis
4. Discussion
5. Conclusions
Supplementary Materials
Author Contributions
Funding
Institutional Review Board Statement
Informed Consent Statement
Data Availability Statement
Acknowledgments
Conflicts of Interest
References
- Hedman, K.; Vaheri, A.; Brummer-Korvenkontio, M. Rapid diagnosis of hantavirus disease with an IgG-avidity assay. Lancet 1991, 338, 1353–1356. [Google Scholar] [CrossRef]
- Vaheri, A.; Strandin, T.; Hepojoki, J.; Sironen, T.; Henttonen, H.; Makela, S.; Mustonen, J. Uncovering the mysteries of hantavirus infections. Nat. Rev. Microbiol. 2013, 11, 539–550. [Google Scholar] [CrossRef] [PubMed]
- Plyusnin, A.; Morzunov, S.P. Virus evolution and genetic diversity of hantaviruses and their rodent hosts. Curr. Top Microbiol. Immunol. 2001, 256, 47–75. [Google Scholar] [PubMed]
- Khaiboullina, S.F.; Morzunov, S.P.; St Jeor, S.C. Hantaviruses: Molecular biology, evolution and pathogenesis. Curr. Mol. Med. 2005, 5, 773–790. [Google Scholar] [CrossRef] [PubMed]
- Yanagihara, R.; Amyx, H.L.; Gajdusek, D.C. Experimental infection with Puumala virus, the etiologic agent of nephropathia epidemica, in bank voles (Clethrionomys glareolus). J. Virol. 1985, 55, 34–38. [Google Scholar] [CrossRef] [Green Version]
- Golovljova, I.; Vasilenko, V.; Mittzenkov, V.; Prukk, T.; Seppet, E.; Vene, S.; Settergren, B.; Plyusnin, A.; Lundkvist, A. Characterization of hemorrhagic fever with renal syndrome caused by hantaviruses, Estonia. Emerg. Infect. Dis. 2007, 13, 1773–1776. [Google Scholar] [CrossRef]
- Settergren, B. Clinical aspects of nephropathia epidemica (Puumala virus infection) in Europe: A review. Scand. J. Infect. Dis. 2000, 32, 125–132. [Google Scholar] [CrossRef]
- European Centre for Disease Prevention and Control. Hantavirus Infection, on ECDC. 2020. Available online: https://www.ecdc.europa.eu/en/publications-data/hantavirus-infection-annual-epidemiological-report-2018 (accessed on 17 January 2022).
- Hepojoki, J.; Vaheri, A.; Strandin, T. The fundamental role of endothelial cells in hantavirus pathogenesis. Front. Microbiol. 2014, 5, 727. [Google Scholar] [CrossRef] [Green Version]
- Geimonen, E.; Neff, S.; Raymond, T.; Kocer, S.S.; Gavrilovskaya, I.N.; Mackow, E.R. Pathogenic and nonpathogenic hantaviruses differentially regulate endothelial cell responses. Proc. Natl. Acad. Sci. USA 2002, 99, 13837–13842. [Google Scholar] [CrossRef] [Green Version]
- Jonsson, C.B.; Figueiredo, L.T.; Vapalahti, O. A global perspective on hantavirus ecology, epidemiology, and disease. Clin. Microbiol. Rev. 2010, 23, 412–441. [Google Scholar] [CrossRef] [Green Version]
- Iheozor-Ejiofor, R.P.; Levanov, L.; Hepojoki, J.; Strandin, T.; Lundkvist, A.; Plyusnin, A.; Vapalahti, O. Vaccinia virus-free rescue of Fluorescent replication-defective Vesicular Stomatitis virus and pseudotyping with Puumala virus glycoproteins for use in neutralization tests. J. Gen. Virol. 2016, 97, 1052–1059. [Google Scholar] [CrossRef] [PubMed]
- Vial, P.A.; Valdivieso, F.; Calvo, M.; Rioseco, M.L.; Riquelme, R.; Araneda, A.; Tomicic, V.; Graf, J.; Paredes, L.; Florenzano, M.; et al. A non-randomized multicentre trial of human immune plasma for treatment of hantavirus cardiopulmonary syndrome caused by Andes virus. Antivir. Ther. 2015, 20, 377–386. [Google Scholar] [CrossRef] [PubMed] [Green Version]
- Walker, L.M.; Burton, D.R. Passive immunotherapy of viral infections: ‘super-antibodies’ enter the fray. Nat. Rev. Immunol. 2018, 18, 297–308. [Google Scholar] [CrossRef]
- Habjan, M.; Andersson, I.; Klingstrom, J.; Schumann, M.; Martin, A.; Zimmermann, P.; Wagner, V.; Pichlmair, A.; Schneider, U.; Muhlberger, E.; et al. Processing of genome 5′ termini as a strategy of negative-strand RNA viruses to avoid RIG-I-dependent interferon induction. PLoS ONE 2008, 3, e2032. [Google Scholar] [CrossRef]
- Habjan, M.; Penski, N.; Spiegel, M.; Weber, F. T7 RNA polymerase-dependent and -independent systems for cDNA-based rescue of Rift Valley fever virus. J. Gen. Virol. 2008, 89, 2157–2166. [Google Scholar] [CrossRef] [PubMed]
- Moore, M.L.; Chi, M.H.; Luongo, C.; Lukacs, N.W.; Polosukhin, V.V.; Huckabee, M.M.; Newcomb, D.C.; Buchholz, U.J.; Crowe, J.E.; Goleniewska, K.; et al. A chimeric A2 strain of respiratory syncytial virus (RSV) with the fusion protein of RSV strain line 19 exhibits enhanced viral load, mucus, and airway dysfunction. J. Virol. 2009, 83, 4185–4194. [Google Scholar] [CrossRef] [Green Version]
- Hujakka, H.; Koistinen, V.; Eerikainen, P.; Kuronen, I.; Laatikainen, A.; Kauppinen, J.; Vaheri, A.; Vapalahti, O.; Narvanen, A. Comparison of a new immunochromatographic rapid test with a commercial EIA for the detection of Puumala virus specific IgM antibodies. J. Clin. Virol. 2001, 23, 79–85. [Google Scholar] [CrossRef]
- Vapalahti, O.; Kallio-Kokko, H.; Narvanen, A.; Julkunen, I.; Lundkvist, A.; Plyusnin, A.; Lehvaslaiho, H.; Brummer-Korvenkontio, M.; Vaheri, A.; Lankinen, H. Human B-cell epitopes of Puumala virus nucleocapsid protein, the major antigen in early serological response. J. Med. Virol. 1995, 46, 293–303. [Google Scholar] [CrossRef]
- Vapalahti, O.; Lundkvist, A.; Kallio-Kokko, H.; Paukku, K.; Julkunen, I.; Lankinen, H.; Vaheri, A. Antigenic properties and diagnostic potential of puumala virus nucleocapsid protein expressed in insect cells. J. Clin. Microbiol. 1996, 34, 119–125. [Google Scholar] [CrossRef] [Green Version]
- Delgado, C.; Baweja, M.; Crews, D.C.; Eneanya, N.D.; Gadegbeku, C.A.; Inker, L.A.; Mendu, M.L.; Miller, W.G.; Moxey-Mims, M.M.; Roberts, G.V.; et al. A Unifying Approach for GFR Estimation: Recommendations of the NKF-ASN Task Force on Reassessing the Inclusion of Race in Diagnosing Kidney Disease. Am. J. Kidney. Dis. 2022, 79, 268–288.e1. [Google Scholar] [CrossRef]
- Delgado, C.; Baweja, M.; Crews, D.C.; Eneanya, N.D.; Gadegbeku, C.A.; Inker, L.A.; Mendu, M.L.; Miller, W.G.; Moxey-Mims, M.M.; Roberts, G.V.; et al. A Unifying Approach for GFR Estimation: Recommendations of the NKF-ASN Task Force on Reassessing the Inclusion of Race in Diagnosing Kidney Disease. J. Am. Soc. Nephrol. 2021, 32, 2994–3015. [Google Scholar] [CrossRef] [PubMed]
- Levey, A.S.; Stevens, L.A.; Schmid, C.H.; Zhang, Y.L.; Castro, A.F.; Feldman, H.I., 3rd; Kusek, J.W.; Eggers, P.; Van Lente, F.; Greene, T.; et al. A new equation to estimate glomerular filtration rate. Ann. Intern. Med. 2009, 150, 604–612. [Google Scholar] [CrossRef] [PubMed]
- Levey, A.S.; Bosch, J.P.; Lewis, J.B.; Greene, T.; Rogers, N.; Roth, D. A more accurate method to estimate glomerular filtration rate from serum creatinine: A new prediction equation. Modification of Diet in Renal Disease Study Group. Ann. Intern. Med. 1999, 130, 461–470. [Google Scholar] [CrossRef] [PubMed]
- Magder, S.A. The highs and lows of blood pressure: Toward meaningful clinical targets in patients with shock. Crit. Care Med. 2014, 42, 1241–1251. [Google Scholar] [CrossRef]
- Strandin, T.; Makela, S.; Mustonen, J.; Vaheri, A. Neutrophil Activation in Acute Hemorrhagic Fever With Renal Syndrome Is Mediated by Hantavirus-Infected Microvascular Endothelial Cells. Front. Immunol. 2018, 9, 2098. [Google Scholar] [CrossRef] [Green Version]
- Vaheri, A.; Strandin, T.; Jaaskelainen, A.J.; Vapalahti, O.; Jarva, H.; Lokki, M.L.; Antonen, J.; Leppanen, I.; Makela, S.; Meri, S.; et al. Pathophysiology of a severe case of Puumala hantavirus infection successfully treated with bradykinin receptor antagonist icatibant. Antivir. Res. 2014, 111, 23–25. [Google Scholar] [CrossRef]
- Niskanen, S.; Jaaskelainen, A.; Vapalahti, O.; Sironen, T. Evaluation of Real-Time RT-PCR for Diagnostic Use in Detection of Puumala Virus. Viruses 2019, 11, 661. [Google Scholar] [CrossRef] [Green Version]
- Lundkvist, A.; Niklasson, B. Bank vole monoclonal antibodies against Puumala virus envelope glycoproteins: Identification of epitopes involved in neutralization. Arch. Virol. 1992, 126, 93–105. [Google Scholar] [CrossRef]
- Hoaglin, D.C.; Iglewicz, B. Fine-Tuning Some Resistant Rules for Outlier Labeling. J. Am. Stat. Assoc. 1987, 82, 1147–1149. [Google Scholar] [CrossRef]
- IBM Corp. Release IBM SPSS Statistics for Windows; v24.0; IBM Corp: Armonk, NY, USA, 2016. [Google Scholar]
- SAS Institute Inc. SAS 9.4; SAS Institute Inc.: Cary, NC, USA, 2013. [Google Scholar]
- R Core Team. R: A Language and Environment for Statistical Computing, R Foundation for Statistical Computing, Vienna, Austria. 2021. Available online: https://www.R-project.org/ (accessed on 23 November 2021).
- Klingstrom, J.; Falk, K.I.; Lundkvist, A. Delayed viremia and antibody responses in Puumala hantavirus challenged passively immunized cynomolgus macaques. Arch. Virol. 2005, 150, 79–92. [Google Scholar] [CrossRef]
- Klingstrom, J.; Stoltz, M.; Hardestam, J.; Ahlm, C.; Lundkvist, A. Passive immunization protects cynomolgus macaques against Puumala hantavirus challenge. Antivir. Ther. 2008, 13, 125–133. [Google Scholar] [CrossRef] [PubMed]
- Brocato, R.L.; Hooper, J.W. Progress on the Prevention and Treatment of Hantavirus Disease. Viruses 2019, 11, 610. [Google Scholar] [CrossRef] [PubMed] [Green Version]
- Huggins, J.W.; Hsiang, C.M.; Cosgriff, T.M.; Guang, M.Y.; Smith, J.I.; Wu, Z.O.; LeDuc, J.W.; Zheng, Z.M.; Meegan, J.M.; Wang, Q.N. Prospective, double-blind, concurrent, placebo-controlled clinical trial of intravenous ribavirin therapy of hemorrhagic fever with renal syndrome. J. Infect. Dis. 1991, 164, 1119–1127. [Google Scholar] [CrossRef] [PubMed]
- Malinin, O.V.; Platonov, A.E. Insufficient efficacy and safety of intravenous ribavirin in treatment of haemorrhagic fever with renal syndrome caused by Puumala virus. Infect. Dis. 2017, 49, 514–520. [Google Scholar] [CrossRef] [PubMed]
- Gerlach, H. Agents to reduce cytokine storm. F1000Research 2016, 5, 2909. [Google Scholar] [CrossRef] [Green Version]
- Bharadwaj, M.; Nofchissey, R.; Goade, D.; Koster, F.; Hjelle, B. Humoral immune responses in the hantavirus cardiopulmonary syndrome. J. Infect. Dis. 2000, 182, 43–48. [Google Scholar] [CrossRef]
- Hepojoki, J.; Cabrera, L.E.; Hepojoki, S.; Bellomo, C.; Kareinen, L.; Andersson, L.C.; Vaheri, A.; Makela, S.; Mustonen, J.; Vapalahti, O.; et al. Hantavirus infection-induced B cell activation elevates free light chains levels in circulation. PLoS Pathog. 2021, 17, e1009843. [Google Scholar] [CrossRef]
- Mustonen, J.; Helin, H.; Pietila, K.; Brummer-Korvenkontio, M.; Hedman, K.; Vaheri, A.; Pasternack, A. Renal biopsy findings and clinicopathologic correlations in nephropathia epidemica. Clin. Nephrol. 1994, 41, 121–126. [Google Scholar]
- Pettersson, L.; Thunberg, T.; Rocklöv, J.; Klingström, J.; Evander, M.; Ahlm, C. Viral load and humoral immune response in association with disease severity in Puumala hantavirus-infected patients—Implications for treatment. Clin. Microbiol. Infect. 2014, 20, 235–241. [Google Scholar] [CrossRef] [Green Version]
- Outinen, T.K.; Laine, O.K.; Makela, S.; Porsti, I.; Huhtala, H.; Vaheri, A.; Mustonen, J. Thrombocytopenia associates with the severity of inflammation and variables reflecting capillary leakage in Puumala Hantavirus infection, an analysis of 546 Finnish patients. Infect. Dis. 2016, 48, 682–687. [Google Scholar] [CrossRef]
- Vangeti, S.; Strandin, T.; Liu, S.; Tauriainen, J.; Raisanen-Sokolowski, A.; Cabrera, L.; Hassinen, A.; Makela, S.; Mustonen, J.; Vaheri, A.; et al. Monocyte subset redistribution from blood to kidneys in patients with Puumala virus caused hemorrhagic fever with renal syndrome. PLoS Pathog. 2021, 17, e1009400. [Google Scholar]
- Ostermann, M.; Joannidis, M. Acute kidney injury 2016: Diagnosis and diagnostic workup. Crit. Care 2016, 20, 299. [Google Scholar] [CrossRef] [PubMed] [Green Version]
- Latronico, F.; Mäki, S.; Rissanen, H.; Ollgren, J.; Lyytikäinen, O.; Vapalahti, O.; Sane, J. Population-based seroprevalence of Puumala hantavirus in Finland: Smoking as a risk factor. Epidemiol. Infect. 2018, 146, 367–371. [Google Scholar] [CrossRef] [PubMed] [Green Version]


Publisher’s Note: MDPI stays neutral with regard to jurisdictional claims in published maps and institutional affiliations. |
© 2022 by the authors. Licensee MDPI, Basel, Switzerland. This article is an open access article distributed under the terms and conditions of the Creative Commons Attribution (CC BY) license (https://creativecommons.org/licenses/by/4.0/).
Share and Cite
Iheozor-Ejiofor, R.; Vapalahti, K.; Sironen, T.; Levanov, L.; Hepojoki, J.; Lundkvist, Å.; Mäkelä, S.; Vaheri, A.; Mustonen, J.; Plyusnin, A.; et al. Neutralizing Antibody Titers in Hospitalized Patients with Acute Puumala Orthohantavirus Infection Do Not Associate with Disease Severity. Viruses 2022, 14, 901. https://doi.org/10.3390/v14050901
Iheozor-Ejiofor R, Vapalahti K, Sironen T, Levanov L, Hepojoki J, Lundkvist Å, Mäkelä S, Vaheri A, Mustonen J, Plyusnin A, et al. Neutralizing Antibody Titers in Hospitalized Patients with Acute Puumala Orthohantavirus Infection Do Not Associate with Disease Severity. Viruses. 2022; 14(5):901. https://doi.org/10.3390/v14050901
Chicago/Turabian StyleIheozor-Ejiofor, Rommel, Katariina Vapalahti, Tarja Sironen, Lev Levanov, Jussi Hepojoki, Åke Lundkvist, Satu Mäkelä, Antti Vaheri, Jukka Mustonen, Alexander Plyusnin, and et al. 2022. "Neutralizing Antibody Titers in Hospitalized Patients with Acute Puumala Orthohantavirus Infection Do Not Associate with Disease Severity" Viruses 14, no. 5: 901. https://doi.org/10.3390/v14050901
APA StyleIheozor-Ejiofor, R., Vapalahti, K., Sironen, T., Levanov, L., Hepojoki, J., Lundkvist, Å., Mäkelä, S., Vaheri, A., Mustonen, J., Plyusnin, A., Strandin, T. M., & Vapalahti, O. (2022). Neutralizing Antibody Titers in Hospitalized Patients with Acute Puumala Orthohantavirus Infection Do Not Associate with Disease Severity. Viruses, 14(5), 901. https://doi.org/10.3390/v14050901