
ABO Blood Types and COVID-19: Spurious, Anecdotal, or Truly Important Relationships? A Reasoned Review of Available Data

 ,
,
Abstract
1. Introduction
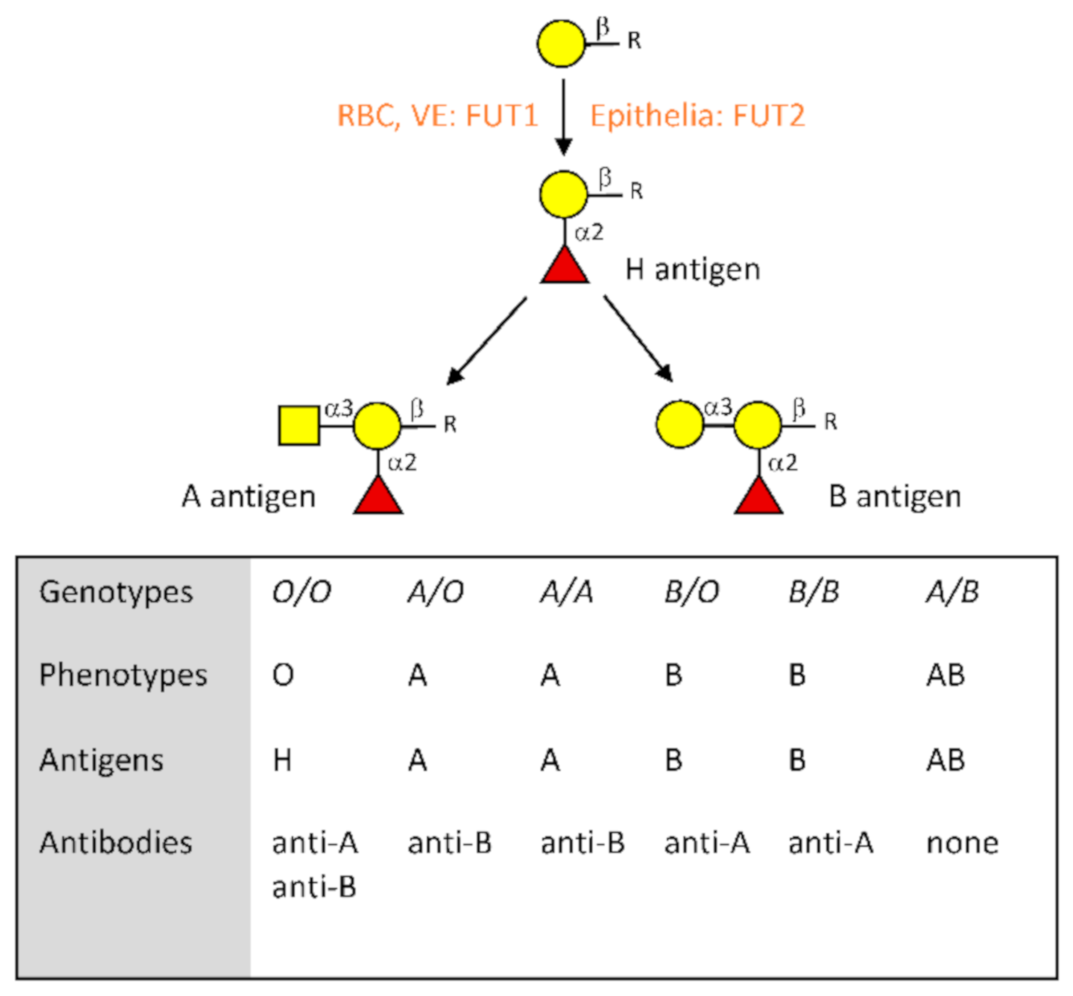
2. The ABO Blood Group System at a Glance
3. Hypotheses Linking ABO Types and COVID-19 and Their Consequences on the Interpretation of Reported Associations
3.1. The Anti-ABO Antibodies
3.2. The ABO Effect on Thrombosis
3.3. ABO Blood Groups and the Furin Cleavage Site
3.4. ABO Blood Groups and Susceptibility to Other COVID-19-Associated Risk Factors
3.5. ABO Blood Groups and the Microbiota
4. Studies Linking ABO Blood Types to COVID-19
4.1. Case–Control Studies Designed to Observe Associations
4.2. Studies Designed to Observe an Effect on Severity
4.3. Other Study Designs
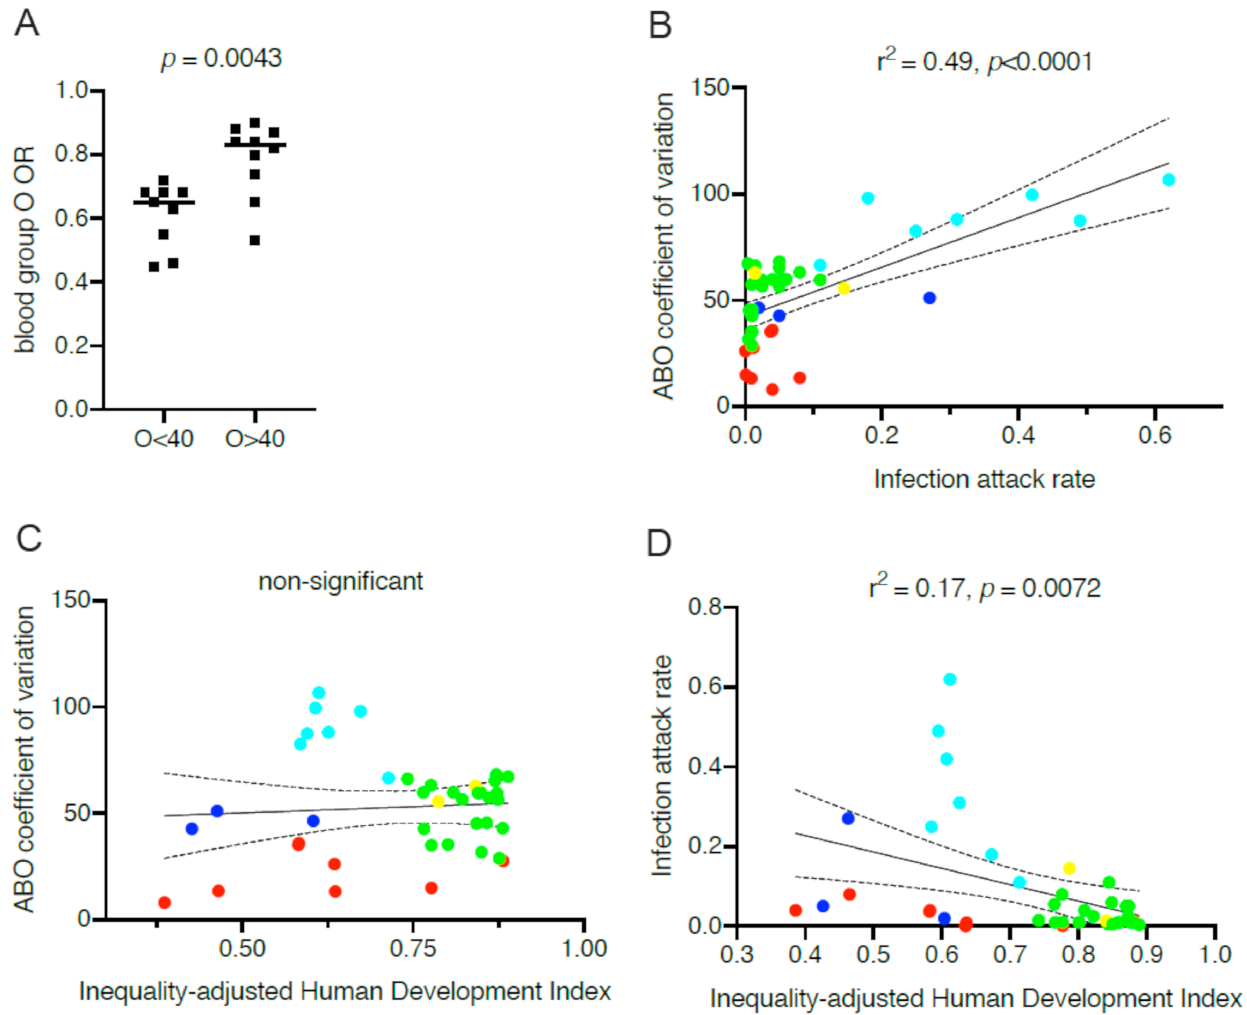
5. Consequences of between-Populations Differences in ABO Blood Types Frequencies
6. Conclusions
Author Contributions
Funding
Institutional Review Board Statement
Informed Consent Statement
Data Availability Statement
Acknowledgments
Conflicts of Interest
References
- Zhao, J.; Yang, Y.; Huang, H.-P.; Li, D.; Gu, D.-F.; Lu, X.-F.; Zhang, Z.; Liu, L.; Liu, T.; Liu, Y.-K.; et al. Relationship between the ABO Blood Group and the COVID-19 Susceptibility. Clin. Infect. Dis. 2020. [Google Scholar] [CrossRef]
- Zietz, M.; Zucker, J.; Tatonetti, M.P. Associations between blood type and COVID-19 infection, intubation, and death. Nat. Commun. 2020, 11, 5761. [Google Scholar] [CrossRef] [PubMed]
- Li, J.; Wang, X.; Chen, J.; Cai, Y.; Deng, A.; Yang, M. Association between ABO blood groups and risk of SARS-CoV-2 pneumonia. Br. J. Haematol. 2020, 190, 24–27. [Google Scholar] [CrossRef] [PubMed]
- Göker, H.; Aladağ, K.E.; Demiroğlu, H.; Ayaz Ceylan, Ç.M.; Büyükaşik, Y.; Inkaya, A.Ç.; Aksu, S.; Sayinalp, N.; Haznedaroğlu, I.; Uzun, Ö.; et al. The effects of blood group types on the risk of COVID-19 infection and its clinical outcome. Turk. J. Med. Sci. 2020, 50, 679–683. [Google Scholar] [CrossRef]
- Ellinghaus, D.; Degenhardt, F.; Bujanda, L.; Buti, M.; Albillos, A.; Invernizzi, P.; Fernandez, J.; Prati, D.; Baselli, G.; Asselta, R.; et al. Genomewide association study of severe Covid-19 with respiratory failure. N. Engl. J. Med. 2020, 383, 1522–1534. [Google Scholar]
- Wu, Y.; Feng, Z.; Li, P.; Yu, Q. Relationship between ABO blood group distribution and clinical characteristics in patients with COVID-19. Clin. Chim. Acta 2020, 509, 220–223. [Google Scholar] [CrossRef]
- Leaf, R.K.; Al-Samkari, H.; Brenner, S.K.; Gupta, S.; Leaf, D.E. ABO phenotype and death in critically ill patients with COVID-19. Br. J. Haematol. 2020, 90, e204–e208. [Google Scholar] [CrossRef]
- Zeng, X.; Fan, H.; Lu, D.; Meng, F.; Zhuo, L.; Tang, M.; Zhang, J.; Liu, N.; Liu, Z.; Zhao, J.; et al. Association between ABO blood groups and clinical outcome of coronavirus disease 2019: Evidence from two cohorts. medRxiv 2020. [Google Scholar] [CrossRef]
- Aktimur, S.H.; Sen, H.; Yazicioglu, B.; Gunes, A.K.; Genc, S. The assessment of the relationship between ABO blood groups and Covid-19 infection. Int. J. Hematol. Oncol. 2020, 30, 121–125. [Google Scholar] [CrossRef]
- Chegni, H.; Pakravan, N.; Saadati, M.; Ghaffari, A.D.; Shirzad, H.; Hassan, Z.M. Is there a link between COVID-19 mortality with genus, age, ABO blood group type, and ACE2 gene polymorphism? Iran J. Public Health 2020, 49, 1582–1584. [Google Scholar] [CrossRef]
- Zhang, L.; Huang, B.; Xia, H.; Fan, H.; Zhu, M.; Zhu, L.; Zhang, H.; Tao, X.; Cheng, S.; Chen, J. Retrospective analysis of clinical features in 134 coronavirus disease 2019 cases. Epidemiol. Infect. 2020, 148, e199. [Google Scholar] [CrossRef] [PubMed]
- Muniz-Diaz, E.; Llopis, J.; Parra, R.; Roig, I.; Ferrer, G.; Grifols, J.; Millan, A.; Ene, G.; Ramiro, L.; Maglio, L.; et al. Relationship between the ABO blood group and COVID-19 susceptibility, severity and mortality in two cohorts of patients. Blood Transfus. 2020. [Google Scholar] [CrossRef]
- Sohlpour, A.; Jafari, A.; Pourhoseingholi, M.A.; Soltani, F. Corona COVID-19 virus and severe hypoxia in young patients without underlying disease: High prevalence rate with blood group A. Trends Anesth. Crit. Care 2020, 34, 63–64. [Google Scholar] [CrossRef]
- Latz, C.A.; DeCarlo, C.; Boitano, L.; Png, C.Y.M.; Patell, R.; Conrad, M.F.; Eagleton, M.; Dua, A. Blood type and outcomes in patients with COVID-19. Ann. Hematol. 2020, 99, 2113–2118. [Google Scholar] [CrossRef]
- Ray, J.G.; Schull, M.J.; Vermeulen, M.J.; Park, A.L. Association between ABO and Rh blood groups and SARS-CoV-2 infection or severe COVID-19 Illness. A population-based cohort study. Ann. Intern. Med. 2020. [Google Scholar] [CrossRef]
- Padhi, S.; Suvankar, S.; Dash, D.; Panda, V.K.; Pati, A.; Panigrahi, J.; Panda, A.K. ABO blood group system is associated with COVID-19 mortality: An epidemiological investigation in the Indian population. Transfus. Clin. Biol. 2020, 27, 253–258. [Google Scholar] [CrossRef]
- Zalba-Marcos, S.; Antelo, M.L.; Galbete, A.; Etayo, M.; Ongay, E.; Garcia-Erce, J.A. Infection and thrombosis associated with COVID-19: Possible role of the ABO blood group. Med. Clin. 2020, 155, 340–343. [Google Scholar]
- Aljanobi, G.; Alhajjaj, A.; Alkhabbaz, F.; Al-Jishi, J. The relationship between ABO blood group type and the Covid-19 susceptibility in Qatif Central Hospital, Eastern Province, Saudi Arabia: A retrospective cohort study. Open J. Intern. Med. 2020, 10, 232–238. [Google Scholar] [CrossRef]
- Abdollahi, A.; Mahmoudi-Aliabadi, M.; Mehrtash, V.; Jafarzadeh, B.; Salehi, M. The novel coronavirus SARS-CoV-2 vulnerabiloty association with ABO/Rh blood types. Iran J. Pathol. 2020, 15, 156–160. [Google Scholar] [CrossRef]
- Shelton, J.F.; Shastri, A.J.; Ye, C.; Weldon, C.H.; Filshtein-Somnez, T.; Coker, D.; Symons, A.; Esparza-Gordillo, J. Trans-ethnic analysis reveals genetic and non-genetic associations with COVID-19 susceptibility and severity. medRxiv 2020. [Google Scholar] [CrossRef]
- Niles, J.K.; Karnes, H.E.; Dlott, J.S.; Kaufman, H.W. Association of ABO/Rh with SARS-CoV-2 positivity: The role of race and ethnicity in a female cohort. Am. J. Hematol. 2020, 96, E23–E26. [Google Scholar] [CrossRef] [PubMed]
- Barnkob, M.B.; Pottegard, A.; Stovring, H.; Haunstrup, T.M.; Homburg, K.; Larsen, R.; Hansen, M.B.; Titlestad, K.; Aagaard, B.; Moller, B.K.; et al. Reduced prevalence of SARS-CoV-2 infection in ABO blood group O. Blood Adv. 2020, 4, 4990–4993. [Google Scholar] [CrossRef] [PubMed]
- Hernandez-Cordero, A.I.; Li, X.; Milne, S.; Yang, C.X.; Bossé, Y.; Joubert, P.; Timens, W.; van den Berge, M.; Nickle, D.; Hao, K.; et al. Multi-omics highlights ABO plasma protein as a causal risk factor for COVID-19. medRxiv 2020. [Google Scholar] [CrossRef]
- Franchini, M.; Glingani, C.; Del Fante, C.; Capuzzo, M.; Di Stasi, V.; Rastrelli, G.; Vignozzi, L.; De Donno, G.; Perotti, C. The protective effect of O blood type against SARS-CoV-2 infection. Vox Sang. 2020. [Google Scholar] [CrossRef] [PubMed]
- Fan, Q.; Zhang, W.; Li, B.; Li, D.J.; Zhang, J.; Zhao, F. Association between ABO blood group system and COVID-19 susceptibility in Wuhan. Front. Cell. Infect. Microbiol. 2020, 10, 404. [Google Scholar] [CrossRef] [PubMed]
- Roberts, G.H.L.; Park, D.S.; Coignet, M.V.; McCurdy, S.R.; Knight, S.C.; Partha, R.; Rhead, B.; Zhang, M.; Berkowitz, N.; Haug Baltzell, A.K. AncestryDNA COVID-19 host genetic study I 1 dentifies three novel loci. medRxiv 2020. [Google Scholar] [CrossRef]
- Valenti, L.; Villa, S.; Baselli, G.; Temporiti, R.; Bandera, A.; Scudeller, L.; Prati, D. Association of ABO blood groups and secretor phenotype with severe COVID-19. Transfusion 2020, 60, 3067–3070. [Google Scholar] [CrossRef]
- Almahdi, M.A.; Abdulrahman, A.; Alawadhi, A.; Rabaan, A.A.; AlQahtani, M. The effect of ABO blood group and antibody class on the risk of COVID-19 infection and severity of clinical outcomes. medRxiv 2020. [Google Scholar] [CrossRef]
- Hoiland, R.L.; Fergusson, N.A.; Mitra, A.R.; Griesdale, D.E.G.; Devine, D.V.; Stukas, S.; Cooper, J.; Thiara, S.; Foster, D.; Chen, L.Y.C.; et al. The association of ABO blood group with indices of disease severity and multiorgan dysfunction in COVID-19. Blood Adv. 2020, 4, 4981–4989. [Google Scholar] [CrossRef]
- Sardu, C.; Marfella, R.; Maggi, P.; Messina, V.; Cirillo, P.; Codella, V.; Gambardella, J.; Sardu, A.; Gatta, G.; Santulli, G.; et al. Implications of AB0 blood group in hypertensive patients with covid-19. BMC Cardiovasc. Disord. 2020, 20, 373. [Google Scholar] [CrossRef]
- Kibler, M.; Dietrich, L.; Kanso, M.; Carmona, A.; Marchandot, B.; Matsushita, K.; Trimaille, A.; How-Choong, C.; Odier, A.; Gennesseaux, G.; et al. Risk and severity of COVID-19 and ABO blood group in transcatheter aortic valve patients. J. Clin. Med. 2020, 9, 3769. [Google Scholar] [CrossRef] [PubMed]
- Delanghe, J.R.; De Buyzere, M.L.; Speeckaert, M.M. C3 and ACE1 polymorphisms are more important confounders in the spread and outcome of COVID-19 in comparison with ABO polymorphism. Eur. J. Prev. Cardiol. 2020, 27, 1331–1332. [Google Scholar] [CrossRef] [PubMed]
- Hodzic, A.; De la Fuente, J.; Cabezas-Cruz, A. COVID-19 in the developing world: Is the immune response to alpha-Gal an overlooked factor mitigating the severity of infection? ACS Infect. Dis. 2020, 6, 3104–3108. [Google Scholar] [CrossRef] [PubMed]
- Gallian, P.; Pastorino, B.; Morel, P.; Chiaroni, J.; Ninove, L.; Lamballerie, X. Lower prevalence of antibodies neutralizing SARS-CoV-2 in group O French blood donors. Antivir. Res. 2020, 181, 104880. [Google Scholar] [CrossRef]
- Ahmed, I.; Quinn, L.; Tan, B.K. COVID-19 and the ABO blood group in pregnancy: A tale of two multiethnic cities. Int. J. Lab. Hematol. 2020, 43, e45–e47. [Google Scholar] [CrossRef]
- Solmaz, I.; Araç, S. ABO Blood groups in COVID-19 patients; cross-sectional study. Int. J. Clin. Pract. 2020, e13927. [Google Scholar] [CrossRef]
- Pairo-Castineira, E.; Clohisey, S.; Klaric, L.; Bretherick, A.; Rawlik, K.; Parkinson, N.; Pasko, D.; Walker, S.; Richmond, A.; Fourman, M.H.; et al. Genetic mechanisms of critical illness in Covid-19. Nature 2020. [Google Scholar] [CrossRef]
- Dzik, S.; Eliason, K.; Morris, E.B.; Kaufman, R.M.; North, C.M. COVID-19 and ABO blood groups. Transfusion 2020, 60, 1883–1884. [Google Scholar] [CrossRef]
- Focosi, D.; Iorio, M.C.; Lanza, M. ABO blood group correlations with COVID-19: Cohort choice makes a difference. Clin. Infect. Dis. 2020. [Google Scholar] [CrossRef]
- Boudin, L.; Janvier, F.; Bylicki, O.; Dutasta, F. ABO blood groups are not associated with risk of acquiring the SARS-CoV-2 infection in young adults. Haematologica 2020, 105, 2841–2843. [Google Scholar] [CrossRef]
- Levi, J.E.; Telles, P.R.; Scrivani, H.; Campana, G. Lack of association between ABO blood groups and susceptibility to SARS-CoV-2 infection. Vox Sang. 2020. [Google Scholar] [CrossRef] [PubMed]
- Ravn, V.; Dabelsteen, E. Tissue distribution of histo-blood group antigens. APMIS 2000, 108, 1–28. [Google Scholar] [CrossRef] [PubMed]
- Yamamoto, F. Molecular genetics of ABO. Vox Sang. 2000, 78, 91–103. [Google Scholar] [PubMed]
- Marionneau, S.; Cailleau-Thomas, A.; Rocher, J.; Le Moullac-Vaidye, B.; Ruvoën-clouet, N.; Clément, M.; Le Pendu, J. ABH and Lewis histo-blood group antigens, a model for the meaning of oligosaccharide diversity in the face of a changing world. Biochimie 2001, 83, 565–573. [Google Scholar] [CrossRef]
- Cooling, L. Blood groups in infection and host susceptibility. Clin. Microbiol. Rev. 2015, 28, 801–870. [Google Scholar] [CrossRef]
- Springer, G.F.; Horton, R.E. Blood group isoantibody stimulation in man by feeding blood-group active bacteria. J. Clin. Investig. 1969, 48, 1280–1291. [Google Scholar] [CrossRef]
- Bello-Gil, D.; Audebert, C.; Olivera-Ardid, S.; Perez-Cruz, M.; Even, G.; Khasbiullina, N.; Gantois, N.; Shilova, N.; Merlin, S.; Costa, C.; et al. The formation of glycan-specific natural antibodies repertoire in GalT-KO mice is determined by gut microbiota. Front. Immunol. 2019, 10, 342. [Google Scholar] [CrossRef]
- Berséus, O.J. Effects on the anti-ABO titers of military blood donors from a predeployment vaccination program. Trauma Acute Care Surg. 2017, 82, S91–S95. [Google Scholar] [CrossRef]
- Mazda, T.; Yabe, R.; NaThalang, O.; Thammavong, T.; Tadokoro, K. Differences in ABO antibody levels among blood donors: A comparison between past and present Japanese, Laotian, and Thai Populations. Comp. Stud. Immunohematol. 2007, 23, 38–41. [Google Scholar]
- Villanea, F.A.; Safi, K.N.; Busch, J.W. A general model of negative frequency dependent selection explains global patterns of human ABO polymorphism. PLoS ONE 2015, 10, e0125003. [Google Scholar] [CrossRef]
- Segurel, L.; Gao, Z.; Przeworski, M. Ancestry runs deeper than blood: The evolutionary history of ABO points to cryptic variation of functional importance. Bioessays 2013, 35, 862–867. [Google Scholar] [CrossRef] [PubMed]
- Calafell, F.; Roubinet, F.; Ramirez-Soriano, A.; Saitou, N.; Bertanpetit, J.; Blancher, A. Evolutionary dynamics of the human ABO gene. Hum. Genet. 2008, 124, 123–135. [Google Scholar] [CrossRef] [PubMed]
- Ferrer-Admetlla, A.; Sikora, M.; Laayouni, H.; Esteve, A.; Roubinet, F.; Blancher, A.; Calafell, F.; Bertanpetit, J.; Calafell, F. A natural history of FUT2 polymorphism in humans. Mol. Biol. Evol. 2009, 26, 1993–2003. [Google Scholar] [CrossRef] [PubMed]
- Silva, L.M.; Carvalho, A.S.; Guillon, P.; Seixas, S.; Azevedo, M.; Almeida, R.; Ruvoën-Clouet, N.; Reis, C.A.; Le Pendu, J.; Rocha, J.; et al. Infection-associated FUT2 (fucosyltransferase 2) genetic variation and impact on functionality assessed by in vivo studies. Glycoconj. J. 2010, 27, 61–68. [Google Scholar] [CrossRef]
- Yamamoto, F.; Cid, E.; Yamamoto, M.; Saitou, N.; Bertranpetit, J.; Blancher, A. An integrative evolution theory of histo-blood group ABO and related genes. Sci. Rep. 2014, 4, 6601. [Google Scholar] [CrossRef]
- Le Pendu, J.; Ruvöen-Clouet, N. Fondness for sugars of enteric viruses confronts them with human glycans genetic diversity. Hum. Genet. 2019, 139, 903–910. [Google Scholar] [CrossRef]
- Le Pendu, J.; Nystrom, K.; Ruvoen-Clouet, N. Host-pathogen co-evolution and glycan interactions. Curr. Opin. Virol. 2014, 7, 88–94. [Google Scholar] [CrossRef]
- Seymour, R.M.; Allan, M.J.; Pomiankovski, A.; Gustafsson, K. Evolution of the human ABO polymorphism by two complementary selective pressures. Proc. Biol. Sci. 2004, 271, 1065–1072. [Google Scholar] [CrossRef]
- Galili, U. Host synthesized carbohydrate antigens on viral glycoproteins as “Achilles’ heel” of viruses contributing to anti-viral immune protection. Int. J. Mol. Sci. 2020, 21, 6702. [Google Scholar] [CrossRef]
- Breiman, A.; Ruvoën-Clouet, N.; Le Pendu, J. Harnessing the natural anti-glycan immune response to limit the transmission of enveloped viruses such as SARS-CoV-2. PLoS Pathog. 2020, 16, e1008556. [Google Scholar] [CrossRef]
- Dai, X. ABO blood group predisposes to COVID-19 severity and cardiovascular diseases. Eur. J. Prev. Cardiol. 2020, 27, 1436–1437. [Google Scholar] [CrossRef] [PubMed]
- AbdelMassih, A.F.; Mahrous, R.; Taha, A.; Saud, A.; Osman, A.; Kamel, B.; Yacoub, E.; Menshawey, E.; Ismail, H.A.; Aita, L.; et al. The potential use of ABO blood group system for risk stratification of COVID-19. Med. Hypotheses 2020, 145, 110343. [Google Scholar] [CrossRef] [PubMed]
- Yamamoto, F.; Yamamoto, M.; Muniz-Diaz, E. Blood group ABO polymorphism inhibits SARS-CoV-2 infection and affects COVID-19 progression. Vox Sang. 2020. [Google Scholar] [CrossRef] [PubMed]
- Wolfel, R.; Corman, V.M.; Guggemos, W.; Seilmaier, M.; Zange, S.; Muller, M.A.; Niemeyer, D.; Jones, T.C.; Vollmar, P.; Rothe, C.; et al. Virological assessment of hospitalized patients with COVID-2019. Nature 2020, 581, 465–469. [Google Scholar] [CrossRef]
- Ziegler, C.G.K.; Allon, S.J.; Nyquist, S.K.; Mbano, I.M.; Miao, V.N.; Tzouanas, C.N.; Cao, Y.; Yousif, A.S.; Bals, J.; Hauser, B.M.; et al. SARS-CoV-2 receptor ACE2 is an interferon-stimulated gene in human airway epithelial cells and is detected in specific cell subsets across tissues. Cell 2020, 181, 1016e19–1035e19. [Google Scholar] [CrossRef]
- Sungnak, W.; Huang, N.; Bécavin, C.; Berg, M.; Queen, R.; Litvinukova, M.; Talavera-Lopez, C.; Maatz, H.; Reichart, D.; Sampaziotis, F.; et al. SARS-CoV-2 entry factors are highly expressed in nasal epithelial cells together with innate immune genes. Nat. Med. 2020, 26, 681–687. [Google Scholar] [CrossRef]
- Lukassen, S.; Chua, R.L.; Trefzer, T.; Kahn, N.C.; Schneider, M.A.; Muley, T.; Winter, H.; Meister, M.; Veith, C.; Boots, A.W.; et al. SARS-CoV-2 receptor ACE2 and TMPRSS2 are primarily expressed in bronchial transient secretory cells. EMBO J. 2020, 39, e105114. [Google Scholar] [CrossRef]
- Watanabe, Y.; Allen, J.D.; Wrapp, D.; McLellan, J.S.; Crispin, M. Site-specific glycan analysis of the SARS-CoV-2 spike. Science 2020, 369, 330–333. [Google Scholar]
- Shajahan, A.; Supekar, N.T.; Gleinich, A.S.; Azadi, P. Deducing the N- and O- glycosylation profile of the spike protein of novel coronavirus SARS-CoV-2. Glycobiology 2020, 30, 981–988. [Google Scholar] [CrossRef]
- Sanda, M.; Morrison, L.; Goldman, R. N and O glycosylation of the SARS-CoV-2 spike protein. bioRxiv 2020. [Google Scholar] [CrossRef]
- Sun, Z.; Ren, K.; Zhang, X.; Chen, J.; Jiang, Z.; Jiang, J.; Ji, F.; Ouyang, X.; Li, L. Mass spectrometry analysis of newly emerging coronavirus HCoV-19 spike protein and human ACE2 reveals camouflaging glycans and unique post-translational modifications. Engineering (Beijing) 2020. [Google Scholar] [CrossRef] [PubMed]
- Deleers, M.; Breiman, A.; Daubie, V.; Maggetto, C.; Barreau, I.; Besse, T.; Clémenceau, B.; Ruvoën-Clouet, N.; Fils, J.F.; Maillart, E.; et al. Covid-19 and blood groups: ABO antibody levels may also matter. Int. J. Infect. Dis. 2020. [Google Scholar] [CrossRef] [PubMed]
- Cheng, Y.; Cheng, G.; Chui, C.H.; Lau, F.Y. ABO blood group and susceptibility to severe acute respiratory syndrome. JAMA 2005, 293, 1450–1451. [Google Scholar] [PubMed]
- Guillon, P.; Clément, M.; Sébille, V.; Rivain, J.-G.; Chou, C.-F.; Ruvoën-Clouet, N.; Le Pendu, J. Inhibition of the interaction beteen the SARS-CoV spike protein and its cellular receptor by anti-histo-blood group antibodies. Glycobiology 2008, 18, 1085–1093. [Google Scholar] [CrossRef] [PubMed]
- Preece, A.F.; Strahan, K.M.; Devitt, J.; Yamamoto, F.F.; Gustavson, K. Expression of ABO or related antigenic carbohydrates on viral envelopes leads to neutralization in the presence of serum containing specific natural antibodies and complement. Blood 2002, 99, 2477–2482. [Google Scholar] [CrossRef] [PubMed]
- Macher, B.A.; Galili, U. The Galα1,3Galβ1,4GlcNAc-R (α-Gal) epitope: A carbohydrate of unique evolution and clinical relevance. Biochem. Biophys. Acta 2008, 1780, 75–88. [Google Scholar] [CrossRef] [PubMed]
- Galili, U. Human natural antibodies to mammalian carbohydrate antigens as unsung heroes protecting against past, present, and future viral infections. Antibodies 2020, 9, 25. [Google Scholar] [CrossRef]
- Stowell, S.R.; Stowell, C.P. Biologic roles of the ABH and Lewis histo-blood group antigens. Part II: Thrombosis, cardiovascular disease and metabolism. Vox Sang. 2019, 114, 535–552. [Google Scholar] [CrossRef]
- Kiechl, S.; Pare, G.; Barbalic, M.; Qi, L.; Dupuis, J.; Dehghan, A.; Bis, J.C.; Laxton, R.C.; Xiao, Q.; Bonora, E.; et al. Association of variation at the ABO locus with circulating levels of soluble intercellular adhesion molecule-1, soluble P-selectin, and soluble E-selectin: A meta-analysis. Circ. Cardiovasc. Genet. 2011, 4, 681–686. [Google Scholar] [CrossRef]
- Walls, A.C.; Park, Y.-J.; Tortorici, M.A.; Wall, A.; McGuire, A.T.; Veesler, D. Structure, function, and antigenicity of the SARS-CoV-2 spike glycoprotein. Cell 2020, 181, 281.e6–292.e6. [Google Scholar] [CrossRef]
- Pelaseyed, T.; Hansson, G.C. Membrane mucins of the intestine at a glance. J. Cell Sci. 2020, 133, jcs240929. [Google Scholar] [CrossRef] [PubMed]
- Li, S.C.; Xu, R.X.; Guo, Y.L.; Zhang, Y.; Zhu, C.; Sun, J.; Li, J.J. ABO blood group in relation to plasma lipids and proprotein convertase subtilisin/kexin type 9. Nutr. Metab. Cardiovasc. Dis. 2015, 25, 411–417. [Google Scholar] [CrossRef] [PubMed]
- Li, S.C.; Schooling, C.M. A phenome-wide association study of ABO blood groups. BMC Med. 2020, 18, 334. [Google Scholar] [CrossRef]
- Segal, J.P.; Mak, J.W.Y.; Mullish, B.H.; Alexander, J.L.; Ng, S.C.; Marchesi, J.R. The gut microbiome: An under-recognised contributor to the COVID-19 pandemic? Therap. Adv. Gastroenterol. 2020, 13. [Google Scholar] [CrossRef] [PubMed]
- Makivuokko, H.; Lahtinen, S.J.; Wacklin, P.; Tuovinen, E.; Tenkanen, H.; Nikkila, J.; Bjorklund, M.; Aranko, K.; Ouwehand, A.C.; Matto, J. Association between the ABO blood group and the human intestinal microbiota composition. BMC Microbiol. 2012, 12, 94. [Google Scholar] [CrossRef]
- Gampa, A.; Engen, P.A.; Shobar, R.; Mutlu, E.A. Relationships between gastrointestinal microbiota and blood group antigens. Physiol. Genom. 2017, 49, 473–483. [Google Scholar] [CrossRef]
- Shintouo, C.M.; Mets, T.; Beckwee, D.; Baumans, I.; Ghogomu, S.M.; Souopgui, J.; Leemans, L.; Meriki, H.D.; Njemini, R. Is inflammageing influenced by the microbiota in the aged gut? A systematic review. Exp. Gerontol. 2020, 141, 111079. [Google Scholar] [CrossRef]
- Liu, N.; Zhang, T.; Ma, L.; Zhang, H.; Wang, H.; Wei, W.; Pei, H.; Li, H. The impact of ABO blood group on COVID-19 infection risk and mortality: A systematic review and meta-analysis. Blood Rev. 2020, 100785. [Google Scholar] [CrossRef]
- Wu, B.-B.; Gu, D.-Z.; Yu, J.-N.; Yang, J.; Shen, W.-Q. Association between ABO blood groups and COVID-19 infection, severity and demise: A systematic review and meta-analysis. Infect. Genet. Evol. 2020, 84, 104485. [Google Scholar] [CrossRef]
- Pourali, F.; Afshari, M.; Alizadeh-Navaei, R.; Javidnia, J.; Moosazadeh, M.; Hessami, A. Relationship between blood group and risk of infection and death in COVID-19: A live meta-analysis. New Microbes New Infect. 2020, 37, 100743. [Google Scholar] [CrossRef]
- Golinelli, D.; Boetto, E.; Maietti, E.; Fantini, M.P. The association between ABO blood group and SARS-CoV-2 infection: A meta-analysis. PLoS ONE 2020, 15, e0239508. [Google Scholar] [CrossRef]
- Liu, Y.; Haüssinger, L.; Cand, M.D.; Steinaker, J.M.; Dinse-Lambracht, A. Association between epidemic dynamics of Covid-19 infection and ABO blood group types. medRxiv 2020. [Google Scholar] [CrossRef]
- Morgan, R.C.; Reid, T.N. On answering the call to action for COVID-19: Continuing a bold legacy of health advocacy. J. Natl. Med. Assoc. 2020, 112, 324–328. [Google Scholar] [CrossRef]
- Mourant, A.E. Blood Relations: Blood Groups and Anthropology, 2rd ed.; Oxford University Press: Oxford, UK, 1983. [Google Scholar]
- O’Driscoll, M.; Ribeiro Dos Santos, G.; Wang, L.; Cummings, D.A.T.; Azman, A.S.; Paireau, J.; Fontanet, A.; Cauchemez, S.; Salje, H. Age-specific mortality and immunity patterns of SARS-CoV-2. Nature 2020. [Google Scholar] [CrossRef] [PubMed]
- Pullano, G.; Valdano, E.; Scarpa, N.; Rubrichit, S.; Colizza, V. Evaluating the effect of demographic factors, socioeconomic factors, and risk aversion on mobility during the COVID-19 epidemic in France under lockdown: A population-based study. Lancet Digit. Health 2020, 2, e638–e649. [Google Scholar] [CrossRef]
- Priyadrasini, S.L.; Suresh, M. Factors influencing the epidemiological characteristics of pandemic COVID 19: A TISM approach. Int. J. Healthc. Manag. 2020, 13, 89–98. [Google Scholar] [CrossRef]
- Roy, S.; Ghosh, P. Factors affecting COVID-19 infected and death rates inform lockdown-related policymaking. PLoS ONE 2020, 15, e0241165. [Google Scholar] [CrossRef]
- Patel, J.A.; Nielsen, F.B.H.; Badiani, A.A.; Assi, S.; Unadkat, V.A.; Patel, B.; Ravindrane, R.; Wardle, H. Poverty, inequality and COVID-19: The forgotten vulnerable. Public Health 2020, 183, 110–111. [Google Scholar] [CrossRef]
- Estrada-Mena, B.; Estrada, F.J.; Ulloa-Arvizu, R.; Guido, M.; Méndez, R.; Coral, R.; Canto, T.; Granados, J.; Rubi-Castellanos, R.; Rangel-Villalobos, H.; et al. Blood group O alleles in Native Americans: Implications in the peopling of the Americas. Am. J. Phys. Anthropol. 2010, 142, 85–94. [Google Scholar] [CrossRef]
- Hatcher, S.M.; Agnew-Brune, C.; Anderson, M.; Zambrano, L.; Rose, C.E.; Jim, M.A.; Baugher, A.; Liu, G.S.; Patel, S.V.; Evans, M.E.; et al. COVID-19 among American Indian and Alaska Native persons—23 States, 31 January 31–3 July 2020. Morb. Mortal. Wkly. Rep. 2020, 69, 1166–1169. [Google Scholar] [CrossRef]
- Delaney, M.; Harris, S.; Haile, A.; Johnsen, J.; Teramura, G.; Nelson, K. Red blood cell antigen genotype analysis for 9087 Asian, Asian American, and Native American blood donors. Transfusion 2015, 55, 2369–2375. [Google Scholar] [CrossRef] [PubMed]
- Muthana, S.M.; Gildersleeve, J.C. Factors affecting anti-glycan IgG and IgM repertoires in human serum. Sci. Rep. 2016, 6, 19509. [Google Scholar] [CrossRef] [PubMed]
- Daniel-Johnson, J.; Leitman, S.; Klein, H.; Alter, H.; Lee-Stroka, A.; Scheinberg, P.; Pantin, J.; Quillen, K. Probiotic-associated high-titer anti-B in a group A platelet donor as a cause of severe hemolytic transfusion reactions. Transfusion 2009, 49, 1845–1849. [Google Scholar] [CrossRef] [PubMed]
- Cooling, L.; Worrell, H.; Novak, B.; Hugan, S. Changes in Anti-B with enteral nutrition, diet, and probiotic use in children. Transfusion 2019, 59, 127A–128A. [Google Scholar]


| Country | Cases | Controls | ABO Effect a | Ref. | ||||
|---|---|---|---|---|---|---|---|---|
| Definition b | Number | Definition c | O | A | B | AB | ||
| China | I | 1775 | I | <Risk | >Risk | ns | ns | [1] |
| USA | I | 682 | I | <Risk | >Risk | ns | ns | [2] |
| China | II | 2153 | I | <Risk | >Risk | ns | ns | [3] |
| Turkey | I | 186 | III | <Risk | >Risk | ns | ns | [4] |
| Spain/Italy d | III | 1610 | III + IV | <Risk | >Risk | ns | ns | [5] |
| China | I | 187 | IV | <Risk | >Risk | ns | ns | [6] |
| USA | V | 3239 | V | <Risk | >Risk | ns | ns | [7] |
| China | III + IV | 97 | I | <Risk | >Risk | ns | ns | [8] |
| Turkey | I | 179 | IV | <Risk | >Risk | ns | ns | [9] |
| Iran | VII | 76 | I | <Risk | >Risk | ns | ns | [10] |
| China | V | 134 | I | <Risk | >Risk | ns | ns | [11] |
| Spain | VIII | 854 | VI | <Risk | >Risk | ns | ns | [12] |
| Spain | IX | 965 | III | <Risk | >Risk | ns | ns | [12] |
| UK | I | 86 | II | <Risk | >Risk | ns | ns | [35] |
| Turkey | II | 1667 | I | <Risk | >Risk | ns | ns | [36] |
| Iran | VI | 93 | I | <Risk | >Risk | >Risk | >Risk | [13] |
| USA | I | 1289 | II | <Risk | ns | >Risk | >Risk | [14] |
| Canada | I | 7071 | II | <Risk | ns | >Risk | >Risk | [15] |
| India | I | 8102 | I | <Risk | ns | >Risk | ns | [16] |
| Spain | II | 226 | I | <Risk | ns | >Risk | ns | [17] |
| Saudi-Arabia | II | 72 | III | <Risk | ns | ns | >Risk | [18] |
| Iran | I | 397 | IV | <Risk | ns | ns | >Risk | [19] |
| USA + UK | I | 15,434 | II | <Risk | ns | ns | ns | [20] |
| USA | I | 34,178 | II | <Risk | ns | ns | ns | [21] |
| Denmark | V | 7422 | I | <Risk | ns | ns | ns | [22] |
| International | I + II | 6696 + 3199 | II | <Risk | >Risk | [23] | ||
| Italy | I | 447 | III | <Risk | ns | ns | ns | [24] |
| China | II | 103 | II | ns | >Risk | ns | ns | [25] |
| USA | I | 2417 | I | ns | >Risk | ns | ns | [26] |
| Italy/Spain | III | 505 | VI | ns | >Risk | ns | >Risk | [27] |
| Bahrain | V | 2334 | III | ns | ns | >Risk | <Risk | [28] |
| Canada | V | 95 | I | ns | ns | ns | ns | [29] |
| UK | V | 2244 | I | ns | ns | ns | ns | [37] |
| Brazil | I | 2037 | II | ns | ns | ns | ns | [41] |
| USA | II | 957 | IV | ns | ns | ns | ns | [38] |
| Country | Type of Study | ABO Effect b | Ref. | |||
|---|---|---|---|---|---|---|
| O | A | B | AB | |||
| Italy | Analysis of clinical and biological criteria among hypertensive COVID-19 patients | <risk | [30] | |||
| Canada | Analysis of clinical and biological criteria among critically ill COVID-19 patients | <risk | >risk | <risk | >risk | [29] |
| Spain | Analysis of the risk of death among COVID-19 patients requiring transfusion | <risk | ns | ns | [12] | |
| Canada | Separate analyses of patients with or without severe illness | <risk | ns | >risk | >risk | [15] |
| France | Comparison between patients who underwent transcatheter aortic valve replacement | ns | >risk | ns | ns | [31] |
| Country | Type of Study | ABO Effect a | Ref. | |||
|---|---|---|---|---|---|---|
| O | A | B | AB | |||
| Europe, Africa, Middle-East, Asia | Association between frequency of the A allele and COVID-19 prevalence across countries | >Risk | [32] | |||
| Europe, Africa, Asia, America | Correlation between frequency of B+AB blood types and COVID-19 prevalence across countries | <Risk | [33] | |||
| France | Comparison of ABO phenotypes of blood donors with SARS-CoV-2 neutralizing antibodies | <Risk | >Risk | ns | ns | [34] |
| Italy | Comparison of ABO phenotypes of blood donors with SARS-CoV-2 anti-N antibodies | ns | ns | ns | ns | [39] |
| France | Comparison of ABO phenotypes of COVID+ vs. COVID− aircraft carrier crew members | ns | ns | ns | ns | [40] |
Publisher’s Note: MDPI stays neutral with regard to jurisdictional claims in published maps and institutional affiliations. |
© 2021 by the authors. Licensee MDPI, Basel, Switzerland. This article is an open access article distributed under the terms and conditions of the Creative Commons Attribution (CC BY) license (http://creativecommons.org/licenses/by/4.0/).
Share and Cite
Pendu, J.L.; Breiman, A.; Rocher, J.; Dion, M.; Ruvoën-Clouet, N. ABO Blood Types and COVID-19: Spurious, Anecdotal, or Truly Important Relationships? A Reasoned Review of Available Data. Viruses 2021, 13, 160. https://doi.org/10.3390/v13020160
Pendu JL, Breiman A, Rocher J, Dion M, Ruvoën-Clouet N. ABO Blood Types and COVID-19: Spurious, Anecdotal, or Truly Important Relationships? A Reasoned Review of Available Data. Viruses. 2021; 13(2):160. https://doi.org/10.3390/v13020160
Chicago/Turabian StylePendu, Jacques Le, Adrien Breiman, Jézabel Rocher, Michel Dion, and Nathalie Ruvoën-Clouet. 2021. "ABO Blood Types and COVID-19: Spurious, Anecdotal, or Truly Important Relationships? A Reasoned Review of Available Data" Viruses 13, no. 2: 160. https://doi.org/10.3390/v13020160
APA StylePendu, J. L., Breiman, A., Rocher, J., Dion, M., & Ruvoën-Clouet, N. (2021). ABO Blood Types and COVID-19: Spurious, Anecdotal, or Truly Important Relationships? A Reasoned Review of Available Data. Viruses, 13(2), 160. https://doi.org/10.3390/v13020160