
Trans-Activator Binding Site Context in RCNMV Modulates Subgenomic mRNA Transcription


Abstract
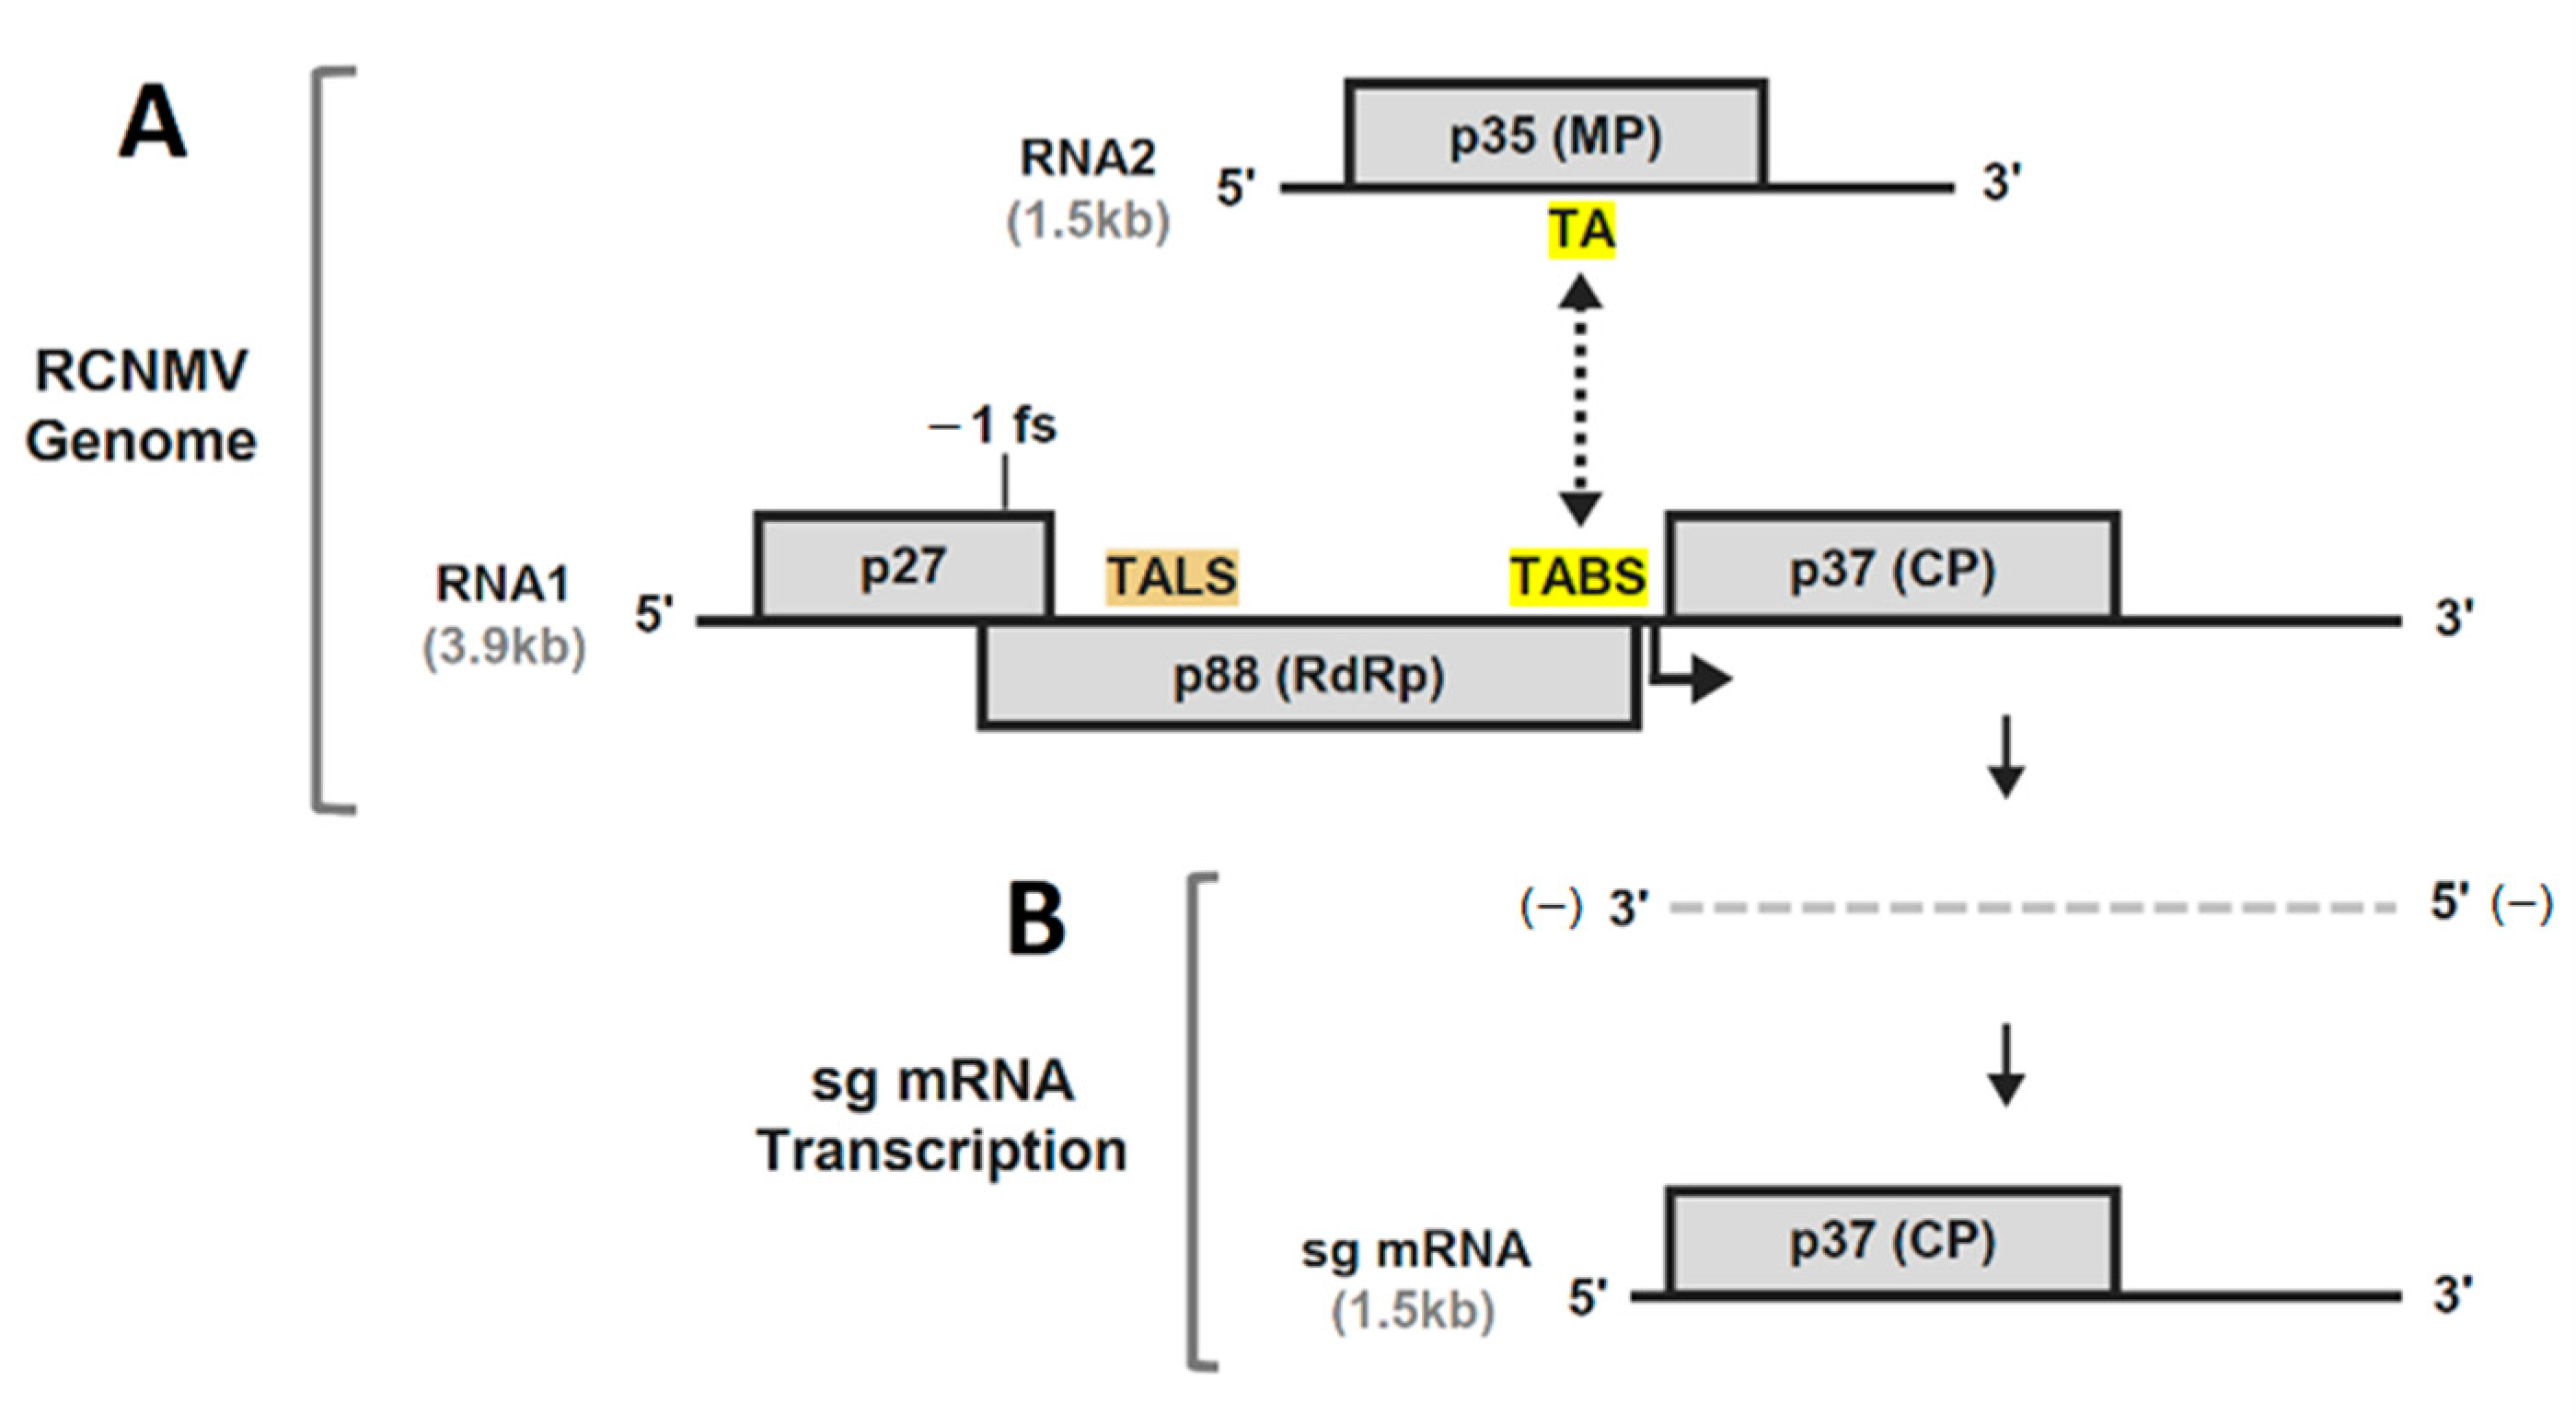
1. Introduction
2. Materials and Methods
2.1. Viral Constructs
2.2. Preparation of Infectious Viral RNAs
2.3. SHAPE RNA Secondary Structure Analysis
2.4. Protoplast Transfections and Viral RNA Analysis
2.5. Electrophoretic Mobility Shift Assay (EMSA)
3. Results and Discussion
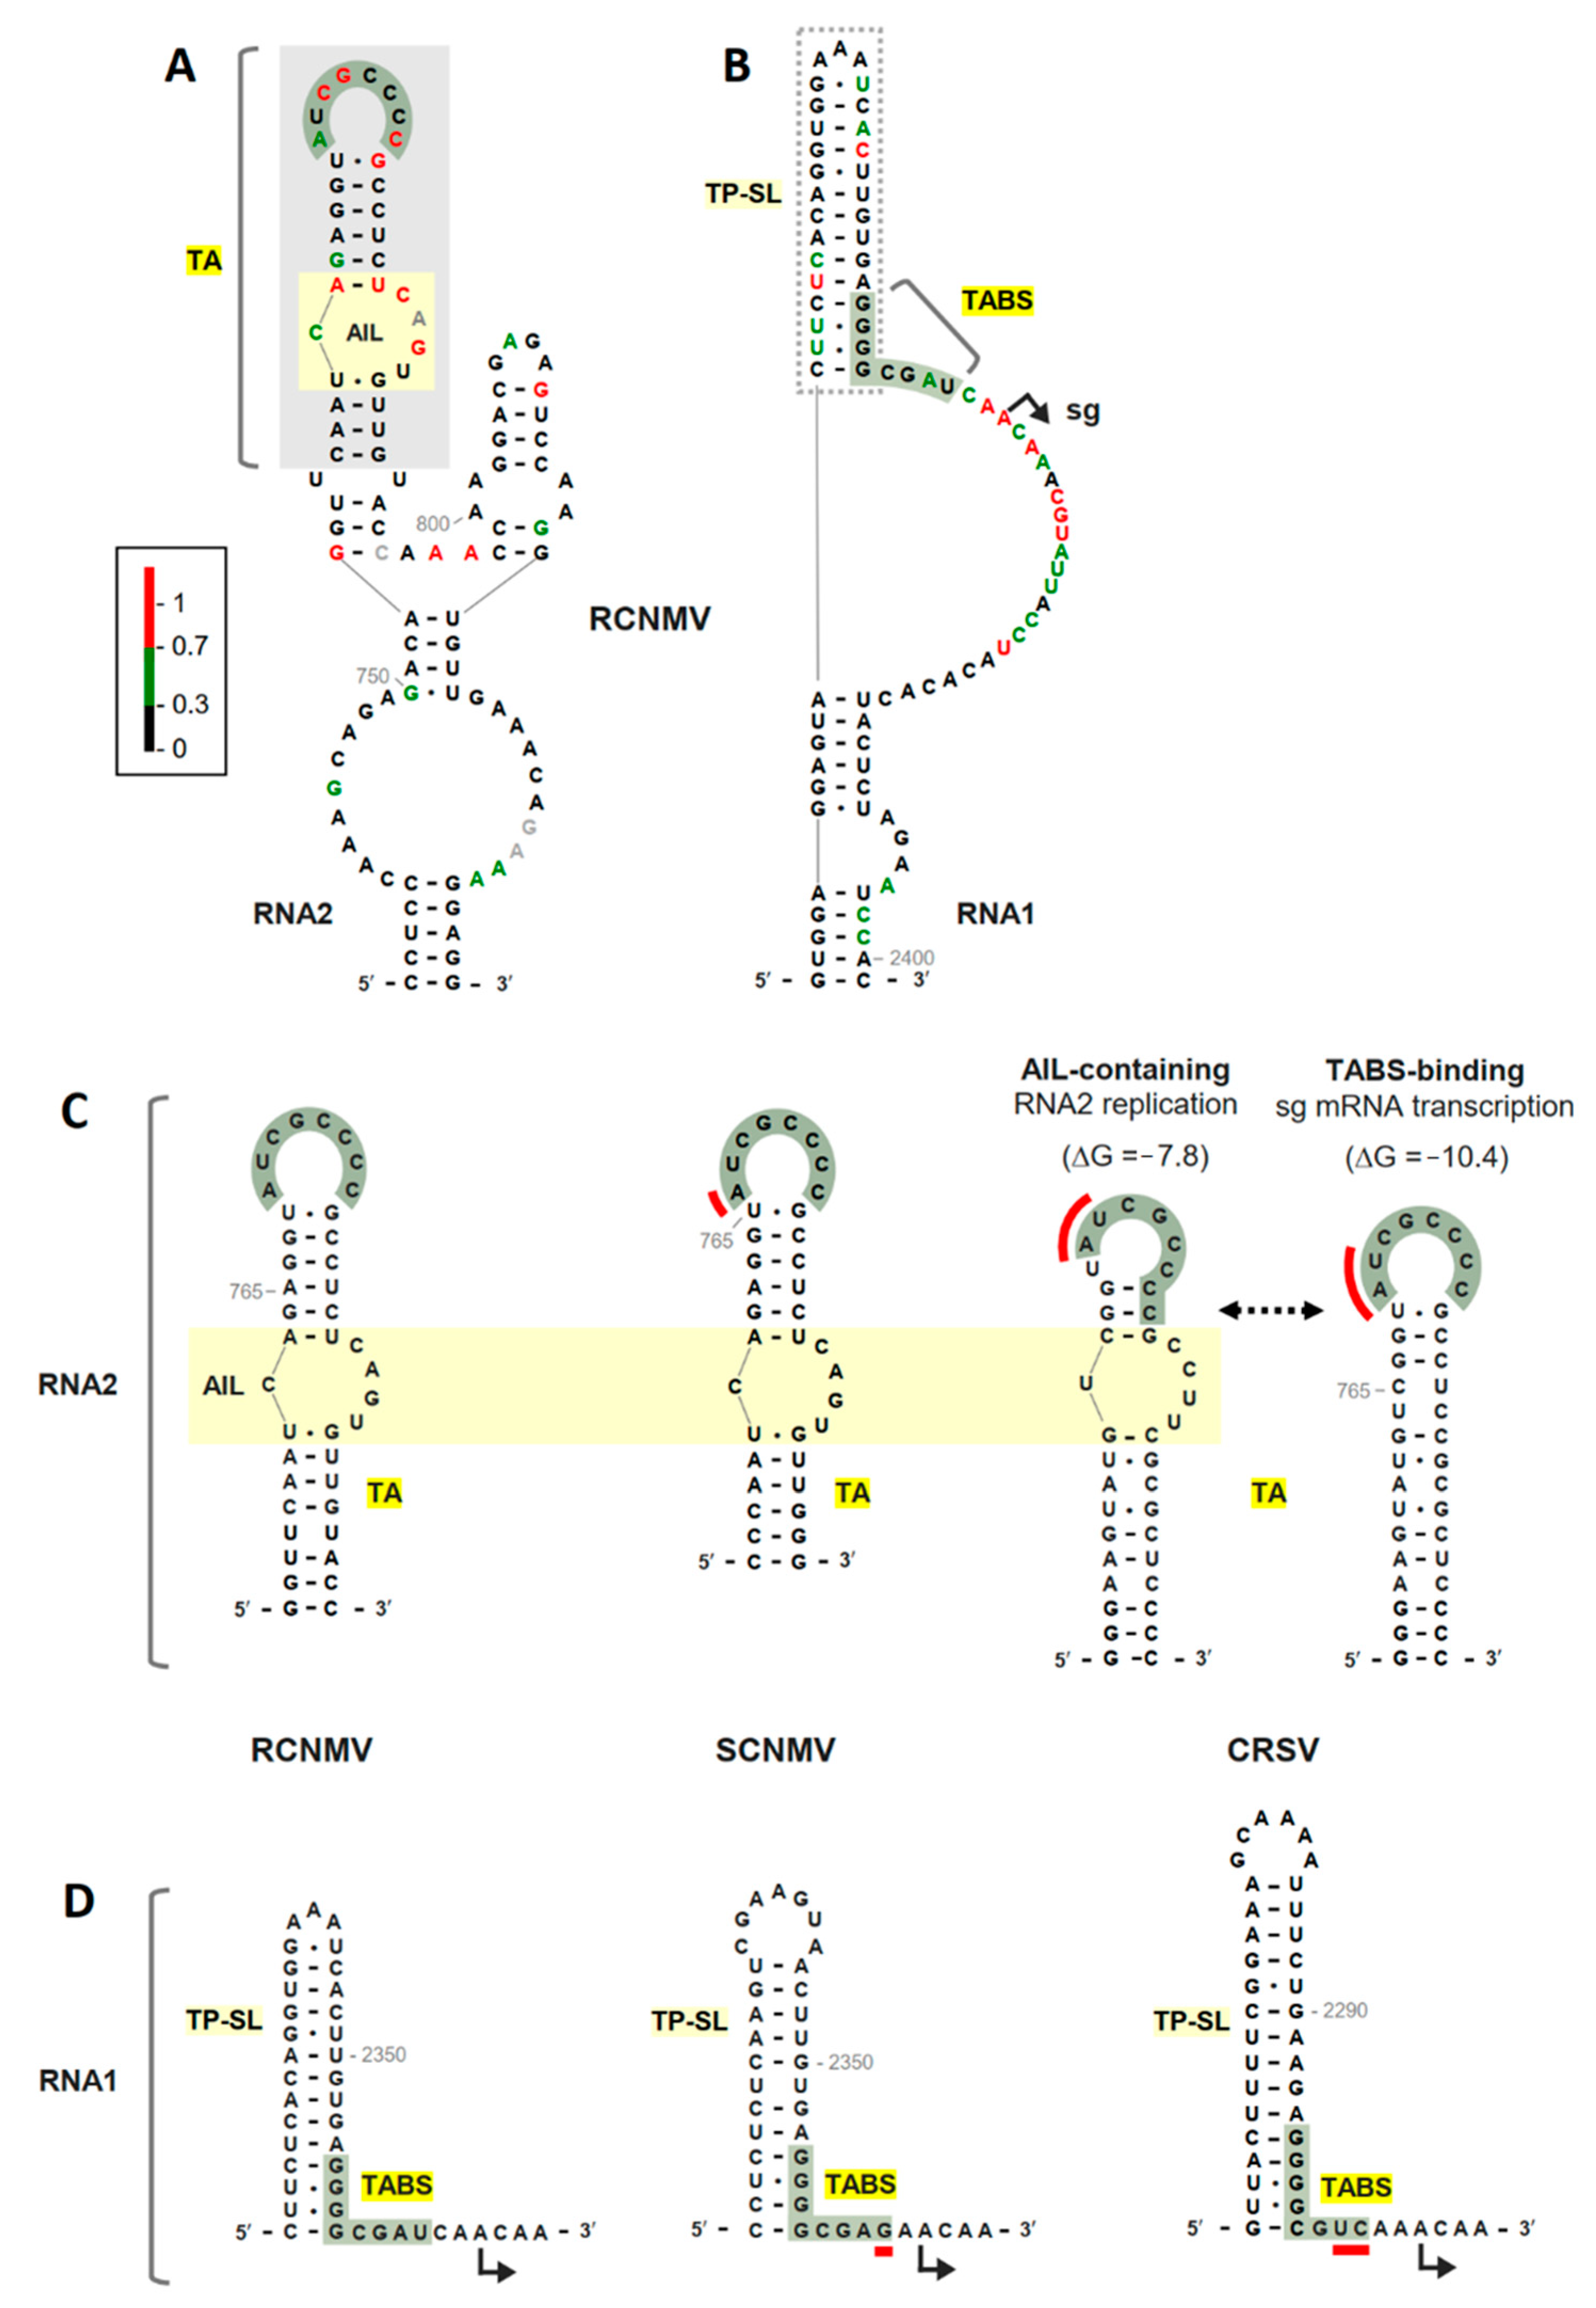
3.1. RNA Secondary Structure Analyses of the TA and TABS
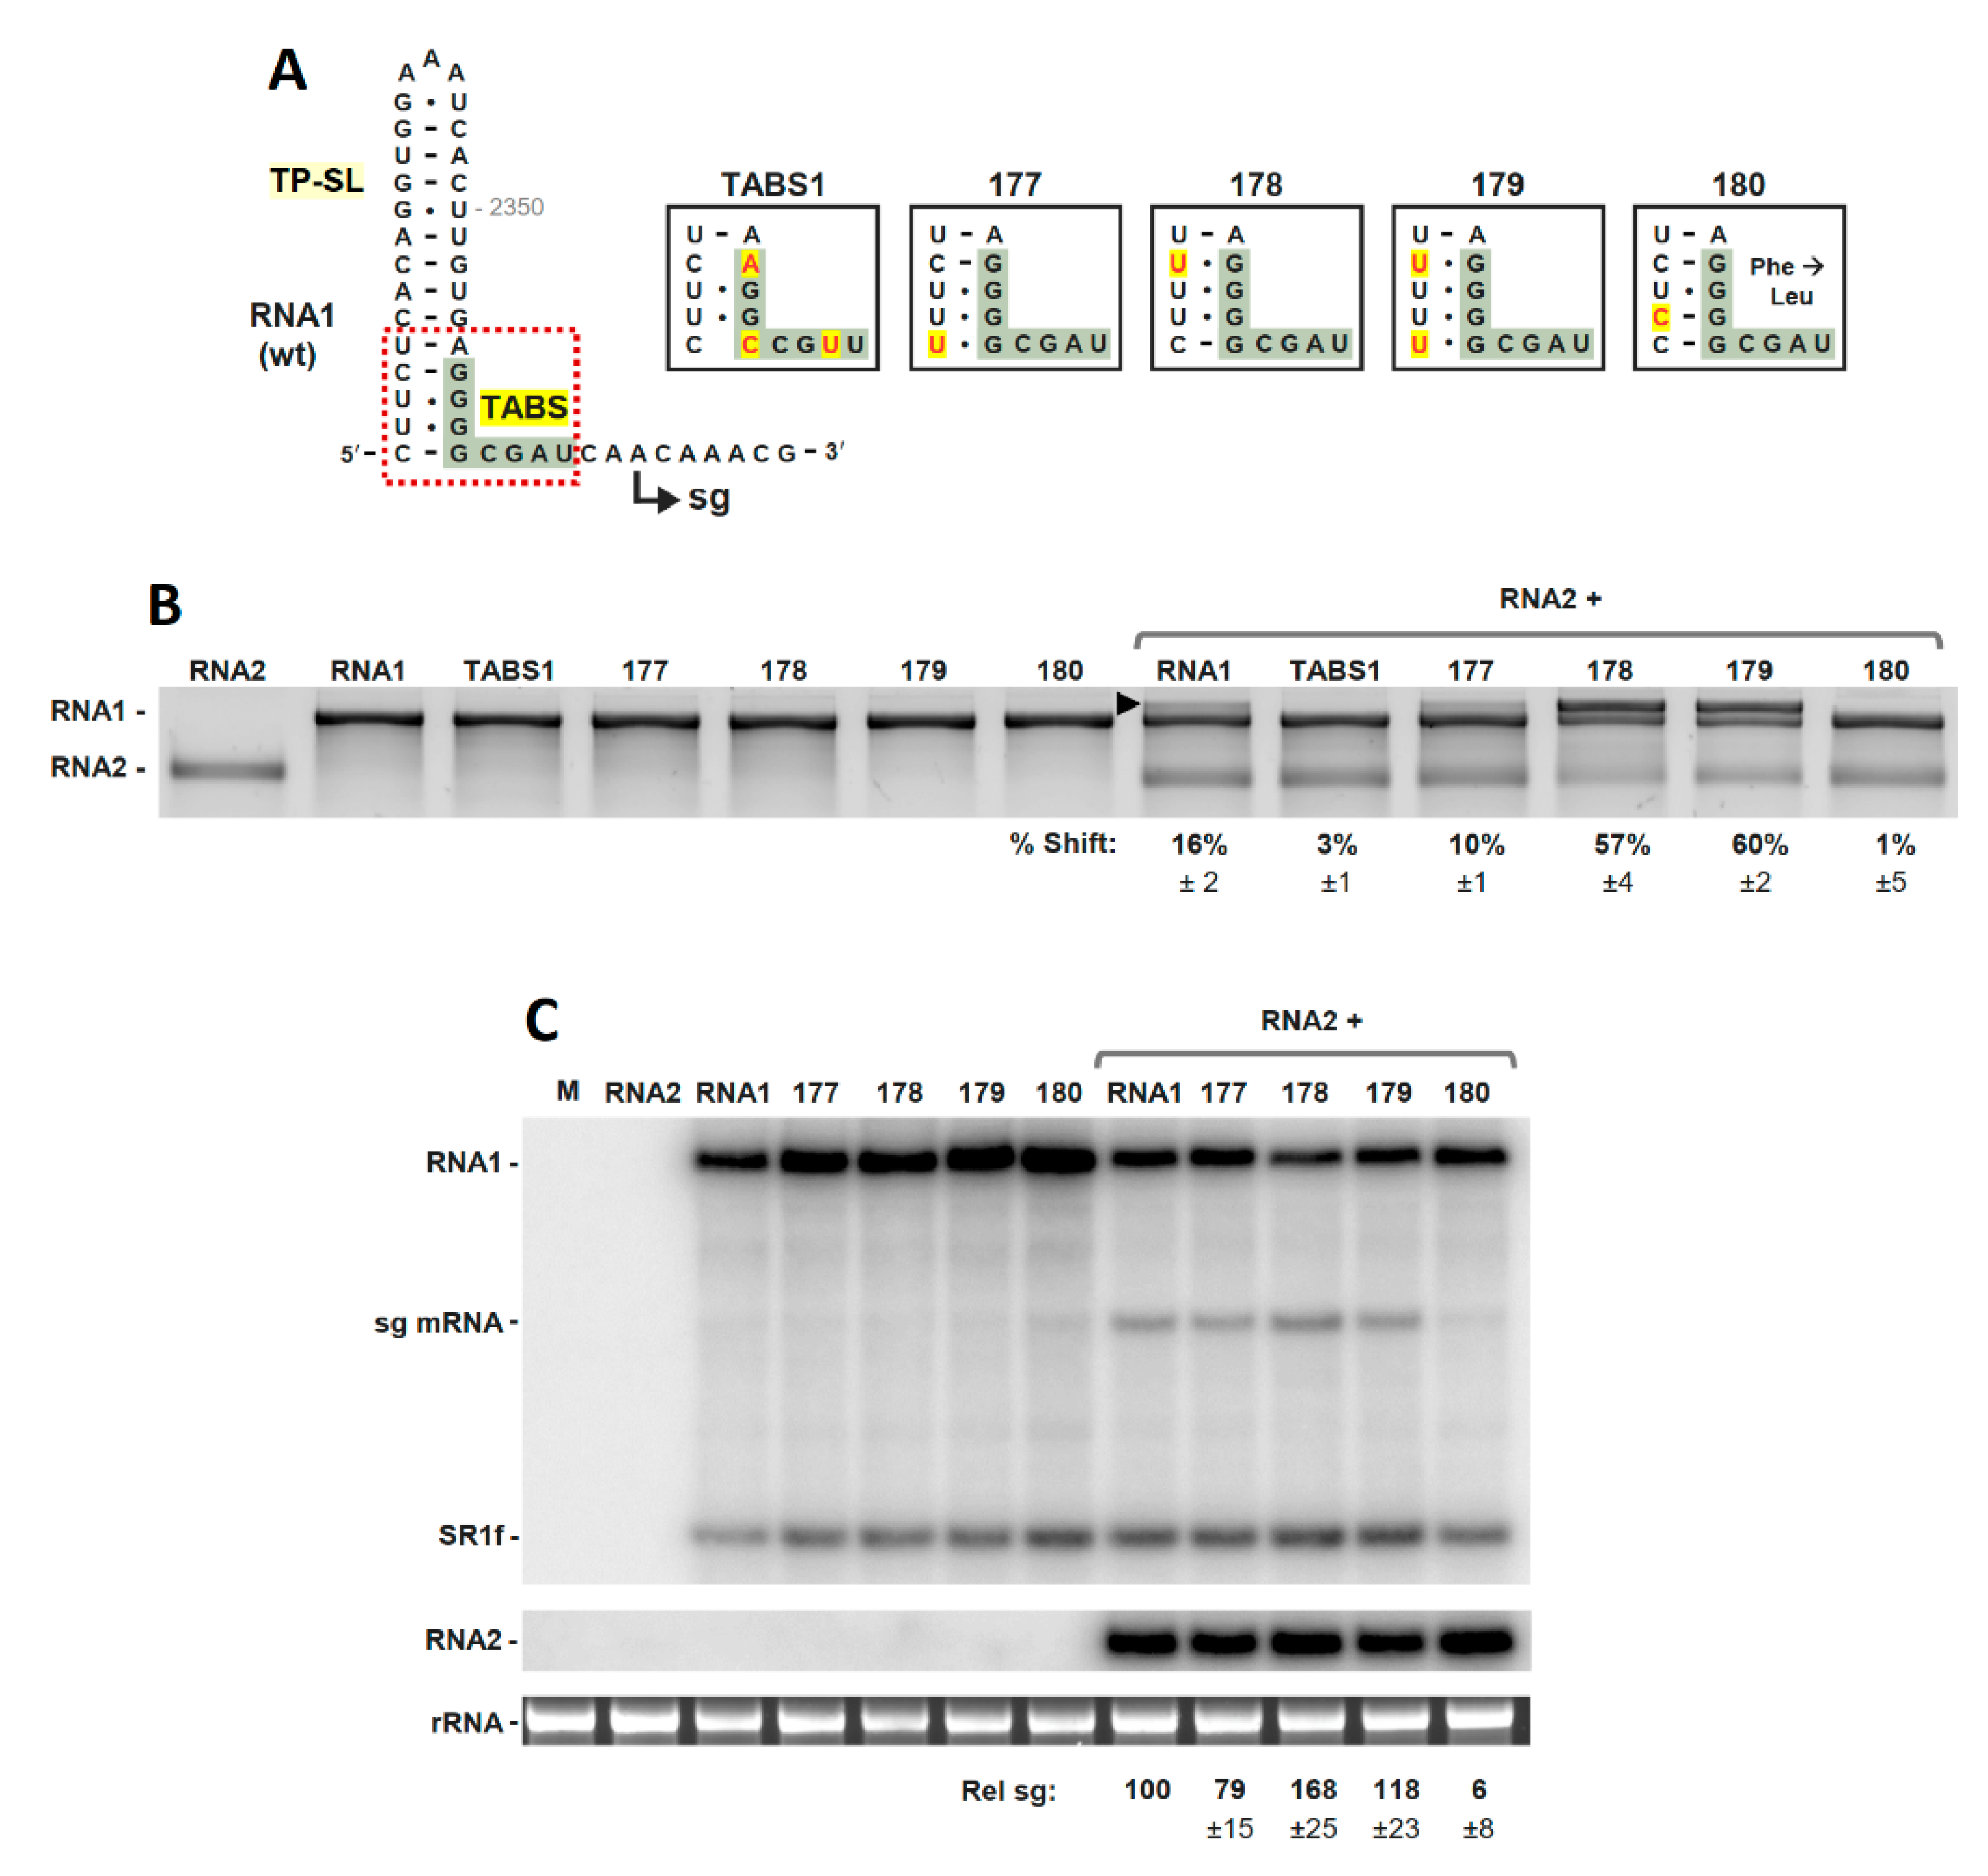
3.2. The TABS Structural Context Modulates the TA–TABS Interaction and sg mRNA Transcription
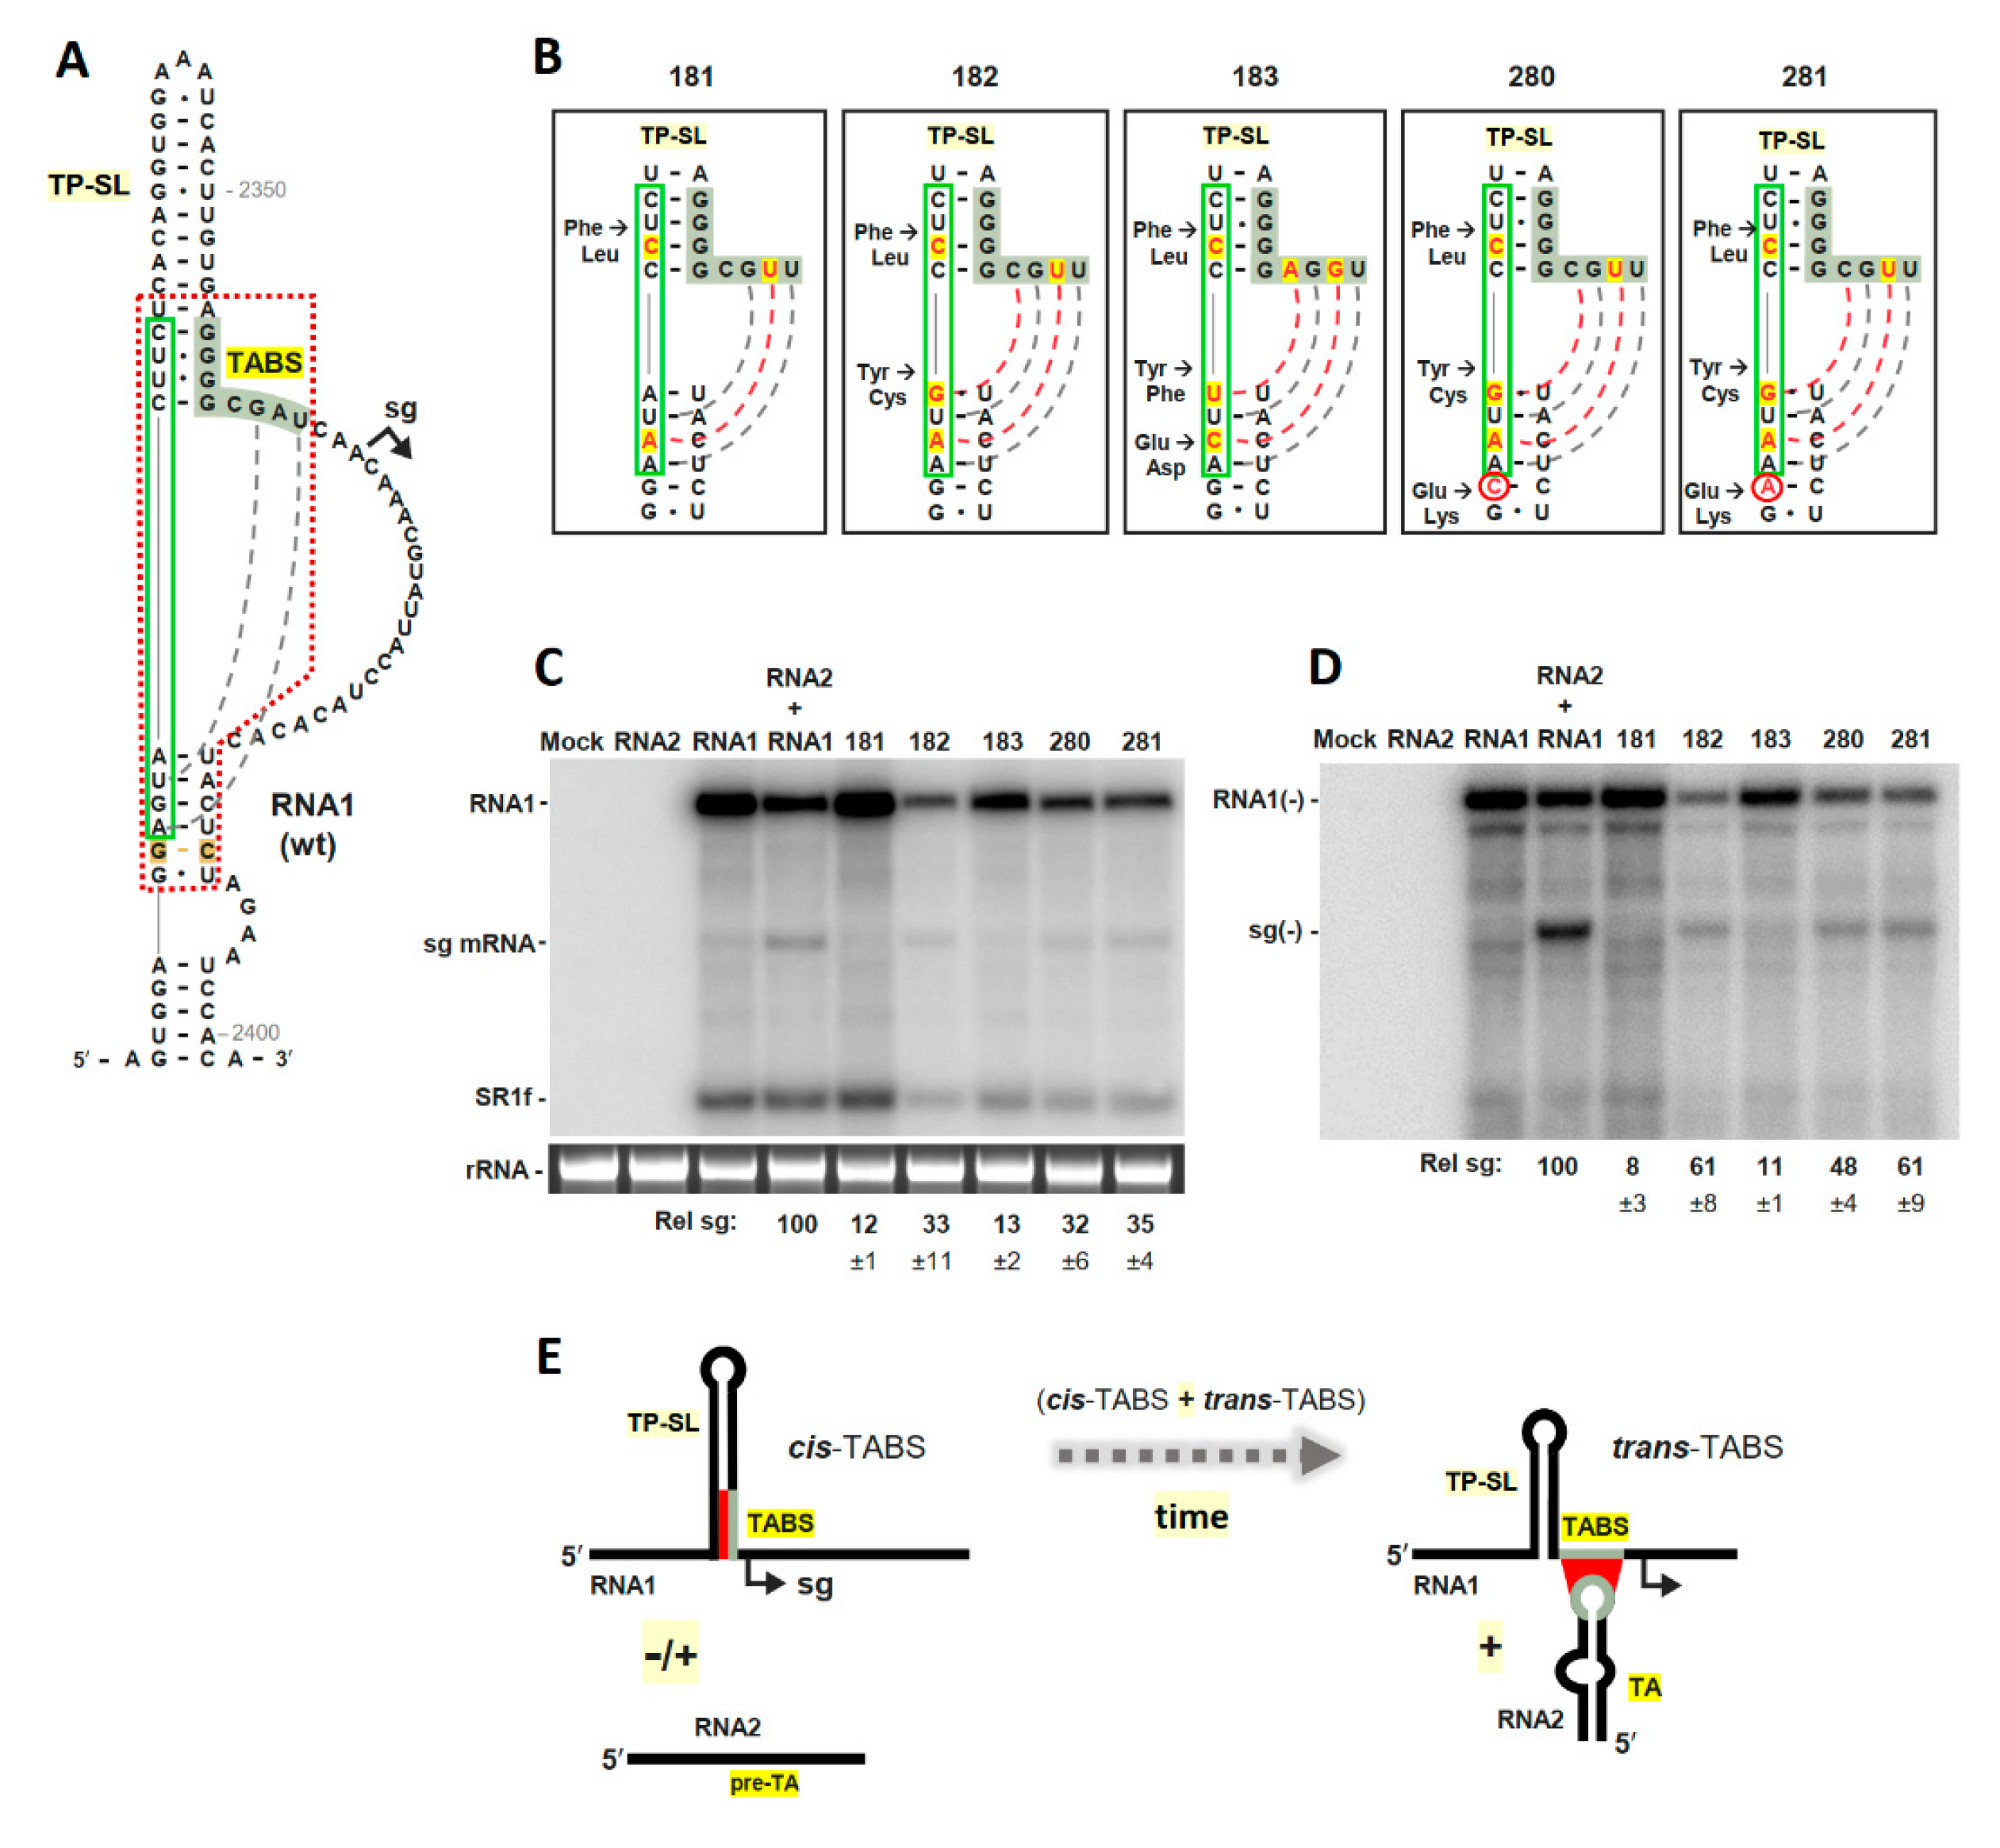
3.3. The TABS Can Be Converted into a TA-Independent, Cis-Acting, Attenuation RNA Structure
Author Contributions
Funding
Acknowledgments
Conflicts of Interest
References
- Sit, T.L.; Lommel, S.A. Tombusviridae. In Encyclopedia of Life Sciences; John Wiley & Sons, Ltd.: Chichester, UK, 2010. [Google Scholar]
- Blanco-Pérez, M.; Hernández, C. Evidence supporting a premature termination mechanism for subgenomic RNA transcription in Pelargonium line pattern virus: Identification of a critical long-range RNA-RNA interaction and functional variants through mutagenesis. J. Gen. Virol. 2016, 97, 1469–1480. [Google Scholar] [CrossRef]
- Wu, B.; Oliveri, S.; Mandic, J.; White, K.A. Evidence for a premature termination mechanism of subgenomic mRNA transcription in a carmovirus. J. Virol. 2010, 84, 7904–7907. [Google Scholar] [CrossRef]
- Lin, H.X.; Xu, W.; White, K.A. A multicomponent RNA-based control system regulates subgenomic mRNA transcription in a tombusvirus. J. Virol. 2007, 81, 2429–2439. [Google Scholar] [CrossRef][Green Version]
- Wang, S.; Mortazavi, L.; White, K.A. Higher-order RNA structural requirements and small-molecule induction of tombusvirus subgenomic mRNA transcription. J. Virol. 2008, 82, 3864–3871. [Google Scholar] [CrossRef][Green Version]
- Jiwan, S.D.; Wu, B.; White, K.A. Subgenomic mRNA transcription in tobacco necrosis virus. Virology 2011, 418, 1–11. [Google Scholar] [CrossRef] [PubMed][Green Version]
- Xu, W.; White, K.A. Subgenomic mRNA transcription in an aureusvirus: Down-regulation of transcription and evolution of regulatory RNA elements. Virology 2008, 371, 430–438. [Google Scholar] [CrossRef]
- Xu, W.; White, K.A. RNA-based regulation of transcription and translation of aureusvirus subgenomic mRNA1. J. Virol. 2009, 83, 10096–10105. [Google Scholar] [CrossRef] [PubMed][Green Version]
- Sztuba-Solińska, J.; Stollar, V.; Bujarski, J.J. Subgenomic messenger RNAs: Mastering regulation of (+)-strand RNA virus life cycle. Virology 2011, 412, 245–255. [Google Scholar] [CrossRef]
- Jiwan, S.D.; White, K.A. Subgenomic mRNA transcription in Tombusviridae. RNA Biol. 2011, 8, 287–294. [Google Scholar] [CrossRef]
- Lin, H.X.; White, K.A. A complex network of RNA-RNA interactions controls subgenomic mRNA transcription in a tombusvirus. EMBO J. 2004, 23, 3365–3374. [Google Scholar] [CrossRef] [PubMed]
- Chkuaseli, T.; White, K.A. Activation of viral transcription by stepwise largescale folding of an RNA virus genome. Nucleic Acids Res. 2020, 48, 9285–9300. [Google Scholar] [CrossRef]
- Sit, T.L.; Vaewhongs, A.A.; Lommel, S.A. RNA-mediated trans-activation of transcription from a viral RNA. Science 1998, 281, 829–832. [Google Scholar] [CrossRef] [PubMed]
- Xiong, Z.; Lommel, S.A. The complete nucleotide sequence and genome organization of red clover necrotic mosaic virus RNA-1. Virology 1989, 171, 543–554. [Google Scholar] [CrossRef]
- Tajima, Y.; Iwakawa, H.O.; Kaido, M.; Mise, K.; Okuno, T. A long-distance RNA-RNA interaction plays an important role in programmed -1 ribosomal frameshifting in the translation of p88 replicase protein of Red clover necrotic mosaic virus. Virology 2011, 417, 169–178. [Google Scholar] [CrossRef] [PubMed]
- Xiong, Z.; Kim, K.H.; Giesman-Cookmeyer, D.; Lommel, S.A. The roles of the red clover necrotic mosaic virus capsid and cell-to-cell movement proteins in systemic infection. Virology 1993, 192, 27–32. [Google Scholar] [CrossRef]
- Basnayake, V.R.; Sit, T.L.; Lommel, S.A. The Red clover necrotic mosaic virus origin of assembly is delimited to the RNA-2 trans-activator. Virology 2009, 384, 169–178. [Google Scholar] [CrossRef] [PubMed]
- Park, S.H.; Sit, T.L.; Kim, K.H.; Lommel, S.A. The red clover necrotic mosaic virus capsid protein N-terminal amino acids possess specific RNA binding activity and are required for stable virion assembly. Virus Res. 2013, 176, 107–118. [Google Scholar] [CrossRef]
- Basnayake, V.R.; Sit, T.L.; Lommel, S.A. The genomic RNA packaging scheme of Red clover necrotic mosaic virus. Virology 2006, 345, 532–539. [Google Scholar] [CrossRef]
- Tatsuta, M.; Mizumoto, H.; Kaido, M.; Mise, K.; Okuno, T. The red clover necrotic mosaic virus RNA2 trans-activator is also a cis-acting RNA2 replication element. J. Virol. 2005, 79, 978–986. [Google Scholar] [CrossRef][Green Version]
- Newburn, L.R.; White, K.A. A trans-activator-like structure in RCNMV RNA1 evokes the origin of the trans-activator in RNA2. PLoS Pathog. 2020, 16, e1008271. [Google Scholar] [CrossRef]
- White, K.A.; Morris, T.J. Nonhomologous RNA recombination in tombusviruses: Generation and evolution of defective interfering RNAs by stepwise deletions. J. Virol. 1994, 68, 14–24. [Google Scholar] [CrossRef] [PubMed]
- Cimino, P.A.; Nicholson, B.L.; Wu, B.; Xu, W.; White, K.A. Multifaceted regulation of translational readthrough by RNA replication elements in a tombusvirus. PLoS Pathog. 2011, 7, e1002423. [Google Scholar] [CrossRef]
- Vasa, S.M.; Guex, N.; Wilkinson, K.A.; Weeks, K.M.; Giddings, M.C. ShapeFinder: A software system for high-throughput quantitative analysis of nucleic acid reactivity information. RNA 2008, 14, 1979–1990. [Google Scholar] [CrossRef]
- Reuter, J.S.; Mathews, D.H. RNAstructure: Software for RNA secondary structure prediction and analysis. BMC Bioinform. 2010, 11, 129. [Google Scholar] [CrossRef] [PubMed]
- Johnson, P.Z.; Kasprzak, W.P.; Shapiro, B.A.; Simon, A.E. RNA2Drawer: Geometrically strict drawing of nucleic acid structures with graphical structure editing and highlighting of complementary subsequences. RNA Biol. 2019, 16, 1667–1671. [Google Scholar] [CrossRef]
- Choi, I.R.; Ostrovsky, M.; Zhang, G.; White, K.A. Regulatory activity of distal and core RNA elements in Tombusvirus subgenomic mRNA2 transcription. J. Biol. Chem. 2001, 276, 41761–41768. [Google Scholar] [CrossRef]
- Fabian, M.R.; White, K.A. Analysis of a 3′-translation enhancer in a tombusvirus: A dynamic model for RNA-RNA interactions of mRNA termini. RNA 2006, 12, 1304–1314. [Google Scholar] [CrossRef] [PubMed]
- Lafuente, E.; Ramos, R.; Martínez-Salas, E. Long-range RNA-RNA interactions between distal regions of the hepatitis C virus internal ribosome entry site element. J. Gen. Virol. 2002, 83, 1113–1121. [Google Scholar] [CrossRef]
- Guenther, R.H.; Sit, T.L.; Gracz, H.S.; Dolan, M.A.; Townsend, H.L.; Liu, G.; Newman, W.H.; Agris, P.F.; Lommel, S.A. Structural characterization of an intermolecular RNA-RNA interaction involved in the transcription regulation element of a bipartite plant virus. Nucleic Acids Res. 2004, 32, 2819–2828. [Google Scholar] [CrossRef][Green Version]
- Newburn, L.R.; White, K.A. Trans-Acting RNA-RNA Interactions in Segmented RNA Viruses. Viruses 2019, 11, 751. [Google Scholar] [CrossRef]


Publisher’s Note: MDPI stays neutral with regard to jurisdictional claims in published maps and institutional affiliations. |
© 2021 by the authors. Licensee MDPI, Basel, Switzerland. This article is an open access article distributed under the terms and conditions of the Creative Commons Attribution (CC BY) license (https://creativecommons.org/licenses/by/4.0/).
Share and Cite
Im, J.S.H.; Newburn, L.R.; Kent, G.; White, K.A. Trans-Activator Binding Site Context in RCNMV Modulates Subgenomic mRNA Transcription. Viruses 2021, 13, 2252. https://doi.org/10.3390/v13112252
Im JSH, Newburn LR, Kent G, White KA. Trans-Activator Binding Site Context in RCNMV Modulates Subgenomic mRNA Transcription. Viruses. 2021; 13(11):2252. https://doi.org/10.3390/v13112252
Chicago/Turabian StyleIm, Jennifer S. H., Laura R. Newburn, Gregory Kent, and K. Andrew White. 2021. "Trans-Activator Binding Site Context in RCNMV Modulates Subgenomic mRNA Transcription" Viruses 13, no. 11: 2252. https://doi.org/10.3390/v13112252
APA StyleIm, J. S. H., Newburn, L. R., Kent, G., & White, K. A. (2021). Trans-Activator Binding Site Context in RCNMV Modulates Subgenomic mRNA Transcription. Viruses, 13(11), 2252. https://doi.org/10.3390/v13112252