Molecular Insights into Bacteriophage Evolution toward Its Host


Abstract
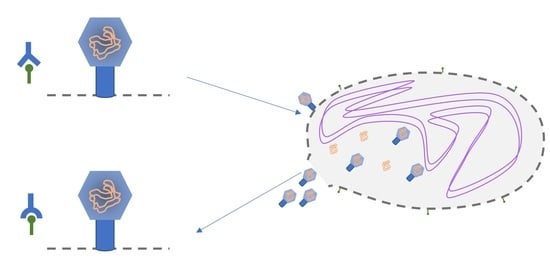
1. Introduction
2. Materials and Methods
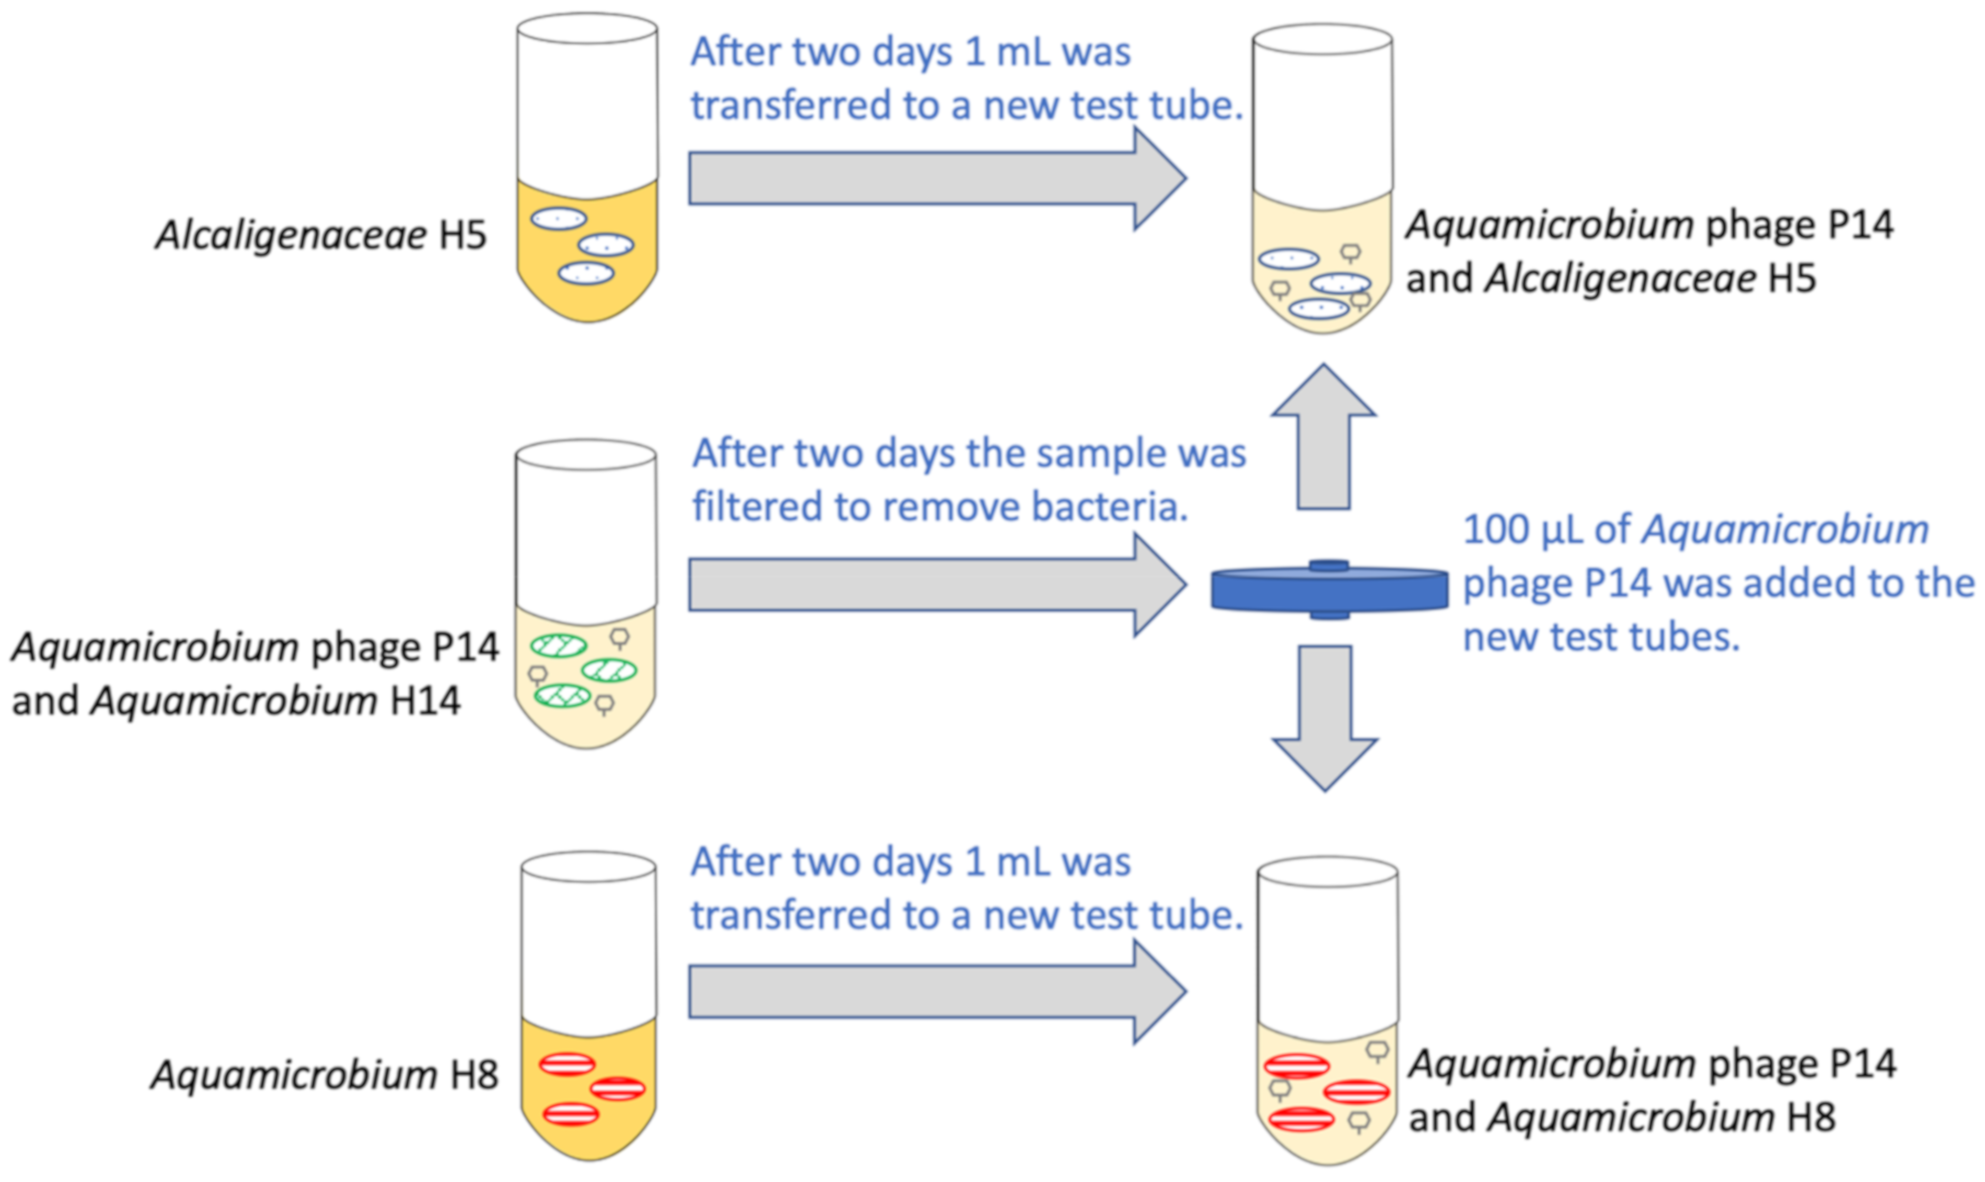
2.1. System Description
2.1.1. Preparation
2.1.2. The Experiment
2.2. Sampling
2.3. Quantification of Bacteriophage and Bacteria
2.4. DNA Extraction and Sequencing
2.5. DNA Sequence Analysis, Bioinformatics and Comparative Analysis
3. Results and Discussion
3.1. Changes in Bacterial and Bacteriophage Concentrations over Time
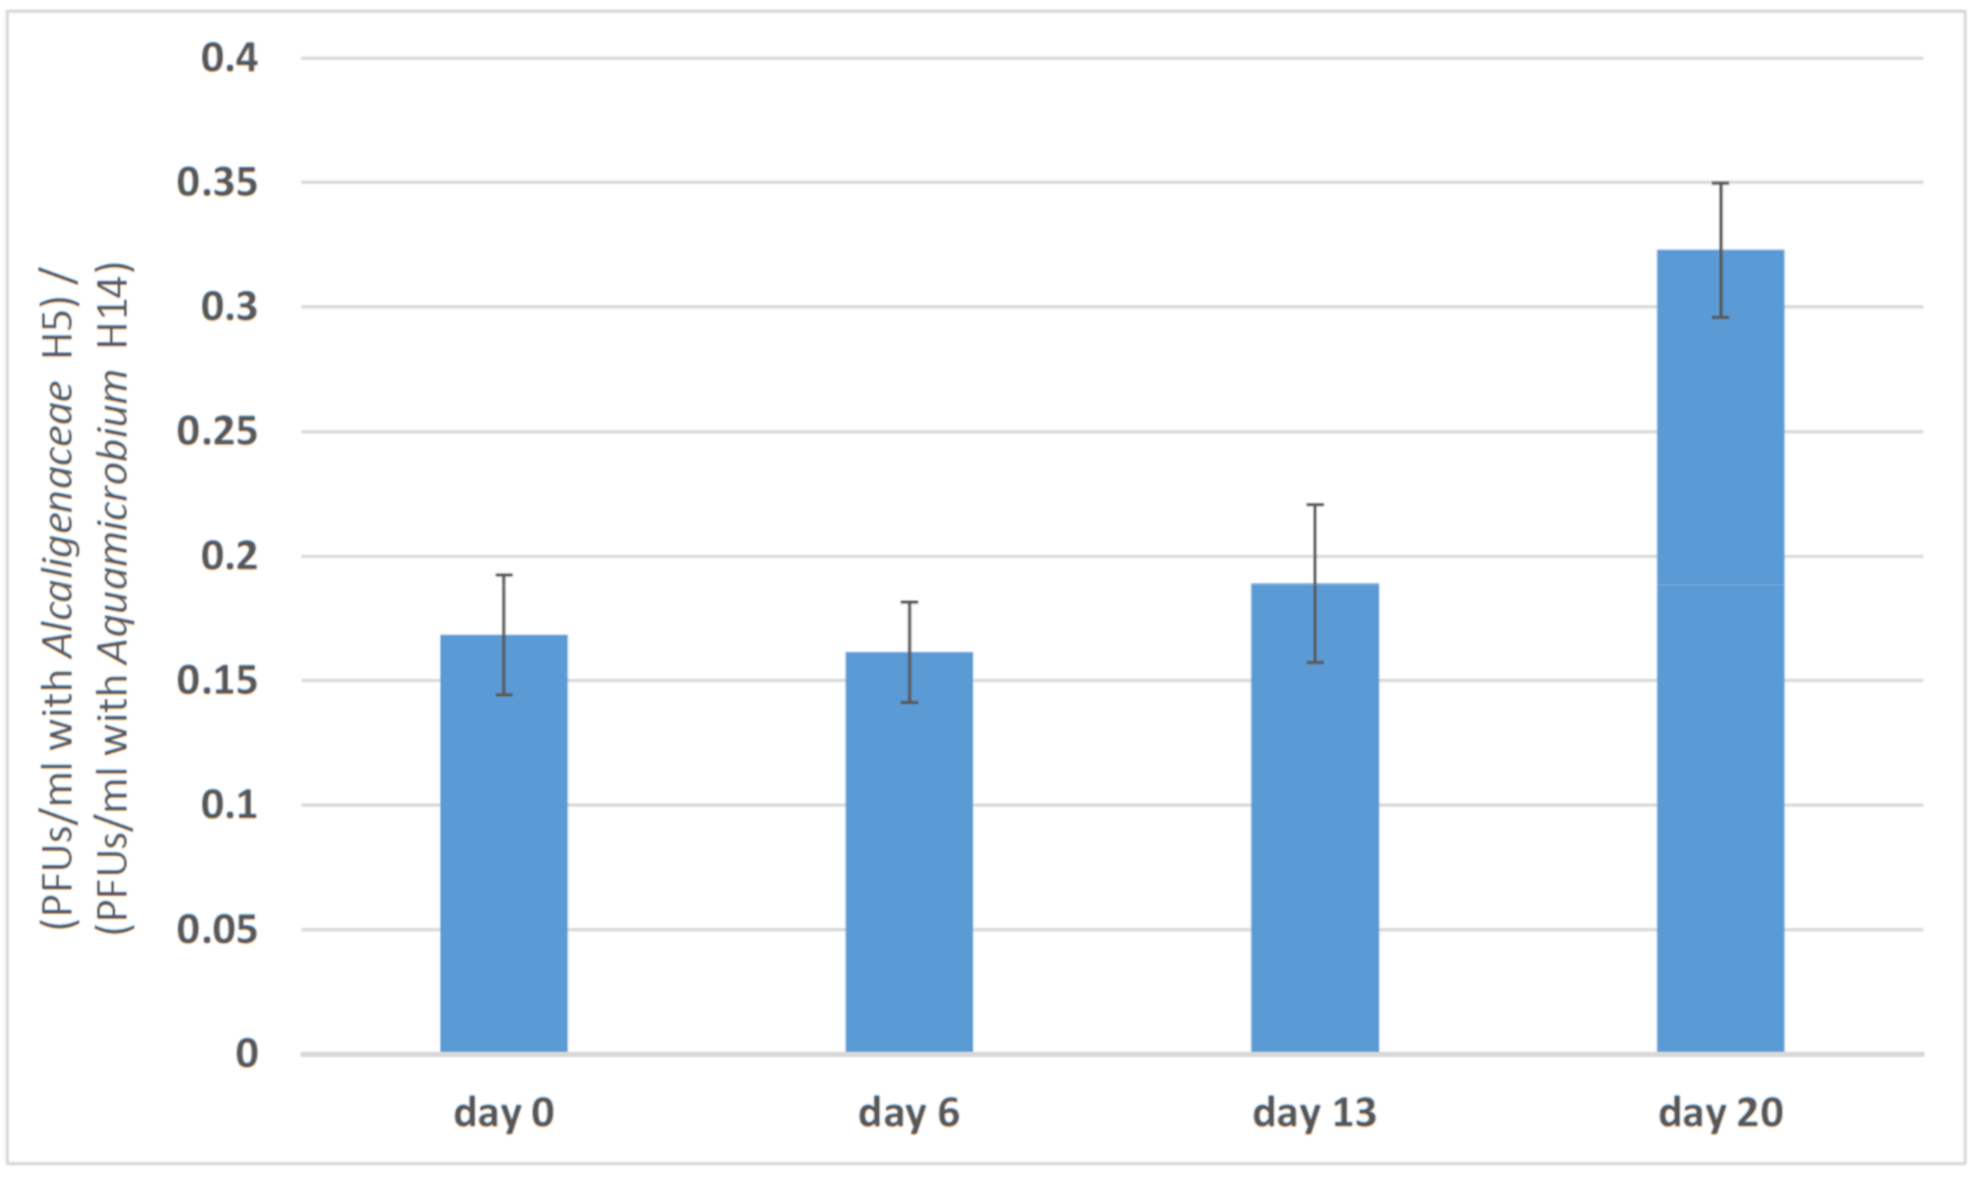
3.2. Changes in Phage Efficacy
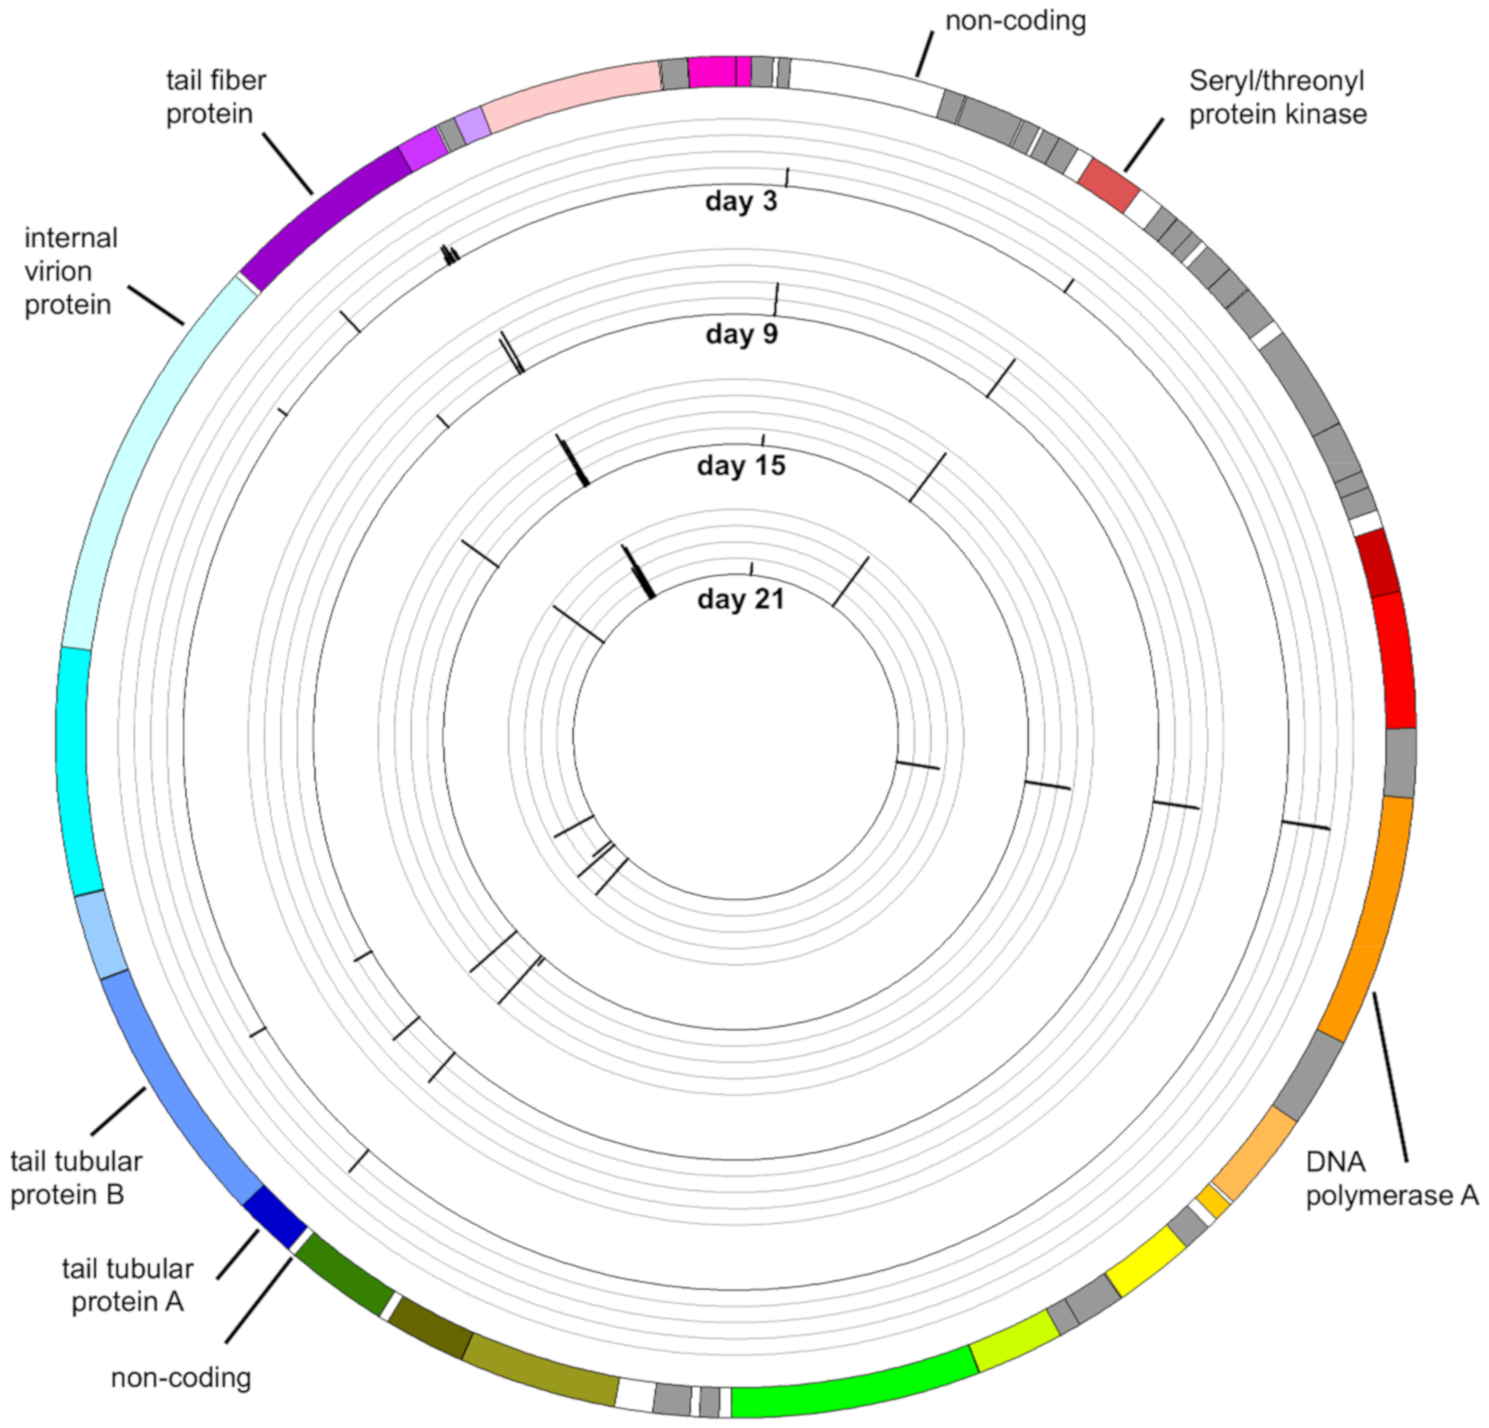
3.3. Mapping Reads to the Genome of Aquamicrobium Phage P14
3.4. Mutations in the Phage Genome
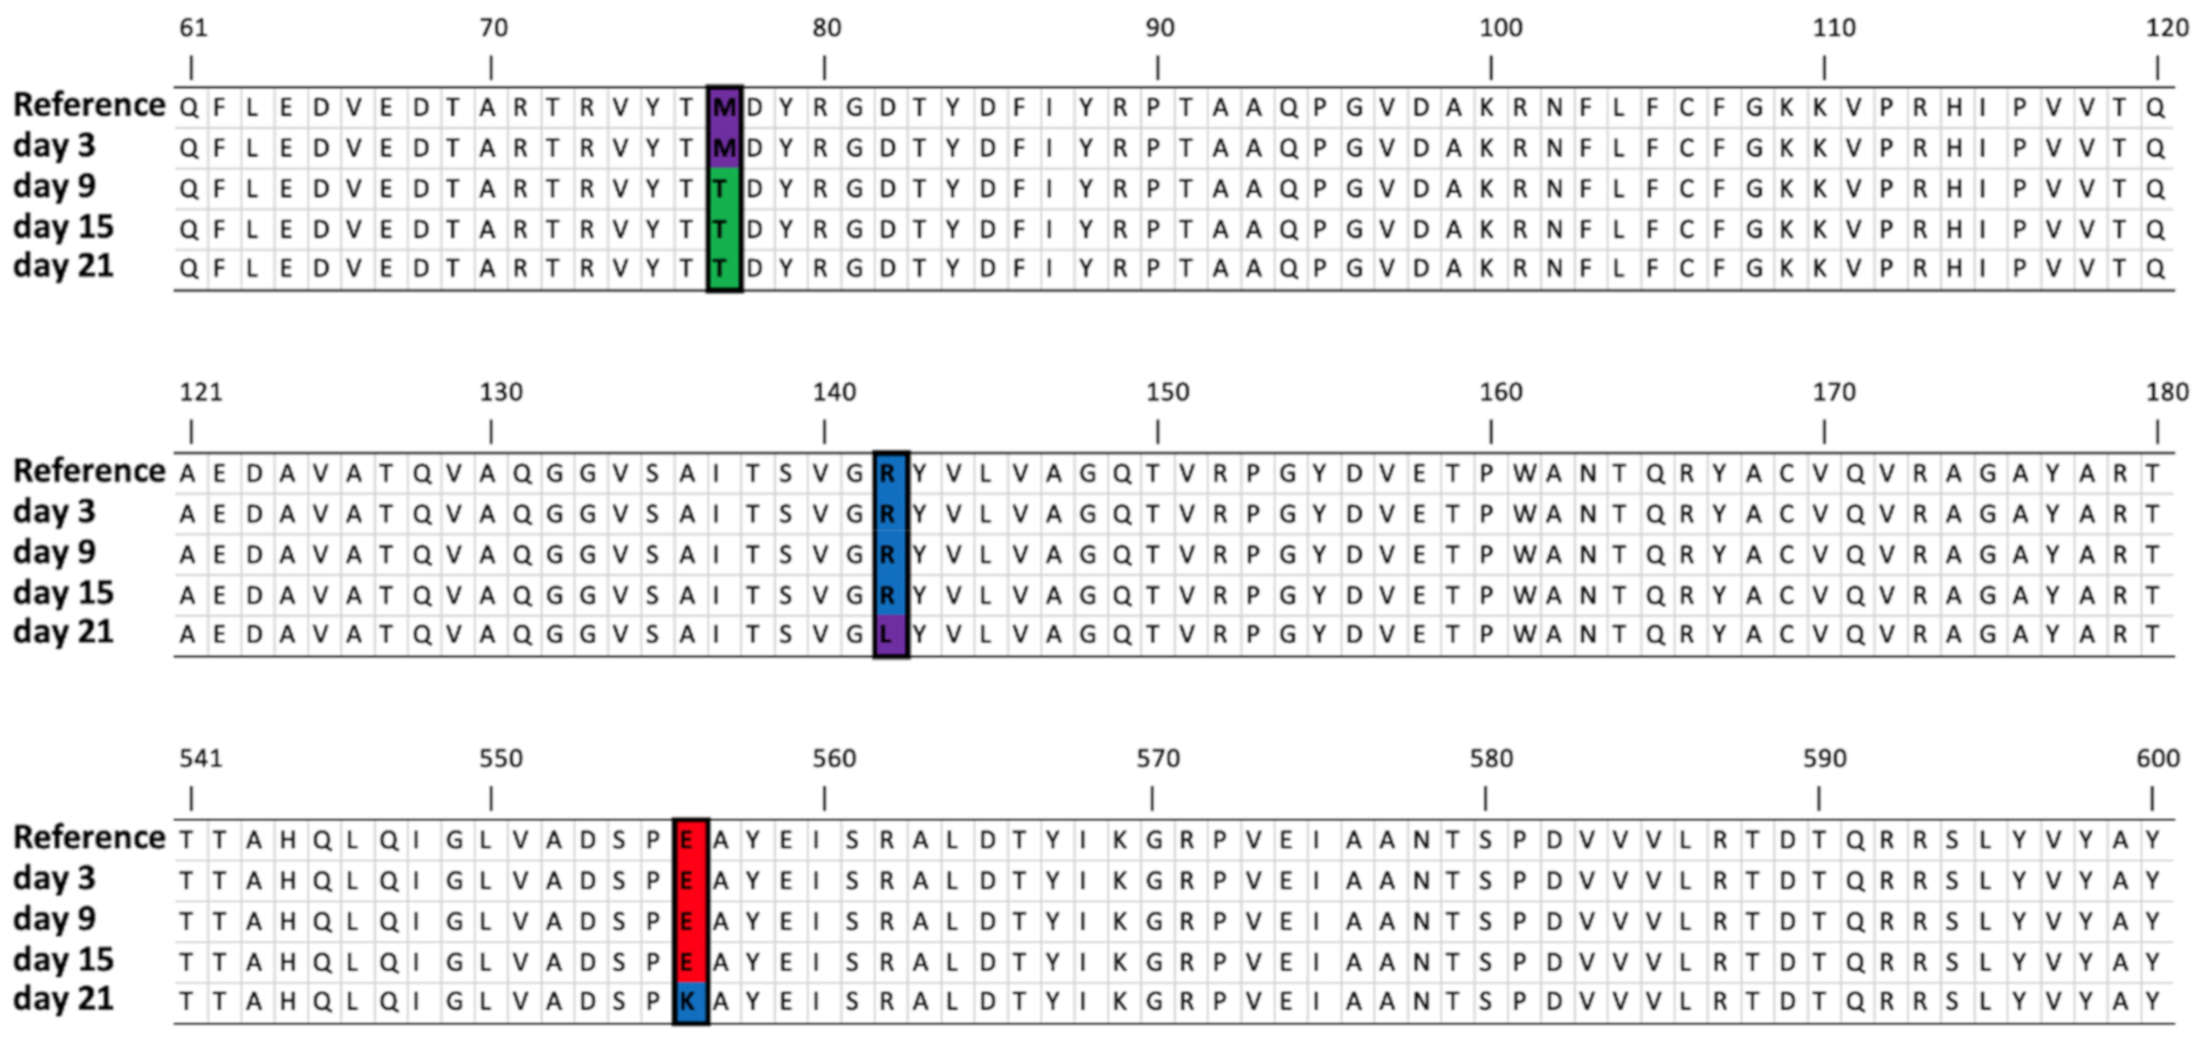
3.4.1. Mutation in the Gene Encoding Seryl-Threonyl Protein Kinase
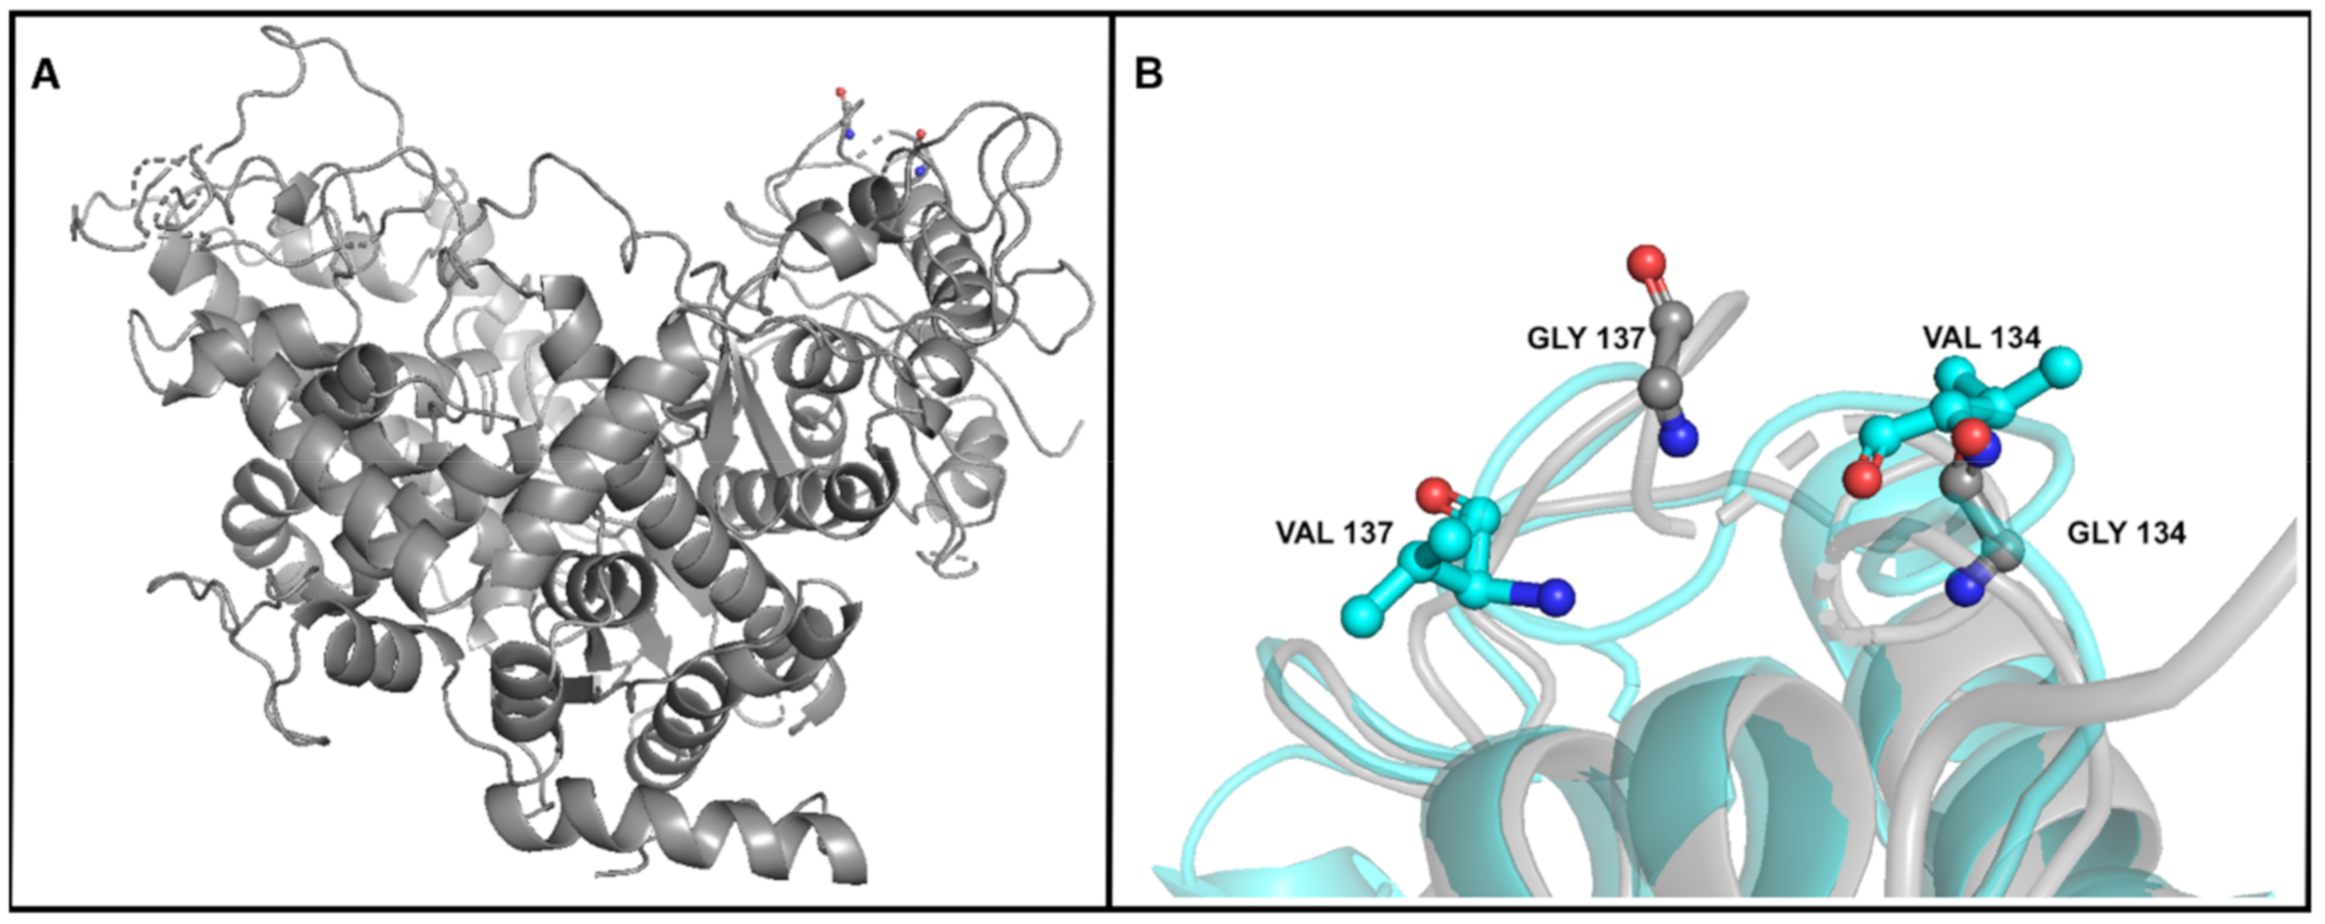
3.4.2. Mutation in the Gene Encoding DNA Polymerase A
3.4.3. Mutation in the Genes Encoding the Tail Tubular Proteins
3.4.4. Mutations in Genes Encoding Internal Virion Proteins
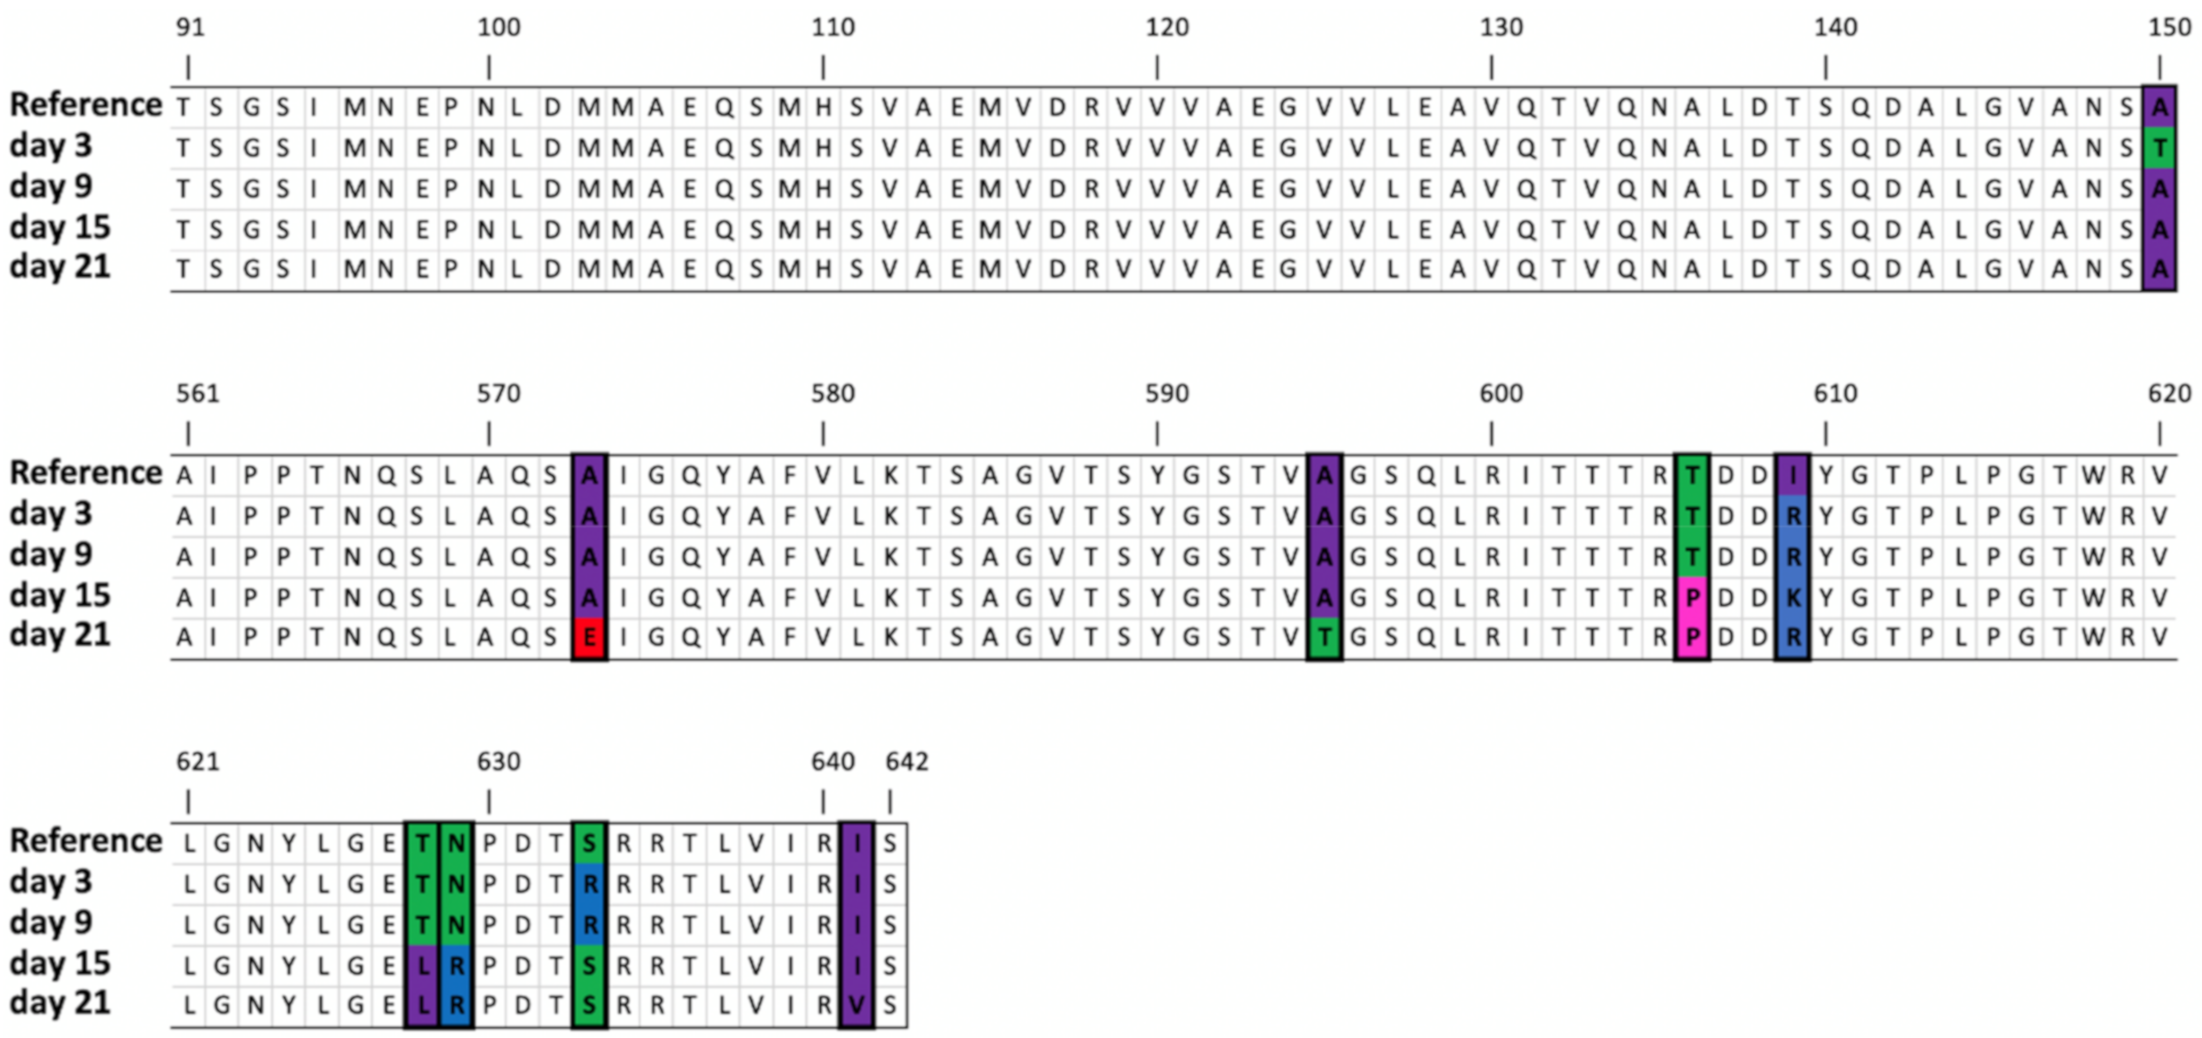
3.4.5. Mutations in the Gene Encoding the Tail Fiber Protein
3.4.6. Mutations in Non-Coding Sequences
3.4.7. Distribution of Variants along the Genome
4. Conclusions
Supplementary Materials
Author Contributions
Funding
Acknowledgments
Conflicts of Interest
References
- Withey, S.; Cartmell, E.; Avery, L.M.; Stephenson, T. Bacteriophages—Potential for application in wastewater treatment processes. Sci. Total Environ. 2005, 339, 1–18. [Google Scholar] [CrossRef] [PubMed]
- Suttle, C.A. Marine viruses—Major players in the global ecosystem. Nat. Rev. Microbiol. 2007, 5, 801–812. [Google Scholar] [CrossRef] [PubMed]
- Johnke, J.; Cohen, Y.; de Leeuw, M.; Kushmaro, A.; Jurkevitch, E.; Chatzinotas, A. Multiple micro-predators controlling bacterial communities in the environment. Curr. Opin. Biotechnol. 2014, 27, 185–190. [Google Scholar] [CrossRef]
- Fuhrman, J.A. Marine viruses and their biogeochemical and ecological effects. Nature 1999, 399, 541–548. [Google Scholar] [CrossRef]
- Jacquet, S.; Miki, T.; Noble, R.; Peduzzi, P.; Wilhelm, S. Viruses in aquatic ecosystems: Important advancements of the last 20 years and prospects for the future in the field of microbial oceanography and limnology. Adv. Oceanogr. Limnol. 2010, 1, 97–141. [Google Scholar] [CrossRef]
- Sime-Ngando, T. Environmental bacteriophages: Viruses of microbes in aquatic ecosystems. Front. Microbiol. 2014, 5. [Google Scholar] [CrossRef]
- Guenther, S.; Huwyler, D.; Richard, S.; Loessner, M.J. Virulent bacteriophage for efficient biocontrol of Listeria monocytogenes in ready-to-eat foods. Appl. Environ. Microbiol. 2009, 75, 93–100. [Google Scholar] [CrossRef]
- Kocharunchitt, C.; Ross, T.; McNeil, D.L. Use of bacteriophages as biocontrol agents to control Salmonella associated with seed sprouts. Int. J. Food Microbiol. 2009, 128, 453–459. [Google Scholar] [CrossRef]
- Sillankorva, S.M.; Oliveira, H.; Azeredo, J. Bacteriophages and their role in food safety. Int. J. Microbiol. 2012, 2012, 863945. [Google Scholar] [CrossRef]
- Carlton, R.M.; Noordman, W.H.; Biswas, B.; De Meester, E.D.; Loessner, M.J. Bacteriophage P100 for control of Listeria monocytogenes in foods: Genome sequence, bioinformatic analyses, oral toxicity study, and application. Regul. Toxicol. Pharmacol. 2005, 43, 301–312. [Google Scholar] [CrossRef]
- Hagens, S.; Loessner, M.J. Application of bacteriophages for detection and control of foodborne pathogens. Appl. Microbiol. Biotechnol. 2007, 76, 513–519. [Google Scholar] [CrossRef] [PubMed]
- Bhunchoth, A.; Phironrit, N.; Leksomboon, C.; Chatchawankanphanich, O.; Kotera, S.; Narulita, E.; Kawasaki, T.; Fujie, M.; Yamada, T. Isolation of Ralstonia solanacearum-infecting bacteriophages from tomato fields in Chiang Mai, Thailand, and their experimental use as biocontrol agents. J. Appl. Microbiol. 2015, 118, 1023–1033. [Google Scholar] [CrossRef] [PubMed]
- Weber-Dabrowska, B.; Jończyk-Matysiak, E.; Zaczek, M.; Łobocka, M.; Łusiak-Szelachowska, M.; Górski, A. Bacteriophage procurement for therapeutic purposes. Front. Microbiol. 2016, 7, 1177. [Google Scholar] [CrossRef] [PubMed]
- Wu, Q.; Liu, W.T. Determination of virus abundance, diversity and distribution in a municipal wastewater treatment plant. Water Res. 2009, 43, 1101–1109. [Google Scholar] [CrossRef] [PubMed]
- Shapiro, O.H.; Kushmaro, A.; Brenner, A. Bacteriophage predation regulates microbial abundance and diversity in a full-scale bioreactor treating industrial wastewater. ISME J. 2010, 4, 327–336. [Google Scholar] [CrossRef] [PubMed]
- Shapiro, O.H.; Kushmaro, A. Bacteriophage ecology in environmental biotechnology processes. Curr. Opin. Biotechnol. 2011, 22, 449–455. [Google Scholar] [CrossRef]
- Khan, M.A.; Satoh, H.; Katayama, H.; Kurisu, F.; Mino, T. Bacteriophages isolated from activated sludge processes and their polyvalency. Water Res. 2002, 36, 3364–3370. [Google Scholar] [CrossRef]
- Otawa, K.; Lee, S.H.; Yamazoe, A.; Onuki, M.; Satoh, H.; Mino, T. Abundance, diversity, and dynamics of viruses on microorganisms in activated sludge processes. Microb. Ecol. 2007, 53, 143–152. [Google Scholar] [CrossRef]
- Petrovski, S.; Seviour, R.J.; Tillett, D. Characterization of the genome of the polyvalent lytic bacteriophage GTE2, which has potential for biocontrol of Gordonia-, Rhodococcus-, and Nocardia-stabilized foams in activated sludge plants. Appl. Environ. Microbiol. 2011, 77, 3923–3929. [Google Scholar] [CrossRef]
- Thomas, J.A.; Soddell, J.A.; Kurtböke, D.I. Fighting foam with phages? Water Sci. Technol. 2002, 46, 511–518. [Google Scholar] [CrossRef]
- Koskella, B.; Meaden, S. Understanding bacteriophage specificity in natural microbial communities. Viruses 2013, 5, 806–823. [Google Scholar] [CrossRef] [PubMed]
- Baranowski, E.; Ruiz-Jarabo, C.M.; Domingo, E. Evolution of cell recognition by viruses. Science 2001, 292, 1102–1105. [Google Scholar] [CrossRef] [PubMed]
- Hyman, P.; Abedon, S.T. Bacteriophage host range and bacterial resistance. Adv. Appl. Microbiol. 2010, 70, 217–248. [Google Scholar] [PubMed]
- Weinbauer, M.G. Ecology of prokaryotic viruses. FEMS Microbiol. Rev. 2004, 28, 127–181. [Google Scholar] [CrossRef] [PubMed]
- Labrie, S.J.; Samson, J.E.; Moineau, S. Bacteriophage resistance mechanisms. Nat. Rev. Microbiol. 2010, 8, 317–327. [Google Scholar] [CrossRef] [PubMed]
- Buckling, A.; Rainey, P.B. Antagonistic coevolution between a bacterium and a bacteriophage. Proc. R. Soc. B Biol. Sci. 2002, 269, 931–936. [Google Scholar] [CrossRef]
- Gómez, P.; Buckling, A. Bacteria-phage antagonistic coevolution in soil. Science 2011, 332, 106–109. [Google Scholar] [CrossRef]
- Pal, C.; Maciá, M.D.; Oliver, A.; Schachar, I.; Buckling, A. Coevolution with viruses drives the evolution of bacterial mutation rates. Nature 2007, 450, 1079–1081. [Google Scholar] [CrossRef]
- Woolhouse, M.E.J.; Webster, J.P.; Domingo, E.; Charlesworth, B.; Levin, B.R. Biological and biomedical implications of the co-evolution of pathogens and their hosts. Nat. Genet. 2002, 32, 569–577. [Google Scholar] [CrossRef]
- Longdon, B.; Brockhurst, M.A.; Russell, C.A.; Welch, J.J.; Jiggins, F.M. The evolution and genetics of virus host shifts. PLoS Pathog. 2014, 10, e1004395. [Google Scholar] [CrossRef]
- Ferris, M.T.; Joyce, P.; Burch, C.L. High frequency of mutations that expand the host range of an RNA virus. Genetics 2007, 176, 1013–1022. [Google Scholar] [CrossRef] [PubMed]
- Crill, W.D.; Wichman, H.A.; Bull, J.J. Evolutionary reversals during viral adaptation to alternating hosts. Genetics 2000, 154, 27–37. [Google Scholar] [PubMed]
- De Leeuw, M.; Baron, M.; Brenner, A.; Kushmaro, A. Genome analysis of a novel broad host range proteobacteria phage isolated from a bioreactor treating industrial wastewater. Genes 2017, 8, 40. [Google Scholar] [CrossRef] [PubMed]
- Benson, D.A.; Clark, K.; Karsch-Mizrachi, I.; Lipman, D.J.; Ostell, J.; Sayers, E.W. GenBank. Nucleic Acids Res. 2015, 43, D30–D35. [Google Scholar] [CrossRef] [PubMed]
- Tang, N.; San Clemente, H.; Roy, S.; Bécard, G.; Zhao, B.; Roux, C. A Survey of the gene repertoire of Gigaspora rosea unravels conserved features among glomeromycota for obligate biotrophy. Front. Microbiol. 2016, 7, 233. [Google Scholar] [CrossRef]
- Gasteiger, E.; Gattiker, A.; Hoogland, C.; Ivanyi, I.; Appel, R.D.; Bairoch, A. ExPASy: The proteomics server for in-depth protein knowledge and analysis. Nucleic Acids Res. 2003, 31, 3784–3788. [Google Scholar] [CrossRef]
- Koskella, B.; Brockhurst, M.A. Bacteria-phage coevolution as a driver of ecological and evolutionary processes in microbial communities. FEMS Microbiol. Rev. 2014, 38, 916–931. [Google Scholar] [CrossRef]
- Ripp, S.; Miller, R.V. The role of pseudolysogeny in bacteriophage-host interactions in a natural freshwater environment. Microbiology 1997, 143, 2065–2070. [Google Scholar] [CrossRef]
- Glowacka-Rutkowska, A.; Gozdek, A.; Empel, J.; Gawor, J.; Zuchniewicz, K.; Kozinska, A.; Debski, J.; Gromadka, R.; Lobocka, M. The ability of lytic staphylococcal podovirus vB-SauP-phiAGO1.3 to coexist in equilibrium with its host facilitates the selection of host mutants of attenuated virulence but does not preclude the phage antistaphylococcal activity in a nematode infection model. Front. Microbiol. 2019, 10, 3227. [Google Scholar]
- Latino, L.; Midoux, C.; Hauck, Y.; Vergnaud, G.; Pourcel, C. Pseudolysogeny and sequential mutations build multiresistance to virulent bacteriophages in pseudomonas aeruginosa. Microbiology 2016, 162, 748–763. [Google Scholar] [CrossRef]
- Yosef, I.; Edgar, R.; Levy, A.; Amitai, G.; Sorek, R.; Munitz, A.; Qimron, U. Natural selection underlies apparent stress-induced mutagenesis in a bacteriophage infection model. Nat. Microbiol. 2016, 1, 16047. [Google Scholar] [CrossRef] [PubMed]
- Krzywinski, M.; Schein, J.; Birol, I.; Connors, J.; Gascoyne, R.; Horsman, D.; Jones, S.J.; Marra, M.A. Circos: An information aesthetic for comparative genomics. Genome Res. 2009, 19, 1639–1645. [Google Scholar] [CrossRef] [PubMed]
- Johnson, M.; Zaretskaya, I.; Raytselis, Y.; Merezhuk, Y.; McGinnis, S.; Madden, T.L. NCBI BLAST: A better web interface. Nucleic Acids Res. 2008, 36, W5–W9. [Google Scholar] [CrossRef] [PubMed]
- Kelley, L.A.; Mezulis, S.; Yates, C.M.; Wass, M.N.; Sternberg, M.J.E. The Phyre2 web portal for protein modeling, prediction and analysis. Nat. Protoc. 2015, 10, 845–858. [Google Scholar] [CrossRef] [PubMed]
- Cuervo, A.; Pulido-Cid, M.; Chagoyen, M.; Arranz, R.; González-García, V.A.; Garcia-Doval, C.; Castón, J.R.; Valpuesta, J.M.; Van Raaij, M.J.; Martín-Benito, J.; et al. Structural Characterization of the Bacteriophage T7 Tail Machinery. J. Biol. Chem. 2013, 288, 26290–26299. [Google Scholar] [CrossRef] [PubMed]
- Hu, M.; Zhang, H.; Gu, D.; Ma, Y.; Zhou, X. Identification of a novel bacterial receptor that binds tail tubular proteins and mediates phage infection of Vibrio parahaemolyticus. Emerg. Microbes Infect. 2020, 9, 855–867. [Google Scholar] [CrossRef] [PubMed]
- Kemp, P.; Garcia, L.R.; Molineux, I.J. Changes in bacteriophage T7 virion structure at the initiation of infection. Virology 2005, 340, 307–317. [Google Scholar] [CrossRef]
- Pyra, A.; Brzozowska, E.; Pawlik, K.; Gamian, A.; Dauter, M.; Dauter, Z. Tail tubular protein A: A dual-function tail protein of Klebsiella pneumoniae bacteriophage KP. Sci. Rep. 2017, 7, 1–9. [Google Scholar] [CrossRef]
- Hu, B.; Margolin, W.; Molineux, I.J.; Liu, J. The bacteriophage T7 virion undergoes extensive structural remodeling during infection. Science 2013, 339, 576–579. [Google Scholar] [CrossRef]
- Chang, C.Y.; Kemp, P.; Molineux, I.J. Gp15 and gp16 cooperate in translocating bacteriophage T7 DNA into the infected cell. Virology 2010, 398, 176–186. [Google Scholar] [CrossRef]
- Altschul, S.F.; Gish, W.; Miller, W.; Myers, E.W.; Lipman, D.J. Basic local alignment search tool. J. Mol. Biol. 1990, 215, 403–410. [Google Scholar] [CrossRef]
- Garcia-Doval, C.; Van Raaij, M.J. Structure of the receptor-binding carboxy-terminal domain of bacteriophage T7 tail fibers. Proc. Natl. Acad. Sci. USA 2012, 109, 9390–9395. [Google Scholar] [CrossRef] [PubMed]
- De Sordi, L.; Khanna, V.; Debarbieux, L. The gut microbiota facilitates drifts in the genetic diversity and infectivity of bacterial viruses. Cell Host Microbe 2017, 22, 801–808. [Google Scholar] [CrossRef] [PubMed]
- Duffy, S.; Burch, C.L.; Turner, P.E. Evolution of host specificity drives reproductive isolation among RNA viruses. Evolution (N. Y.) 2007, 61, 2614–2622. [Google Scholar] [CrossRef] [PubMed]
- Tétart, F.; Repoila, F.; Monod, C.; Krisch, H.M. Bacteriophage T4 host range is expanded by duplications of a small domain of the tail fiber adhesin. J. Mol. Biol. 1996, 258, 726–731. [Google Scholar] [CrossRef] [PubMed]
- Le, S.; He, X.; Tan, Y.; Huang, G.; Zhang, L.; Lux, R.; Shi, W.; Hu, F. Mapping the tail fiber as the receptor binding protein responsible for differential host specificity of pseudomonas aeruginosa bacteriophages PaP1 and JG. PLoS ONE 2013, 8, e68562. [Google Scholar] [CrossRef]
- Yosef, I.; Goren, M.G.; Globus, R.; Molshanski-Mor, S.; Qimron, U. Extending the host range of bacteriophage particles for DNA transduction. Mol. Cell 2017, 66, 721–728. [Google Scholar] [CrossRef]


| Day | Bacteria Concentration (CFU/mL) | Phage Concentration (PFU/mL) |
|---|---|---|
| 0 | 2.3 × 10⁷ ± 3.9 × 10⁶ | 1.3 × 10⁶ ± 6.5 × 10⁵ |
| 6 | 1.2 × 10⁷ ± 2.0 × 10⁶ | 1.9 × 10⁷ ± 1.9 × 10⁶ |
| 13 | 9.7 × 10⁶ ± 1.6 × 10⁶ | 3.1 × 10⁷ ± 1.4 × 10⁶ |
| 20 | 2.9 × 10⁷ ± 1.3 × 10⁶ | 1.3 × 10⁶ ± 9.8 × 10⁵ |
| Incubation with Alcaligenaceae H5 | Incubation with Aquamicrobium H8 | ||||||||||||
|---|---|---|---|---|---|---|---|---|---|---|---|---|---|
| Gene | Position | Type | Reference | t * = 0 | Day 3 | Day 9 | Day 15 | Day 21 | Day 3 | Day 9 | Day 15 | Day 21 | Changes in Protein Sequence |
| - | 570^571 | Insertion | - | C(3), (1) | C (50.27%) | C (32.76%) | C (42.70%) | - | |||||
| Seryl-threonyl protein kinase | 4099..4100 | Deletion | AG | A(3), (1) | (71.11%) | (91.83%) | (93.37%) | (30.55%) | (31.69%) | Glu182-> VTCSINVRAWSCFGCRTGRV | |||
| DNA polymerase A | 11,077 | SNV | G | T (1) | T (70.58%) | T (65.97%) | T (63.01%) | T (64.44%) | T (69.88%) | T (63.34%) | T (70.53%) | T (70.23%) | Gly134->Val |
| 11,086 | SNV | G | T (2) | T (73.98%) | T (69.46%) | T (66.45%) | T (66.07%) | T (69.64%) | T (63.40%) | T (72.76%) | T (72.84%) | Gly137->Val | |
| Tail tubular protein A | 24,958 | SNV | C | C (2) | T (44.52%) | T (59.76%) | T (98.11%) | T (73.25%) | T (34.76%) | T (70.03%) | Pro21->Leu | ||
| Tail tubular protein B | 25,728 | SNV | T | - | C (52.85%) | C (93.92%) | C (74.19%) | Met77->Thr | |||||
| 25,923 | SNV | G | G (2) | T (35.97%) | Arg142->Leu | ||||||||
| 27,164 | SNV | G | G (1) | A (67.64%) | Glu556->Lys | ||||||||
| Internal virion protein | 30,484 | SNV | C | C (6), T(2) | T (34.96%) | Leu534 ->Phe | |||||||
| Internal virion protein | 34,414 | SNV | T | T (3) | G (68.26%) | G (95.04%) | His1055->Gln | ||||||
| Tail fiber protein | 35,714 | SNV | G | G(3), A(1) | A (42.91%) | A (35.95%) | A (56.24%) | A (82.92%) | Ala150 -> Thr | ||||
| 36,984 | SNV | C | C (4) | A (54.63%) | Ala573 -> Glu | ||||||||
| 37,023 | SNV | G | G(2), T(1) | T (31.58%) | T (39.81%) | G586->Val | |||||||
| 37,049 | SNV | G | C(1), G(1) | A (37.67%) | A (35.67%) | Ala595 -> Glu | |||||||
| 37,082 | SNV | A | A (3) | C (79.15%) | C (59.96%) | Glu606-> Pro | |||||||
| 37,085 | SNV | G | G (3) | A (37.98%) | D607->Asn | ||||||||
| 37,092 | SNV | T | T (3) | G (60.30%) | A (72.33%) | G (93.39%) | Days 9 and 21: Ile609->Arg Day 15: Ile609->Lys | ||||||
| 37,146..37,154 | Deletion | AGACTAACC | AGA * TAACC (2) | (40.84%) | (37.48%) | ETNP->Ala627 | |||||||
| 37,148..37,149 | MNV | AC | AC (1), AT (1) | CT (76.17%) | CT (86.69%) | Thr628->Leu | |||||||
| 37,151..37,152 | MNV | AA | AA (2) | CG (77.18%) | CG (87.24%) | Asn629->Arg | |||||||
| AG (44.08%) | Asn629->Ser | ||||||||||||
| 37,155 | SNV | C | C (2) | A (30.27%) | Pro630->His | ||||||||
| 37,165 | MNV | T | T (3) | A (70.17%) | A (51.20%) | Ser633->Arg | |||||||
| 37,187 | SNV | A | A (5) | G (53.73%) | Ile641->Val | ||||||||
© 2020 by the authors. Licensee MDPI, Basel, Switzerland. This article is an open access article distributed under the terms and conditions of the Creative Commons Attribution (CC BY) license (http://creativecommons.org/licenses/by/4.0/).
Share and Cite
de Leeuw, M.; Baron, M.; Ben David, O.; Kushmaro, A. Molecular Insights into Bacteriophage Evolution toward Its Host. Viruses 2020, 12, 1132. https://doi.org/10.3390/v12101132
de Leeuw M, Baron M, Ben David O, Kushmaro A. Molecular Insights into Bacteriophage Evolution toward Its Host. Viruses. 2020; 12(10):1132. https://doi.org/10.3390/v12101132
Chicago/Turabian Stylede Leeuw, Marina, Maayan Baron, Oshrit Ben David, and Ariel Kushmaro. 2020. "Molecular Insights into Bacteriophage Evolution toward Its Host" Viruses 12, no. 10: 1132. https://doi.org/10.3390/v12101132
APA Stylede Leeuw, M., Baron, M., Ben David, O., & Kushmaro, A. (2020). Molecular Insights into Bacteriophage Evolution toward Its Host. Viruses, 12(10), 1132. https://doi.org/10.3390/v12101132