Human Sapovirus among Outpatients with Acute Gastroenteritis in Spain: A One-Year Study


Abstract
:
1. Introduction
2. Materials and Methods
2.1. Sampling
2.2. Viral RNA Extraction
2.3. Reverse Transcription (RT)-qPCR Methodology
2.4. Genetic Analysis
2.5. Statistics
3. Results
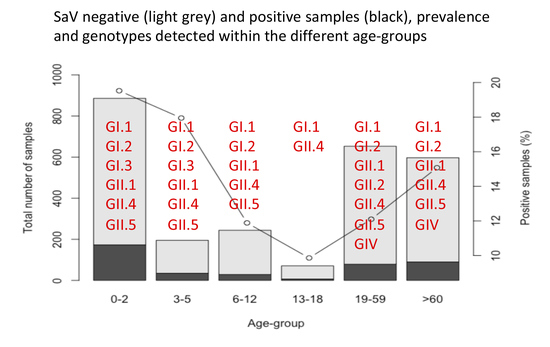
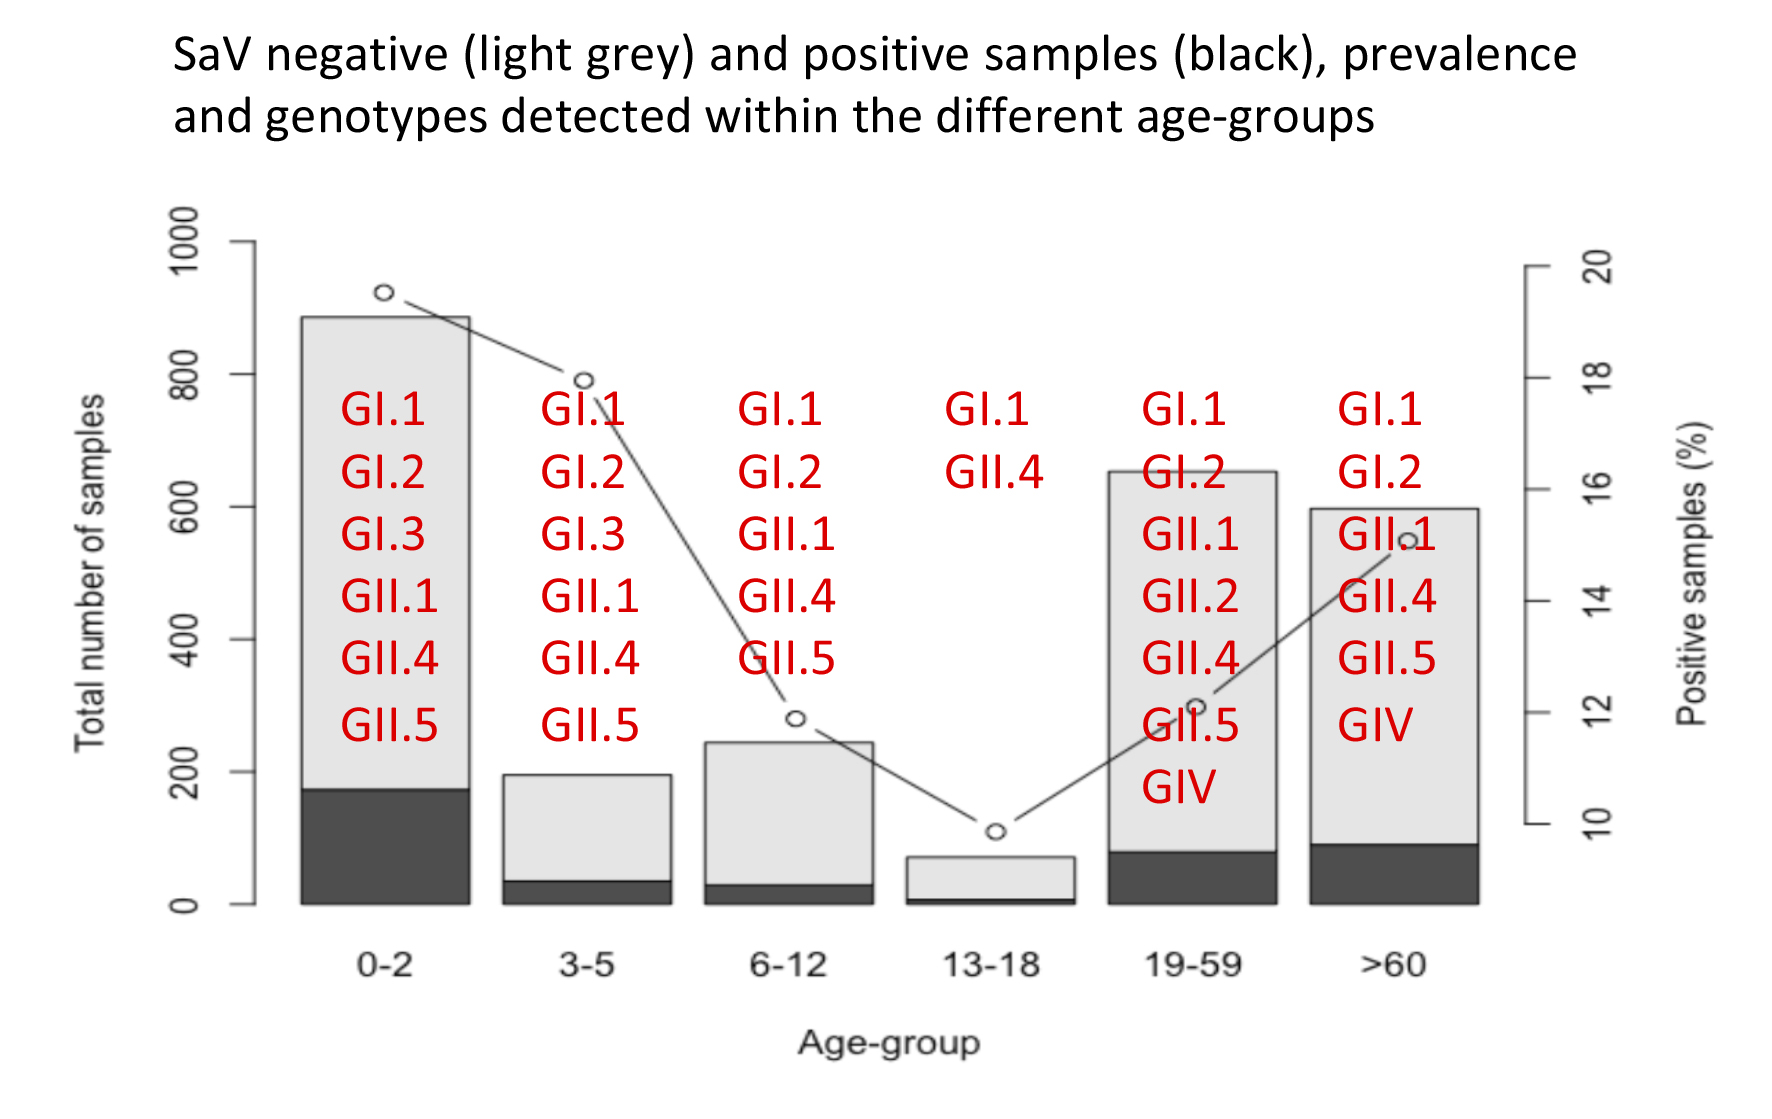
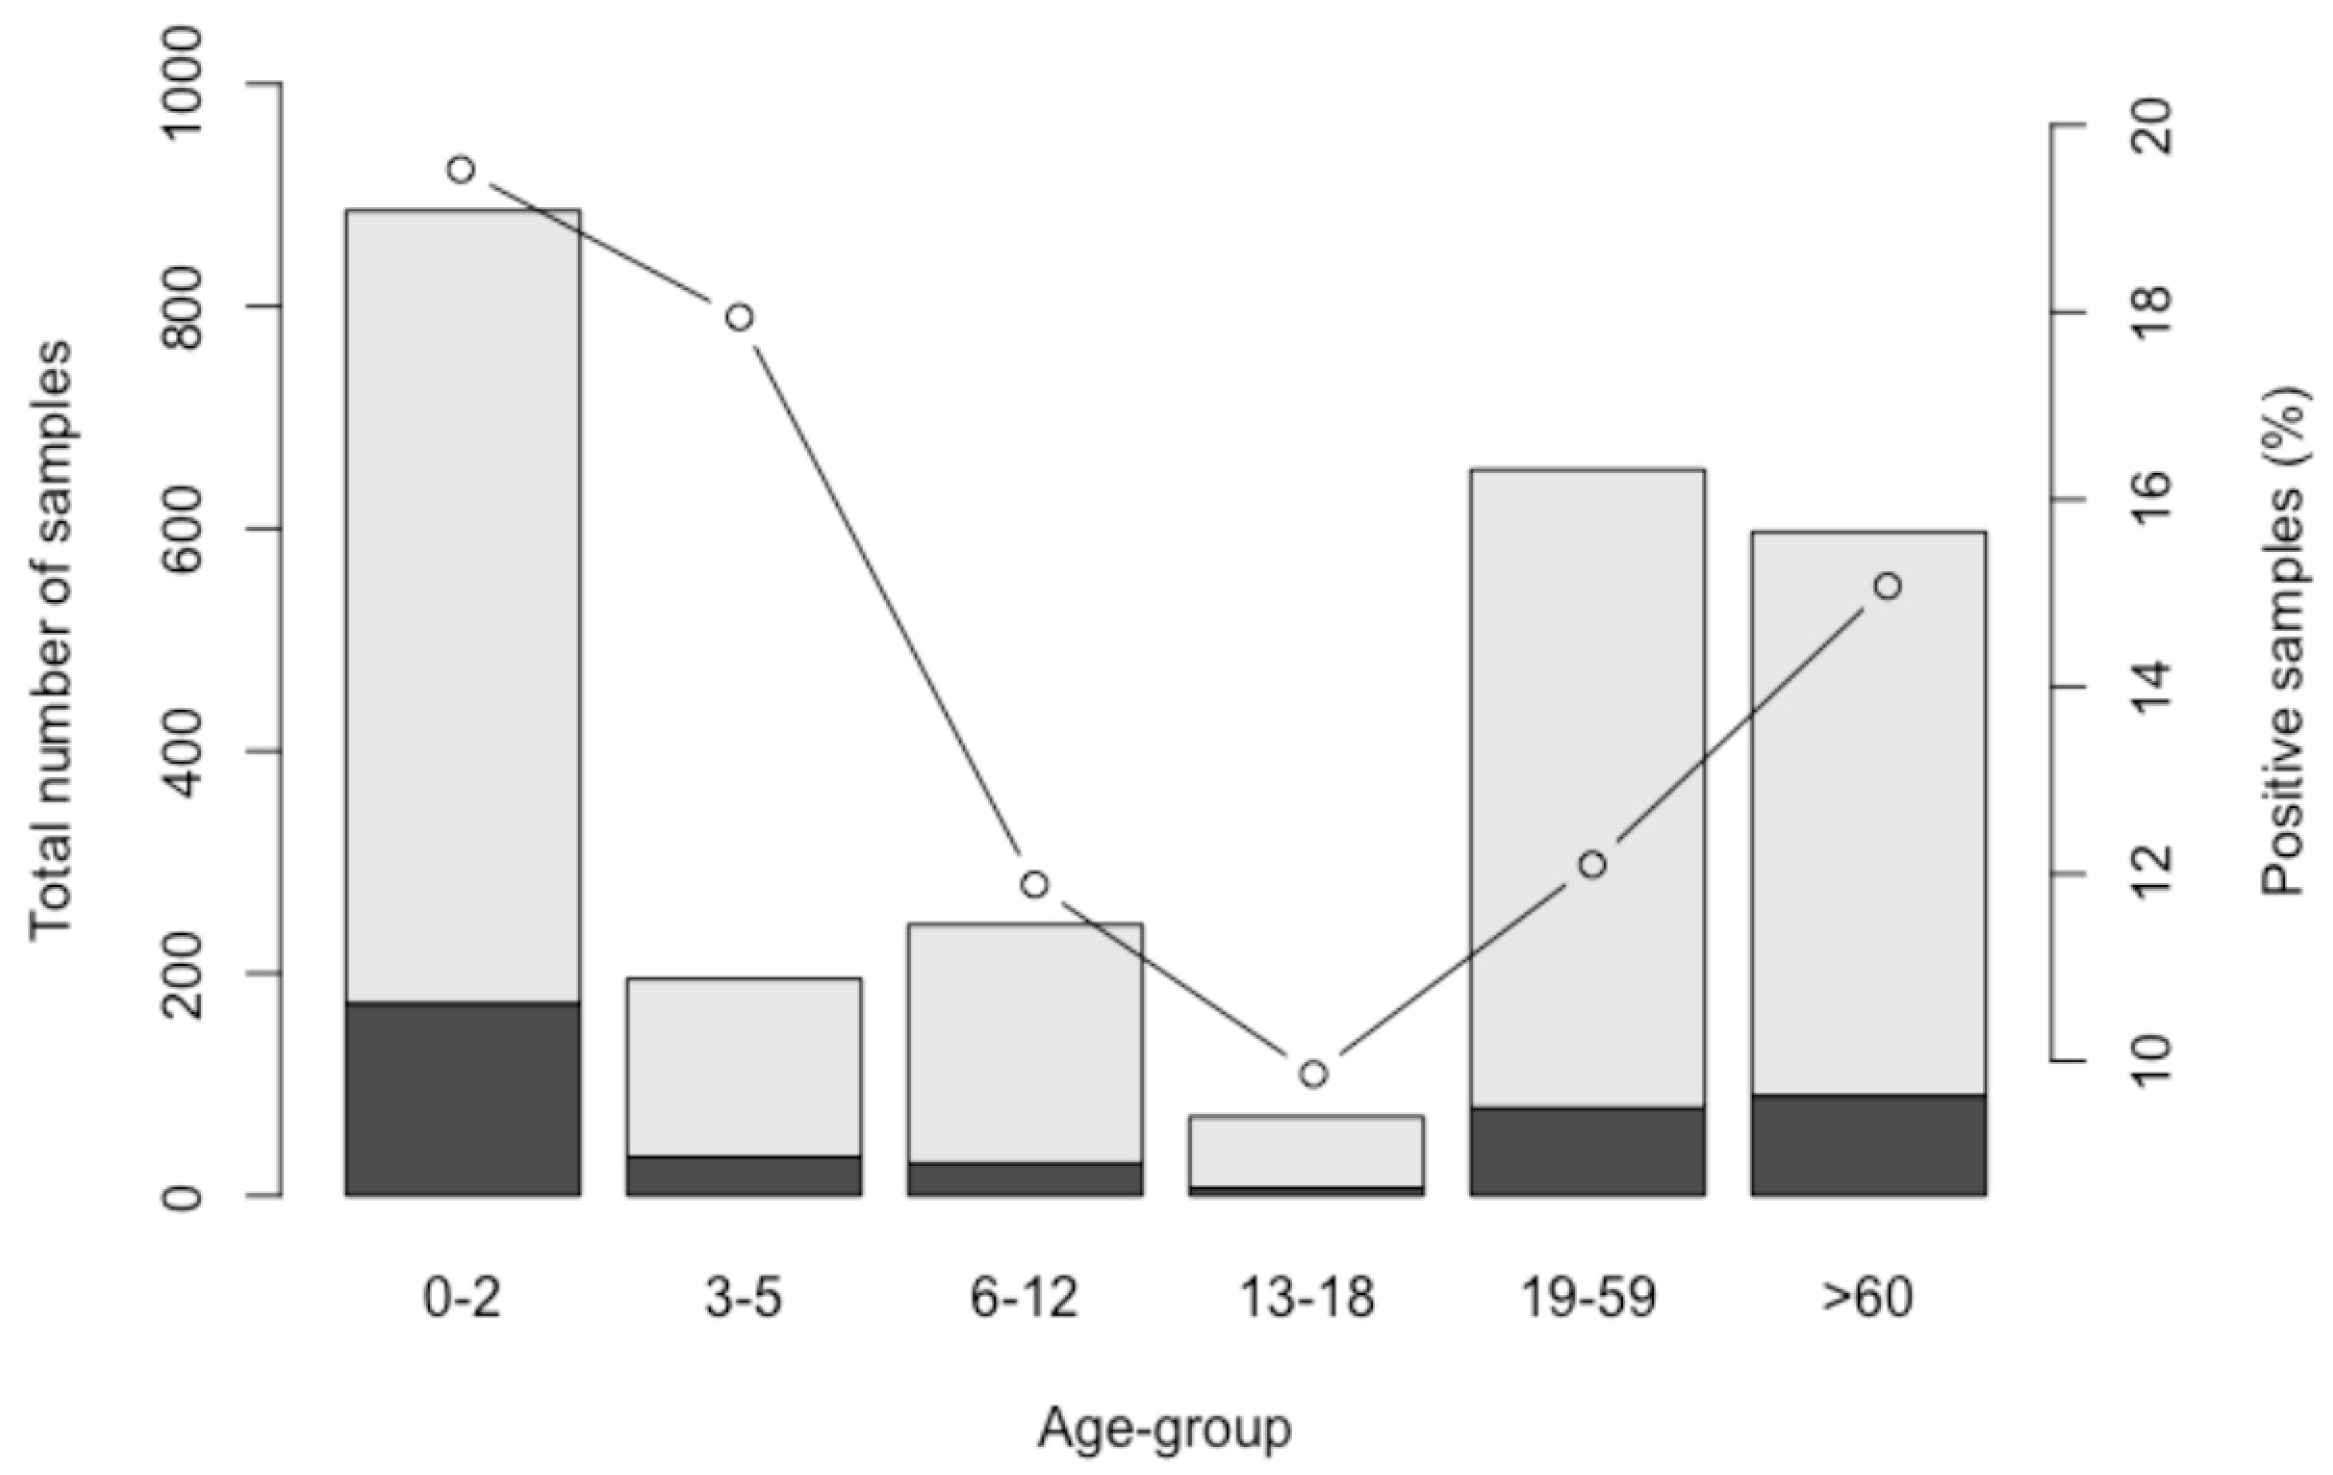
3.1. Prevalence
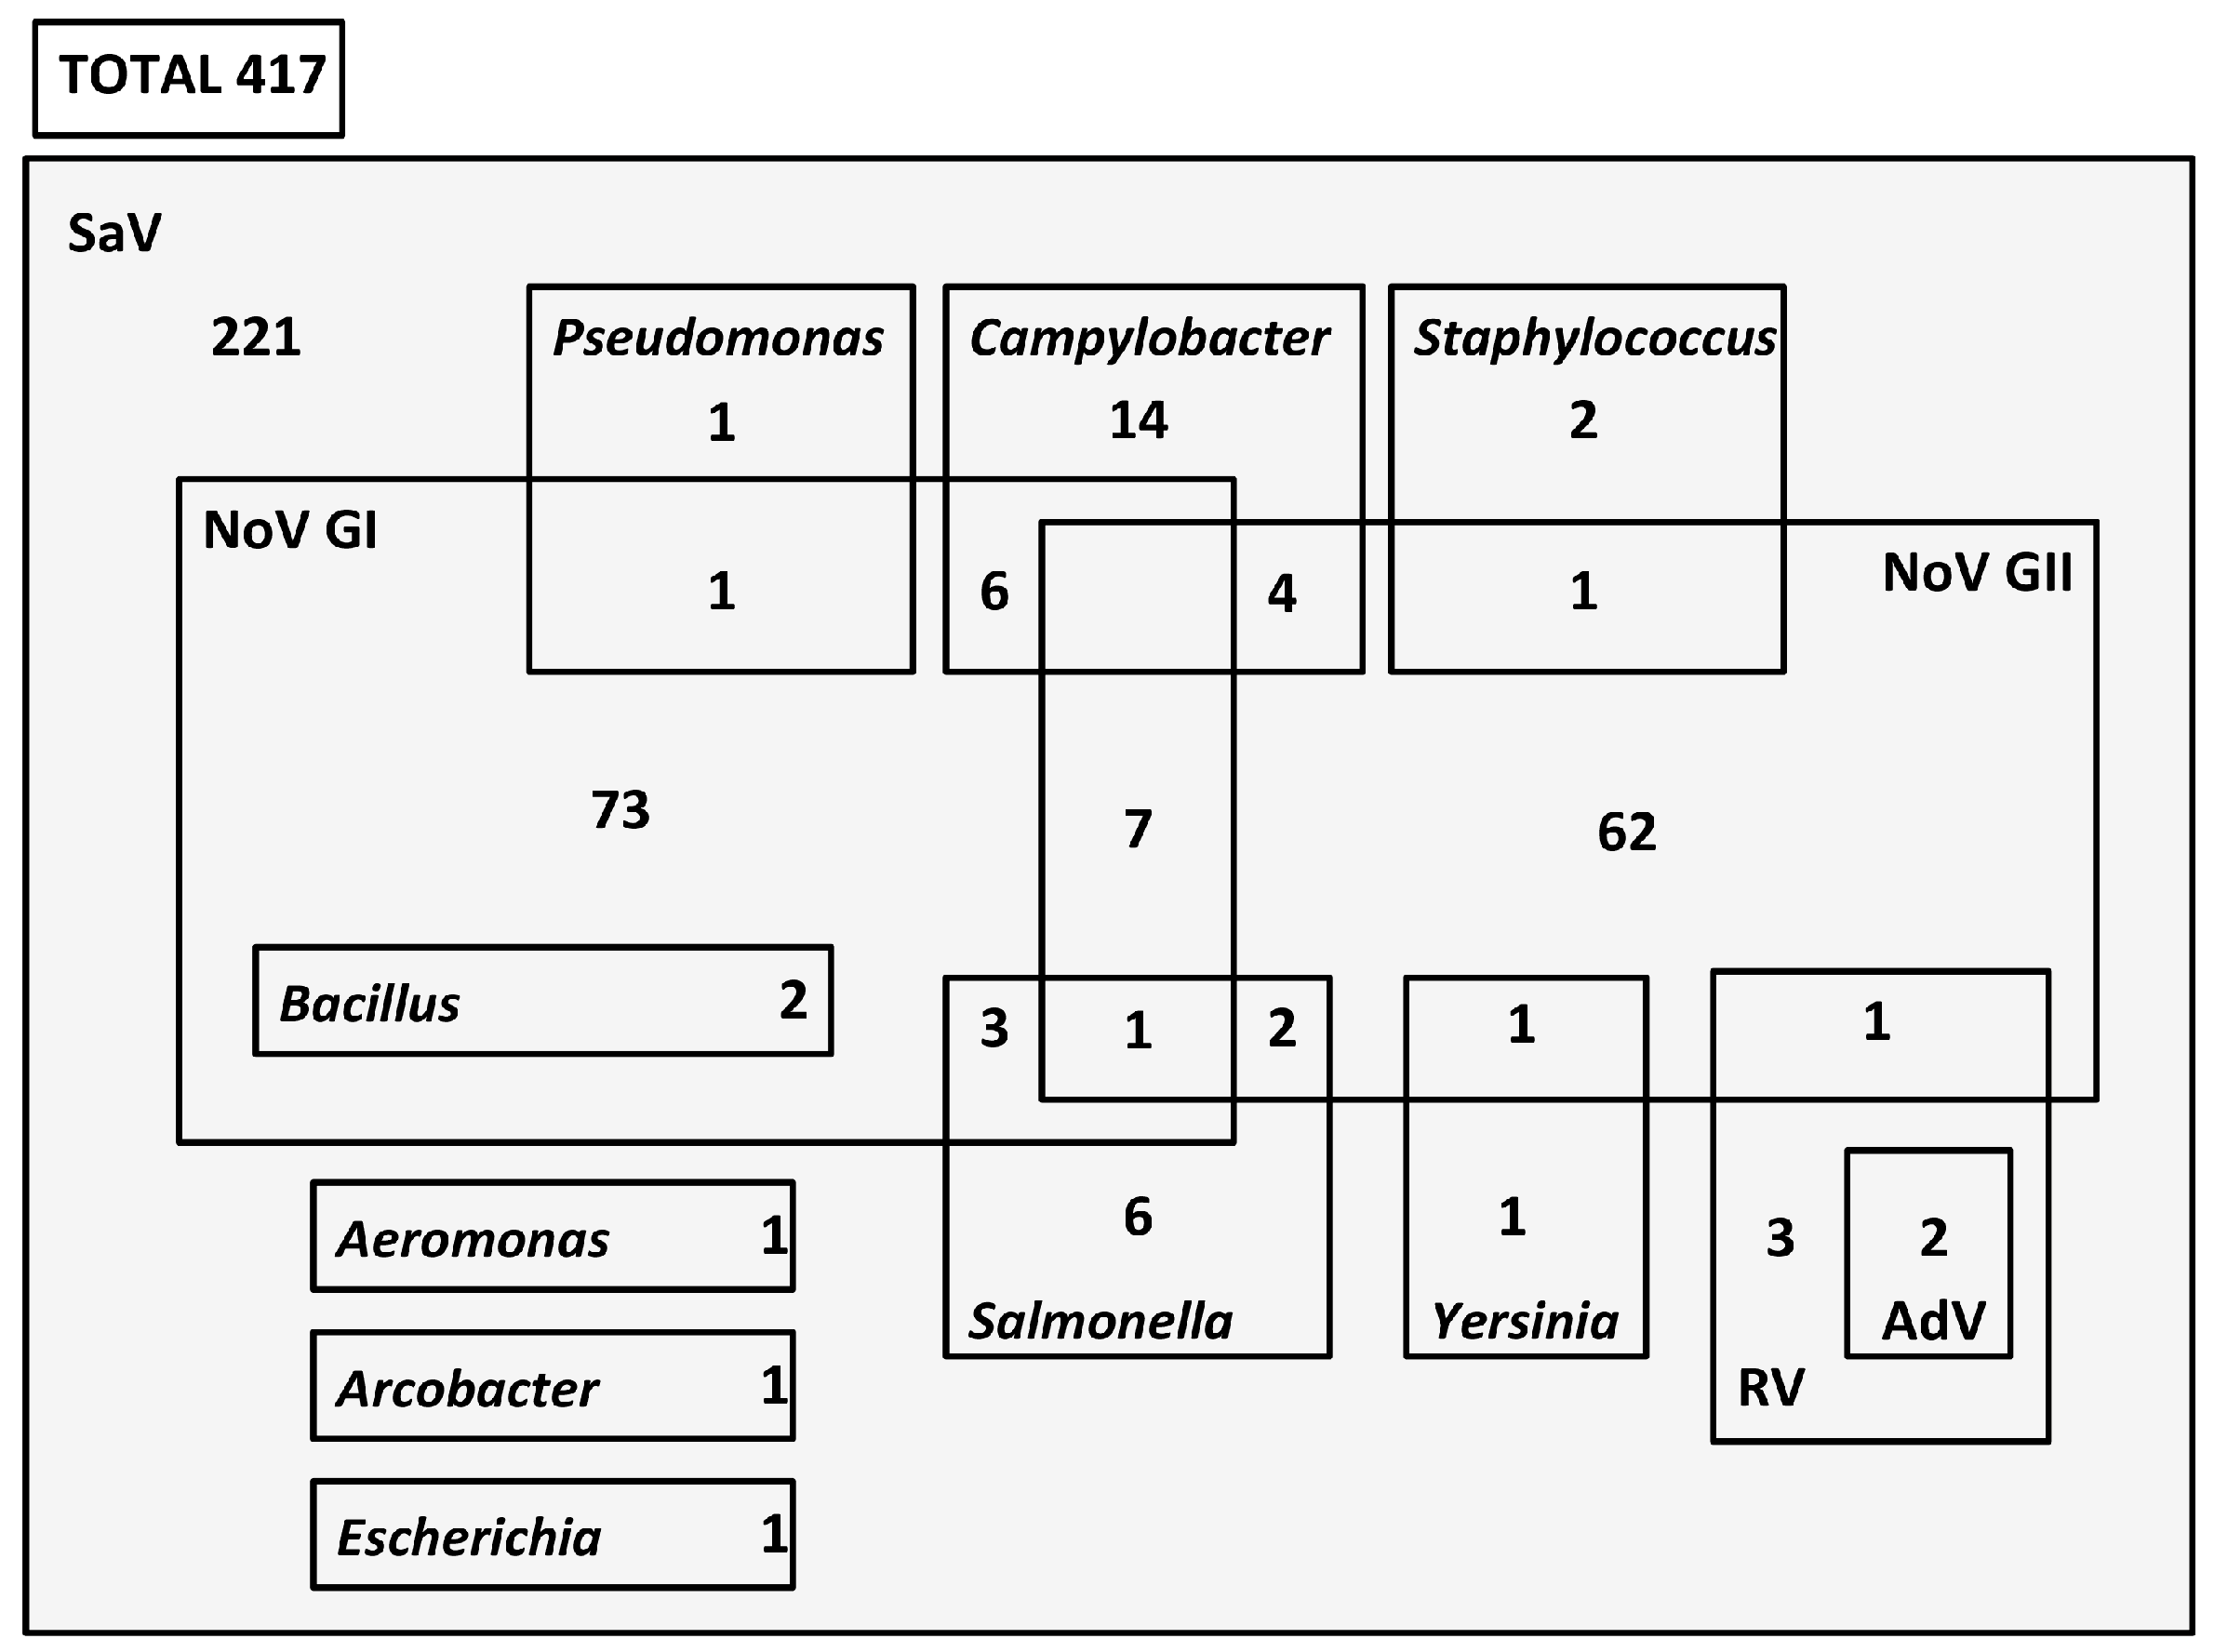
3.2. Coinfection
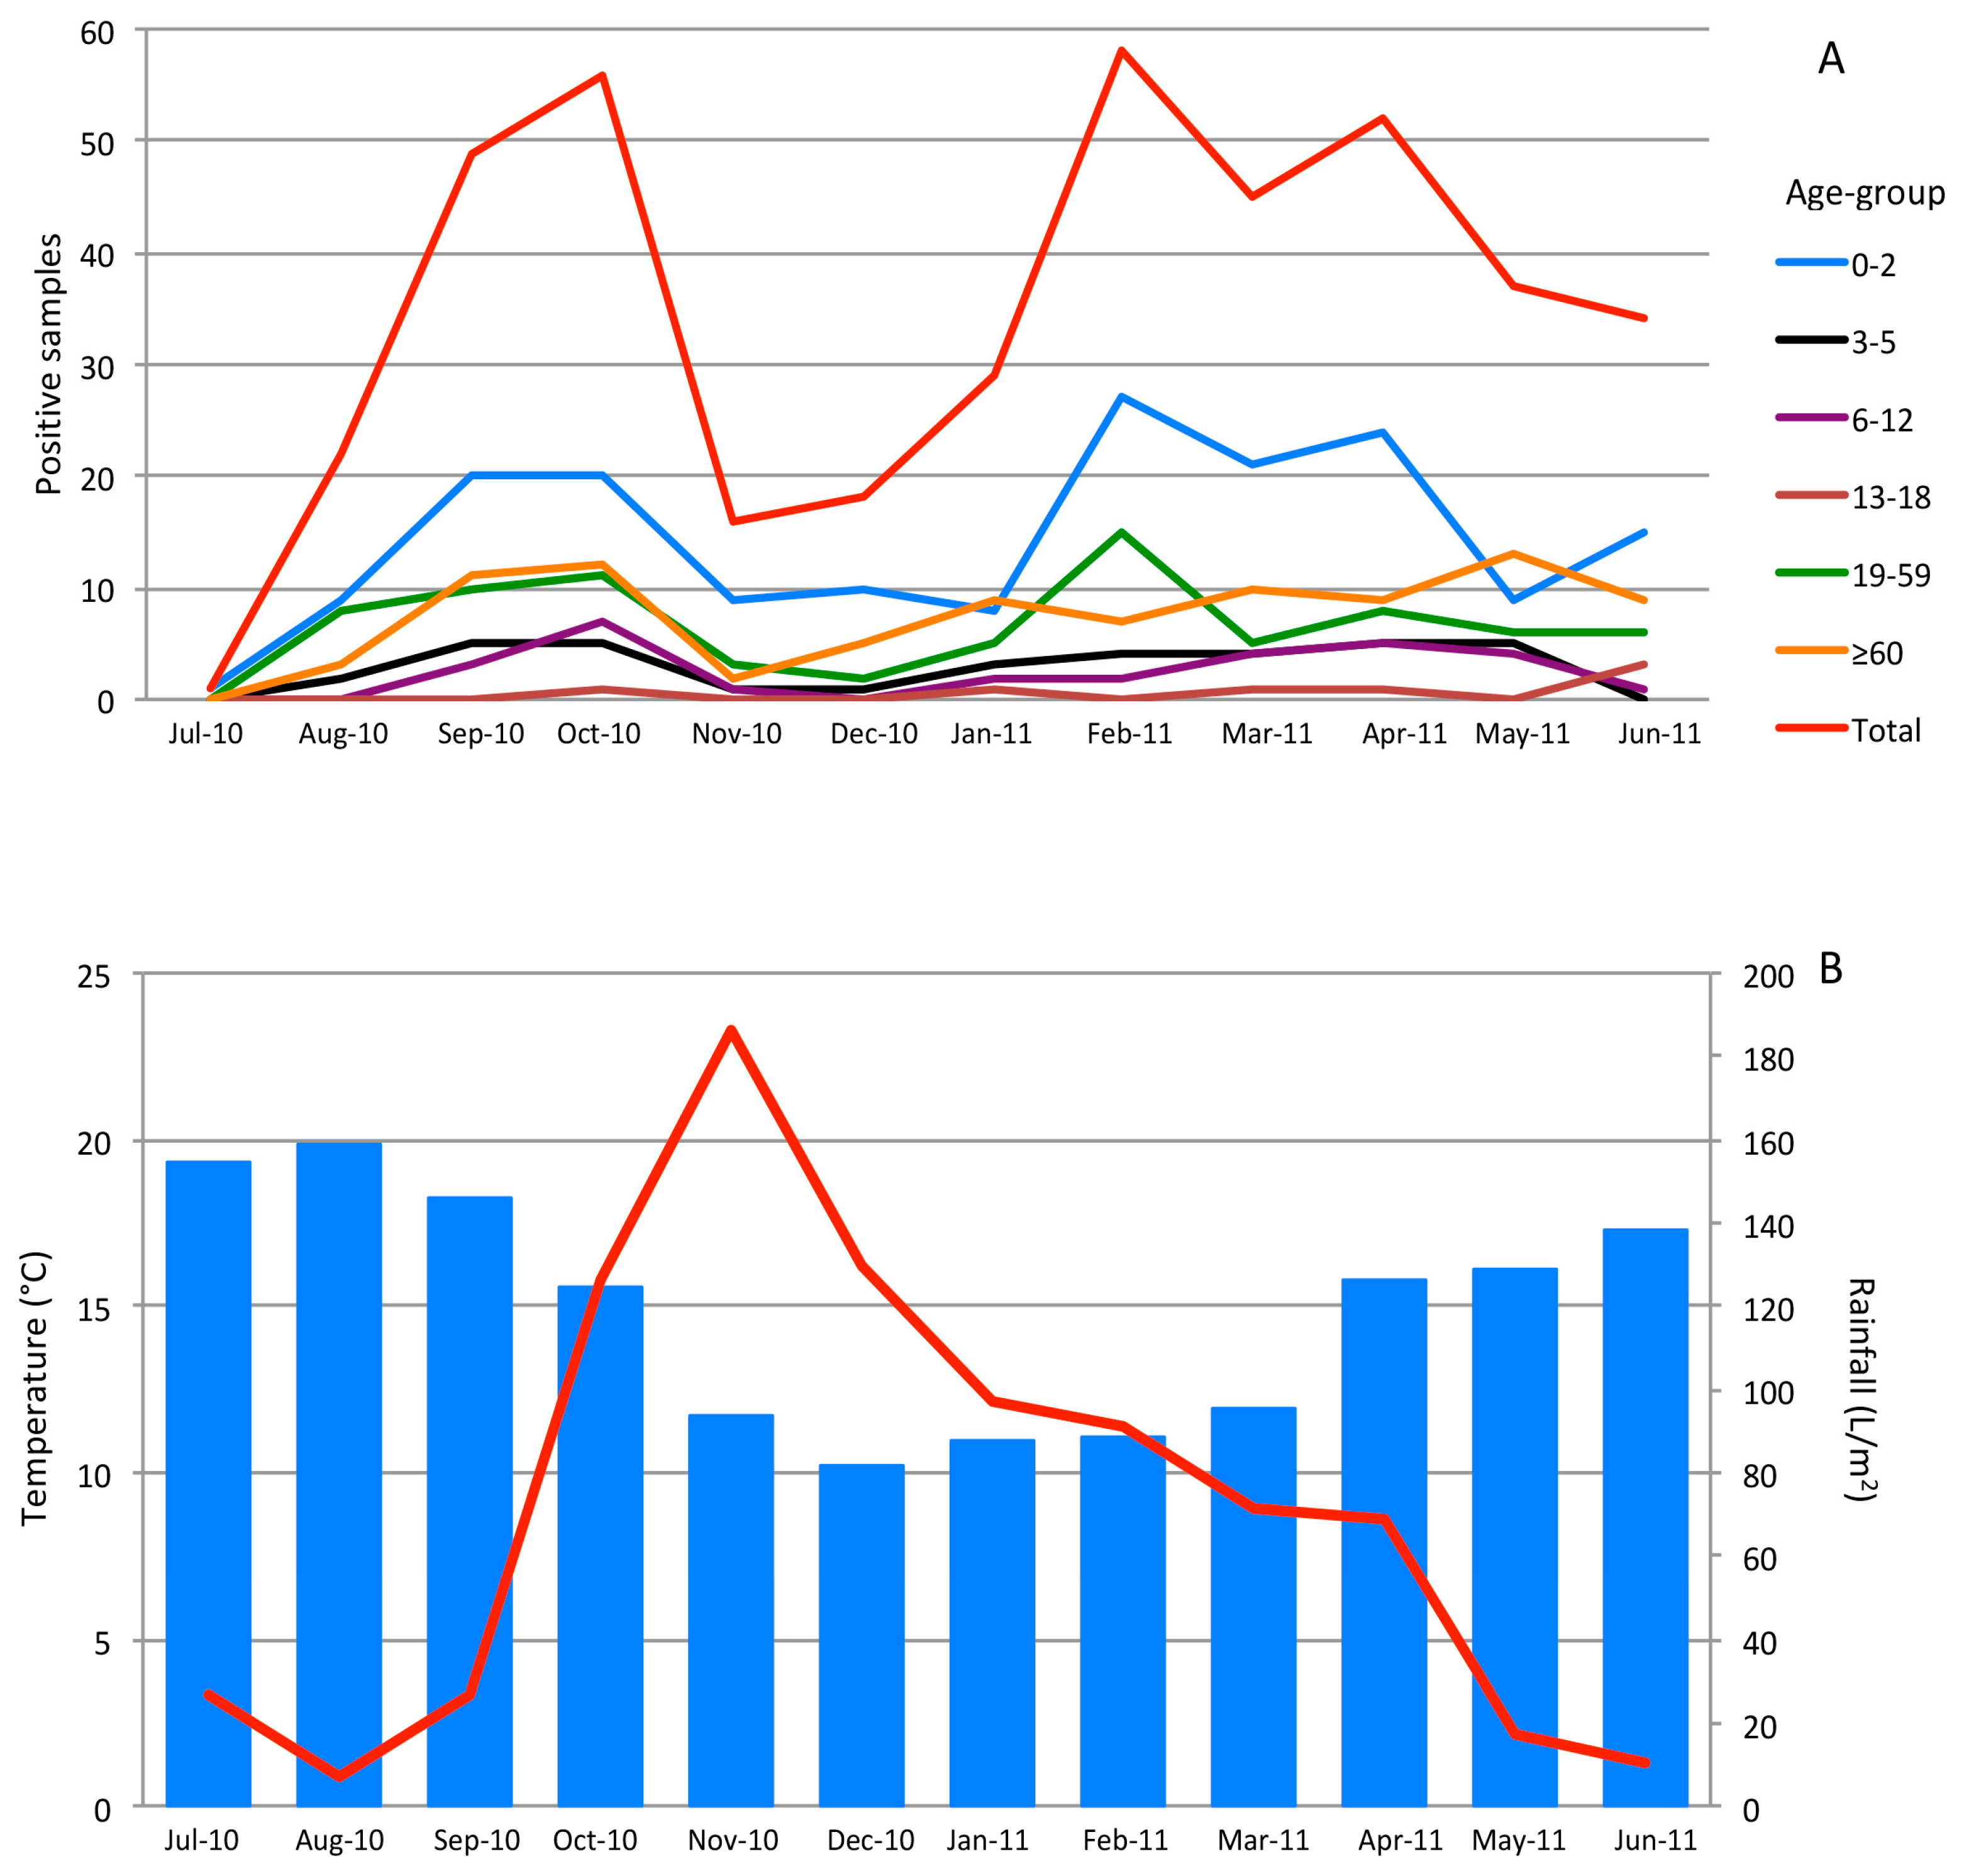
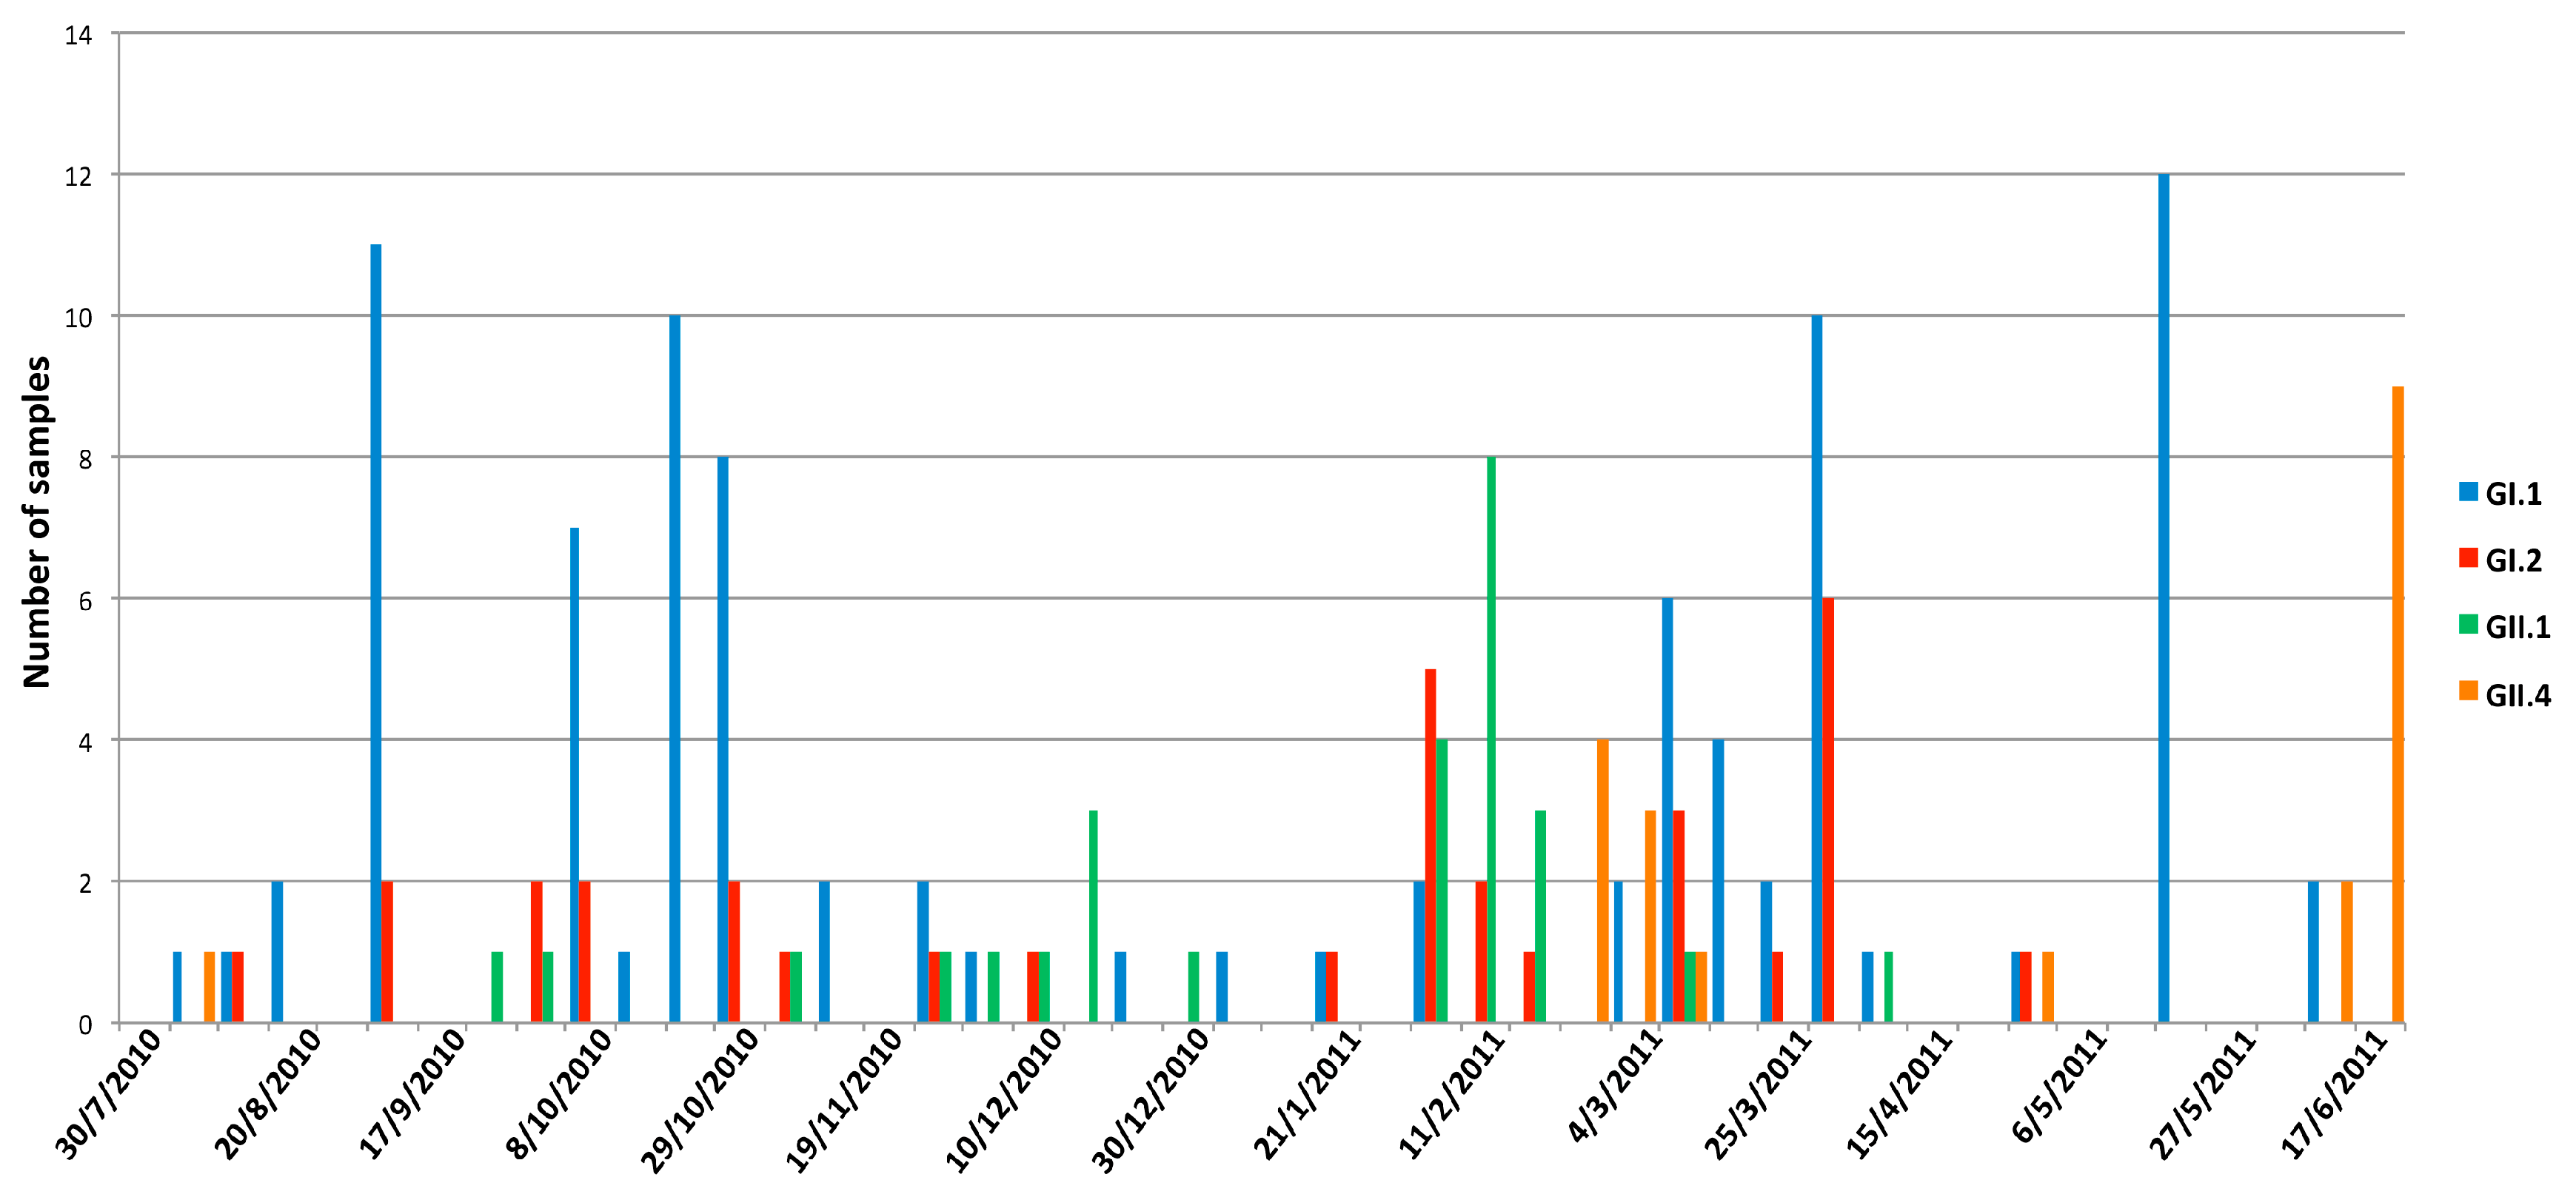
3.3. Seasonality
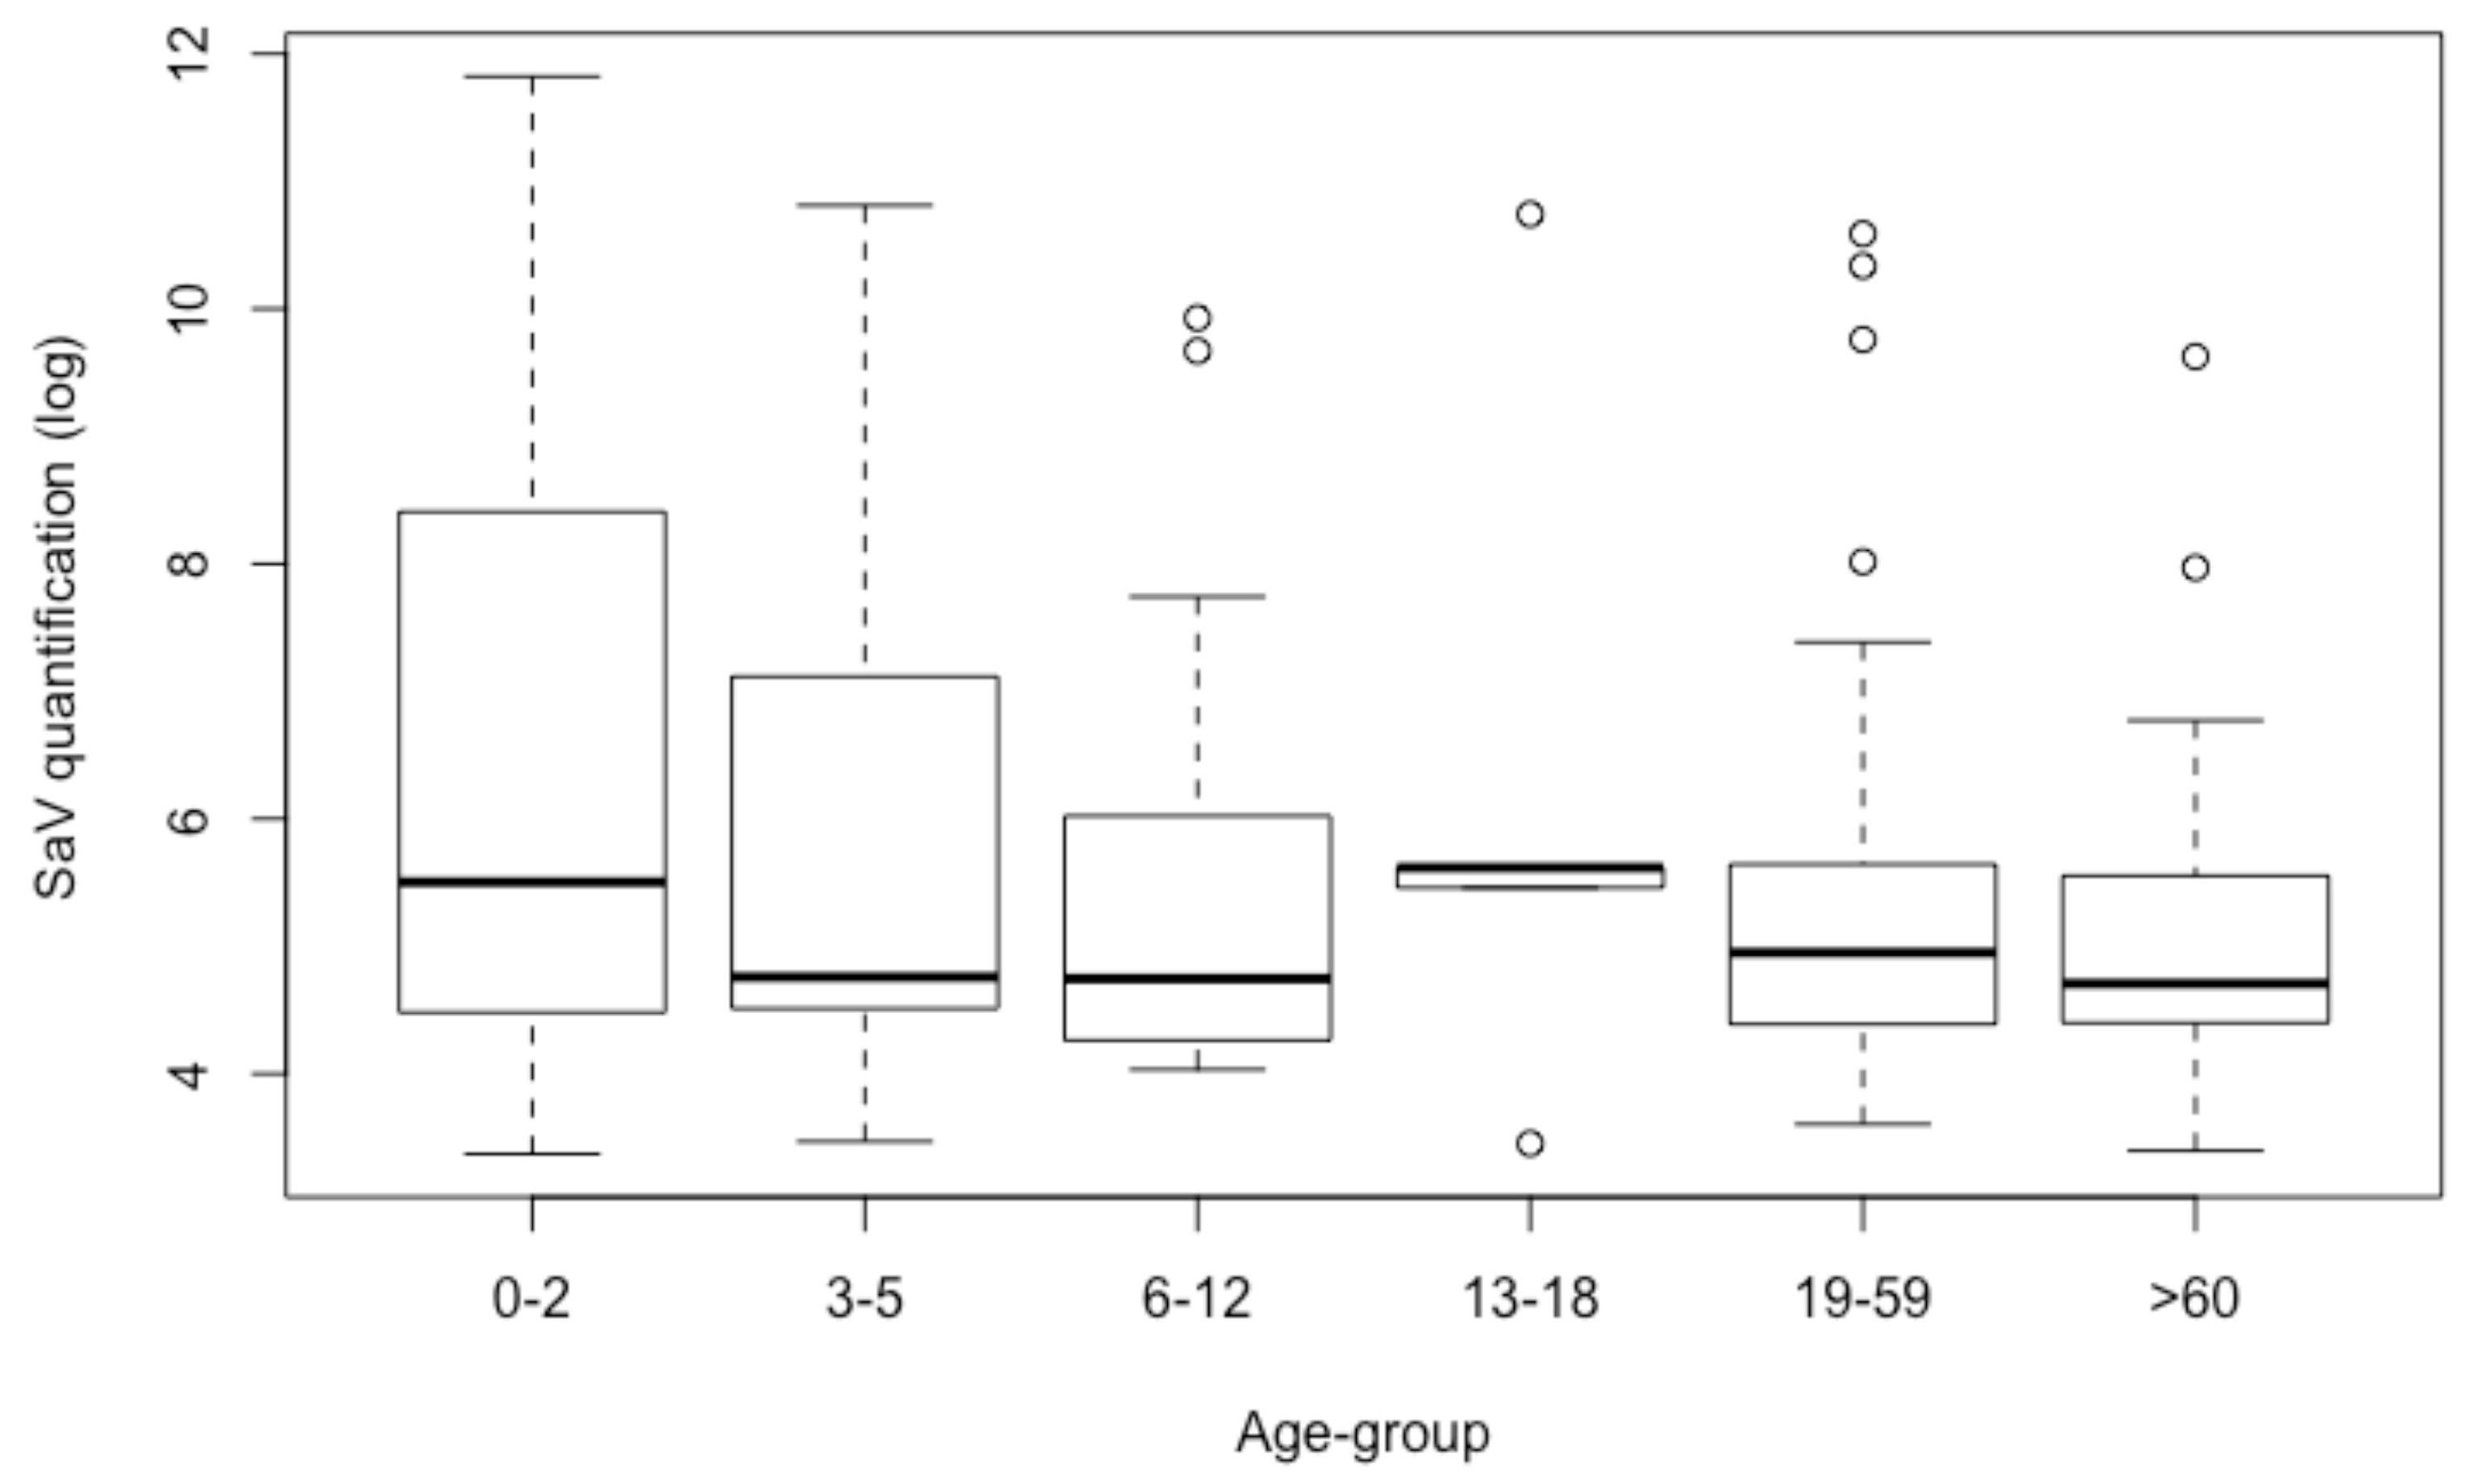
3.4. Quantification
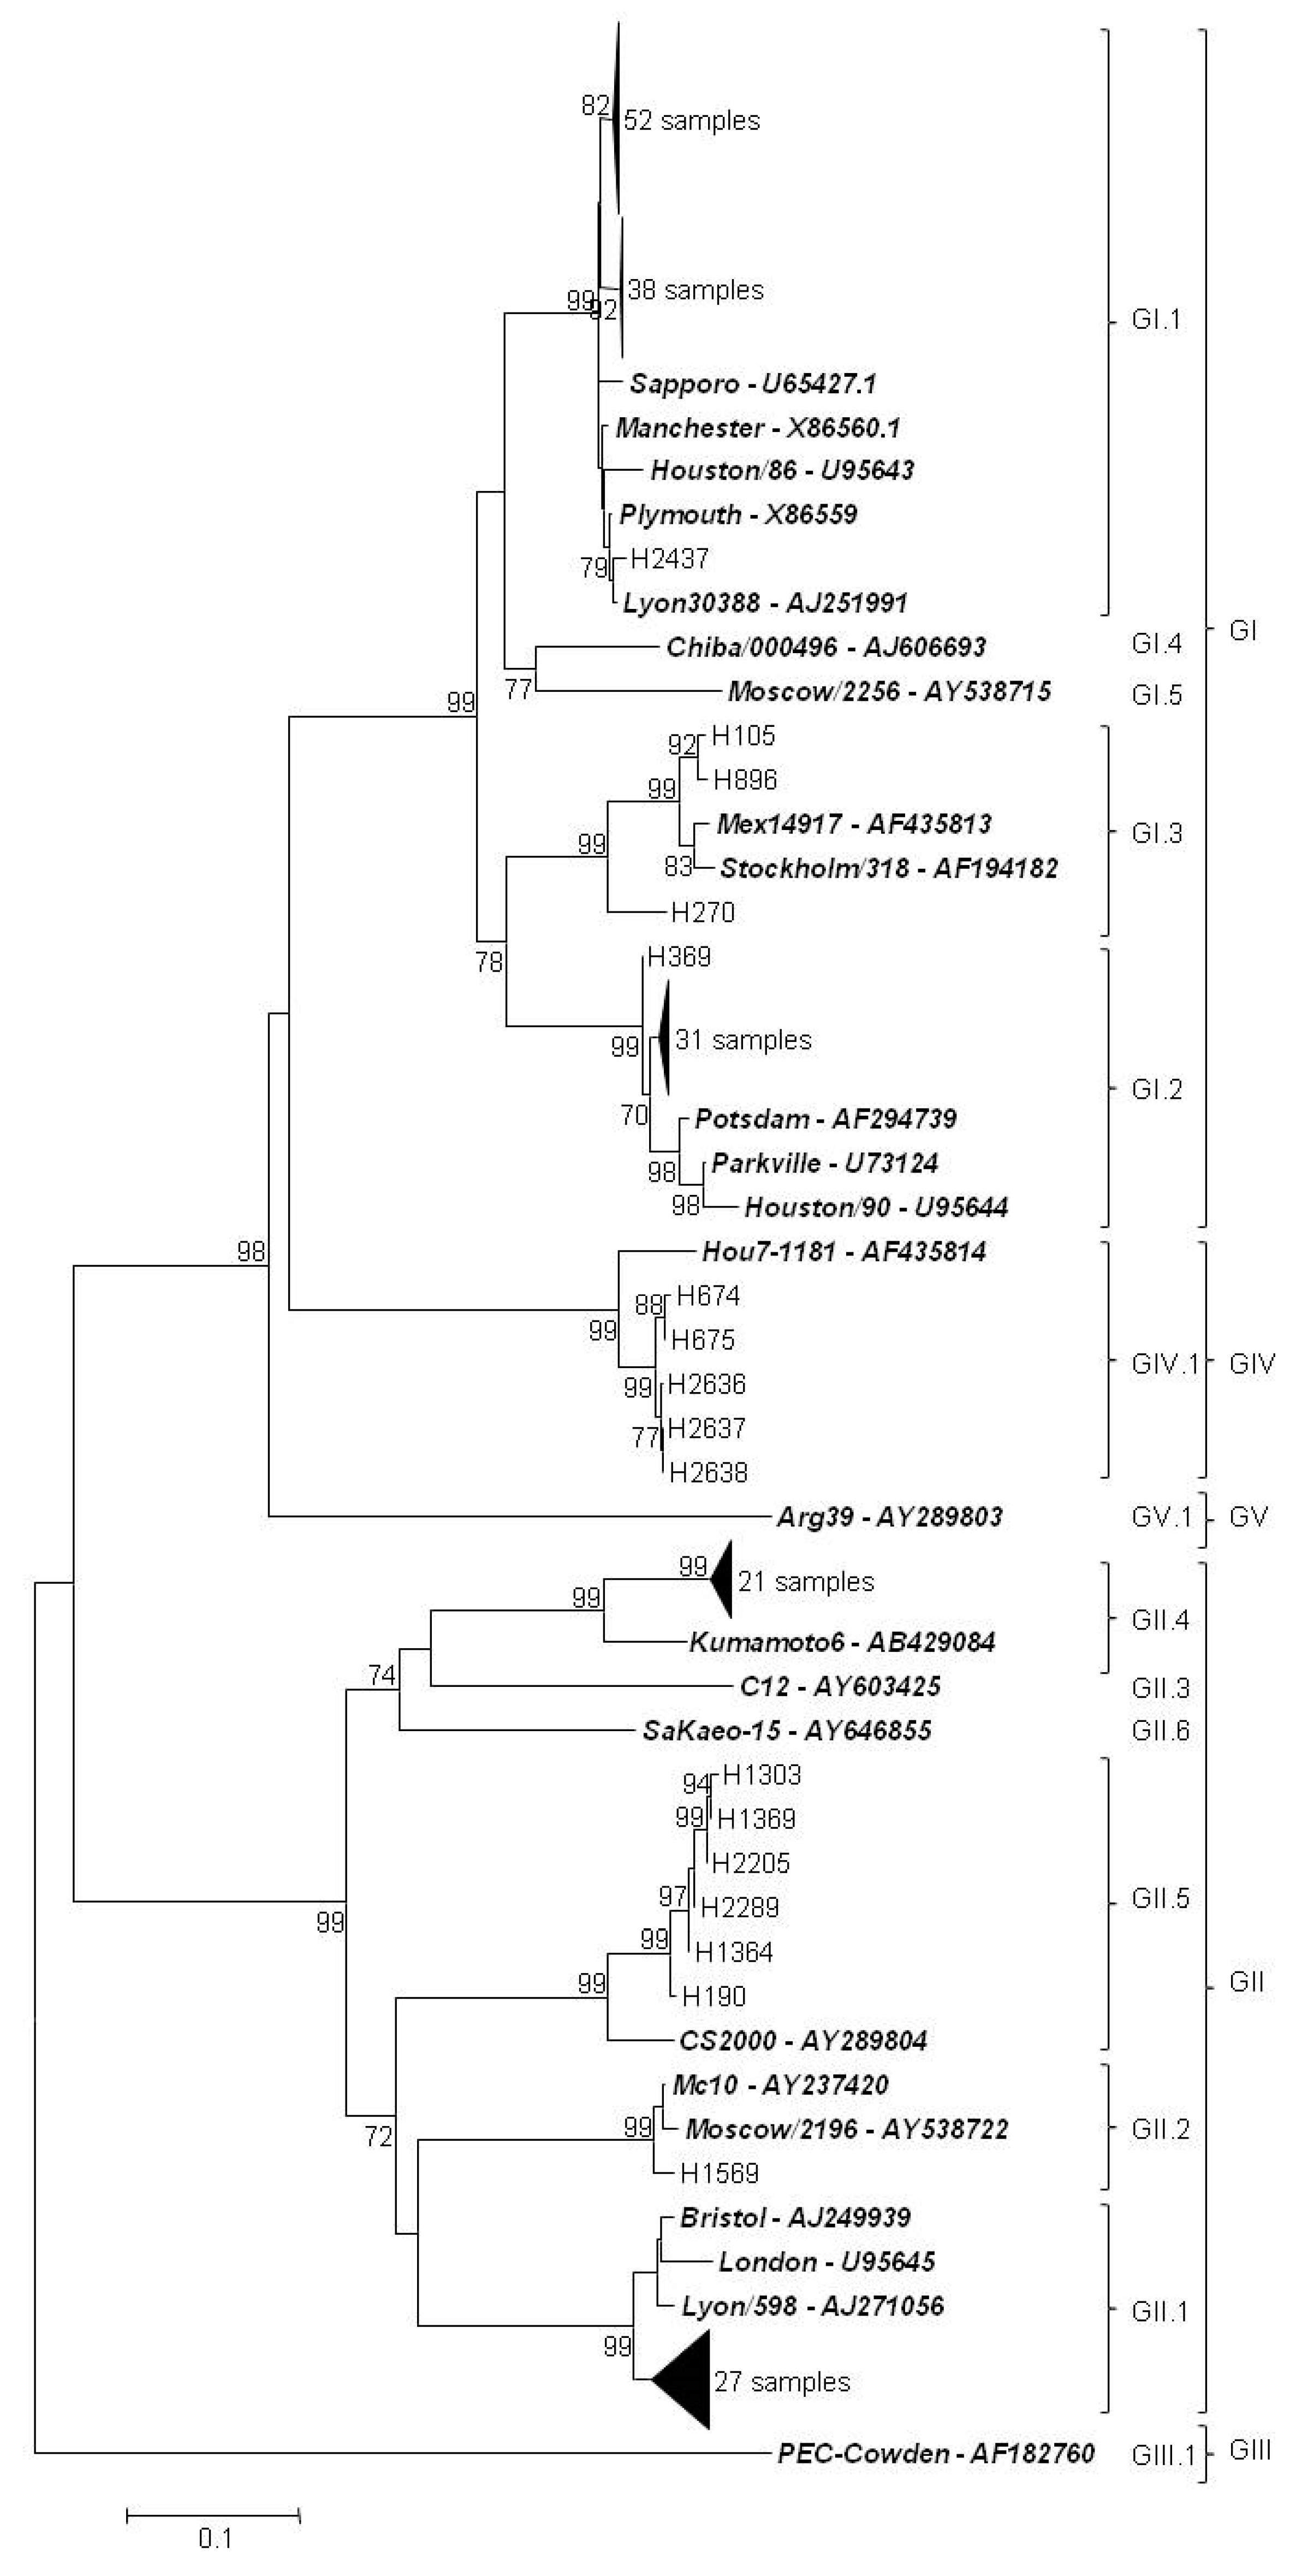
3.5. Genetic Characterization
4. Discussion
Supplementary Materials
Author Contributions
Funding
Acknowledgments
Conflicts of Interest
References
- World Health Organization (WHO). Global Health Estimates 2016: Deaths by Cause, Age, Sex, by Country and by Region, 2000–2016; World Health Organization: Geneva, Switzerland, 2018; Available online: https://www.who.int/healthinfo/global_burden_disease/estimates/en/ (accessed on 20 December 2018).
- Todd, E.C.; Greig, J.D. Viruses of foodborne origin: A review. Virus Adapt. Treat. 2015, 7, 25–45. [Google Scholar] [CrossRef]
- US Environmental Protection Agency. Drinking water contaminant candidate list 4—Final. Fed. Regist. 2016, 81, 81099–81114. [Google Scholar]
- Oka, T.; Wang, Q.; Katayama, K.; Saif, L.J. Comprehensive review of human sapoviruses. Clin. Microbiol. Rev. 2015, 28, 32–53. [Google Scholar] [CrossRef] [PubMed]
- Oka, T.; Mori, K.; Iritani, N.; Harada, S.; Ueki, Y.; Iizuka, S.; Mise, K.; Murakami, K.; Wakita, T.; Katayama, K. Human sapovirus classification based on complete capsid nucleotide sequences. Arch. Virol. 2012, 157, 349–352. [Google Scholar] [CrossRef] [PubMed]
- Lee, R.M.; Lessler, J.; Lee, R.A.; Rudolph, K.E.; Reich, N.G.; Perl, T.M.; Cummings, D.A. Incubation periods of viral gastroenteritis: A systematic review. BMC Infect. Dis. 2013, 13, 446. [Google Scholar] [CrossRef]
- Kirkwood, C.D.; Clark, R.; Bogdanovic-Sakran, N.; Bishop, R.F. A 5-year study of the prevalence and genetic diversity of human caliciviruses associated with sporadic cases of acute gastroenteritis in young children admitted to hospital in Melburne, Australia (1998–2002). J. Med. Virol. 2005, 77, 96–101. [Google Scholar] [CrossRef]
- Iwakiri, A.; Ganmyo, H.; Yamamoto, S.; Otao, K.; Mikasa, M.; Kizoe, S.; Katayama, K.; Wakita, T.; Takeda, N.; Oka, T. Quantitative analysis of fecal sapovirus shedding: Identification of nucleotide substitutions in the capsid protein during prolonged excretion. Arch. Virol. 2009, 154, 689–693. [Google Scholar] [CrossRef]
- Yoshida, T.; Kasuo, S.; Azegami, Y.; Uchiyama, Y.; Satsumabayashi, K.; Shiraishi, T.; Katayama, K.; Wakita, T.; Takeda, N.; Oka, T. Characterization of sapoviruses detected in gastroenteritis outbreaks and identification of asymptomatic adults with high viral load. J. Clin. Virol. 2009, 45, 67–71. [Google Scholar] [CrossRef]
- Manso, C.F.; Torres, E.; Bou, G.; Romalde, J.L. Role of norovirus in acute gastroenteritis in the Northwest of Spain. J. Med. Virol. 2013, 85, 2009–2015. [Google Scholar] [CrossRef]
- International Organization for Standardization (ISO). Microbiology of Food and Animal Feed—Horizontal Method for Determination of Hepatitis a Virus and Norovirus in Food Using Real-Time RT-PCR—Part 2: Method for Qualitative Detection; ISO/TS 15216-2:2013; International Organization for Standardization: Geneva, Switzerland, 2013. [Google Scholar]
- International Organization for Standardization (ISO). Microbiology of the Food Chain—Horizontal Method for Determination of Hepatitis a Virus and Norovirus Using Real-Time RT-PCR—Part 1: Method for Quantification; ISO 15216-1:2017; International Organization for Standardization: Geneva, Switzerland, 2017. [Google Scholar]
- Oka, T.; Katayama, K.; Hansman, G.S.; Kageyama, T.; Ogawa, S.; Wu, F.T.; White, P.A.; Takeda, N. Detection of human sapovirus by real-time reverse transcription–polymerase chain reaction. J. Med. Virol. 2006, 78, 1347–1353. [Google Scholar] [CrossRef]
- Varela, M.F.; Polo, D.; Romalde, J.L. Prevalence and genetic diversity of human sapovirus in shellfish from commercial production areas in Galicia, Spain. Appl. Environ. Microbiol. 2016, 82, 1167–1172. [Google Scholar] [CrossRef] [PubMed]
- Tamura, K.; Stecher, G.; Peterson, D.; Filipski, A.; Kumar, S. MEGA6: molecular evolutionary genetics analysis version 6.0. Mol. Biol. Evol. 2013, 30, 2725–2729. [Google Scholar] [CrossRef] [PubMed]
- R Core Team. R: A Language and Environment for Statistical Computing; R Foundation for Statistical Computing: Vienna, Austria, 2013; Available online: http://www.R-project.org/ (accessed on 30 October 2018).
- Tam, C.C.; O’Brien, S.J.; Tompkins, D.S.; Bolton, F.J.; Berry, L.; Dodds, J.; Choudhury, D.; Halstead, F.; Iturriza-Gómara, M.; Mather, K.; et al. Changes in causes of acute gastroenteritis in the United Kingdom over 15 years: Microbiologic findings from 2 prospective, population-based studies of infectious intestinal disease. Clin. Infect. Dis. 2012, 54, 1275–1286. [Google Scholar] [CrossRef]
- Chhabra, P.; Payne, D.C.; Szilagyi, P.G.; Edwards, K.M.; Staat, M.A.; Shirley, S.H.; Wikswo, M.; Nix, W.A.; Lu, X.; Parashar, U.D.; et al. Etiology of viral gastroenteritis in children <5 years of age in the United States, 2008–2009. J. Infect. Dis. 2013, 208, 790–800. [Google Scholar] [CrossRef] [PubMed]
- Thongprachum, A.; Takanashi, S.; Kalesaran, A.F.C.; Okitsu, S.; Mizuguchi, M.; Hayakawa, S.; Ushijima, H. Four-year study of viruses that cause diarrhea in Japanese pediatric outpatients. J. Med. Virol. 2015, 87, 1141–1148. [Google Scholar] [CrossRef] [PubMed]
- Bucardo, F.; Reyes, Y.; Svensson, L.; Nordgren, J. Predominance of norovirus and sapovirus in Nicaragua after implementation of universal rotavirus vaccination. PLoS ONE 2014, 9, e98201. [Google Scholar] [CrossRef] [PubMed]
- Phan, T.G.; Okame, M.; Nguyen, T.A.; Nishio, O.; Okitsu, S.; Ushijima, H. Genetic diversity of sapovirus in fecal specimens from infants and children with acute gastroenteritis in Pakistan. Arch. Virol. 2005, 150, 371–377. [Google Scholar] [CrossRef] [PubMed]
- Wang, G.; Shen, Z.; Qian, F.; Li, Y.; Yuan, Z.; Zhang, J. Genetic diversity of sapovirus in non-hospitalized adults with sporadic cases of acute gastroenteritis in Shanghai, China. J. Clin. Virol. 2014, 59, 250–254. [Google Scholar] [CrossRef] [PubMed]
- Pang, X.L.; Honma, S.; Nakata, S.; Vesikari, T. Human caliciviruses in acute gastroenteritis of young children in the community. J. Infect. Dis. 2000, 181, S288–S294. [Google Scholar] [CrossRef] [PubMed]
- Biscaro, V.; Piccinelli, G.; Gargiulo, F.; Ianiro, G.; Caruso, A.; Caccuri, F.; De Francesco, M.A. Detection and molecular characterization of enteric viruses in children with acute gastroenteritis in Northern Italy. Infect. Genet. Evol. 2018, 60, 35–41. [Google Scholar] [CrossRef] [PubMed]
- Brown, J.R.; Shah, D.; Breuer, J. Viral gastrointestinal infections and norovirus genotypes in a paediatric UK hospital, 2014–2015. J. Clin. Virol. 2016, 84, 1–6. [Google Scholar] [CrossRef] [PubMed]
- Harada, S.; Okada, M.; Yahiro, S.; Nishimura, K.; Matsuo, S.; Miyasaka, J.; Nakashima, R.; Shimada, Y.; Ueno, T.; Ikezawa, S.; et al. Surveillance of pathogens in outpatients with gastroenteritis and characterization of sapovirus strains between 2002 and 2007 in Kumamoto Prefecture, Japan. J. Med. Virol. 2009, 81, 1117–1127. [Google Scholar] [CrossRef] [PubMed]
- Harada, S.; Oka, T.; Tokuoka, E.; Kiyota, N.; Nishimura, K.; Shimada, Y.; Ueno, T.; Ikezawa, S.; Wakita, T.; Wang, Q.; et al. A confirmation of sapovirus re-infection gastroenteritis cases with different genogroups and genetic shifts in the evolving sapovirus genotypes, 2002-2011. Arch. Virol. 2012, 157, 1999–2003. [Google Scholar] [CrossRef]
- Pongsuwanna, Y.; Tacharoenmuang, R.; Prapapanpoj, M.; Sakon, N.; Komoto, S.; Guntapong, R.; Taniguchi, K. Monthly distribution of norovirus and sapoviruscausing viral gastroenteritis in Thailand. Jpn. J. Infect. Dis. 2017, 70, 84–86. [Google Scholar] [CrossRef] [PubMed]
- Shioda, K.; Cosmas, L.; Audi, A.; Grogoricus, N.; Vinjé, J.; Parashar, U.D.; Montgomery, J.M.; Feiking, D.R.; Breiman, R.F.; Hall, A.J. Population-based incidence rates of diarrheal disease associated with norovirus, sapovirus, and astrovirus in Kenya. PLoS ONE 2016, 11, e0145943. [Google Scholar] [CrossRef] [PubMed]
- Gallimore, C.I.; Itturiza-Gomara, M.; Lewis, D.; Cubitt, D.; Cotterill, H.; Gray, J. Characterization of sapoviruses collected in the United Kingdom from 1989 to 2004. J. Med. Virol. 2006, 78, 673–682. [Google Scholar] [CrossRef] [PubMed]
- Svraka, S.; Vennema, H.; van der Veer, B.; Hedlund, K.O.; Thorhagen, M.; Siebenga, J.; Duizer, E.; Koopmans, M. Epidemiology and genotype analysis of emerging sapovirus-associated infections across Europe. J. Clin. Microbiol. 2010, 48, 2191–2198. [Google Scholar] [CrossRef]
- Varela, M.F.; Ouardani, I.; Kato, T.; Kadoya, S.; Aouni, M.; Sano, D.; Romalde, J.L. Sapovirus in wastewater treatment plants in Tunisia: Prevalence, removal, and genetic characterization. Appl. Environ. Microbiol. 2018, 84, e02093-17. [Google Scholar] [CrossRef]
- Diez-Valcarce, M.; Castro, C.J.; Marine, R.L.; Halasa, N.; Mayta, H.; Saito, M.; Tsaknaridis, L.; Pan, C.Y.; Bucardo, F.; Becker-Dreps, S.; et al. Genetic diversity of human sapovirus across the Americas. J. Clin. Virol. 2018, 104, 65–72. [Google Scholar] [CrossRef]
- Kumthip, K.; Khamrin, P.; Maneekarn, N. Molecular epidemiology and genotype distributions of noroviruses and sapoviruses in Thailand 2000–2016: A review. J. Med. Virol. 2018, 90, 617–624. [Google Scholar] [CrossRef]
- Sano, D.; Pérez-Sautu, U.; Guix, S.; Pintó, R.M.; Miura, T.; Okabe, S.; Bosch, A. Quantification and genotyping of human sapoviruses in the Llobregat river catchment, Spain. Appl. Environ. Microbiol. 2011, 77, 1111–1114. [Google Scholar] [CrossRef] [PubMed]
- Varela, M.F.; Hooper, A.S.; Rivadulla, E.; Romalde, J.L. Human sapovirus in mussels from ría do Burgo, A Coruña (Spain). Food Environ. Virol. 2016, 8, 187–193. [Google Scholar] [CrossRef] [PubMed]


| Genotype | 0–2 | 3–5 | 6–12 | 13–18 | 19–59 | ≥60 | Unknown | Total |
|---|---|---|---|---|---|---|---|---|
| GI.1 | 41 | 8 | 8 | 1 | 14 | 19 | 91 | |
| GI.2 | 11 | 5 | 4 | 5 | 5 | 2 | 32 | |
| GI.3 | 1 | 2 | 3 | |||||
| GII.1 | 17 | 1 | 1 | 6 | 2 | 27 | ||
| GII.2 | 0 | 1 | 1 | |||||
| GII.4 | 7 | 1 | 1 | 1 | 5 | 6 | 21 | |
| GII.5 | 2 | 1 | 1 | 2 | 6 | |||
| GIV | 1 | 2 | 2 | 5 | ||||
| Total | 79 | 18 | 14 | 3 | 34 | 36 | 2 | 186 |
© 2019 by the authors. Licensee MDPI, Basel, Switzerland. This article is an open access article distributed under the terms and conditions of the Creative Commons Attribution (CC BY) license (http://creativecommons.org/licenses/by/4.0/).
Share and Cite
Varela, M.F.; Rivadulla, E.; Lema, A.; Romalde, J.L. Human Sapovirus among Outpatients with Acute Gastroenteritis in Spain: A One-Year Study. Viruses 2019, 11, 144. https://doi.org/10.3390/v11020144
Varela MF, Rivadulla E, Lema A, Romalde JL. Human Sapovirus among Outpatients with Acute Gastroenteritis in Spain: A One-Year Study. Viruses. 2019; 11(2):144. https://doi.org/10.3390/v11020144
Chicago/Turabian StyleVarela, Miguel F., Enrique Rivadulla, Alberto Lema, and Jesús L. Romalde. 2019. "Human Sapovirus among Outpatients with Acute Gastroenteritis in Spain: A One-Year Study" Viruses 11, no. 2: 144. https://doi.org/10.3390/v11020144
APA StyleVarela, M. F., Rivadulla, E., Lema, A., & Romalde, J. L. (2019). Human Sapovirus among Outpatients with Acute Gastroenteritis in Spain: A One-Year Study. Viruses, 11(2), 144. https://doi.org/10.3390/v11020144