1. Introduction
The widespread inappropriate use of antibiotics in both humans (clinical medicine) and animals (livestock industry) worldwide has led to an acceleration in the emergence and global spread of multidrug antibiotic resistant bacterial clones [
1]. The problem of antibiotic resistance is a complex one requiring global coordination for antibiotic stewardship to preserve the efficacy of current treatments. In much of the world outside Europe and North America, lifesaving antibiotics are sold without a prescription or oversight by health professionals [
2]. In the period between 1940–1962, 20 new classes of antibiotics were introduced to the market; however, since 1962, there has been a discovery void, with only two new classes reaching this stage [
3]. The speed of resistance development has been faster than the rate of discovery of new antibiotics [
4]. The substantial public health threat from antibiotic resistance includes jeopardising the effectiveness of treatments in modern medicine from minor elective surgeries to cancer therapy.
Initiatives to develop new therapeutic approaches with novel mechanisms of activity against Multi-Drug Resistant (MDR) bacterial pathogens include the potential use of lytic bacteriophages [
5,
6]. Lytic bacteriophages (commonly referred to as phages) are viruses that infect and kill bacteria, and they represent a promising approach for the targeting of bacterial infections in a treatment known as phage therapy [
7,
8,
9,
10]. The specificity of bacteriophages and their potential role in maintaining healthy microbiota makes them an attractive alternative to employing antibiotics. Technical advances are reducing the cost, ease of processing, and sequencing times of next-generation sequencing (NGS), thereby allowing rapid culture-independent identification of disease-causing bacteria [
11]. These developments increase the opportunities for using narrow spectrum of antibiotics where the infection-causing bacterial agent is known, thereby opening-up the possibility of employing phages for therapeutic purposes [
12]. A number of recent studies in animals and humans have been carried out to investigate the clinical safety and therapeutic or prophylactic efficacy of phages against
Pseudomonas aeruginosa,
Staphylococcus aureus,
Acinetobacter baumannii, Escherichia coli, and
Salmonella enteritidis [
13,
14,
15,
16].
CRISPR/Cas-mediated genome engineering approaches are being developed to repurpose phages for the sequence-specific targeting of bacteria within complex bacterial populations that are capable of distinguishing between pathogenic or commensal bacterial species through targeting virulence or essential chromosomal genes [
17]. CRISPR-Cas9 targeting bacterial chromosomal genes have recently been encapsulated in phage capsids by genetically encoding the machinery in phagemids (plasmid packaged in the capsid), thereby using the species-level specificity of phages to achieve CRISPR-Cas delivery [
18,
19].
Increasing future demand for bacteriophages in different fields including food, agriculture, veterinary, and human medicine requires the development of scalable GMP-compliant (cGMP) phage manufacturing platforms. Existing bioprocess engineering approaches that are used for the manufacture of biotherapeutics e.g., monoclonal antibodies and vaccine manufacture, may be adapted for phage production. However, there are important differences, including the relatively large size of phages (~100 nm), with implications for the development of process unit operations. Conventional chromatographic materials, for example, are currently designed to allow proteins access to the internal pore structure and large surface area that are not readily accessible to large phage particles, reducing the separation capacity of the resins [
20]. Therefore, new innovations are needed such as the use of monolith-based chromatography supports to overcome such challenges [
21]. The manufacture of large quantities of phages at low cost necessitates the development of continuous production techniques and a move away from batch processing in order to improve productivity and reduce the process footprint [
22]. Regulatory agencies (e.g., the United States Food and Drug Administration, FDA) have strict requirements regarding controlling the product quality within specified limits for pharmaceuticals. A fundamental understanding of the underlying kinetics and the influence of processing conditions on product quality attributes is an essential prerequisite to ensure the implementation of online or at-line process control strategies as part of a Quality by Design (QbD) framework now in favour by USFDA for the manufacture of pharmaceuticals.
Phages are typically produced in batch fermenters e.g., shaken flasks, and more recently in disposable wave bags that are used for tissue cell culture; there are no real issues with regard to residence times and complex control strategies [
23,
24]. The downsides for industrial scale batch fermentation include higher capital costs, large process footprints, labour-intensive operation, that the proportion of downtime compared with production time can be high, a lack of process control, and variability of product quality [
24]. The continuous upstream production of phages using chemostat systems has heretofore received little attention in the published literature, which instead has focused on using such systems for studying coevolution processes [
25,
26,
27]. Decoupling the bacterial host propagation from phage production removes the selection pressure for bacteria mutation and should allow stable long-term steady-state operation of the process [
28]. Semi-continuous production approaches using such a strategy include a two-stage self-cycling process for the production of phages [
24,
29,
30]. Synchronous host populations at high cell concentrations are produced in the first reactor operated in batch mode. These are then passed on for infection with phages in a second batch reactor using a relatively simple control strategy based on the host population approaching a near-stationary phase prior to half of the fermentation volume being transferred to the second reactor for infection. Fresh nutrients are subsequently added to the first reactor to continue host cell propagation in the exponential growth phase, whilst the second infection vessel amplifies the phages prior to the process being repeated in a cyclic fashion.
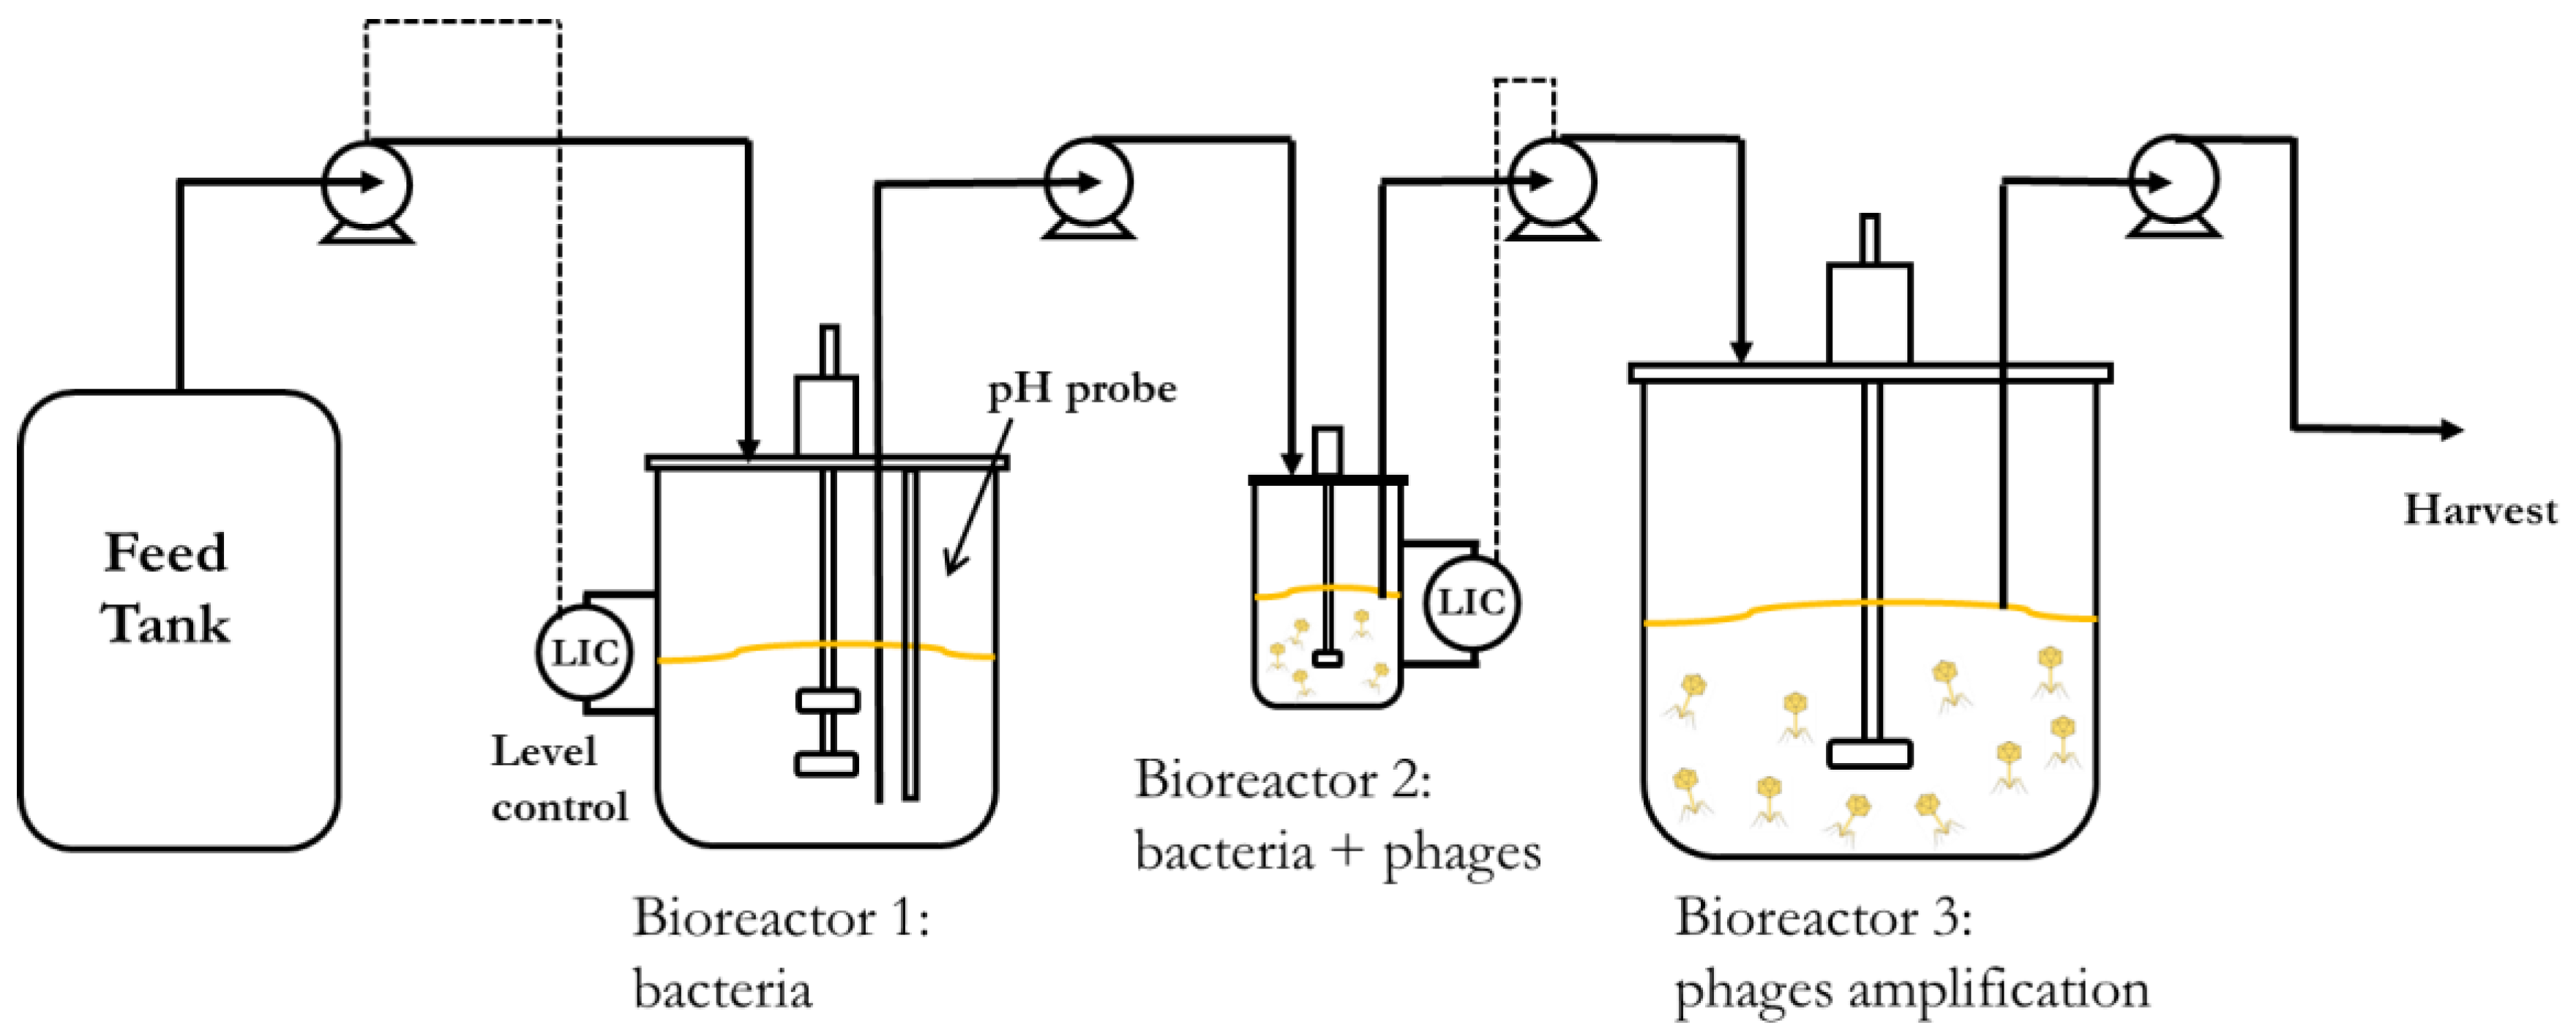
Continuous processes are better suited to increase volumetric productivity. Using two continuous stirred tank bioreactors connected in series would allow the propagation of host bacteria at steady-state concentrations with better control over the host cell metabolic state, ensuring that the cells are optimally susceptible to phage infection in the second bioreactor. The residence times of the two bioreactors could be independently controlled by using different reactor volumes, even though the same flow rate is maintained through them. This would enable longer residence times in the host bacteria-culturing chemostat, resulting in high concentrations of bacteria in the early to middle exponential growth phase. It would also create short residence times in the phage infection bioreactor, resulting in a low MOI (multiplicity of infection) and allowing a higher number of phage replication cycles and further phage amplification in a holding tank (reactor 3) downstream of the second bioreactor. A minimum of two holding tanks may enable the continuous operation of the process. Whilst one vessel is being filled with material from the second bioreactor, the other with phage amplification completed would be emptied, cleaned, and made ready to be brought back into service.
The aim of the present work was to demonstrate the key parameters that need to be evaluated in order to characterise and hence develop an upstream continuous production process for phages as described above. An obligately lytic E. coli phage T3 (belonging to the Podoviridae family, ATCC11303-B3) and bacterial host E. coli (ATCC 11303) were used for the study. Bacteria host growth parameters were evaluated and fitted with Monod kinetics and phage growth parameters (adsorption constant, burst size, and latency period) were evaluated using synthetic media (glucose as the limiting substrate) in order to develop a mathematical model simulating the key features of the production process. The influence of residence time (by controlling the dilution rate) on the bacteria metabolic state and phage productivity in the second bioreactor were investigated. We show through experiments and modelling that the stable continuous manufacture of high titres of phages and process development can be readily achieved through the characterisation of a few key process parameters.
3. Results
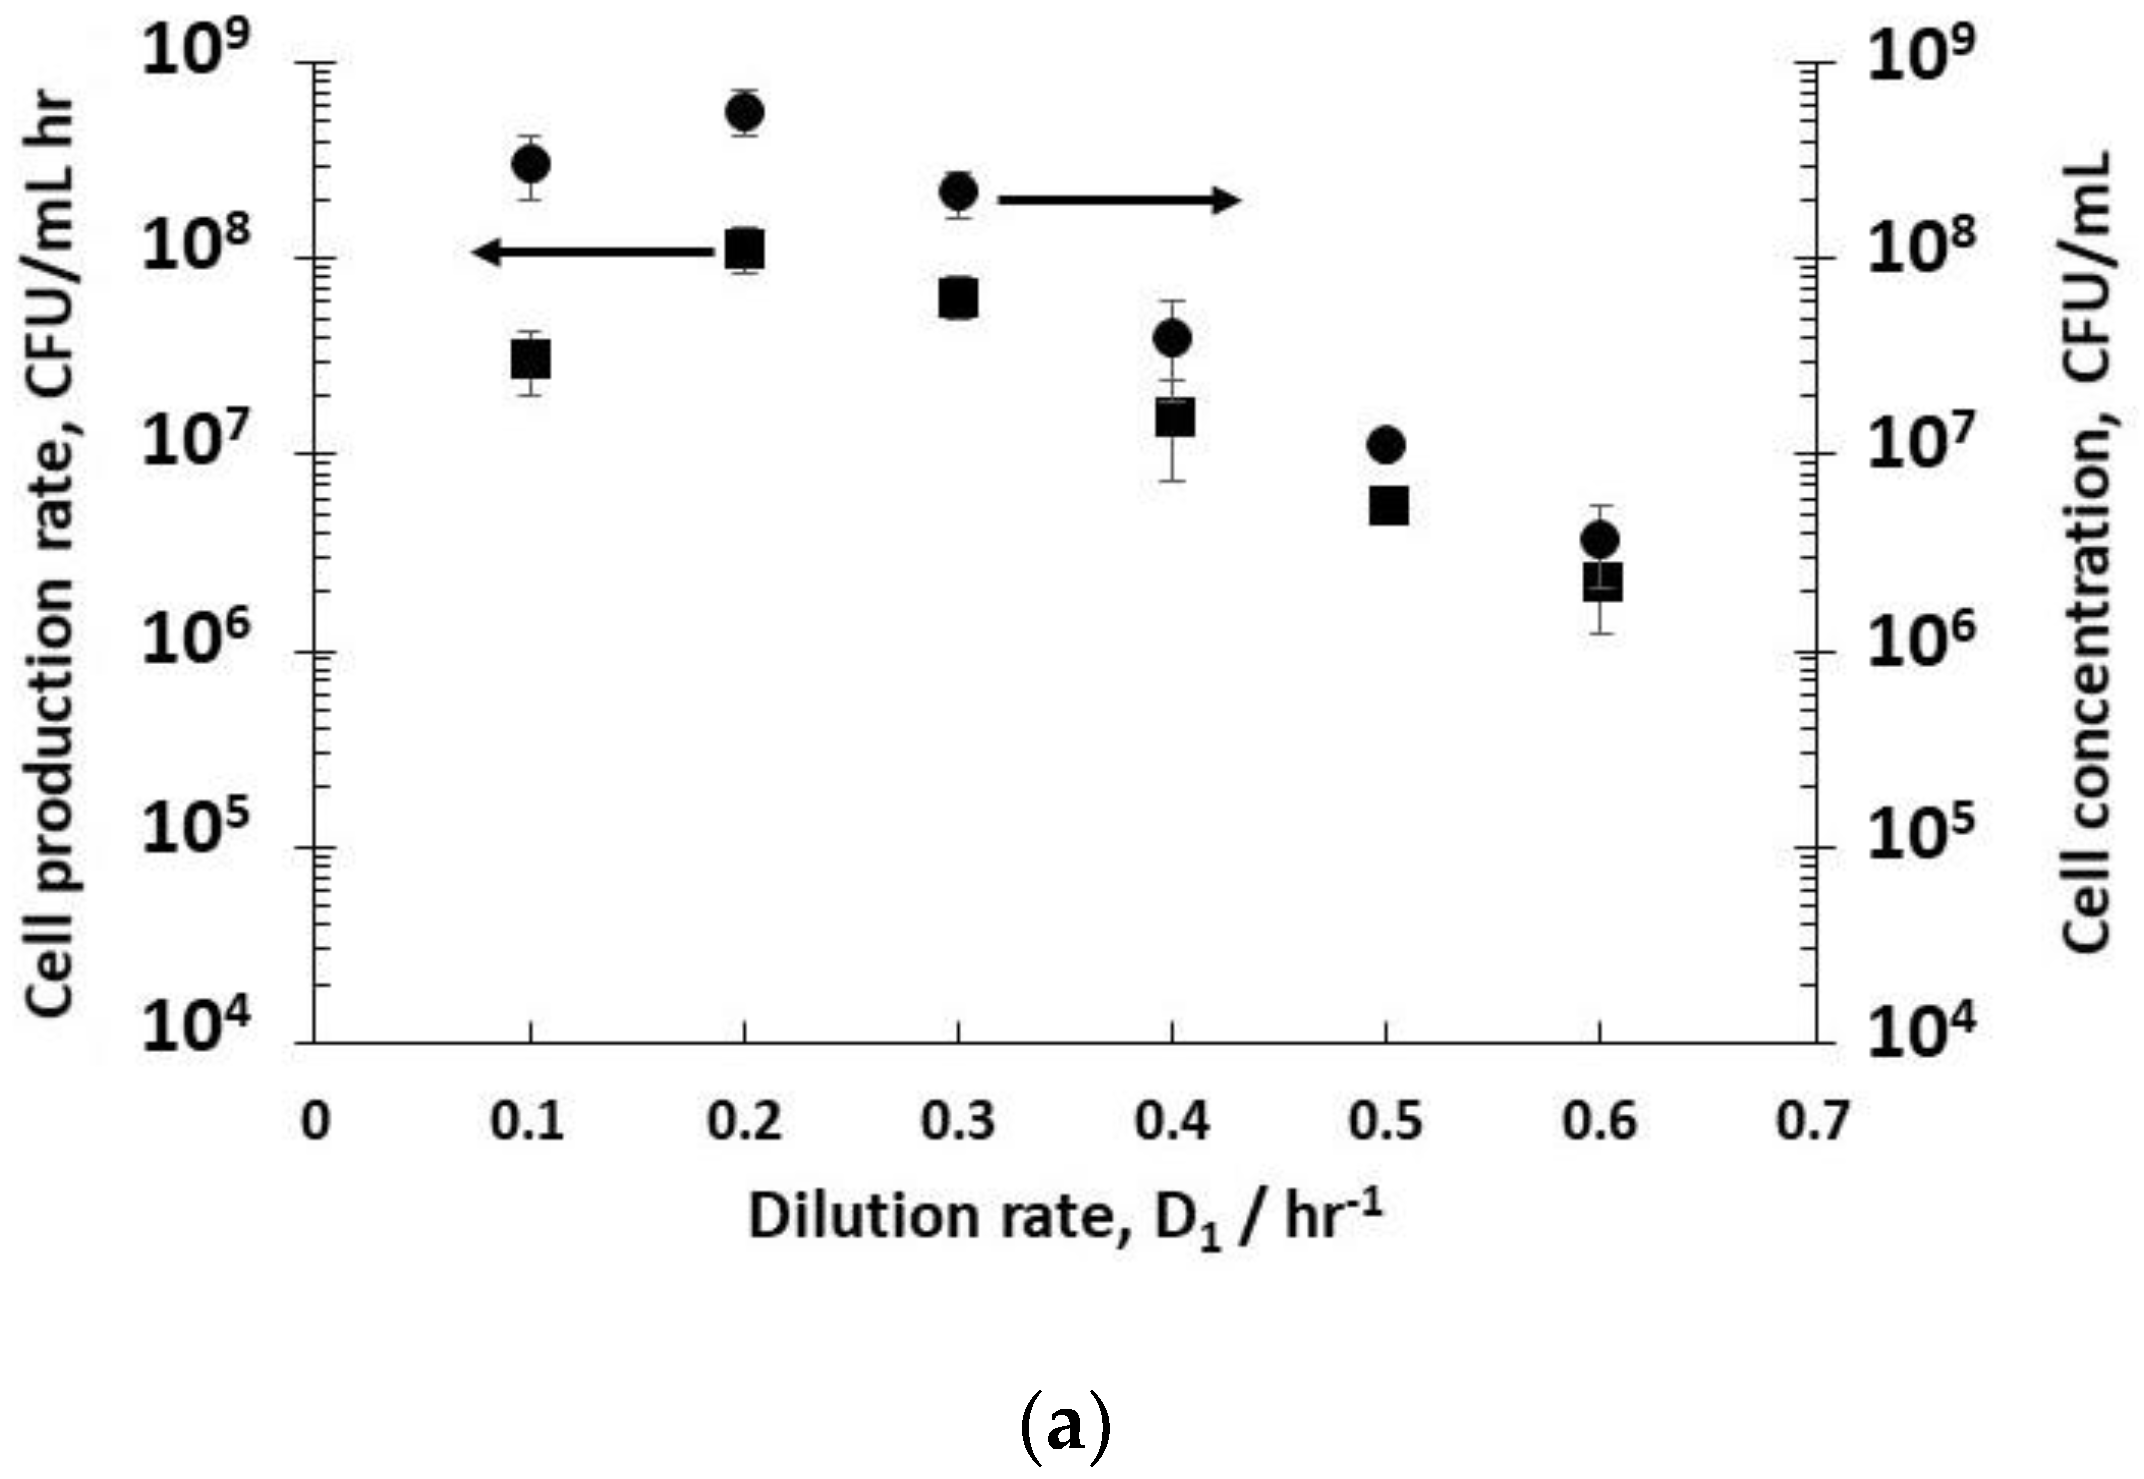
Dilution rates (D
1) from 0.1 hr
−1 (residence time 10 hr) to 0.6 hr
−1 (residence time 1.6 hr) resulted in steady-state concentrations of host bacteria at different stages in their growth phase in reactor R1 (
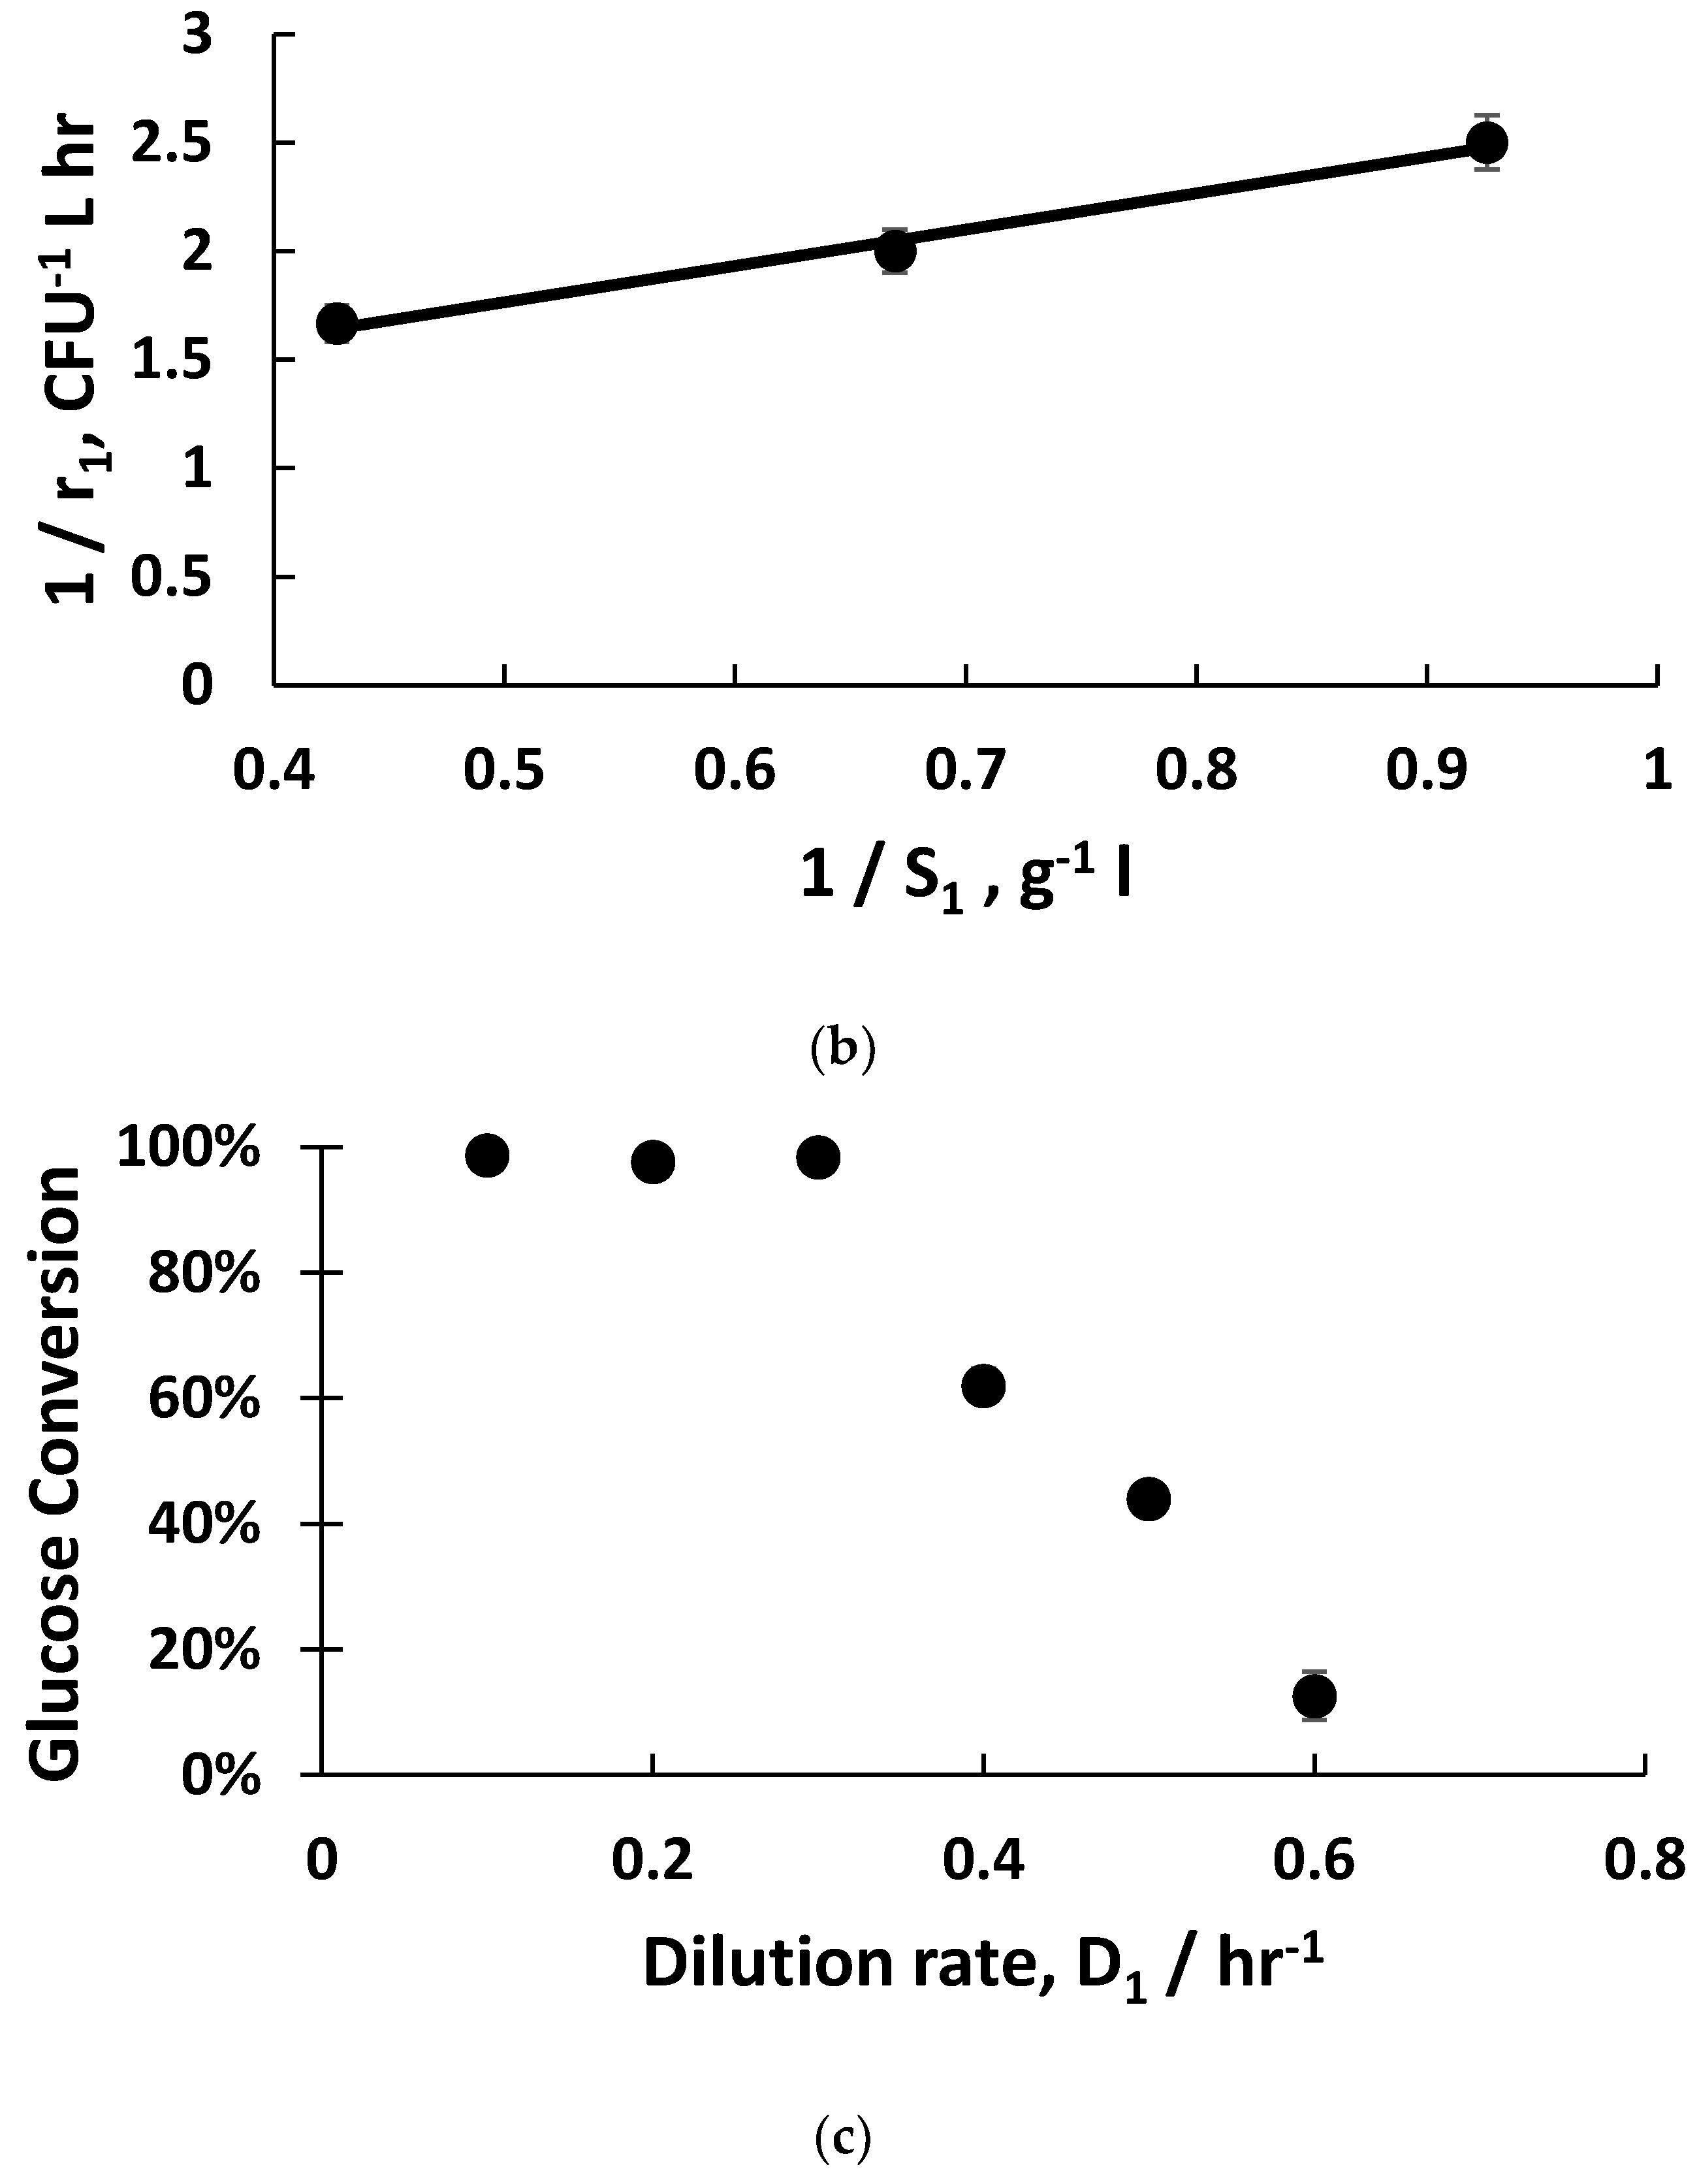
Figure 2a). The fitting of exponential bacterial growth rates employing Monod kinetics (Equation (3)) permitted the estimation of the growth parameters (
Figure 2b) with glucose as the limiting substrate; these values were subsequently used for the mathematical modelling of host bacterial growth kinetics (K
m = 1.5 g L
−1; µ
m = 1 hr
−1). The substrate yield coefficient was also evaluated using these data (Y
S/C = 1 × 10
−10 g glucose consumed CFU
−1). At low dilution rates (between 0.1–0.3 hr
−1), the bacteria were in the late-stage growth phase tending to the stationary phase, and had consumed almost all of the nutrient sugar (
Figure 2c), resulting in high viable host cell numbers (~10
8 CFU mL
−1) leaving reactor R1. Host cell productivity in R1 attained a maximum value of ~1 × 10
8 CFU mL
−1 h
−1 at a dilution rate of 0.2 hr
−1. Increasing the dilution rates to 0.4–0.6 hr
−1 resulted in a much lower sugar consumption (between 13–50% conversion,
Figure 2c), and bacteria in the early to mid- exponential growth phase with cell concentrations falling from ~6 × 10
8 CFU mL
−1 to ~4 × 10
6 CFU mL
−1 (
Figure 2a). At a dilution rate of 0.5 hr
−1, significant residual glucose concentration was detected in the R1 reactor outlet (~ 44% glucose conversion,
Figure 2c), which was indicative of host bacteria in the mid-exponential growth phase.
The effect of varying D
1 (and therefore the cell growth conditions discussed above) on phage titres in R2 was evaluated by keeping the dilution rate D
2 in R2 constant at 4 hr
−1 (i.e., a residence time of 15 min). Although this dilution rate value was quite high, it was below the measured phage washout rate, which occurred at D
2 > 6 hr
−1. Phages T3 were measured to have a relatively short lag time to burst, ~10 min (see
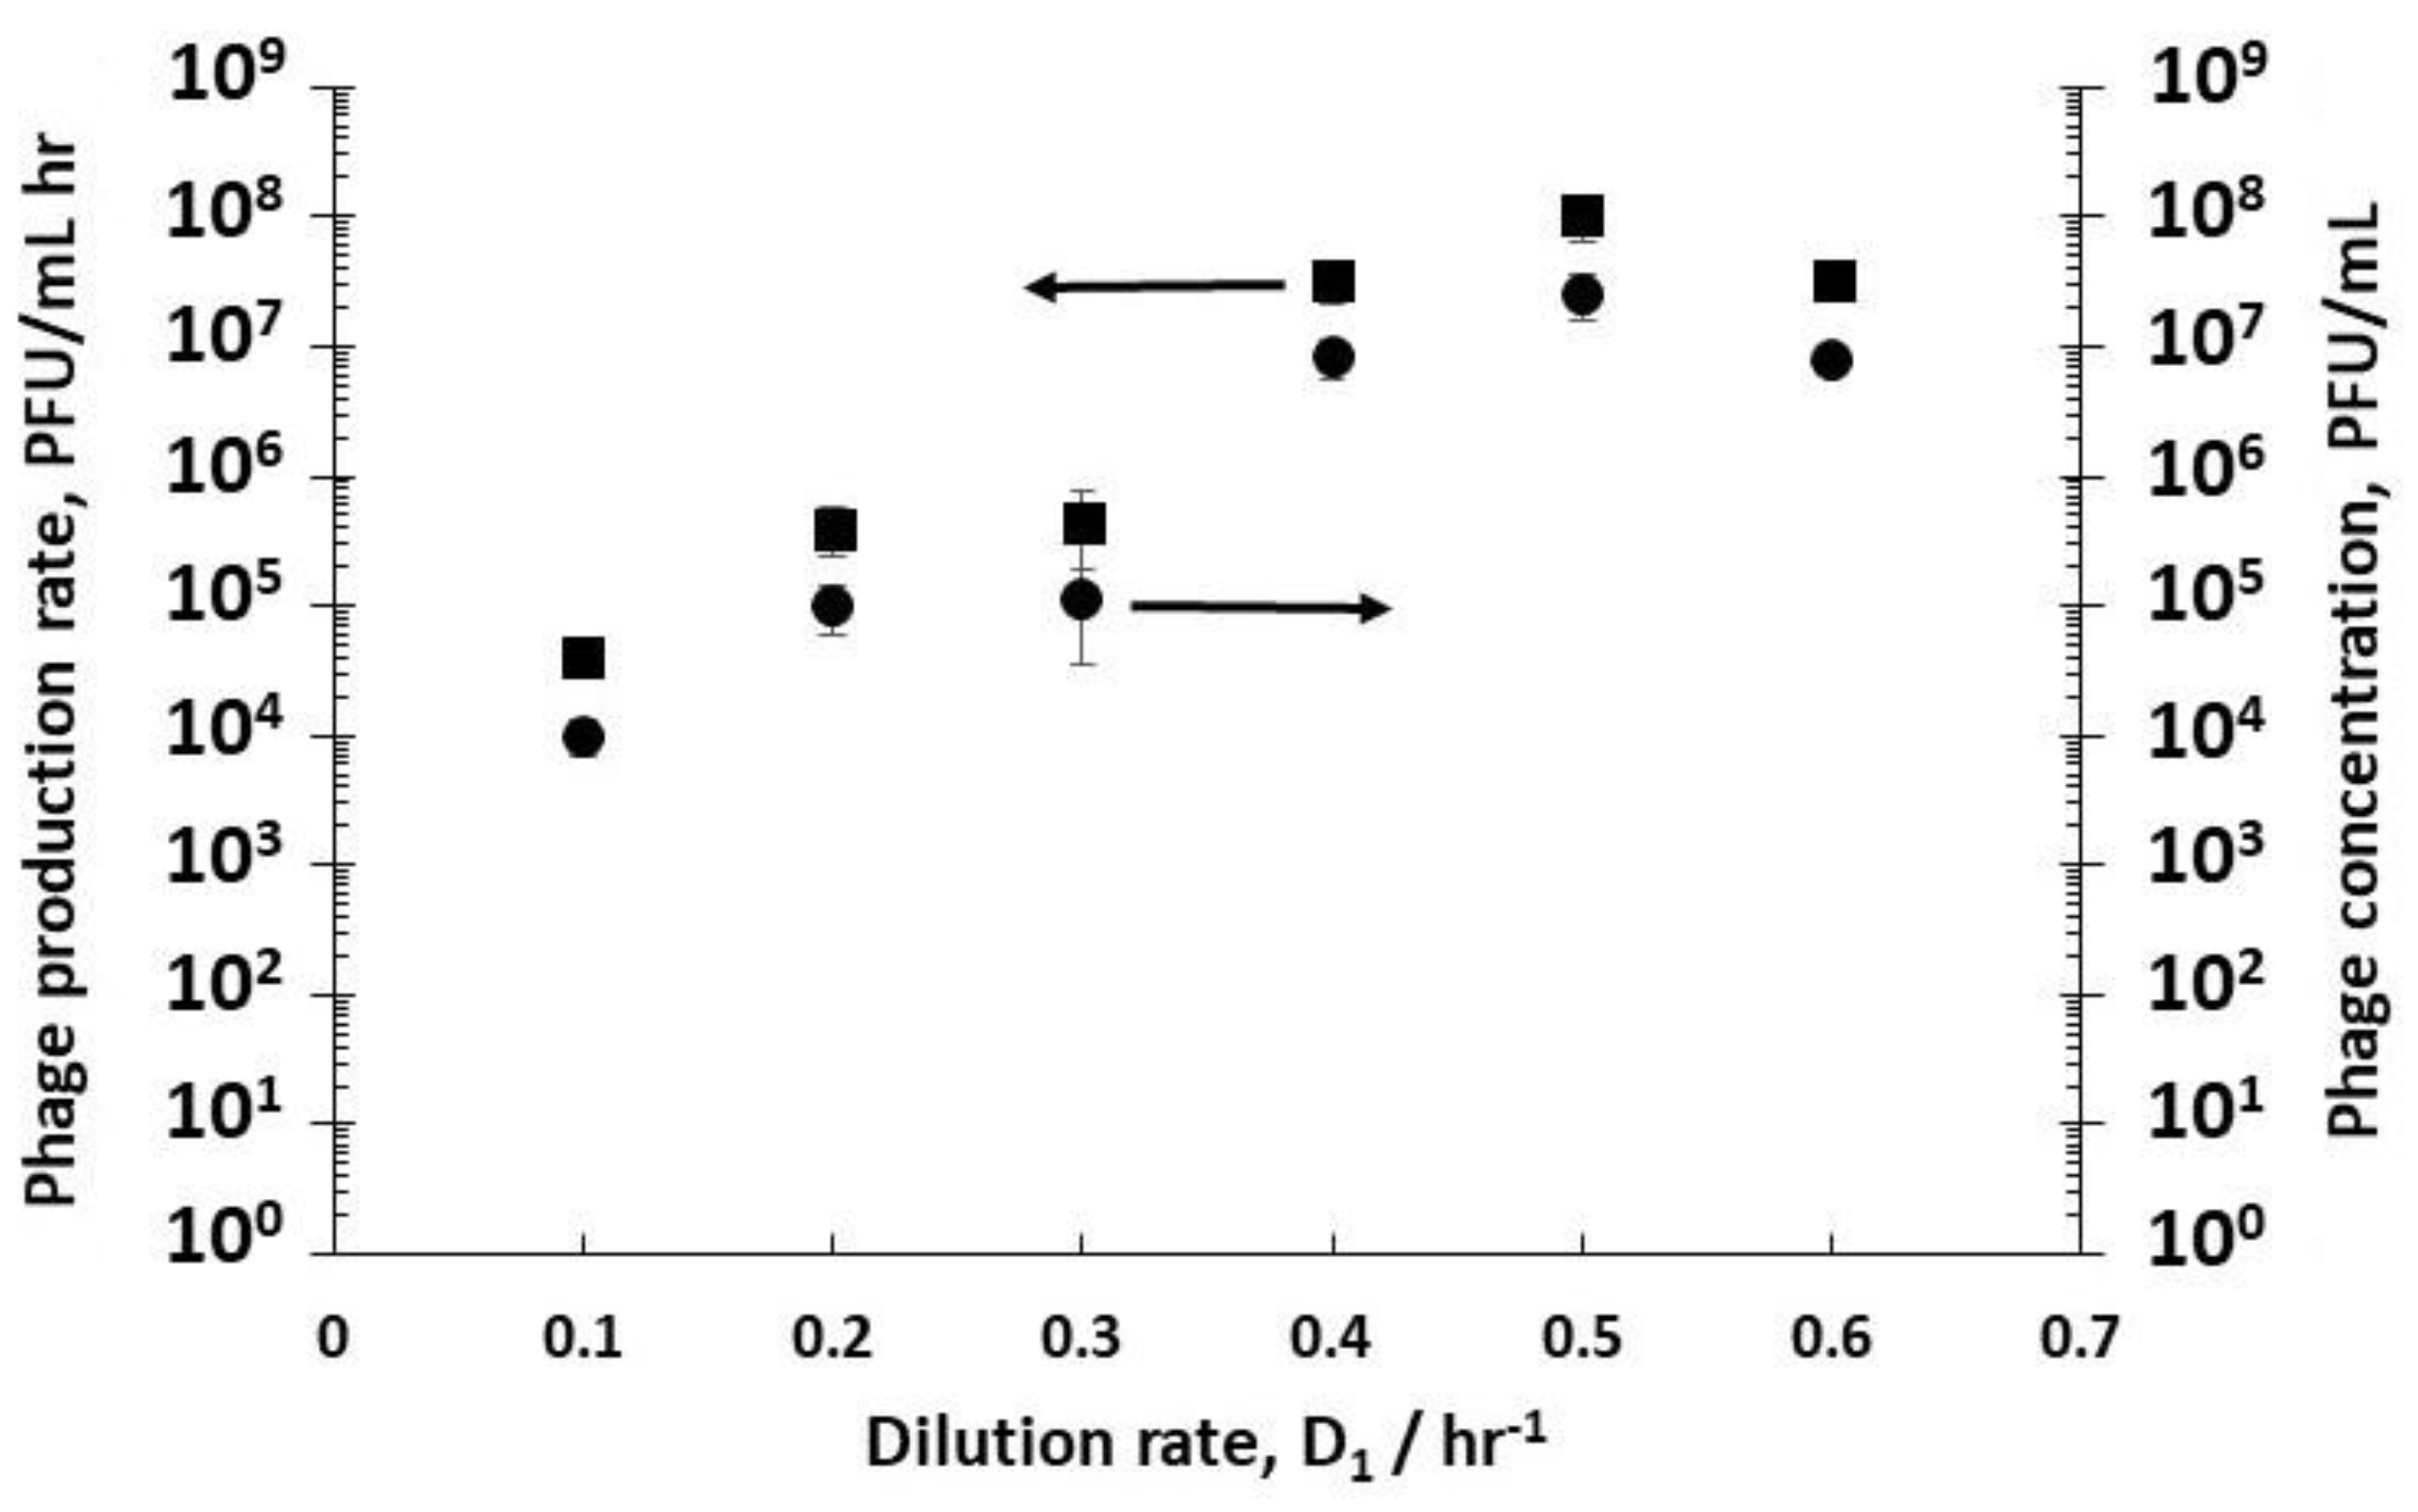
Supplementary Figure S1). Low phage concentrations were measured leaving R2 at low dilution rates e.g., ~1.1 × 10
5 PFU mL
−1 at a dilution rate D
1 of 0.3 hr
−1 (
Figure 3), whereas at dilution rates of 0.4 hr
−1, 0.5 hr
−1, and 0.6 hr
−1, phage titres increased significantly to ~10
7 PFU mL
−1, resulting in considerably higher phage productivity, from ~10
4 PFU mL
−1 h
−1 at a dilution rate of 0.1 hr
−1 to ~10
8 PFU mL
−1 h
−1 at a D
1 value of 0.5 hr
−1 (
Figure 3).
A second set of experiments was performed to study the effect of dilution rate D
2 on phage production using three different fixed R1 dilution rates D
1 (0.4 hr
−1, 0.5 hr
−1, and 0.6 hr
−1); this allowed control over host bacteria growth in the early (D
1 0.6 hr
−1) to mid-logarithmic (D
1 0.4 hr
−1 and 0.5 hr
−1) growth phase to be fed to R2. The D
2 values that were used were subsequently varied with values set at 3 hr
−1, 4 hr
−1, and 6 hr
−1 corresponding to residence times in R2 of 20 min, 15 min, and 10 min, respectively (see
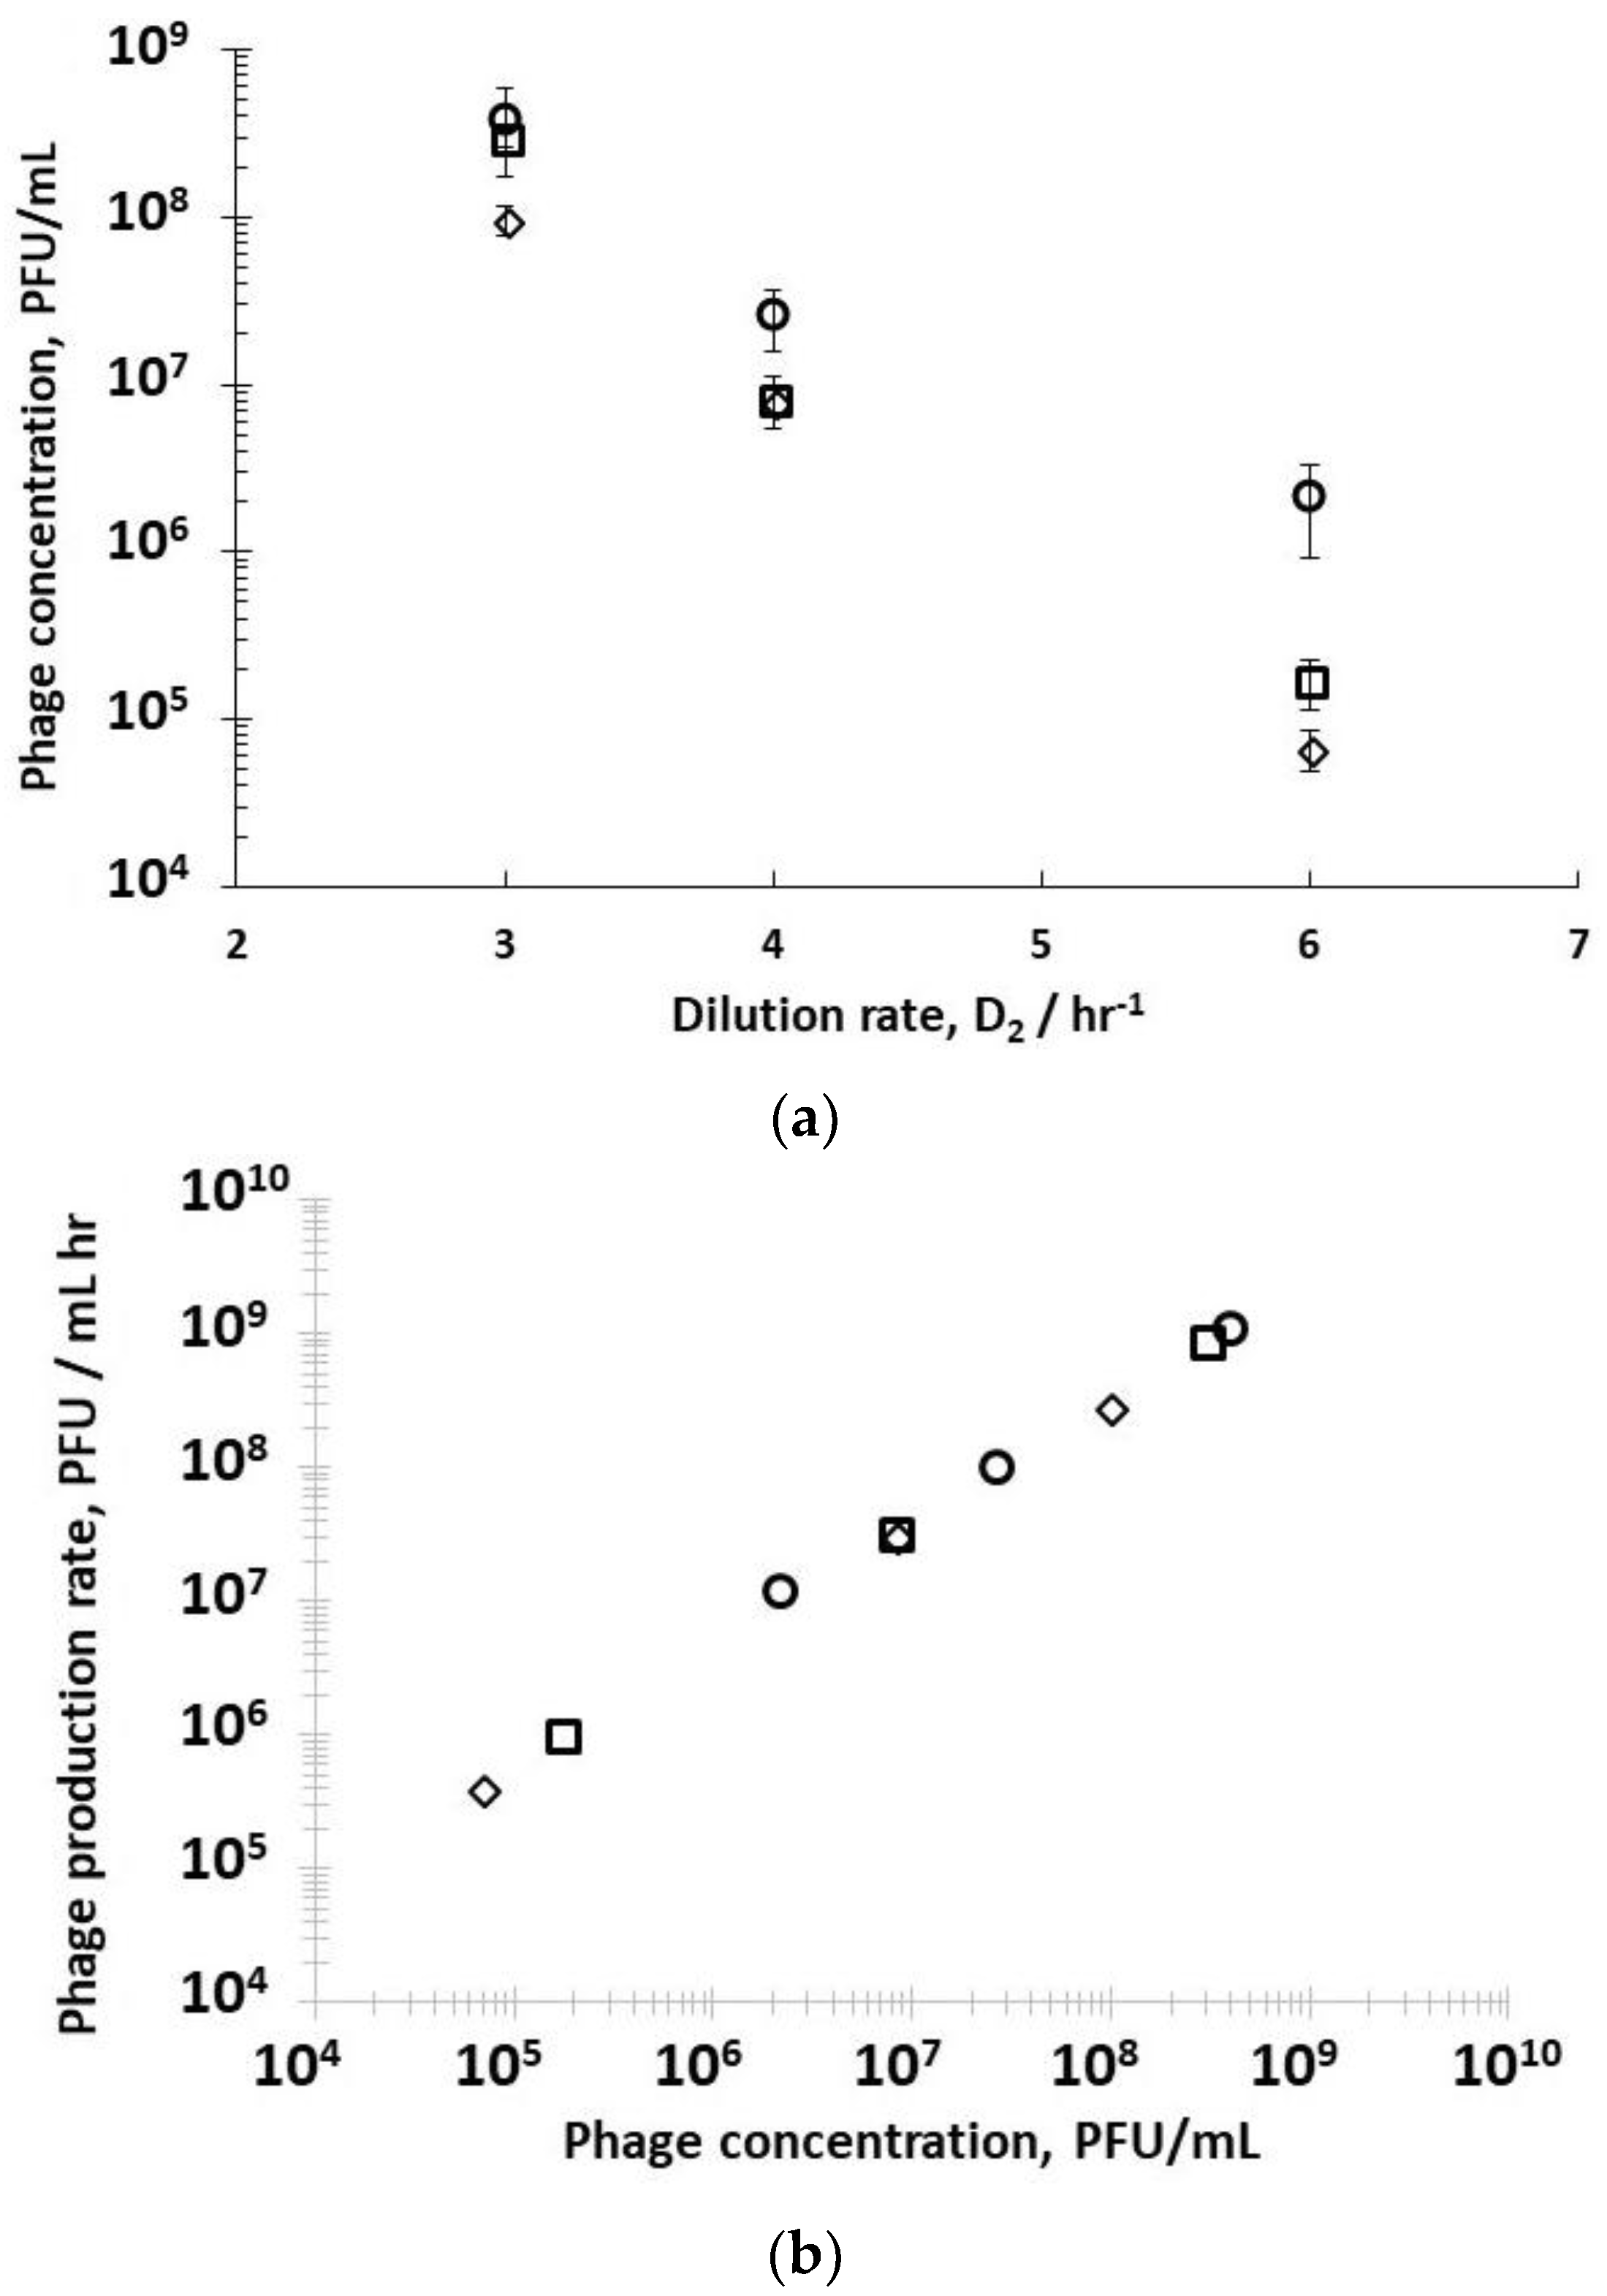
Supplementary Information, Table S2). Decreasing the residence time in R2 resulted in less time for phage amplification, and concomitantly a decrease in the corresponding phage titres exiting R2 (
Figure 4a) under all three set values of R1 dilution rates (D
1 0.4 hr
−1, 0.5 hr
−1, or 0.6 hr
−1). Phage titres were higher for runs where bacteria were in the mid-log growth phase with significant differences observed at the higher dilution rate of D
2 = 6 hr
−1 (
Figure 4a). The phage titre decreased significantly with increasing D
2; however, phages were not washed out, despite the short residence times in R2 of 10 min at D
2 6 hr
−1. At D
2 6 hr
−1, significant differences in phage production rates were measured, depending on bacteria host physiology (
Figure 4a). Phage production rates (P
2 × D
2) that were plotted as a function of phage titres P
2 showed a linear correlation, indicating that phage amplification is consistent with the mass action law.
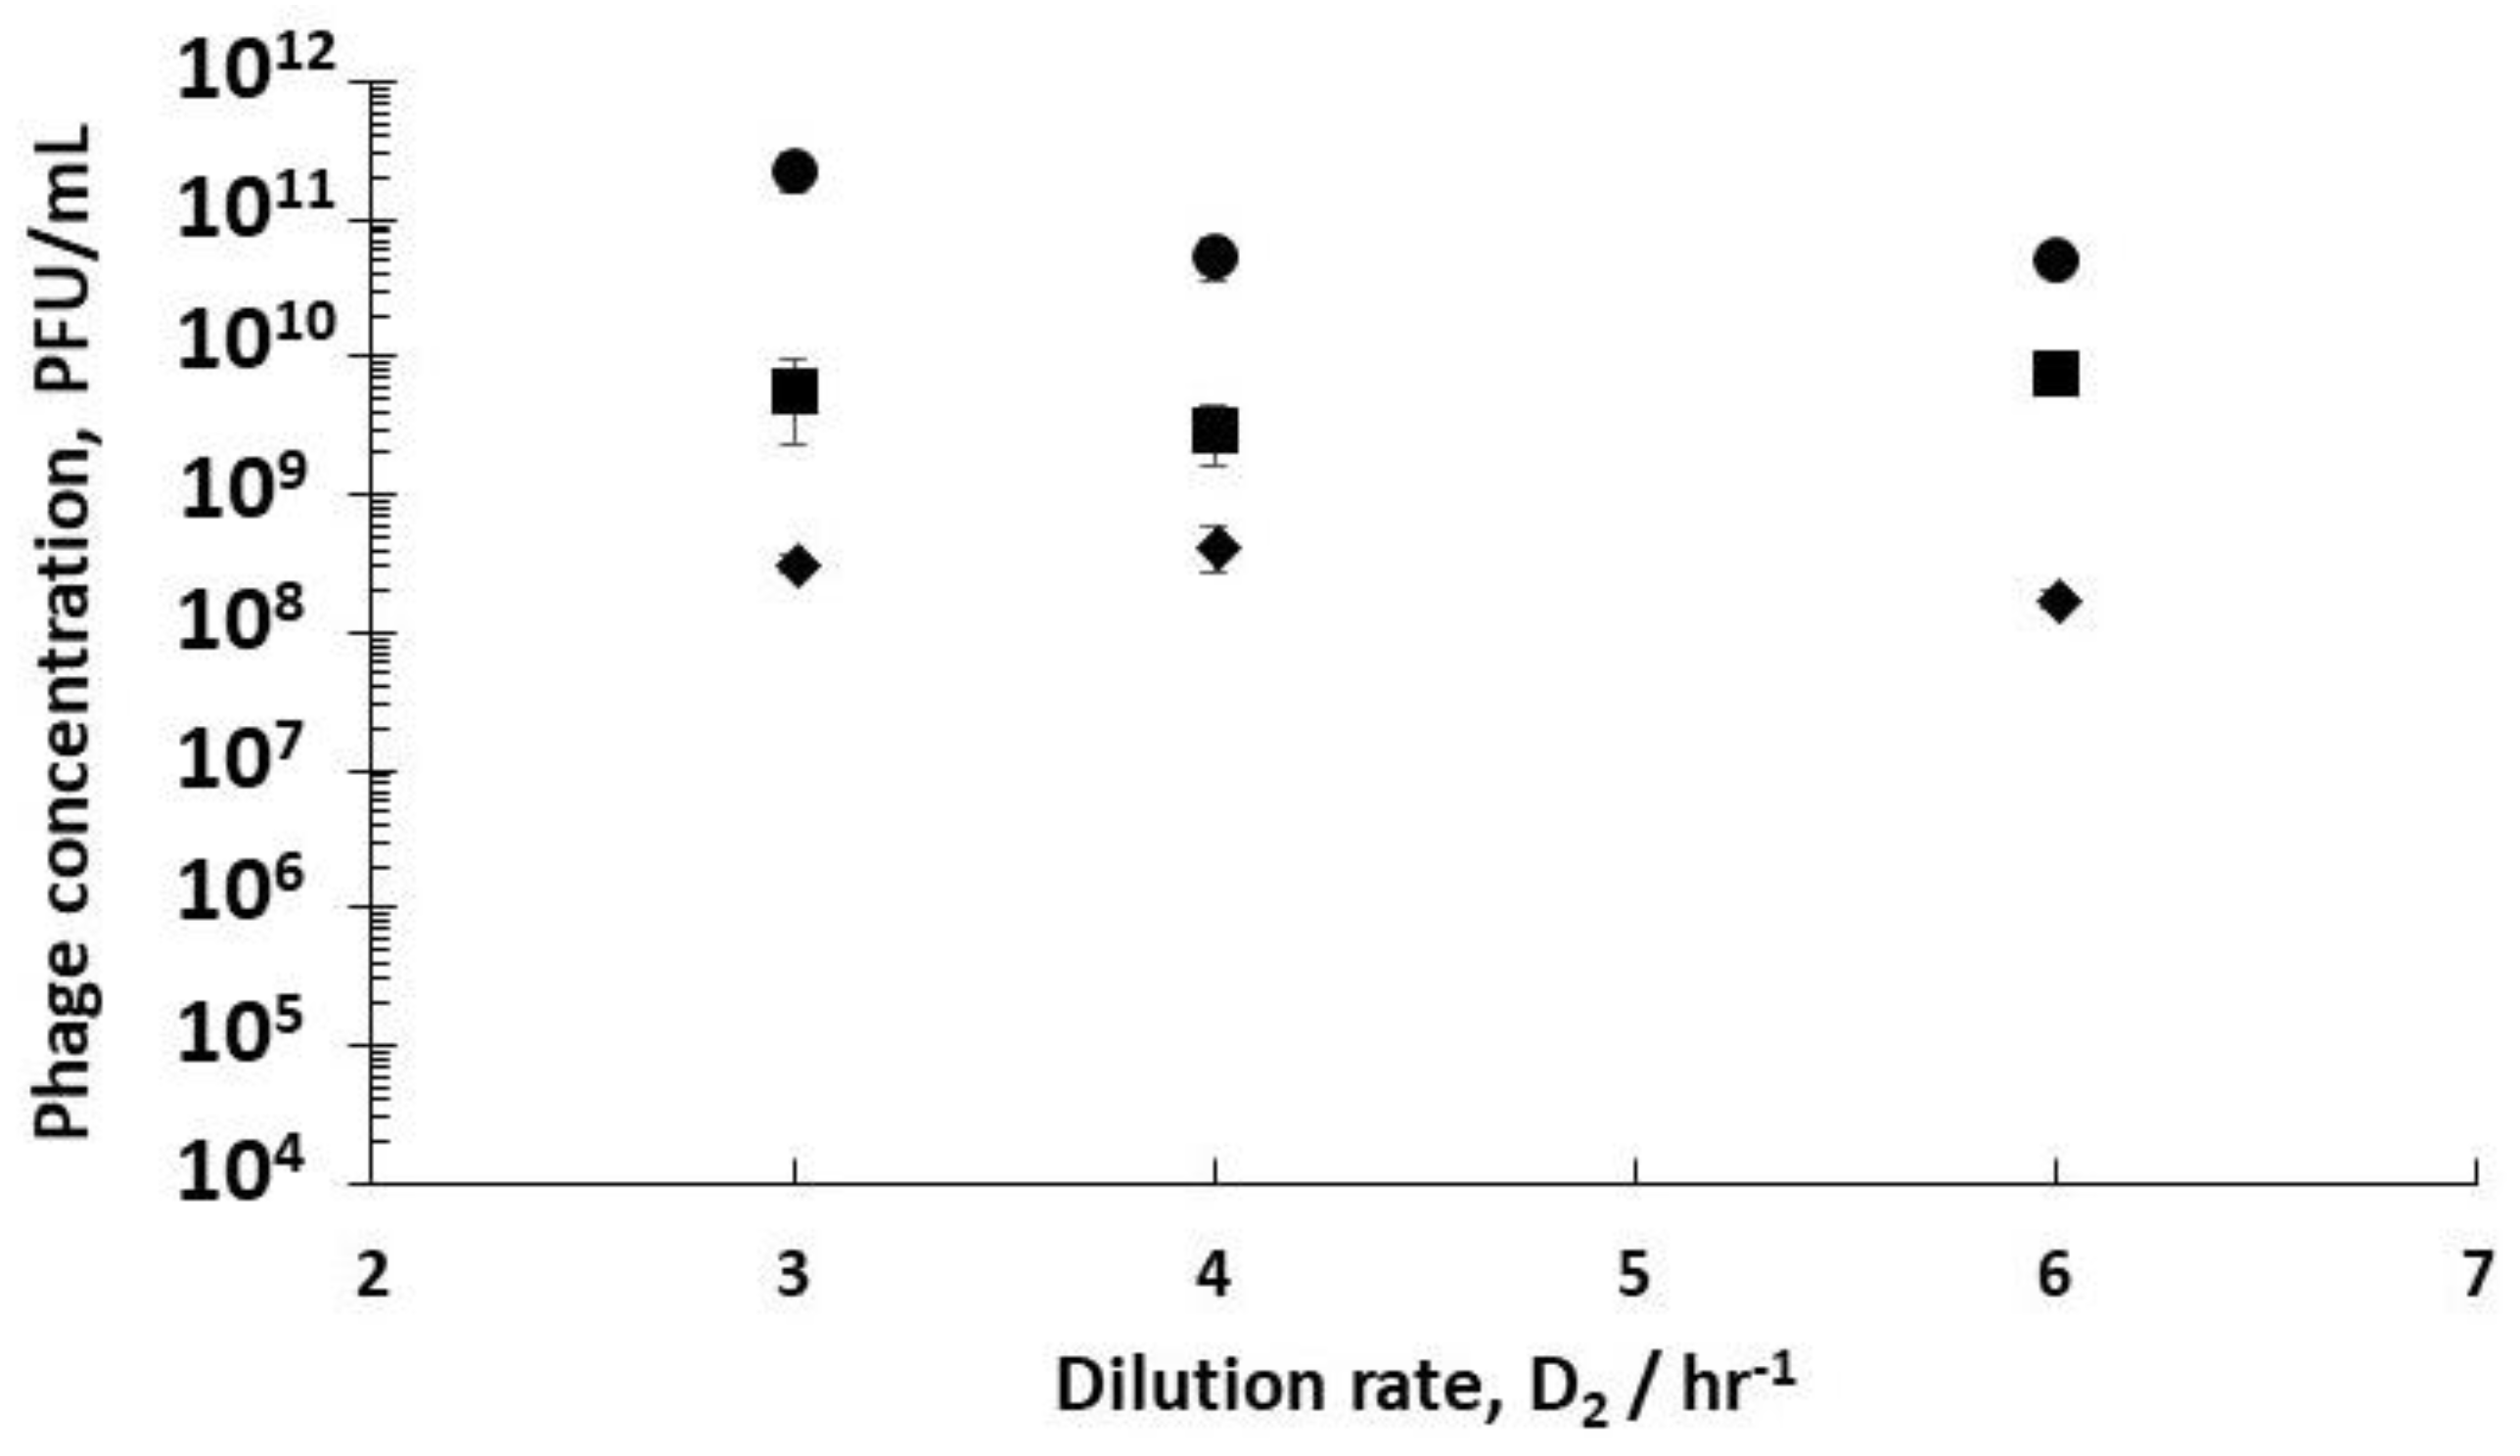
Using stirred tank R3 as a holding tank operated in semi-batch mode allowed control over phage amplification with residence times ~4 hr, found to be more than enough to allow completion of the phage amplification process (see
Supplementary Information, Table S3). Phage titres increased from ~10
8 PFU mL
−1 exiting R2 (D
2 set at 3 hr
−1) to ~6 × 10
9 PFU mL
−1 (D
1 0.4 hr
−1) and ~2 × 10
11 PFU mL
−1 (D
1 0.5 hr
−1) (
Figure 5). Phage titres increased from ~9 × 10
7 PFU mL
−1 exiting R2 (D
2 set at 3 hr
−1) to ~3 × 10
8 PFU mL
−1 (D
1 0.6 hr
−1) (
Figure 5). There was a significant difference in the final R3 phage titres depending on the growth phase of the host bacteria leaving R1, which could be controlled through manipulating D
1.
4. Discussion
Phages can initiate complex mechanisms depending on the physiological state of the host bacteria including lysis inhibition and pseudolysogeny, prolonging the period from infection to lysis, etc. Previous studies have demonstrated that the burst size and latency period are influenced by the host physiological state. Researchers have previously shown that the infection of slow-growing bacteria (e.g., using different media) or bacteria that have spent long residence times due to operation at low dilution rates in a chemostat resulted in a decrease in the burst size and increase in the latency period [
35,
36,
37,
38]. We have shown through using a synthetic medium with glucose as the limiting substrate that controlling the dilution rate in the host propagation reactor resulted in control over the bacterial growth rate, and in turn the physiology of the host bacterial cells (
Figure 2). This allowed optimum infection conditions to be maintained in the phage infection reactor R2 (D
2 0.5 hr
−1), thereby resulting in high titres of phages that could be manufactured in a continuous manner (
Figure 3 and
Figure 4). The experimental system allowed precise control over the residence times of bacterial host cells (in R1) and phages (in R2), allowing a steady-state analysis of phage-bacterium infection dynamics. Keeping a high dilution rate D
2 of 6 hr
−1 i.e., short residence times of around 10 min in R2 (
Figure 4), resulted in clear differences in the phage titres leaving the reactor. This clearly showed the marked effect of the bacterial host physiology on in situ phage production dynamics. R2 was operated at a low multiplicity of infection (MOI) e.g., at the high dilution rate D
2 of 6 hr
−1, the MOI in R2 was between 0.01~0.2, thereby guaranteeing single infections [
36]. Varying D
2 (3 hr
−1, 4 hr
−1, and 6 hr
−1) allowed different MOI values in R2, but the final achieved phage titres in R3 were not found to significantly increase with a reduction in MOI in R2 (
Figure 5). As an example, using D
1 0.5 hr
−1, the MOI varied from ~10 at D
2 3 hr
−1 to ~1 at D
2 4 hr
−1 and ~0.1 at D
2 6 hr
−1. A complicating factor is that at D
2 3 hr
−1, 4 hr
−1, and 6 hr
−1, the outlet phage titres P
2 were 3.8 × 10
8 PFU/mL, 2.7 × 10
7 PFU/mL, and 2 × 10
6 PFU/mL, respectively. The phage amplification kinetics are seen to follow the mass action law (
Figure 4b); hence, at the higher phage titres of 3.8 × 10
8 PFU/mL, phage amplification in R3 was considerably faster and was over in less than one hour (see
Table S3), whereas at D
2 6 hr
−1, the considerably lower phage titres entering R3 meant that the amplification process took significantly longer (~3 hours to complete). The resulting differences in the final phage titres of ~2 × 10
11 PFU/mL at D
2 3 hr
−1 and ~6 × 10
10 PFU/mL at D
2 6 hr
−1 (
p < 0.05 using a two-sample t-test, 95% confidence interval for the difference in means was 1.3 × 10
11–2.1 × 10
11 PFU/mL) may potentially be attributed to the host bacteria physiology changing in R3 over the 3-hr period that was needed to complete phage amplification. This point requires further investigation in the future.
Comparing phage titres for R1 dilution rates of 0.4 hr
−1, 0.5 hr
−1, and 0.6 hr
−1 on phage production rates in R2 operating at a dilution rate D
2 of 6 hr
−1 (
Figure 4) showed an increase in phage titres from 6.8 × 10
4 PFU/mL (D
1 0.6 hr
−1) to 1.7 × 10
5 PFU/mL (D
1 0.4 hr
−1) and the highest value at 2.1 × 10
6 PFU/mL operating R1 at the optimum dilution rate D
1 of 0.5 hr
−1. This corresponds to phage productivity values of 4.1 × 10
5 PFU/mL. hr (D
1 0.6 hr
−1), 1 × 10
6 PFU/mL. hr (D
1 0.4 hr
−1), and 1.3 × 10
7 PFU/mL. hr (D
1 0.5 hr
−1), which were indicative of the different phage amplification rates. It has previously been shown that the rate of phage release increases with the increasing bacterial growth rate due to higher rates of synthesis and the assembly of phage components, and this is dependent on the content of the protein-synthesizing system. This manifests through a reduction in the latency period and an increase in the phage burst size [
35]. The chemostat system that was used here (reactors R1 and R2 operating in series) is a versatile tool allowing control over the host physiology by controlling the dilution rate and thereby the host cell characteristics, including the size, age, rates of metabolism, chromosome replication, and time of lysis. Cells growing in richer media have been shown to have shorter doubling times. The corresponding rates of phage adsorption have been shown to increase substantially in such cases in comparison with the same strain grown in restricted media, in which the rates of phage development and phage lysis are dependent on the host bacteria growth rates, and an order of magnitude difference in burst sizes was reported [
35].
In this study, we used a completely synthetic medium with glucose as the only sugar source as the limiting substrate. Previous studies using chemostats to investigate the effect of host physiology have used complex ill-defined media where it was unclear which limiting factor affected the host organism growth rate, and therefore influenced the parameters affecting phage amplification [
39]. Using the value of the maximum specific growth rate (µ
m = 1 hr
−1) results in a doubling time of ~42 min. Hence, using D
1 values of 0.4 hr
−1, 0.5 hr
−1, and 0.6 hr
−1 yields ~3.5, ~2.9, and ~2.4 cell divisions, respectively, for the three cases. Different dilution rates may result in considerably different age distributions of the host cells in the reactor. The chemostat provides a means to obtaining steady-state cultures with a synchronized narrow distribution of cell ages, and may therefore allow tuning of the age distribution of cells undergoing cell division. Cells that might be more mature and nearing division (e.g., for the case D
1 0.5 hr
−1) have previously been shown to yield higher burst sizes and showed shorter lag times, and this was shown to correlate with the availability of intracellular resources [
40]. The infection of mature cells closer to cell division that contain nucleic acid precursors and translational machinery for efficient phage assembly may yield higher phage burst sizes and shorter lag times, thereby resulting in a significant increase in the phage productivity that was observed in the present study [
37]. Mature cells that are closer to cell division harbour higher levels of ribosomes, polymerases, and other molecules that are necessary for the transcription of early, middle, and late-stage phage proteins [
41]. The expression levels of the early transcripts that are necessary for lytic phage development have been shown to be affected in minimal media as a host response to physiological conditions [
42].
In a previous study using
E. coli T4 phages and dilution rates between 0.033–0.3 hr
−1, considerable differences in burst sizes were observed ranging between 1–15, and lag times decreasing from 3 hr to ~1 hr with increasing dilution rates [
38]. The study employed minimal media with a high inlet concentration of glucose (10 g L
−1) as the only sugar source. However, the range of dilution rates was considerably lower in comparison to those used in the present study, and no measurements of sugar concentration in the reactor were reported in the paper. Given the long residence times in the reactor, the host bacteria were in the late exponential growth to almost the stationary phase. In the present study, the dilution rates in the host bioreactor were between 0.4–0.6 hr
−1, and the host bacteria were in the early to mid-exponential growth phase, with considerably shorter doubling times around ~40 min compared with 21 hr. Monod kinetics fitted the experimental data well (µ
m = 1 hr
−1 and K
m = 1.5 g L
−1), which allowed an estimation of the host bacteria growth rates (
Figure 2b). The glucose substrate consumption rates were three-fold higher when the dilution rates were 0.5 hr
−1 and 0.6 hr
−1 compared with the glucose consumption rate at 0.4 hr
−1. This indicates higher metabolic rates for the host bacteria in the early to mid-growth stages such as those growing at the dilution rate of 0.5 hr
−1.
E coli T7 phages grown in a chemostat using rich LB medium and high dilution rates in excess of 1 hr
−1 resulted in the burst size (b ~ 60) almost doubling in comparison with measured burst size values of ~30 at a dilution rate of 0.5 hr
−1 [
37]. The authors of this paper not only evaluated the effect of dilution rates on burst size, but also the time required by the host cell to produce the first phage progeny (eclipse time) and the intracellular rate of phage progeny production (rise rate), and showed that an increase in the rise rate correlated with the bacterial host growth rate [
37].
Investigation was undertaken as to whether the lag times, burst sizes, and phage adsorption rates were indeed different for host cells under steady-state conditions for D
1 0.4 hr
−1, 0.5 hr
−1, and 0.6 hr
−1. The experimentally measured phage adsorption binding rates and lag times were not found to be significantly different for the three dilution rates (see
Supplementary Information, Figure S2). The burst sizes were significantly different for the three dilution rates, with average burst sizes varying from ~10 for 0.6 hr
−1, ~20 for 0.4 hr
−1, and as high as ~40 for the host cells that were subjected to the dilution rate of 0.5 hr
−1 (see
Supplementary Information, Figure S1). Hence, the faster growth of host cells that may be nearing cell division did seem to support increased phage productivity, as observed in our results (
Figure 4).
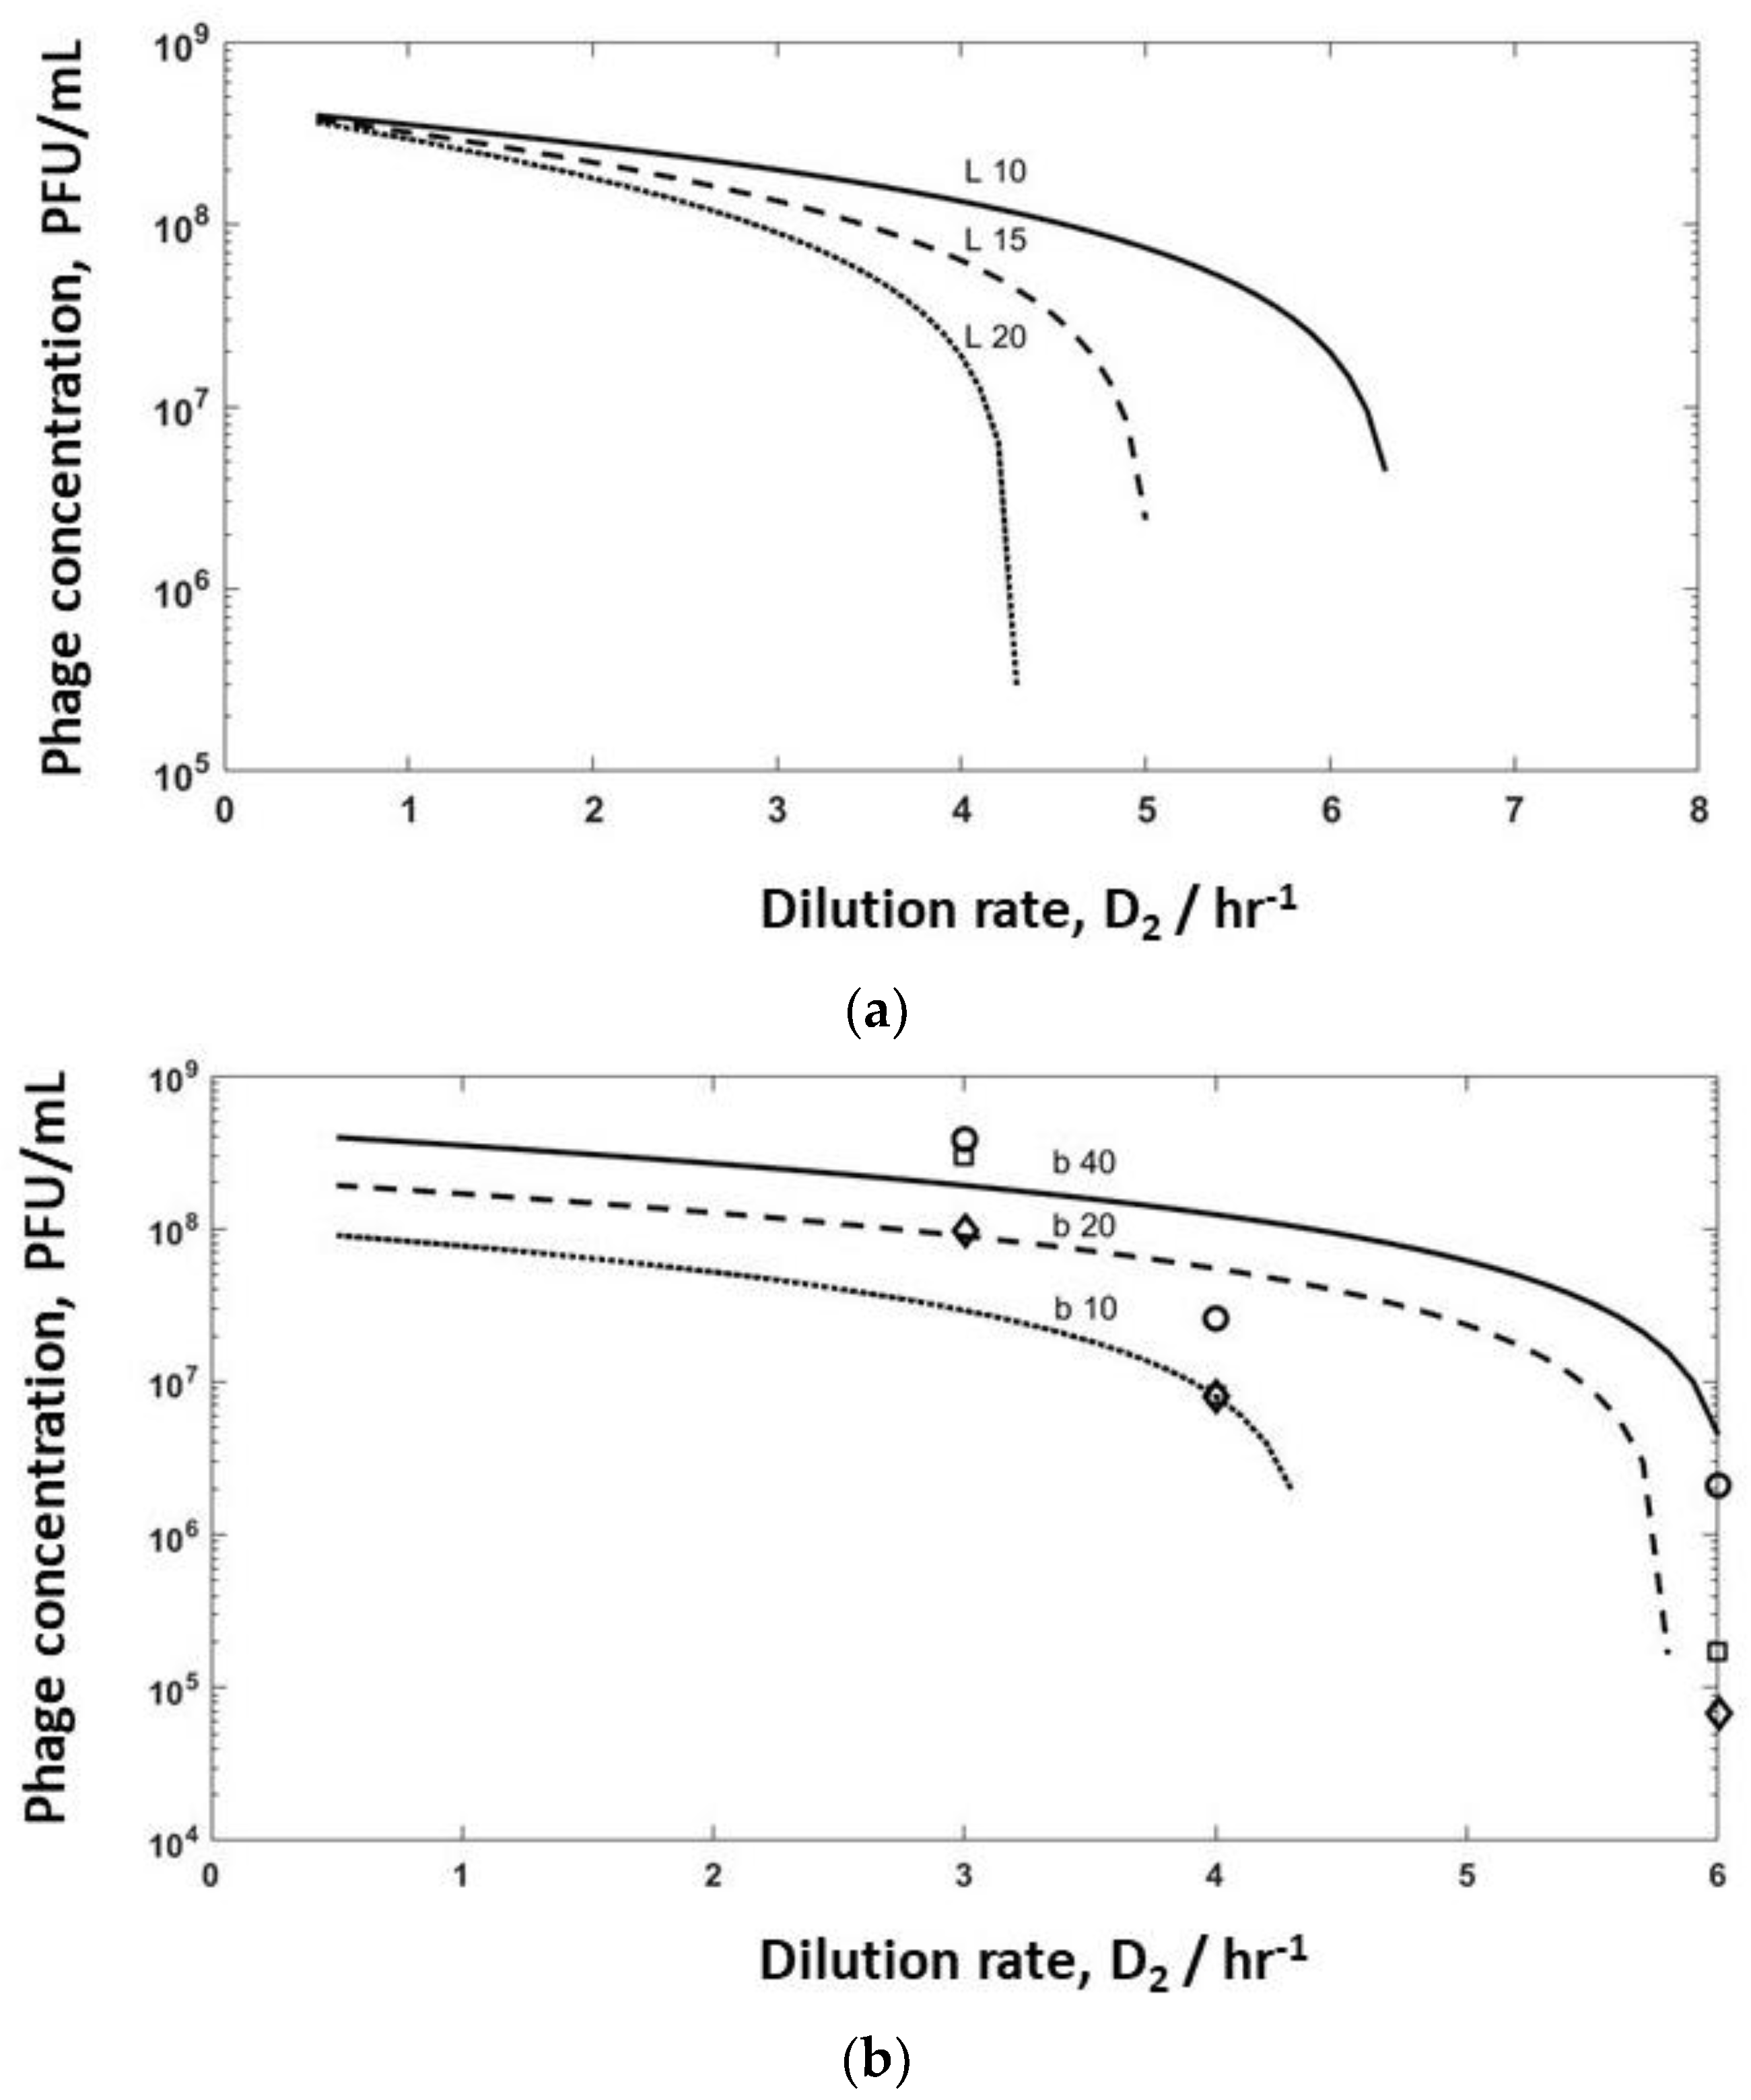
Model simulations were undertaken for bioreactor R2 to evaluate the effect of varying burst sizes (b varied in the range of 10–40, and lag times varied between 10–20 min) to identify washout conditions on phage production (
Figure 6). Increasing the lag time from 10 min to 15 min had a significant effect on phage titres leaving R2, with washout occurring if the lag time was increased to 20 min (
Figure 6a) at high dilution rates of D
2 ~6 hr
−1. At low dilution rates, the phage titres converged, and the effect of the differences in lag times was less pronounced. Equating r
2 = D
2P
2 = δbC
2P
2 allowed the in situ determination of the adsorption rates at dilution rates of D
1 0.4 hr
−1 (δ = 1 × 10
−11 L hr
−1), D
1 0.5 hr
−1 (δ = 3.6 × 10
−11 L hr
−1), and D
1 0.6 hr
−1 (δ = 9 × 10
−11 L hr
−1), respectively. Using these adsorption rates and a lag time of 10 min, burst size was varied (b = 10, 20, and 40) when using the mathematical model describing the dynamics of R2 (Equation (9)). Experimental data (
Figure 4a) have been overlayed on the same plot (
Figure 6b). The simulation results show a similar trend to the experimental data, with small variations in burst size and adsorption rates having a significant impact on the predicted values of the phage titres in R2 and phage washout as a function of the dilution rate D
2 (
Figure 6b). It is unclear at present why the
in situ fitted adsorption rate values were significantly lower than those that were measured experimentally (
Figure S2).
Using experimental inlet conditions for the different dilution rate combinations of D
1 and D
2 that were evaluated in the study, simulations for R3 were carried out by numerically solving Equations (10)–(12). The model predictions were considerably lower in comparison with experimentally measured phage titres in R3 (see
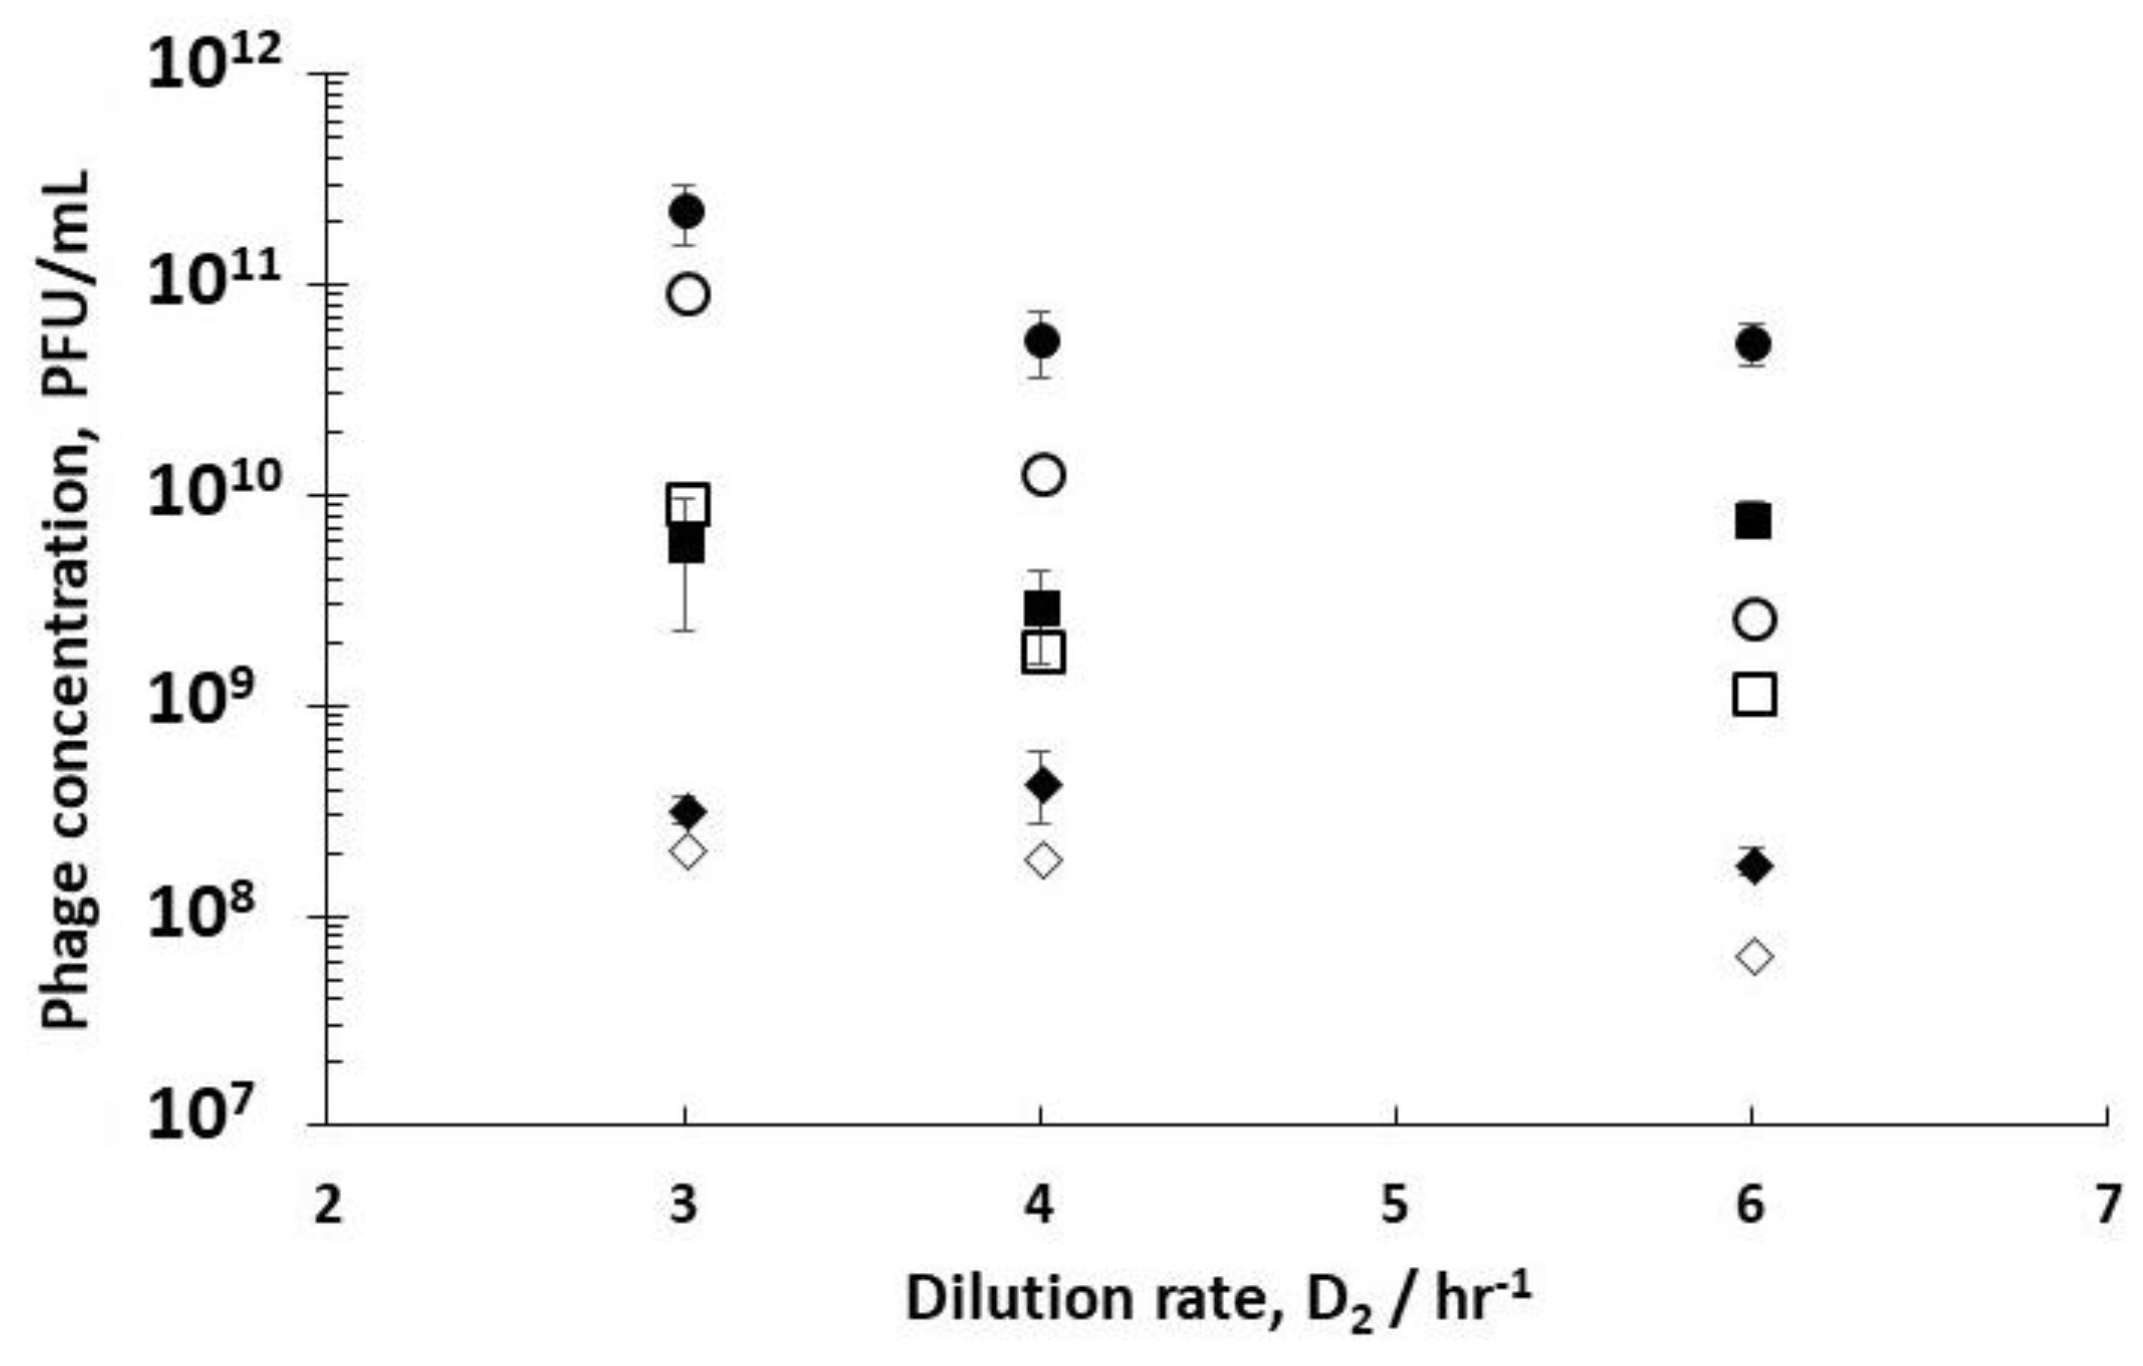
Supplementary Information, Figure S3) when the experimentally measured burst sizes (10–40), lag times (~10 min), and adsorption rates were used. Better correspondence between the experimental data and results of numerical simulations could be achieved by varying the values of the burst sizes and lag times (
Figure 7). Simulation results were closer to experimental data at lower dilution rates of D
2 3 hr
−1 compared with the results at D
2 6 hr
−1, which suggests that model parameters may need to be varied depending on the dynamics of the unsteady process in R3. Phage amplification in R3 was rapid (phage amplification was complete within an hour with no significant change in sugar concentration) at D
2 3 hr
−1, whereas it took around two hours at D
2 6 hr
−1, and the sugar concentration in the reactor changed substantially in this period (see
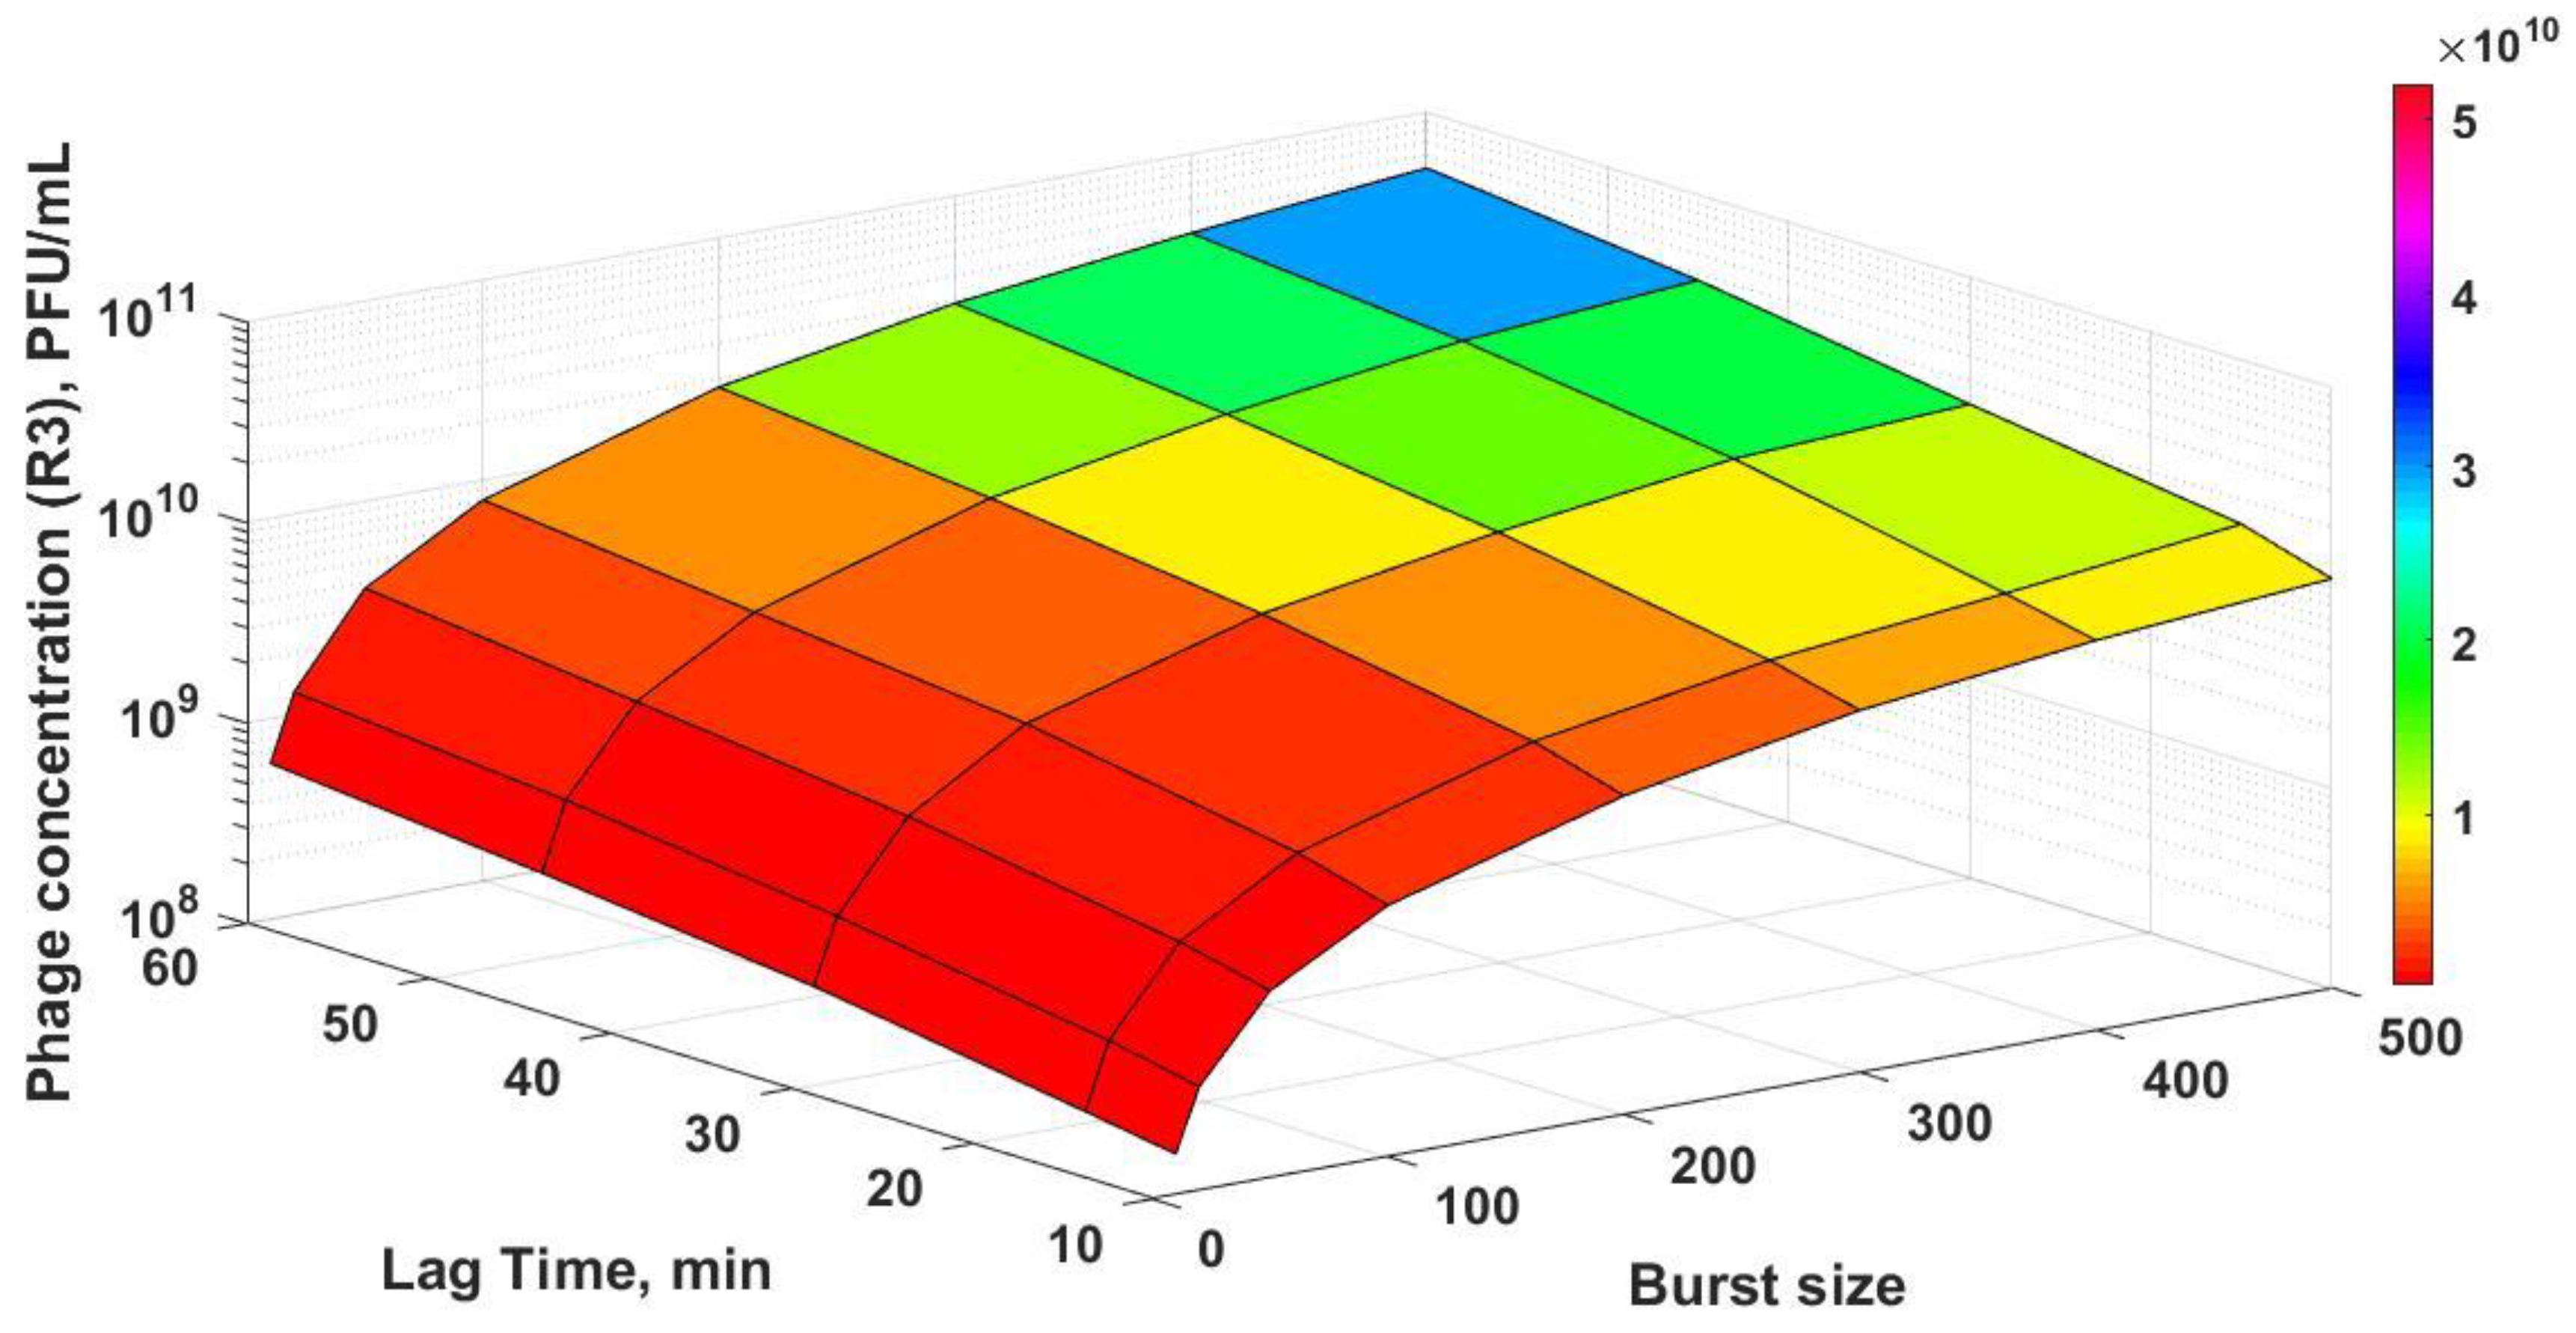
Supplementary Information, Table S3). Plotting the simulation results as a surface plot (
Figure 8) shows how the final phage titres in R3 are affected as a function of both the burst size and lag times, with final phage titres increasing with both burst size and lag times. In the unsteady-state of semi-batch reactor R3, the host cell physiology and therefore the phage infection parameters that were evaluated in R2 may not remain the same if amplification occurs over several hours post-R2 (e.g., the sugar concentration in R3 was found to vary over time, which would affect the host bacteria growth rates and phage production). This may explain the discrepancies between the results of the numerical simulations and the experimental data. R2 was operated under controlled steady-state conditions; therefore, the parameters that were evaluated were carefully controlled. However, this was not the case in reactor R3. Although it was not the focus of the present study, future experimental work needs to be carried out in order to investigate the phage–bacterium dynamics for reactor R3 through undertaking dynamic simulations and incorporating the effects of variable infection parameters as a function of the bacterial growth rate. This would allow a more systematic optimization of Reactor 3 for the process outlined here [
30].
