Article

Recovery of Functional Diversity Following Shifting Cultivation in Tropical Monsoon Forests

1
College of Resources, Environment and Earth Science, Yunnan University, Kunming 650091, China
2
Key Laboratory of Forest Ecology and Environment, The State Forestry Administration, Institute of Forest Ecology, Environment and Protection, Chinese Academy of Forestry, Beijing 100091, China
3
Co-Innovation Center for Sustainable Forestry in Southern China, Nanjing Forestry University, Nanjing 210037, China
*
Author to whom correspondence should be addressed.
The authors contributed equally to this study.
Forests 2018, 9(9), 506; https://doi.org/10.3390/f9090506
Submission received: 8 June 2018 / Revised: 8 August 2018 / Accepted: 18 August 2018 / Published: 22 August 2018
(This article belongs to the Special Issue Wood Science and Tropical Forest Ecology)

Abstract

:
The relationship between biodiversity and ecosystem functioning is an important issue in ecology. Plant functional traits and their diversity are key determinants of ecosystem function in changing environments. Understanding the successional dynamics of functional features in forest ecosystems is a first step to their sustainable management. In this study, we tested the changes in functional community composition with succession in tropical monsoon forests in Xishuangbanna, China. We sampled 33 plots at three successional stages—~40-year-old secondary forests, ~60-year-old secondary forests, and old growth forests—following the abandonment of the shifting cultivation land. Community-level functional traits were calculated based on measurements of nine functional traits for 135 woody plant species. The results show that the community structures and species composition of the old-growth forests were significantly different to those of the secondary stands. The species diversity, including species richness (S), the Shannon–Weaver index (H), and Pielou’s evenness (J), significantly increased during the recovery process after shifting cultivation. The seven studied leaf functional traits (deciduousness, specific leaf area, leaf dry matter content, leaf nitrogen content, leaf phosphorus content, leaf potassium content and leaf carbon content) changed from conservative to acquisitive syndromes during the recovery process, whereas wood density showed the opposite pattern, and seed mass showed no significant change, suggesting that leaf traits are more sensitive to environmental changes than wood or seed traits. The functional richness increased during the recovery process, whereas the functional evenness and divergence had the highest values in the 60-year-old secondary communities. Soil nutrients significantly influenced functional traits, but their effects on functional diversity were less obvious during the secondary succession after shifting cultivation. Our study indicates that the recovery of tropical monsoon forests is rather slow; secondary stands recover far less than the old growth stands in terms of community structure and species and functional diversity, even after about half a century of recovery, highlighting the importance of the conservation of old growth tropical monsoon forest ecosystems.

1. Introduction

Secondary succession following major disturbance is a process of community reassembly. Community assembly is defined as the interaction of species from a regional pool during colonization to form local communities which are controlled by ecological filers [1,2,3]. Understanding and predicting the ecological filters that control community assembly has been a significant question in ecology. The environmental filters that are directly associated with species distribution and the local dynamics of successional processes in tropical forests mainly include soil nutrients, canopy openness, temperature, seasonality, and rainfall [4,5,6], but these filters show different proportions of importance during succession. Species replacement in tropical forests can be explained by the species’ adaptation to changing environments during secondary succession [4], and their adaptation abilities are mainly determined by plant functional traits. Plant functional traits are considered the phenological, physiological, and morphological characteristics that shape individual plant fitness [7]. Functional analyses of these traits have effectively linked plant physiological, morphological, and life history characteristics in response to environmental variation [8,9].
In previous study, the importance of, and variety in, plant functional traits during the alteration of forest structure during the secondary succession process were reported in tropical humid rainforests (instead of in tropical seasonal forests) [2,10]. Tropical humid forests have abundant water and closed evergreen canopies with high leaf area indexes that provide deep and persistent shade. However, light availability plays a critical role in determining the community assembly and functional composition [11,12]. The functional composition of tropical humid forests usually changes from the dominance of acquisitive strategy species, characterized by functional traits such as high specific leaf area (SLA), small seed mass, and low wood density, in the early stages of succession when light is less limiting, to slower-growing, conservative strategy species with functional traits such as low SLA, large seeds and high wood density, etc., at later successional stages when light is highly limiting [2,13]. Functional diversity has previously received considerable attention, highlighting its importance in maintaining ecosystem function [14]. Primary ecosystem functions provide functional richness that increases with succession, as reported in previous studies of tropical humid forests [14,15]. However, functional redundancy is limited in tropical secondary forests, and functional divergence is relatively higher in mid-successional forests [15].
Some studies have examined functional traits, diversity variation, and their controlling factors during the secondary succession of tropical seasonal monsoon rainforests. Our understanding of functional trait change has been largely drawn from studies of tropical humid forests. Relatively few studies that examined the changes in the diversity of functional traits showed that different selection pressures during succession exist between tropical seasonal and humid forests [11]. Tropical monsoon forests occur in environments with alternating wet and dry seasons that extend for several months and thus experience strong changes in water availability intra-annually. These forests also have lower leaf area indexes that reflect the greater proportion of deciduous species [11]. Compared to tropical humid forests, light is a lesser limiting factor, and water is more limiting for plant growth [11]. During succession in tropical seasonal forests, micro-climatic conditions change from dry and hot to relatively moist and cool [16,17,18]. Accordingly, the forest community composition changes from species that use water conservation strategies during the early stages of succession when water stress is most limiting, to the dominance of species with fewer water conservation strategies in the latter stages of succession when water stress is less severe [11]. Thus, the changes in functional traits and their diversity during succession in tropical seasonal forests likely differs from other forest ecosystems, where drought or excessive light might be the most important stress to plant growth. In tropical seasonal forests, stochastic processes may be especially important during early succession due to the harsh abiotic conditions and restricted chances for suitable seedling recruitment [11,19]. In this study, we predicted that functional traits and their diversity would change from a conservative state to an acquisitive state during the succession of tropical monsoon forests. Functional diversity was expected to significantly increase as succession proceeded in tropical monsoon forests.
The restoration time after disturbance during secondary forest succession is related to many factors, such as seed dispersal and environmental factors. This could be a primary indicator of forest growth, survival, diversity [20], recovery rate, and productivity [21,22]. Thus, we predicted that the functional community structure of forests would vary with the successional processes. To the best of our knowledge, few studies have examined the changes in functional traits and diversity during secondary succession in tropical monsoon forests compared with tropical wet forests. In the present study, we examined the significance of functional traits and diversity during the community reassembly process by linking the shifts in forest structure, species composition, functional traits, and functional diversity, during secondary succession following shifting cultivation in the tropical monsoon forests. The nine chosen traits are related to photosynthesis, growth rates, and reproduction: deciduousness, specific leaf area, leaf dry matter, leaf nitrogen content, leaf phosphorus content, leaf potassium content, leaf carbon content, wood density, and seed mass. The goal of this study was to examine the patterns of functional diversity recovery and their underlying controlling factors during secondary succession in tropical monsoon forests, so that this unique forest ecosystem can be sustainably conserved and managed in the future.

2. Materials and Methods

2.1. Study Area

The study was conducted in the tropical monsoon forests of Xishuangbanna in Southern Yunnan Province, Southwest China (21°08′ N–22°36′ N, 99°56′ E–101°50′ E). This climate in this region is classified as tropical monsoon, characterized by distinct dry and wet seasons with a pronounced dry season extending from November to April. The mean annual temperature is 21.7 °C and monthly temperatures range from 12 °C in January to 22.6 °C in June and July. The mean annual precipitation is approximately 1500 mm, and nearly 80% of the rain falls during the wet season from May to October; the amount of rainfall ranges from 18.6 mm in January to 316.6 mm in July. The tropical monsoon forests are located at altitudes ranging from 500 to 900 m, and they can extend to an elevation of about 1100 m along the valleys of south-facing slopes of large mountains, which are dominated by deciduous trees [23].

2.2. Data Collection

2.2.1. Plot Investigation

The field investigation was conducted in tropical monsoon forests (TSMF) at different recovery stages after shifting cultivation. The forests’ recovery ages were (1) 40-year-old forests in the early stage of succession; (2) 60-year-old forests in the middle stage of succession; and (3) old-growth forests. Approximate successional ages were obtained through interviews with landowners. Old-growth forests in this region did not show any evidence of anthropogenic disturbance. At each successional stage, we randomly selected 11 plots, each with an area of 20 × 20 m. Plots were sampled to avoid river edges and large gaps, and the distance between plots was more than 50 m. Species name, diameter at breast high (DBH), and heights of all woody stems, including trees and shrubs >1 cm diameter, were recorded in each plot. All individuals were collected and identified at the species level. Species names were recorded in accordance with the Flora Reipublicae Popularis Sinicae [24].

2.2.2. Soil Data

Soil samples were obtained from four points in each plot. A core of the top 20 cm of soil was removed at each point. Soil was air-dried in the field, then sieved (2 mm) and combined for each 20 × 20 m plot. The soil nutrients, such as soil pH, available nitrogen content (AN, mg·kg−1), available phosphorus content (AP, mg·kg−1), available potassium content (AK, mg·kg−1), total nitrogen content (TN, mg·kg−1), total phosphorus content (TP, mg·kg−1), total potassium content (TK, mg·kg−1), and soil organic matter content (SOM, g·kg−1), were analyzed in the laboratory according to standard methods [25].

2.2.3. Functional Trait Data

High functional traits were chosen, including deciduousness, which was either 0 or 1, where 1 was deciduous and 0 was evergreen; specific leaf area (SLA, cm2·g−1); leaf dry matter content (LDMC, mg·mg−1); leaf nitrogen content (LNC, %); leaf phosphorus content (LPC, %); leaf potassium content (LKC, %); leaf carbon content (LCC, %); wood density (WD, g·cm−3); and seed mass (SMass, g). These traits are closely related to resource-use strategies under varied environmental conditions, and are thought to be important drivers of community assembly along environmental or successional gradients [26]. Leaf SLA and LNC collectively describe the variation in light capture and carbon economy [27], implying the use of acquisitive strategies by species with higher SLA, LNC, LPC, LKC, and lower LDMC and LCC [28,29]. WD is correlated with stem growth rates and tree mortality, with heavy WD being correlated with slow growth and long-lived tree species [30]. Later successional species generally produce heavier SMass to enhance directed dispersal to safe sites via animals.
The leaf traits of all sampled species were measured using at least five intact individuals of a given species. Species with fewer than five individuals were assigned the mean value measured for that species. For each individual, 5–10 intact leaves were collected. The SLA of broadleaved species was calculated as the leaf area divided by the leaf dry mass after oven-drying for 72 h at 70 °C. LDMC was calculated as the oven-dried mass divided by the fresh mass [31,32]. The leaf chemical characteristics, including LNC, LPC, LKC, and LCC, were measured with standardized protocols for plant functional trait measurements [33].
The species wood density in wood cores is linearly correlated with that in the branch (p < 0.0001) [34]. To characterize the WD of each species, we sampled branches (1 cm ≤ diameter ≤ 2 cm) from 1 to 10 individuals of each species across the plots [35]. We removed the pith, phloem, and bark [36], and measured the fresh volume by water displacement [37], and determined the dry mass after oven-drying at 80 °C. When this was not feasilble, we employed the Global wood density database of Chave et al. [30]. In this case, if there were several density measurements for a species, we used their mean. Seeds were collected from at least 10 fruits taken from different individuals of each species. Seed mass (SMass) was obtained after 48 h drying at 80 °C [35]. For some species, which could not be collected in the field, SMass data were obtained from the XTBG (Xishuangbanna Tropical Botanical Garden) Seed Bank, as well as published literature [38], and Internet sources, including the Kew Gardens Seed Information Database (www.rbgkew.org.uk/data/sid/) [39]. In total, we measured the functional traits of 135 woody plant species in the study area.

2.3. Statistical Analysis

2.3.1. Forest Structure and Species Diversity

Firstly, we visualized these plot differences using a multidimensional scaling analysis (MDS). Multidimensional Scaling is a multivariate statistical technique first used in geography. The main goal is to plot multivariate data points in two dimensions, thus revealing the structure of the dataset by visualizing the relative distance of the observations. We then compared the community characteristics among the three different forest successional stages, including the total number of individuals (stem abundance) and the total number of species (species richness). To identify the indicator species that distinguish the three forest ages, indicator species values [40] were calculated for each of the three different forest recovery stages (40-year-old, 60-year-old, and old-growth forests). Significant associations with any recovery stage were tested using the probabilities of obtaining the highest indicator value.
We also used an analysis of similarities (ANOSIM) to test whether the species composition for all tree sizes differed among the different forest recovery stages. We then split the census data into three tree size classes: saplings (1 cm ≤ dbh < 5 cm), treelets (5 cm ≤ dbh < 10 cm), and adult trees (dbh ≥ 10 cm). Then we constructed rarefaction species accumulation curves to evaluate the differences in species richness across the different forest successional stages.
We defined species diversity by species richness (S), the Shannon–Weaver index (H), and Pielou’s evenness (J). We tested the species diversity whether it differed between restoration times. We used one-way ANOVAs, followed by Tukey’s HSD comparison tests.

2.3.2. Functional Traits and Functional Diversity

Functional diversity is defined as the value, range, and distribution of functional traits in a given ecosystem [41]. It may be a good indicator of ecosystem dynamics, stability, and productivity [41,42], and is found to be more important for ecosystem functioning than taxonomic diversity [43]. Functional diversity is often characterized in terms of the following three descriptors, though there are many more, as outlined by Mouchet et al. [3]: (1) richness—the range of functional values present in a particular plant community; (2) evenness—the functional regularity in the distribution of species abundances; and (3) divergence—the difference in mean functional values across abundant species in communities. Communities with strong habitat filtering have low functional divergence, whereas those with strong species interactions have high divergence.
To improve the normality, we log-transformed the nine functional traits, and then tested whether they differed across plot ages using community-weighted means based on the basal area of the species in each plot [44]. We also measured the functional diversity in each plot, and tested whether it differed between restoration times. We used one-way ANOVAs, followed by Tukey’s HSD comparison tests. All statistical analyses were performed with R version 3.1.2.0 [45].

2.3.3. Environmental Effects

To assess the changes in environmental factors during succession, one-way ANOVAs were applied and Tukey’s-HSD tests were used for post hoc comparisons. Then, multiple linear regressions were used to determine the relative importance of environmental factors affecting functional traits, species diversity, and functional diversity using the model selection procedure in SAM 4.0 (Spatial Analysis in Macroecology) software [46]. The dependent variables were the high functional traits (including deciduousness, SLA, LDMC, LNC, LPC, LCC, WD, and SMass), species diversity (species richness, Shannon–Weaver index, and Pielou’s evenness), and functional diversity (including richness, evenness, and divergence). We applied dependent variables in each model, and then used nine environmental factors (restored time, soil pH, SOM, TN, TP, TK, ANC, APC, and AK) as independent variables. Data related to the dependent and independent variables were log-transformed to improve the normality in each model. The model selection process in SAM computed all possible combinations of independent variables and ranked the resulting models according to the Akaike information criterion (AIC) values [20]. We then determined the importance of the explanatory variables for each dependent variable.

3. Results

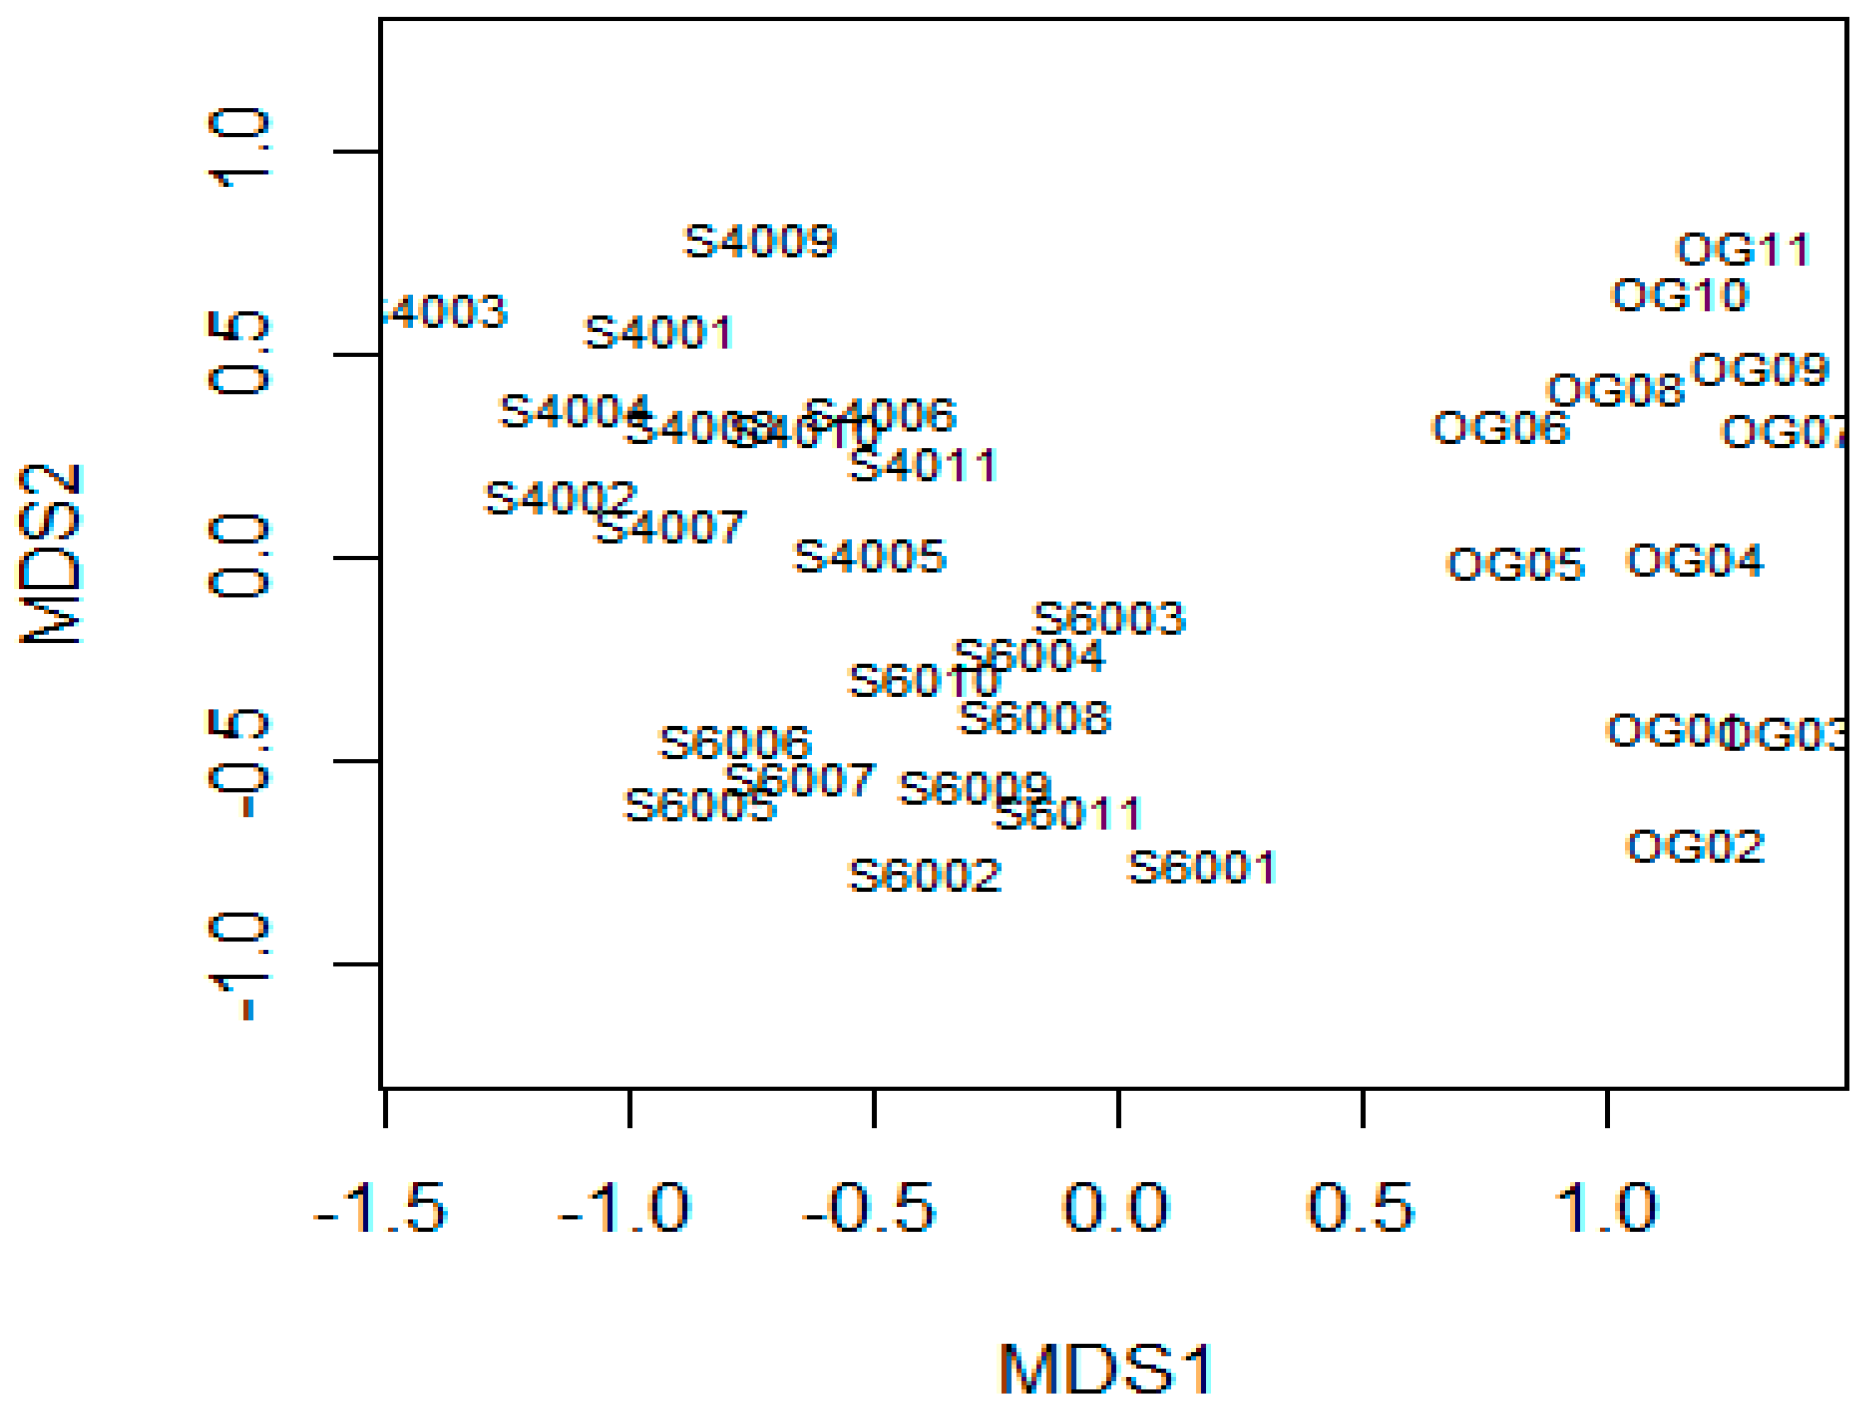
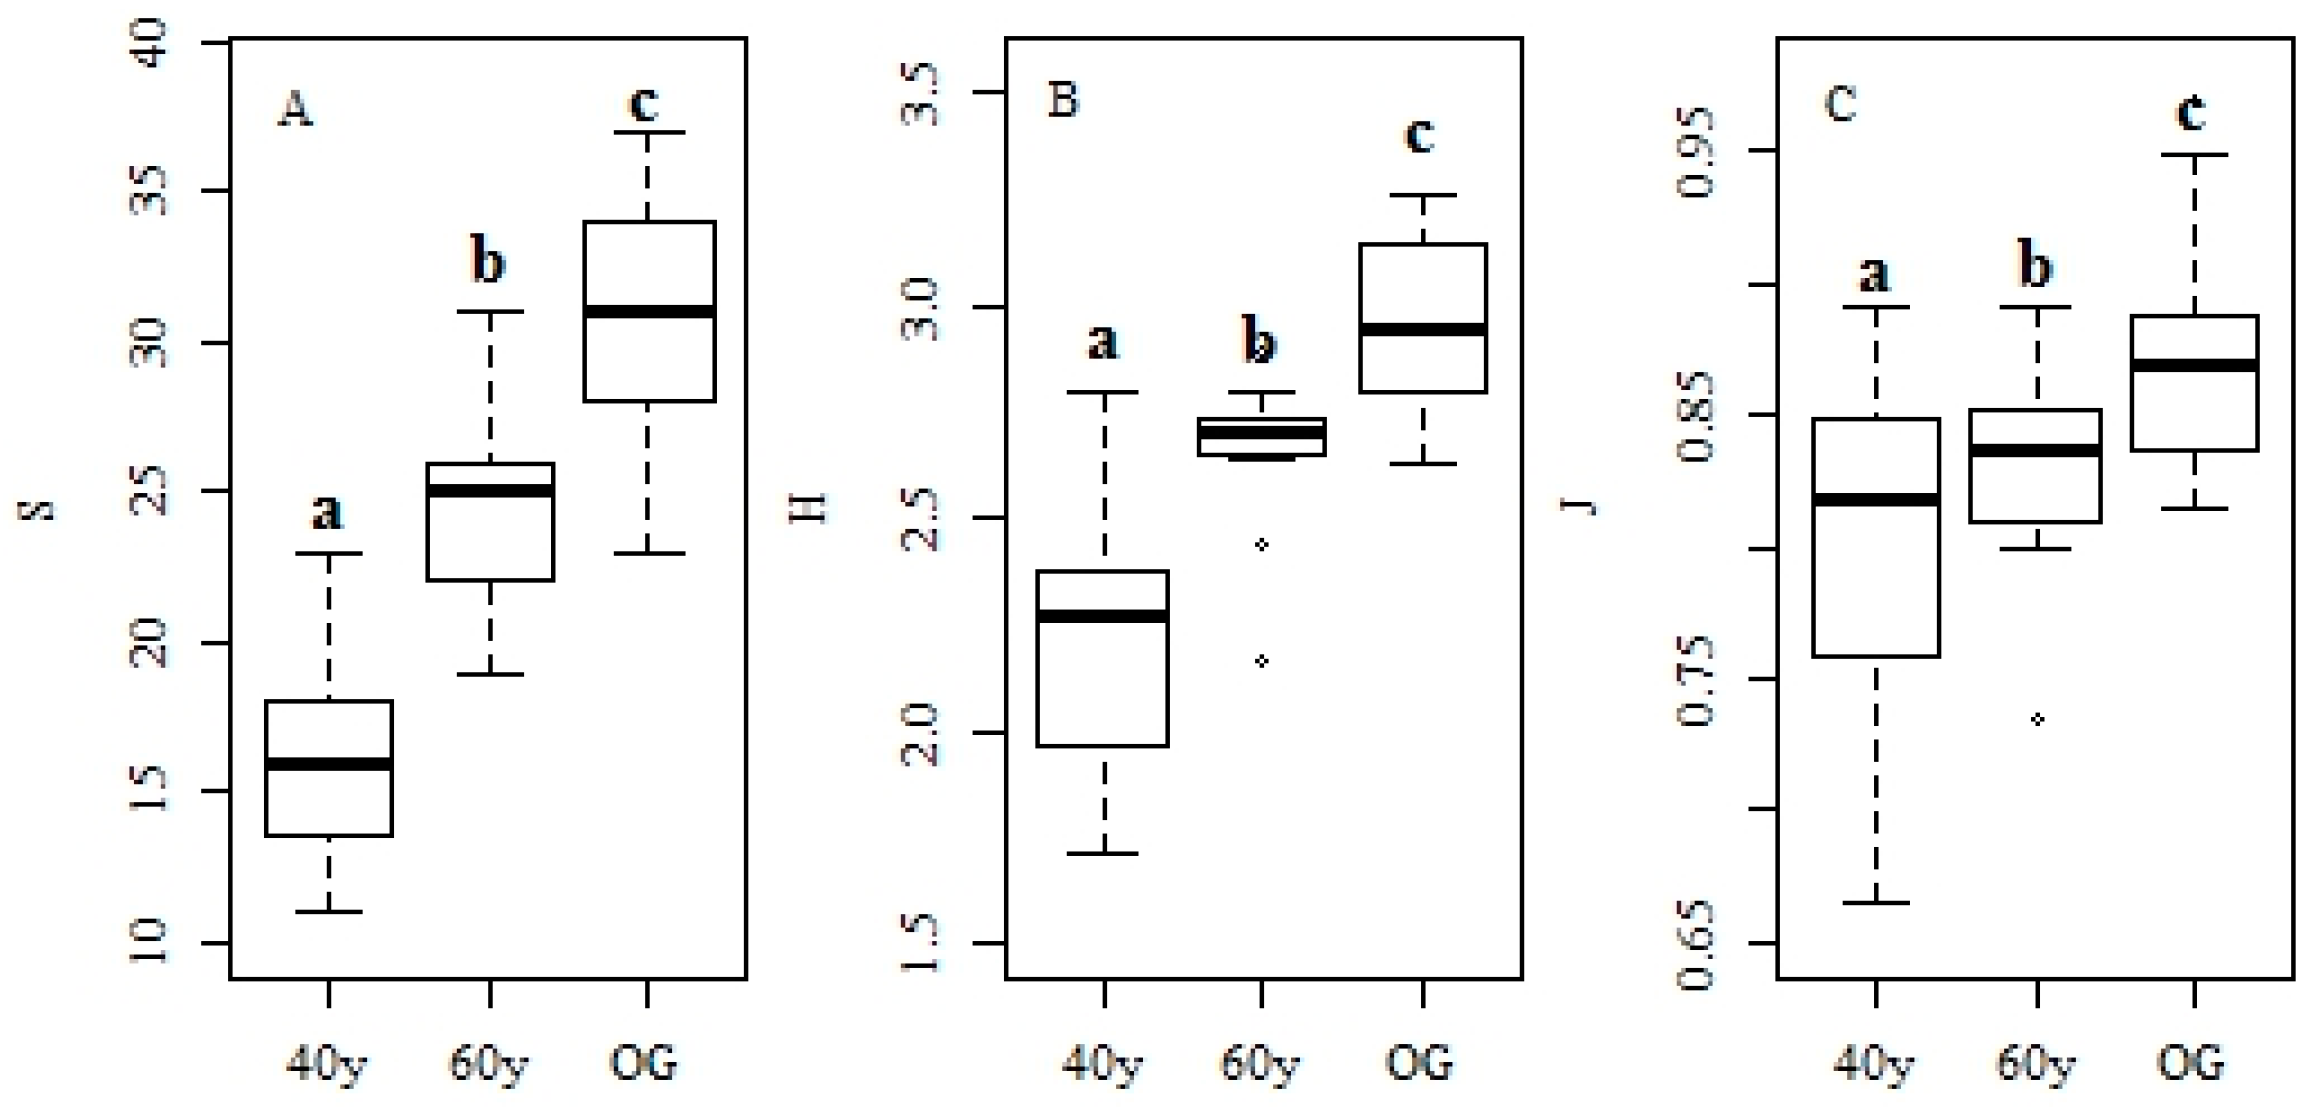
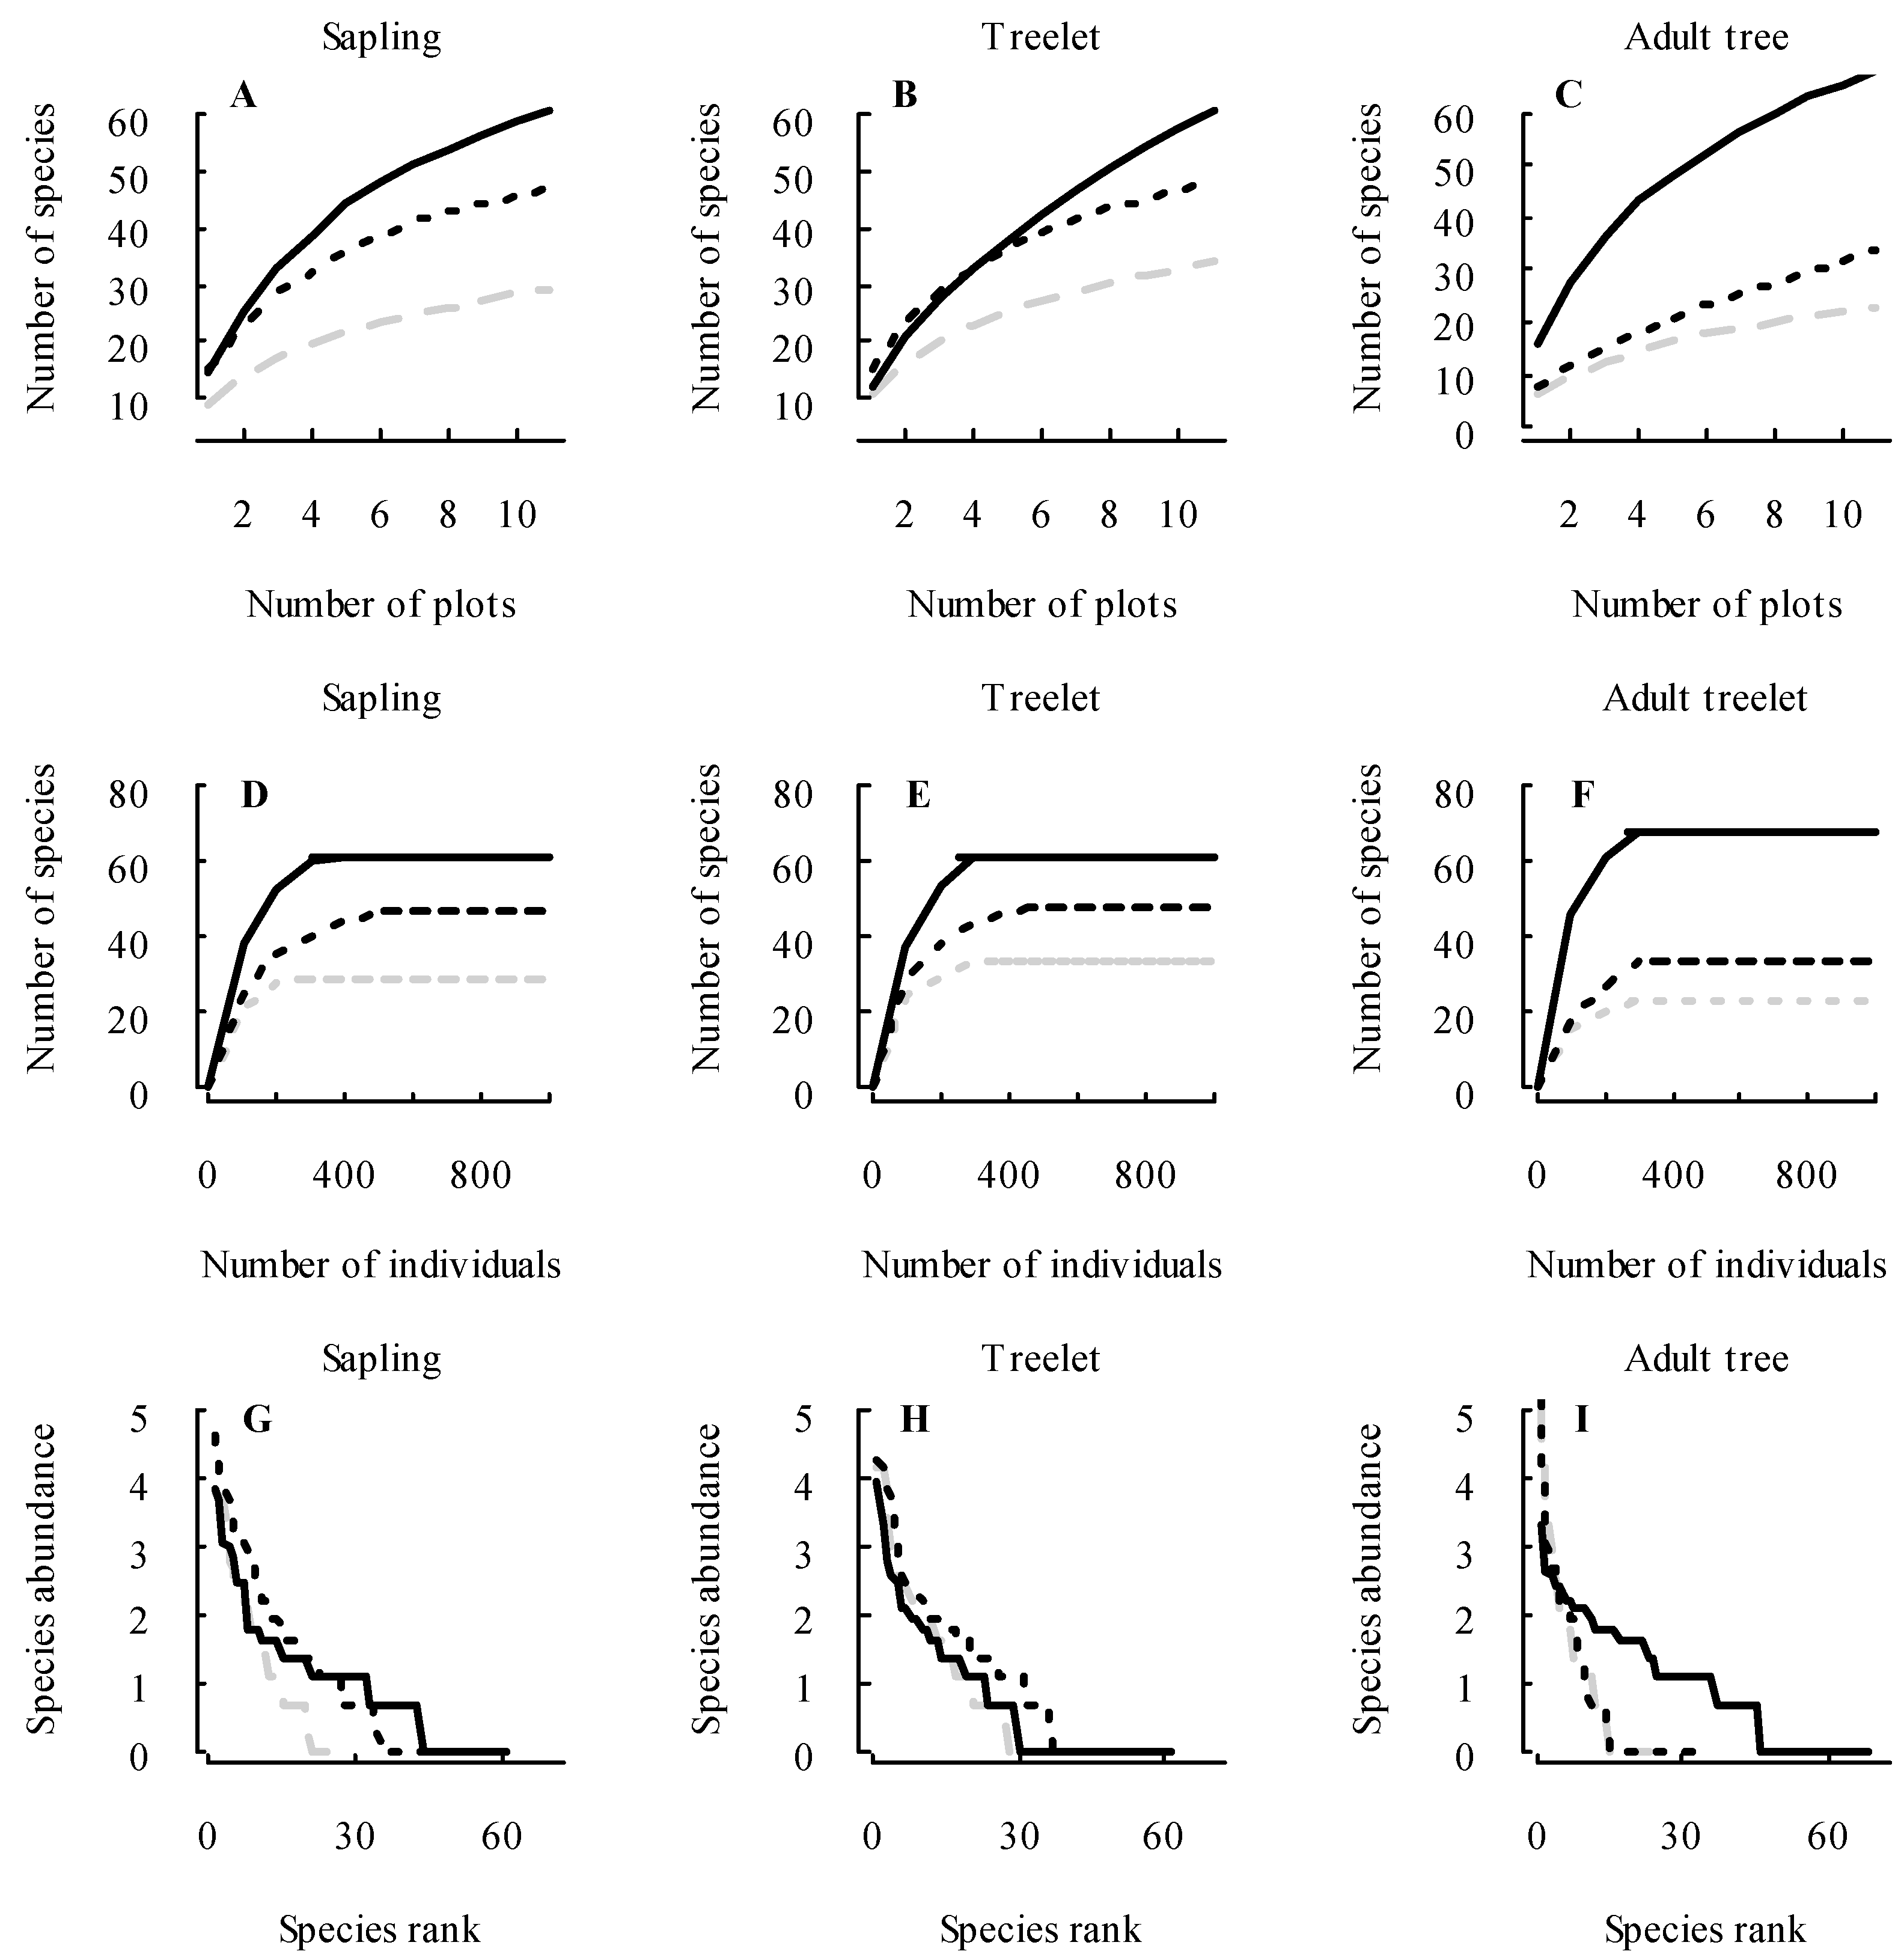
3.1. Changes in Forest Structure and Species Diversity during Succession

In total, 2856 stems belonging to 135 species were inventoried in the plots. There were large differences of species composition among the three stages of forest succession in a non-metric multidimensional scaling analysis (Figure 1). Stem density was higher in the 60-year recovery forests compared to the 40-year and old-growth forests (Table 1). The species richness for all tree size classes significantly increased with time since disturbance (Table 1, Figure 2, ANOSIM test; p < 0.001 in all cases), especially for adult trees, which was significantly higher in old-growth forests than in 40- and 60-year recovery forests (Figure 2C,F,J).
Significant differences were observed in species composition for all tree size classes among forest recovery stages, especially for adult trees in 40- and 60-year and old-growth forests (ANOSIM test, p < 0.001 in all cases; Figure 2). Significant differences in preference for forest recovery stage across tree sizes were mostly due to differences in the composition of the dominant species (see attachment). Seven species dominated the 40- and 60-year forests—Castanopsis echinocarpa Miq., Aporusa yunnanensis (Pax & K. Hoffm.) F.P. Metcalf., Pittosporopsis kerrii Craib., Machilus tenuipilis H.W.Li., Garcinia yunnanensis Hu., Ardisia thyrsiflora D.Don., and Phoebe lanceolata (Nees) Nees —which had a combined relative abundance of 65.82% in the 40-year recovery forests and 65.48% in the 60-year recovery forests (Appendix A). Species with high preference in the 40-year recovery forests were C. echinocarpa and A. yunnanensis, with a combined relative abundance of 45.26% (Appendix A). These forests also included some pioneer species, such as Cratoxylum cochinchinense (Lour.) Blume and Quercus macrocalyx Hickel & A. Camus. The 60-year recovery forests were mainly composed of P. kerrii, M. tenuipilis, G. yunnanensis, A. thyrsiflora and P. lanceolata, which had a combined relative abundance of 43.40%. The old-growth forests were mainly composed of P. kerrii (13.61%) and many exceptional species such as Saprosma ternata Hook.f., Baccaurea ramiflora Lour., Polyalthia simiarum subsp. cheliensis (Hu) Bân., Parashorea chinensis H. Wang., Aidia yunnanensis (Hutch.) T. Yamaz., and Gironniera subaequalis Planch., which had a combined relative abundance of 33.9% (Appendix A).
The species diversity in the tropical monsoon forests, including the species richness (S), Shannon–Weaver index (H), and Pielou’s evenness (J), significantly increased with succession stage (Figure 3A–C; S: F = 36.49, p < 0.001; H: F = 23.21, p < 0.001; J: F = 4.828, p < 0.01).

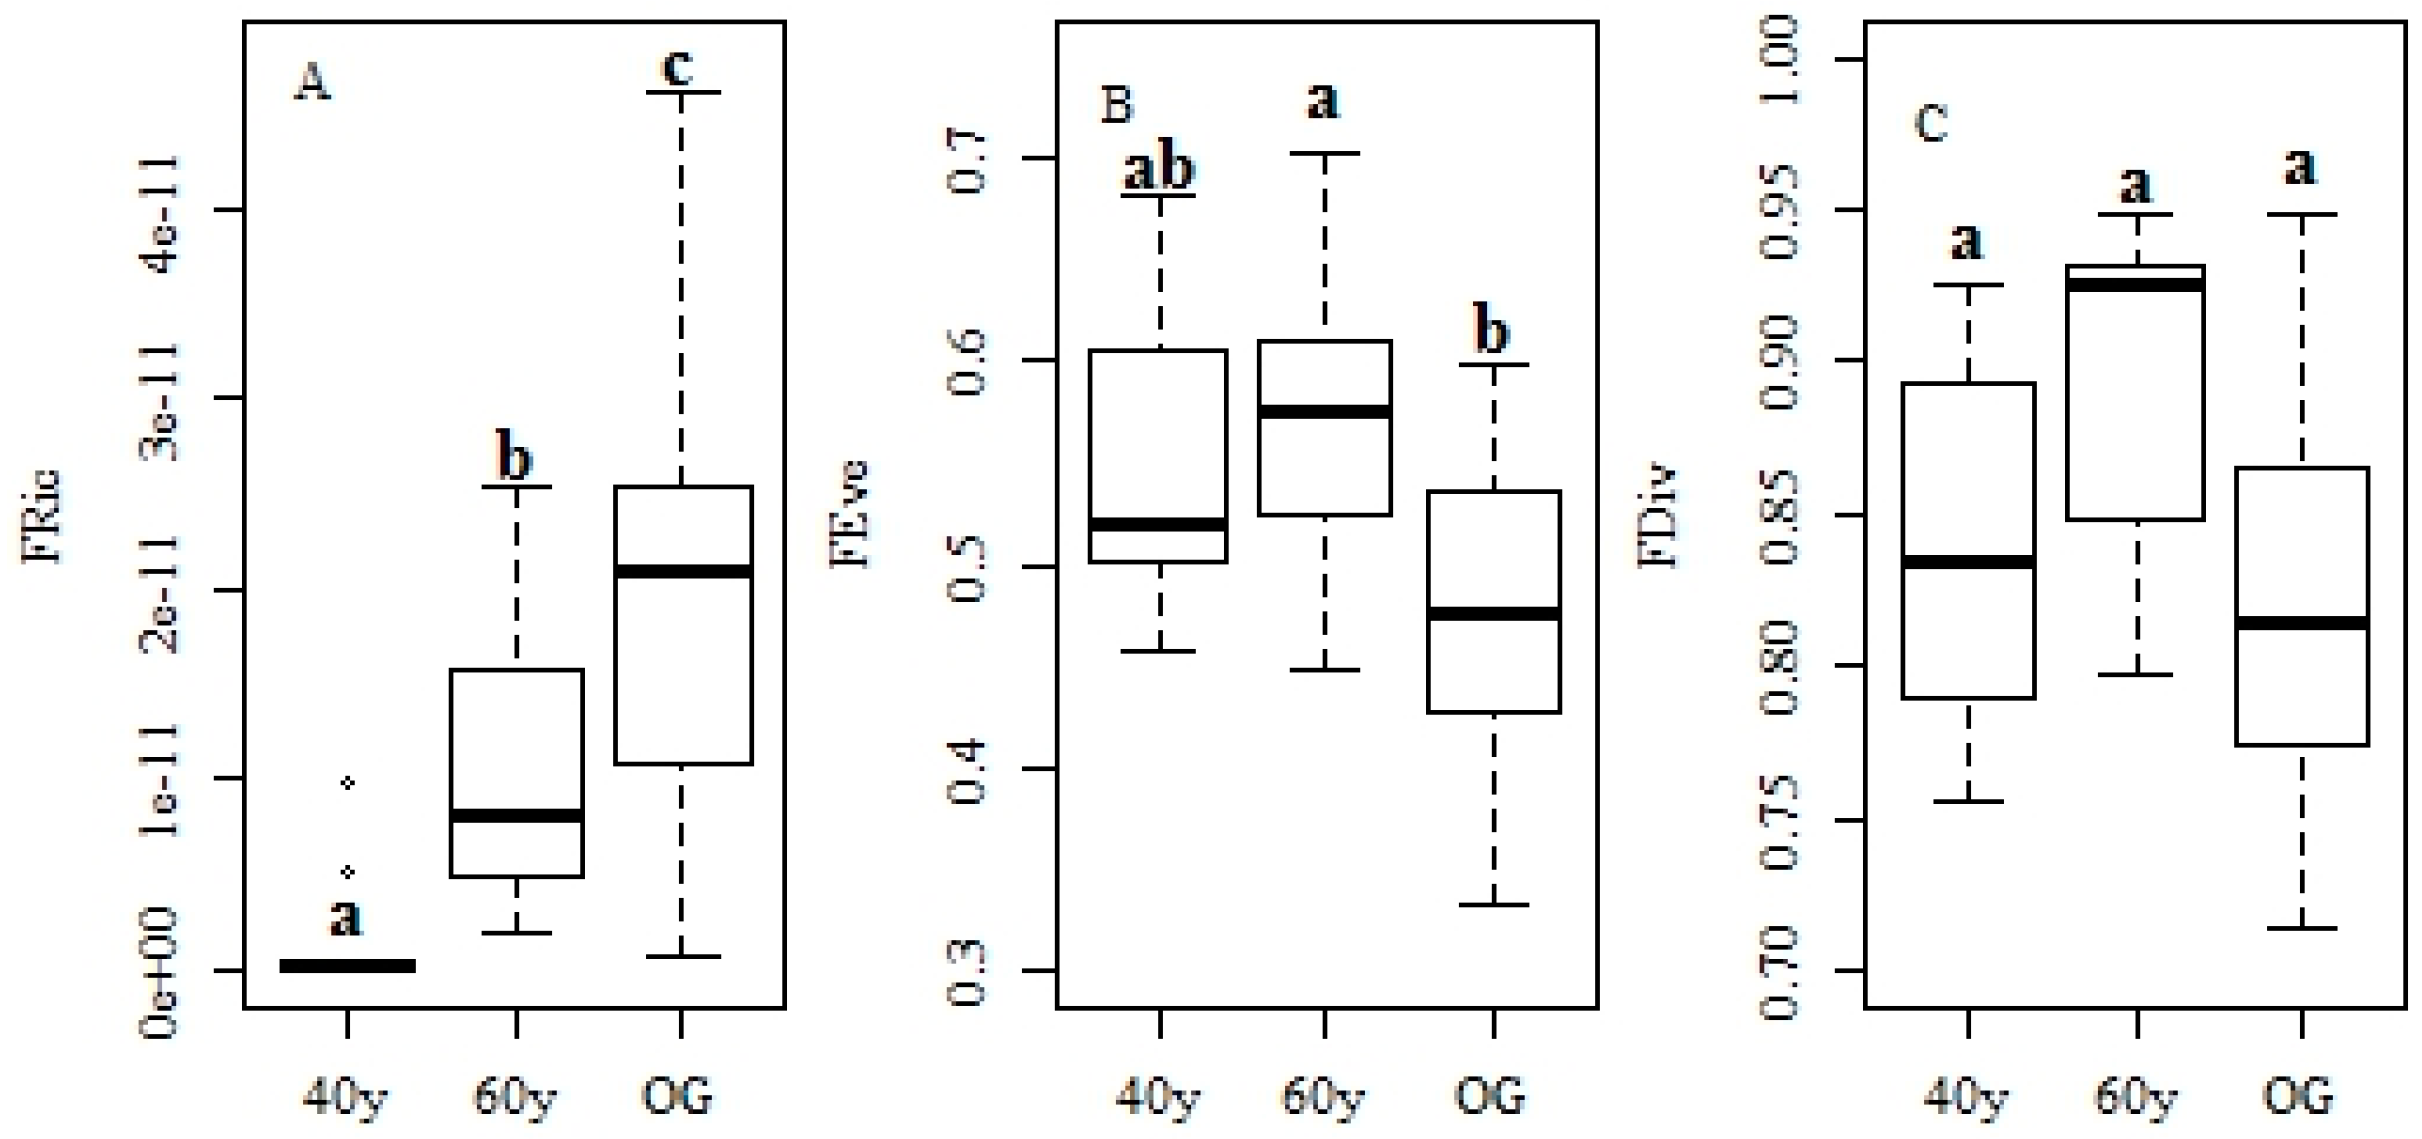
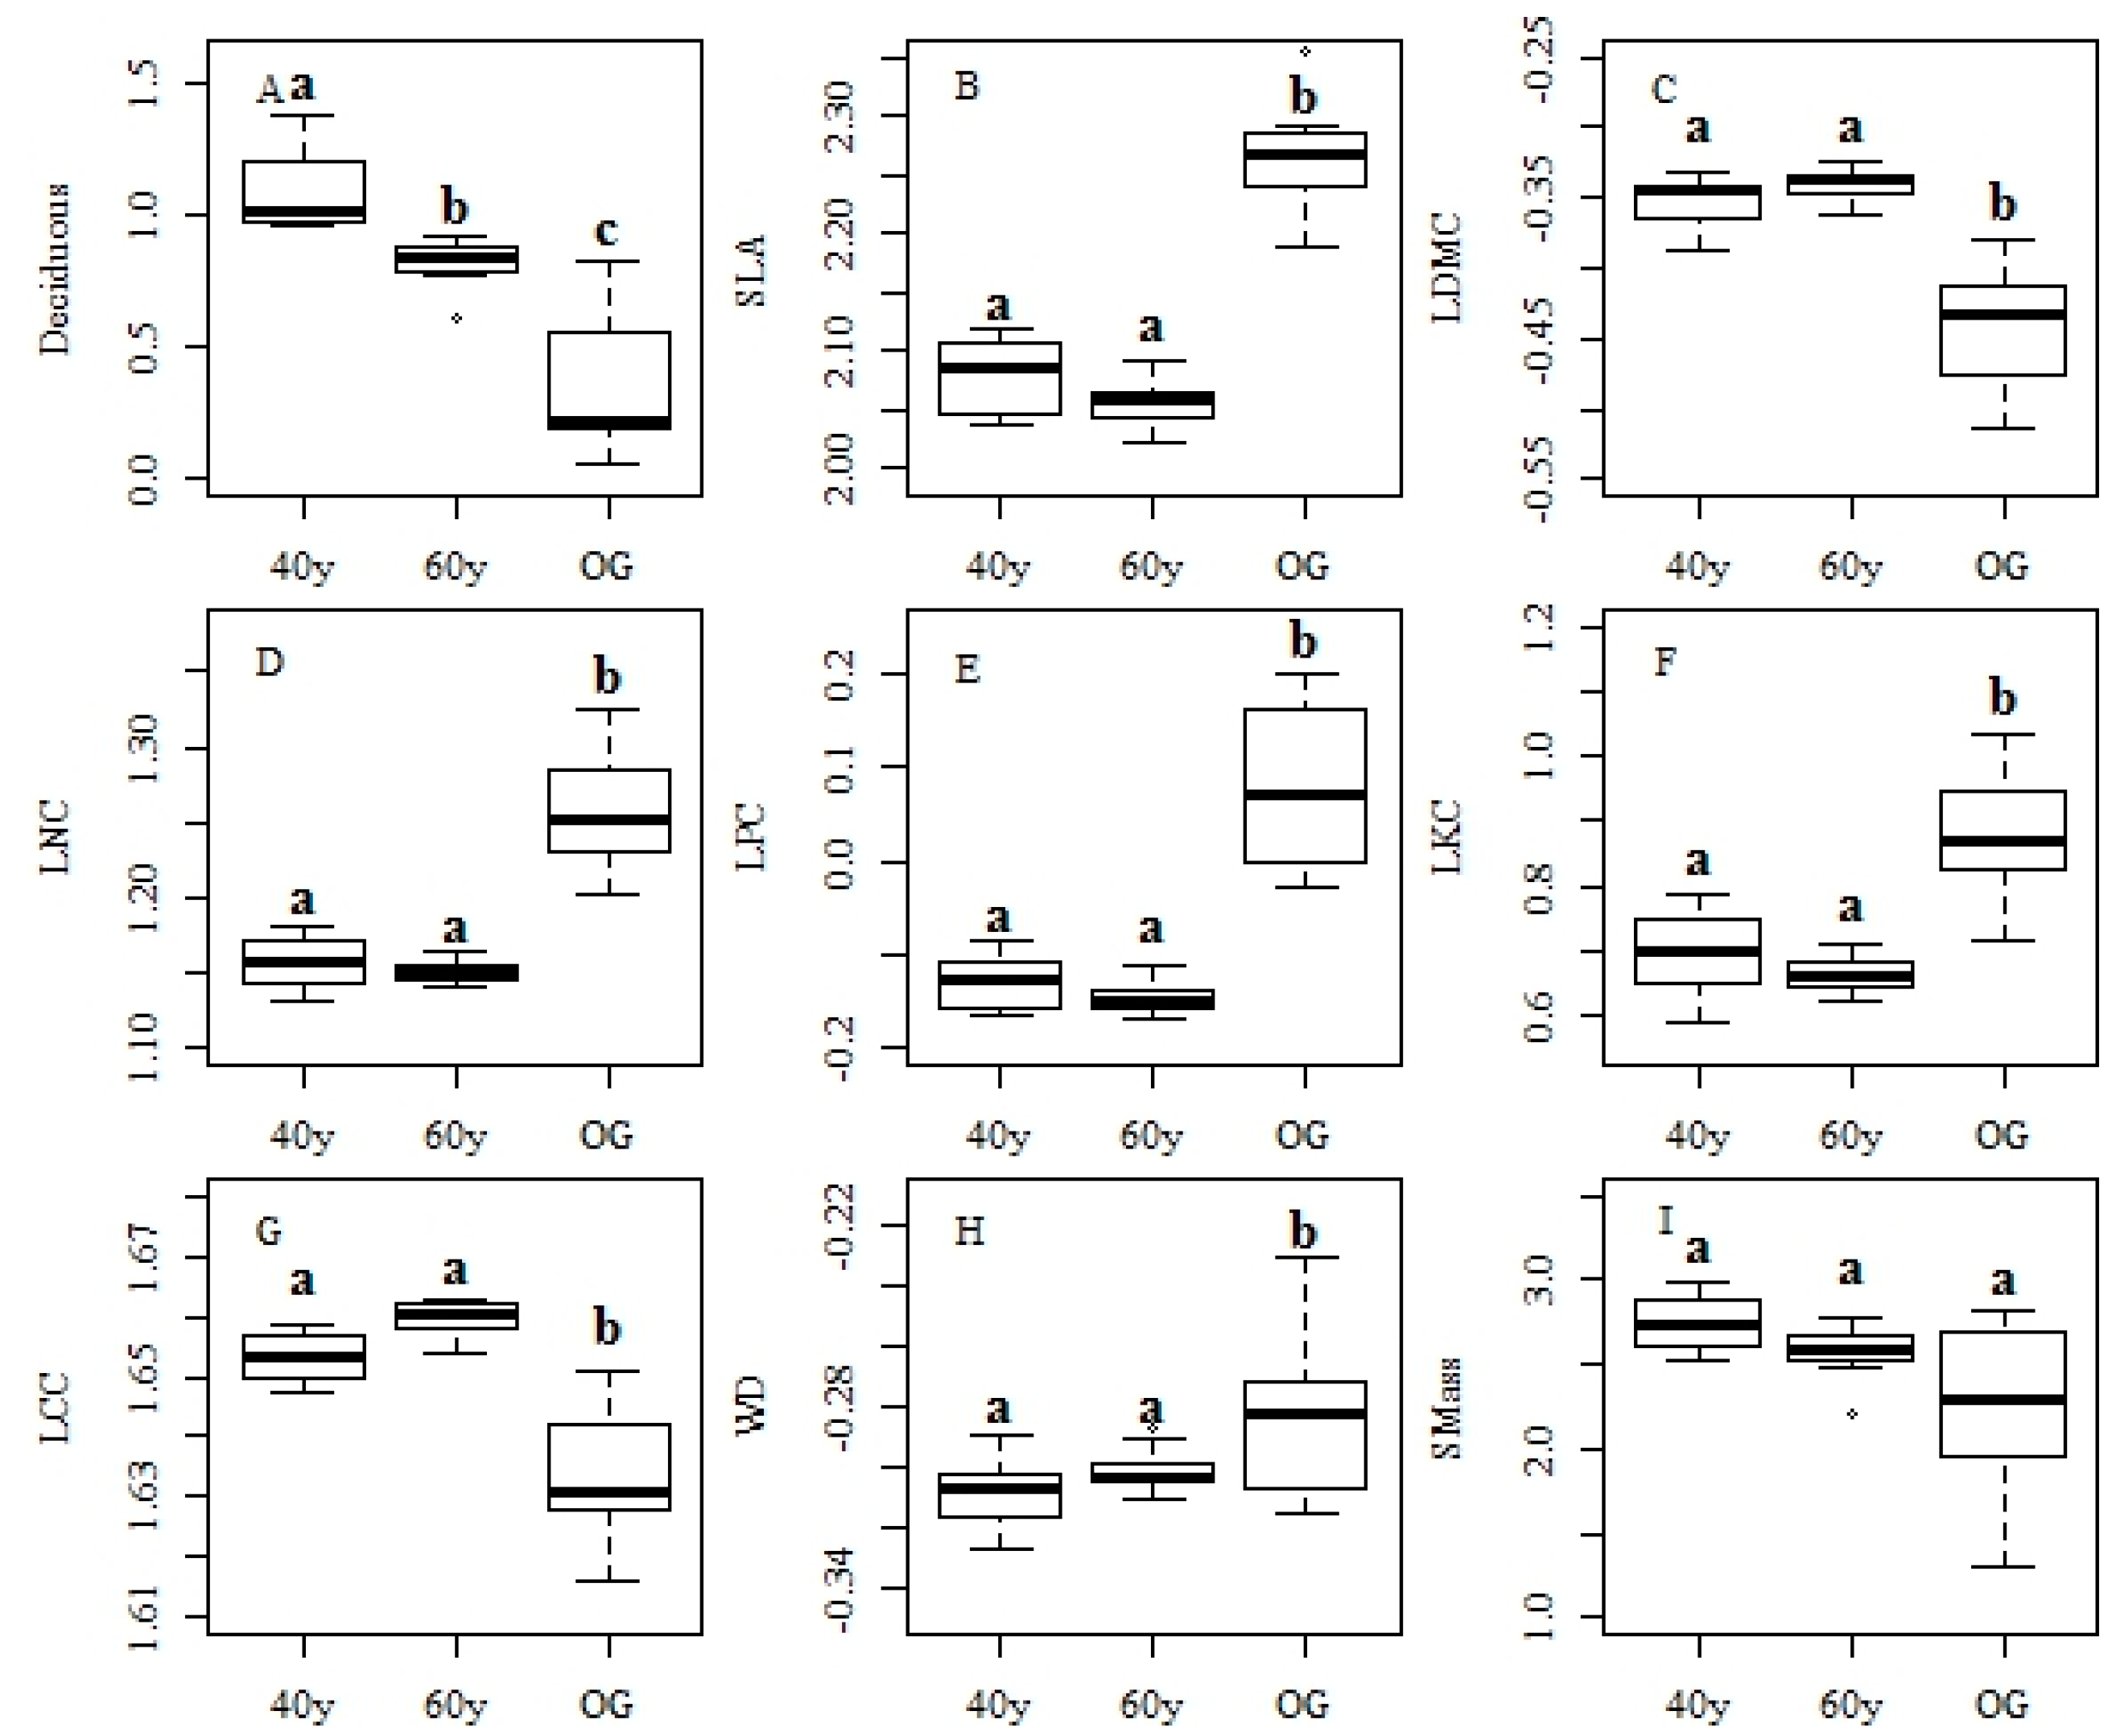
3.2. Changes in Functional Traits and Functional Diversity during Succession

The number of deciduous species significantly decreased as restoration time elapsed (Figure 4; deciduous trees: F = 42.05, p < 0.001). Leaf SLA, LNC, LPC, LKC, and WD were significantly lower in the 40-year and 60-year secondary forests than in the old-growth forests, whereas LDMC and LCC demonstrated an opposite pattern (Figure 4; SLA: F = 120.6, p < 0.001; LNC: F = 63.41, p < 0.001; LPC: F = 61.17, p < 0.001; LKC: F = 32.75, p < 0.001; WD: F = 5.389, p < 0.01; LDMC: F = 44.42, p < 0.001; LCC: F = 45.54, p < 0.001). These results show that leaf functional traits changed from conservative to acquisitive strategies during the succession of tropical monsoon forests, but wood density changed from acquisitive to conservative strategies, and seed mass did not significantly change with elapsed restoration time.
The functional richness (FRic) significantly increased with restored time during succession (Figure 5D FRic: F = 11.73, p < 0.001). Functional evenness (FEve) was highest in the 60-year forests, followed by the 40-year forests, and was lowest in old-growth forests (Figure 5E; FEve: F = 3.801, p = 0.0338 < 0.05). Functional divergence (FDiv) showed no significant changes with restored time but was higher in the 60-year forests than in 40-year and old-growth forests (Figure 5F; FDiv: F = 3.093, p = 0.0601).

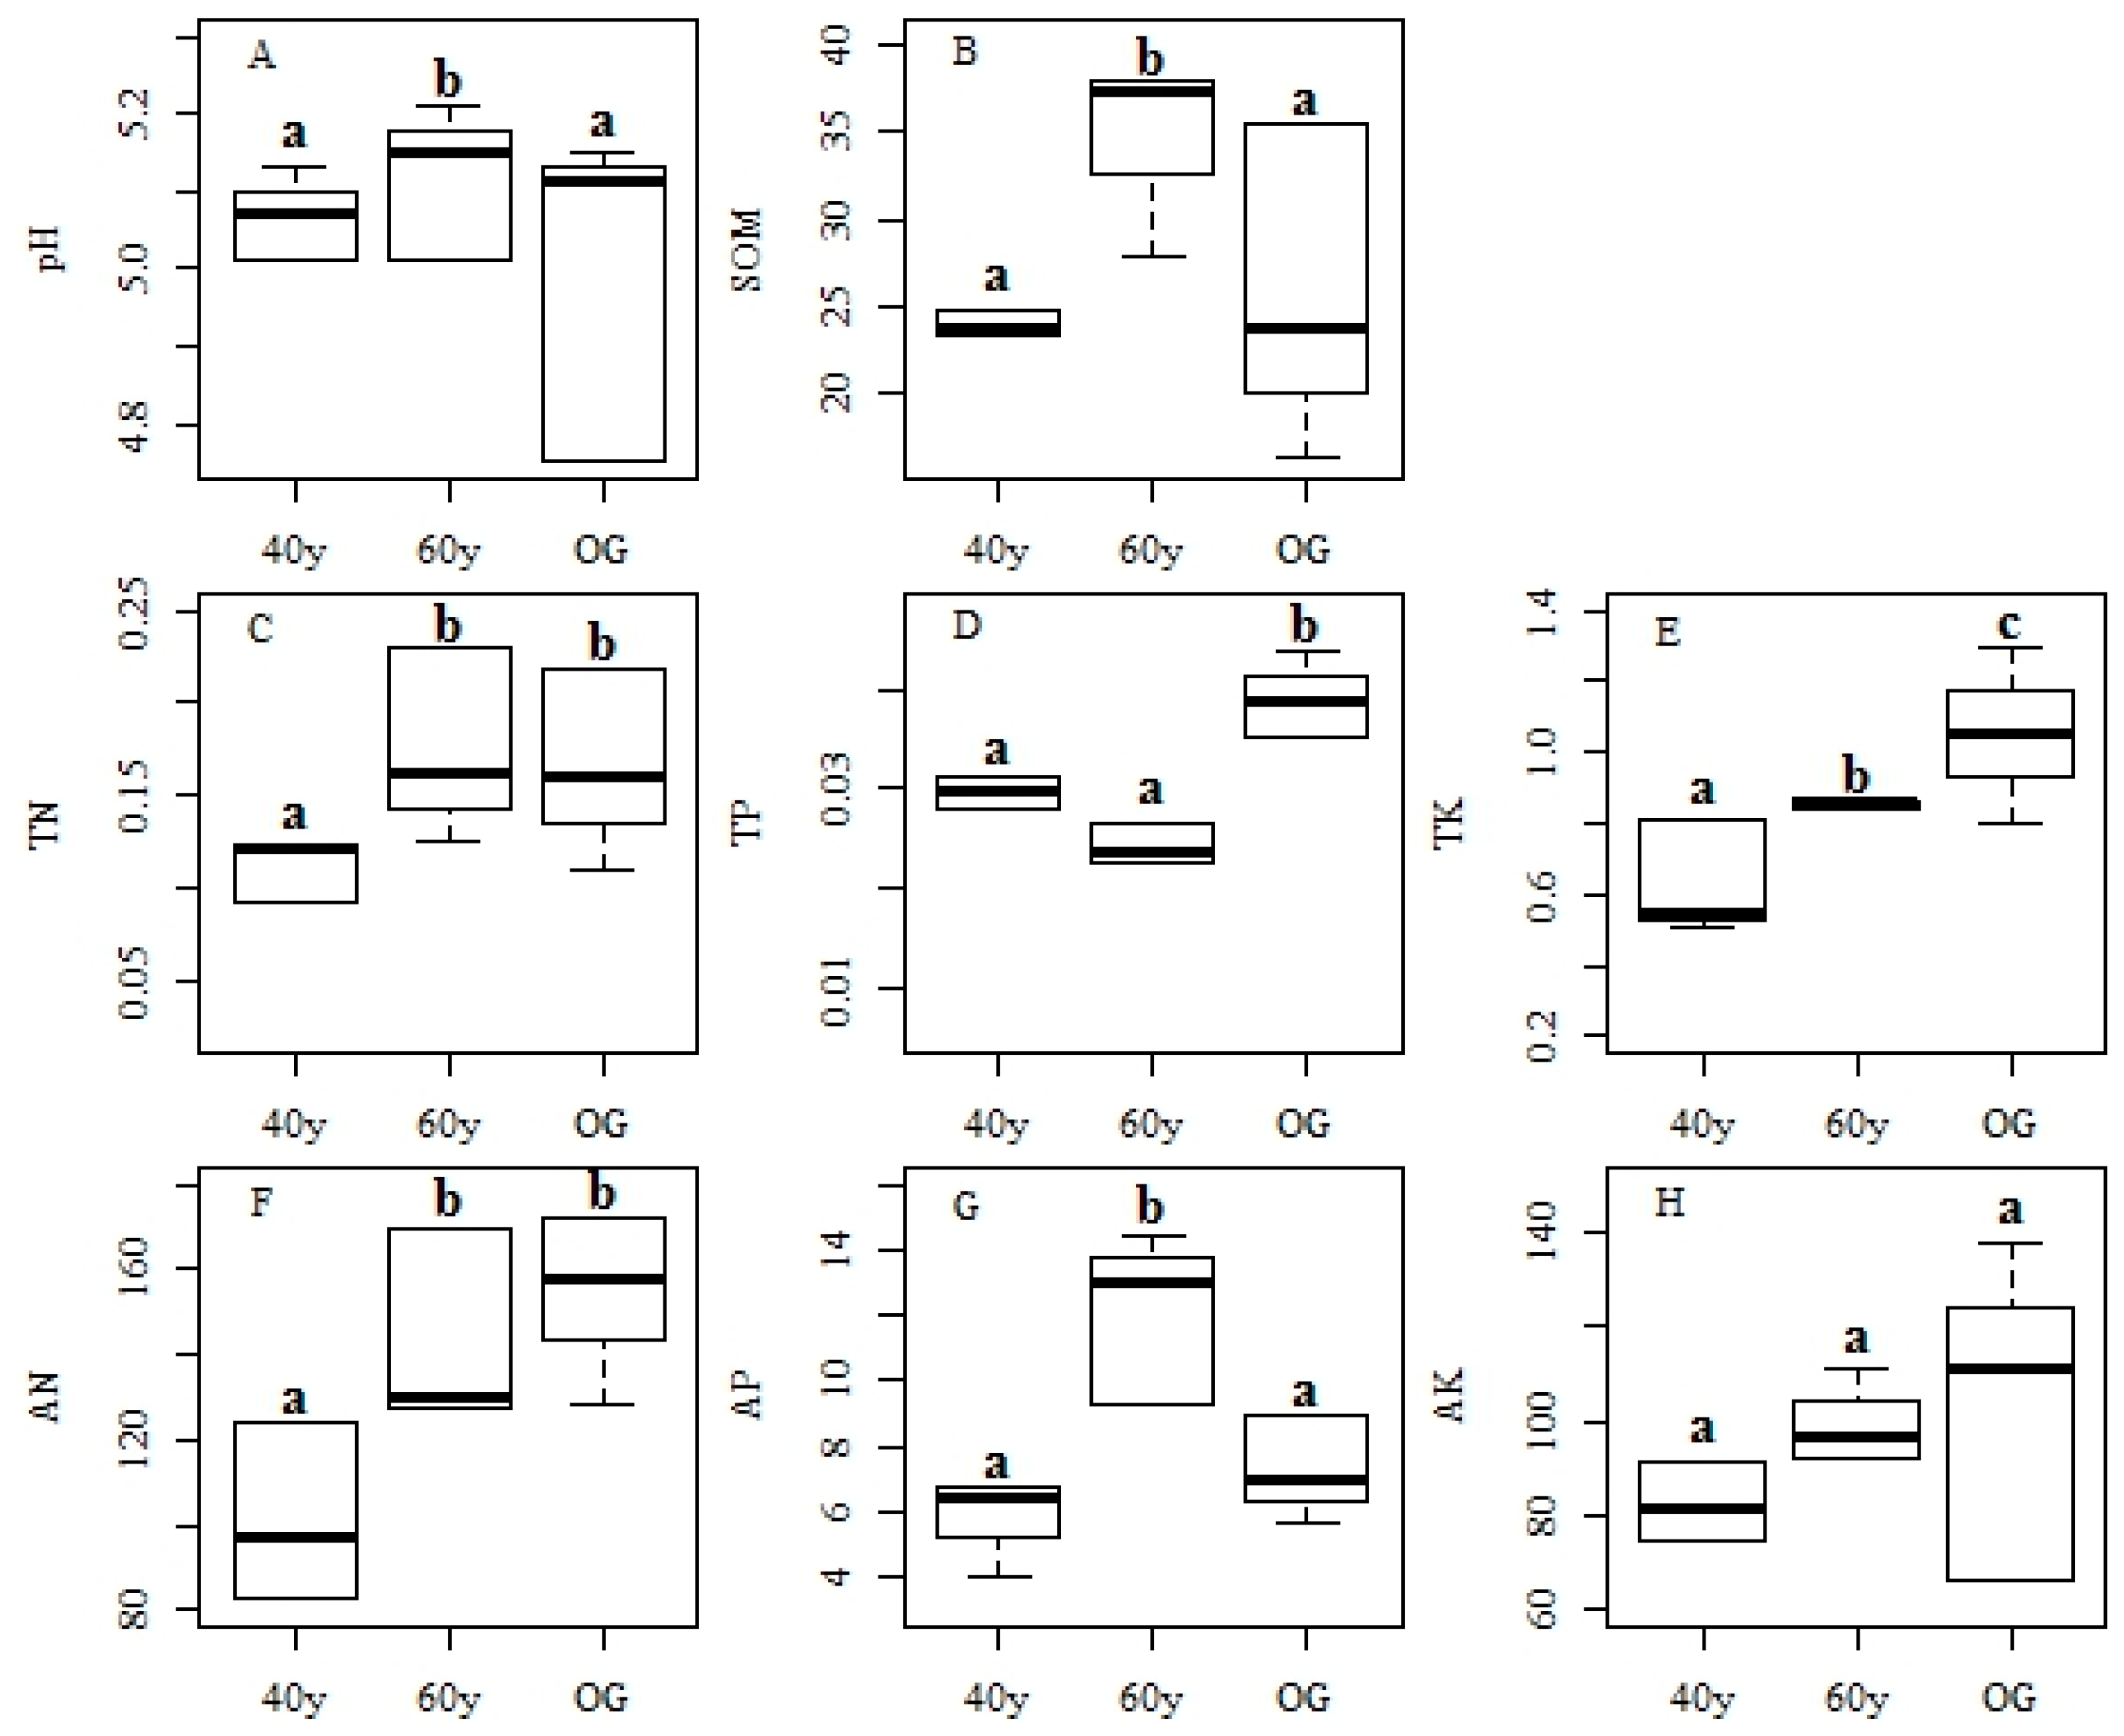
3.3. Changes in Environmental Factors and Effects on Functional Features during Succession

Soil TN, TP, and AN were higher in old-growth forests than in 40-year forests (Figure 6; TP: F = 87.21, p < 0.001; TN: F = 9.669, p < 0.001; AN: F = 24.08, p < 0.001), whereas TP was unchanged between secondary forests, and TN and AN were unchanged between the 60-year and old-growth forests. TK significantly increased with restoration time, and AK showed an increasing trend (Figure 6; TK: F = 26.05, p < 0.001; AK: F = 2.462, p > 0.05). Soil pH, SOM, and AP were significantly higher in the 60-year forests than in the 40-year and old-growth forests (Figure 6; pH: F = 4.209, p = 0.0245 < 0.05; SOM: F = 11.14, p < 0.001; AP: F = 39.47, p < 0.001).
Restoration time was significantly correlated with most of the leaf traits, and was also related to species richness, Shannon–Weaver diversity, and functional richness (Table 2). Soil nutrients were also largely related to most of the leaf traits, especially LNC, LPC, and LKC, but weakly related to WD, SMass, and species and functional diversity.

4. Discussion

4.1. Recovery of Forest Structure and Species Diversity in Tropical Monsoon Forests

The study of forest structure and effect of environmental factors during the secondary succession of tropical forests has been reported previously [4,17,48]. The recovery of forest structure after disturbance displays a widespread pattern of dynamic forest processes [49], and stem density is relatively high at intermediate disturbance times during succession [50]. Structure recovery is generally quite rapid, but species composition recovery is quite difficult and highly dependent on the pre-disturbance history [49,51]. Our study demonstrated that fallows from shifting cultivation existed at different stages of recovery, and species composition and diversity remained distinct for all tree sizes (Table 1 and Figure 1, Figure 2 and Figure 3), especially for adult trees in 40-year, 60-year, and old-growth communities. The 40-year and 60-year forests in the current study were mainly dominated by seven species, which had combined relative abundances of 65.82% and 65.48%, respectively. The old-growth forests were mainly dominated by exclusive species, such as S. ternata, B. ramiflora, P. simiarum subsp. cheliensis, P. chinensis, A. yunnanensis, and G. subaequalis, which had a combined relative abundance of 33.9%. The species diversity in the tropical monsoon forests, including species richness (S), the Shannon–Weaver index (H), and Pielou’s evenness (J), significantly increased with succession stage.
The lower resilience of species composition could be explained by three factors. Firstly, harsh environmental conditions existed in the tropical monsoon forests, particularly in the 40-year forests (Figure 6). The present study show that the restoration time and soil nutrients may play significant roles in influencing the species composition of 40-year and 60-year forests based on the effectiveness of pioneer species composition. Secondly, several circles of shifting cultivation may have altered local environment factors, such as the micro-climate and soil nutrients, with potential damage to the remnant trees (seed sources), species pools, and seed dispersal [52]. Thus, early colonization of these abandoned forests by new species was hindered, resulting in lower species diversity across tree size class in the 40-year and 60-year recovery forests, especially for adult trees. Thirdly, some biotic factors, such as proximity to nearby populations [51] and seed dispersal from pioneer species, may play major roles in the early phases of succession which may increase the abundance of pioneer species [53]. Large disturbances that occurred many years ago may have also determined the tree species distribution with different life history strategies [54]. In our study, P. kerrii, M. tenuipilis, and G. yunnanensis were widespread throughout the tropical monsoon forests, though they were most abundant in the 60-year secondary forests. The abundance of these species across all plots could be an indicator of historical disturbance.

4.2. Recovery Patterns of Community Level Functional Traits in Tropical Monsoon Forests

Changes in species composition and forest structure may be influenced by shifting plant functional traits. Previous studies on synchronized leaf and stem approaches included the investigation of a high woody density, low SLA, and LNC per mass [12,55]. Species with particular mixtures of traits may change with the succession stage [56]. In our study, during succession, the leaf strategies changed from conservation to acquisition, supporting our hypothesis. However, different from our hypotheses, wood density was significantly higher in old-growth forests, showing an increasing change from acquisitive to conservative strategies, and seed mass showed no significant change with succession.
Restoration time, which was significantly correlated with most leaf traits in our study, could play a vital limiting factor in shaping most of the leaf trait strategies and in forming the community assembly during succession in tropical monsoon forests. Additionally, many previous studies have revealed that restoration time is significantly related to biotic and abiotic variables that restrict species to different functional trait responses and to certain environment factors, such as soil water stress, species pool, and availability of nutrients [1,2]. We also assume that water stress plays a vital role in the overall trait recovery patterns during succession in tropical monsoon forests, as reported by Lohbeck [11]. Lohbeck suggested that water stress could be the most important filter at the early successional stage in tropical seasonal dry forests. Some studies have also shown that micro-climatic conditions change from dry and hot to relatively moist and cool with increasing recovery [11,17,18,57]. Most species during early successional stresses are deciduous, possibly leading to lower leaf life spans [11,40]. In our study, the species in the 40-year-successional stage used conservative strategies such as higher deciduousness, lower SLA, and higher LDMC, probably to reduce transpiration and water loss during high temperature and drought conditions where micro-climates lead to a low water availability. Previous studies in the tropical monsoon forests of Xishuangbanna also showed that the species are susceptible to water variability and have lower canopy photosynthesis, slower stand growth, and higher mortality rates during the dry season throughout severe drought years [58], which is associated with conservative traits, such as lower LAI [59]. The presence of species in old-growth forests may be affected by high light interception and water use in combination with acquisitive strategies such as evergreen, higher SLA, and lower LDMC, which have also been reported in several studies of tropical dry forests [11,12,40], though these results vary from the studies in tropical humid forests during succession [60,61].
Soil nutrients were also important for forest growth and succession, and nutrient limitations may potentially alter forest growth, recovery rate, diversity, and productivity [21,62]. When the soil factors change from infertile sites to more fertile sites, species leaf traits often change from a resource-retaining strategy to resource-acquiring strategies [63]. Species and individuals with smaller leaves are preferred under infertile soil conditions, which leads to slow vegetation growth. Species with a higher SLA and tissue turnover may require high levels of soil nutrients during the rapid construction of foliar tissue [64]. In our study, soil TN, TP, and AN were higher in old-growth forests than in 40-year forests (Figure 6; TP: F = 87.21, p < 0.001; TN: F = 9.669, p < 0.001; AN: F = 24.08, p < 0.001), TK significantly increased with restoration time, and AK showed an increasing trend (Figure 6; TK: F = 26.05, p < 0.001; AK: F = 2.462, p > 0.05). Soil nutrients were also largely correlated with most of the leaf traits, especially LNC, LPC, and LKC. These results can explain the change in leaf trait strategy from conservative to acquisitive during succession.
Interestingly, the results show that wood density was significantly higher in old-growth forests, thus showing a strategy change from acquisition to conservation during succession. Wood density is a property [65], defined as oven dry mass divided by green volume. It has been recognized as key factor to determine native growth performance [65,66,67], and is often used for characterizing tree functionality due to its relevance to specific conductivity, water storage, efficiency and safety of hydraulic transport, growth rate, architecture and mechanical support [30,68]. Wood diversified over millions of years in response to environmental change that has manifested into physiological and biomechanical changes [69], which also makes it relate to morphology, mechanics, physiology and ecology of the species [30].
Wood density is indeed a result of a certain combinations of hydraulic and mechanic traits [65]. Firstly, wood density is often negatively correlated with specific conductivity [70] and capacitance [71], and positively with hydraulic efficiency [72], which may result from the void volume that is potentially available for water. Species with low density tend to have highly conductive sapwood and store considerable water in their stems, while high wood density tends to be more resistant to xylem cavitation [73]. When water availability is high, wider vessels with high hydraulic efficiency and thinner cell walls are usually produced, while xylem embolism resistance is decreased [74]. However, leaf phenology can modify this relationship [75]. Tropical drought-deciduous tree species produce large vessels with high hydraulic efficiencies by shedding their leaves in dry season, while evergreen species produces very narrow vessels, resulting in low hydraulic efficiency, high wood density and resistance to cavitation, i.e., these wood can compensate more negative leaf water potentials [76]. Therefore, in our study the deciduous species dominant in the secondary forests had lower wood density than those evergreen species in old-growth forests.
Secondarily, wood density is also positively correlated with resistance to drought-induced embolism [55] and many mechanical properties such as stiffness and strength [77], which result from the co-evolution of safety factors against hydraulic failure and mechanical failure [78,79]. Tropical tree species with high wood density are more cavitation resistant and structurally better enforced stem material than species with low wood density [80]. The species with high wood density probably produce narrower vessels to attain more resistant to vessel implosion [36,81], and they invest more biomass on the stem to facilitate mechanical support to achieve higher survival rates [30]. While the species with low wood density can grow fast, probably because of their low cost in stem construction, and their high assimilation rates that come along with their conductive stem tissues [82]. In our study, the higher wood density in old-growth forests showed their stronger drought tolerance and better mechanical support than those in secondary forests [30]. The result supports previous results observed in tropical humid forest succession [11,57,83], and some previous studies in tropical dry forests [83,84], but differs from the study of Lohbeck et al. [11].
Different from our assumptions, seed mass also revealed no significant changes with succession. Seed mass is a good indicator of reproductive output per unit [85]. Small-seeded, wind-dispersed species are preferred in open (recently abandoned) sites during the early stages of succession [86], whereas large-seed species are more commonly animal-dispersed, enhancing directed dispersal to safe sites [87]. Some studies have found that the acquisitive–conservative continuum for seed mass changes from many small seeds to few large seeds in tropical dry forests [30,83,84]. In the present study, seed mass showed no significant changes with succession. The reason for this observation might be due to biological factors hindering seed dispersal, such as a lack of dispersal animal agents.

4.3. Recovery of Functional Diversity in Tropical Monsoon Forests

Our results demonstrate that functional richness significantly increased with succession—functional evenness was highest in 60-year-old forests, followed by 40-year-old forests, and lowest in old-growth forests. Functional divergence showed no significant changes.
Functional richness represents the variation in functional space dimensionality caused by community structure [3]. Functional richness was mostly affected by the addition or removal of species with unique biological trait categories, with lower functional richness values reflecting assembly via habitat filtering and tended to monotonically change with species richness. In the 40-year-old forests, the lower functional richness caused by local environmental factors following a shift in cultivation (e.g., water stress, available soil nutrients, limited dispersal, and post-dispersal environmental filtering) allowed most pioneer and deciduous species to survive [88]. Resulting species were found with similar traits due to habit filtering which reduced the trait dimensionality. With increasing forest succession, the power of environmental filtering decreased, and competitive exclusion became more important for community assembly, gradually reducing the dominant species in the 40-year and 60-year forests. Shade-tolerant species became dominant in old-growth forests due to their high moisture and soil nutrient content [11]. Functional richness was enhanced due to the addition of shade-tolerant and rare species into the community. These new recruits might occupy the species functional space, thus offsetting the lost functional space by pioneer species. For example, pioneer species, such as C. echinocarpa and A. yunnanensis, which were dominant in the 40-year and 60-year forests, were gradually eliminated and mainly replaced by S. ternate, B. ramiflora, P. simiarum subsp. cheliensis, P. chinensis, A. yunnanensis, and G. subaequalis in the old-growth forests.
Functional evenness is represented by the regularity of distribution. The measure of functional evenness might be a method to assess trait values and abundances, but higher values are observed for community assembly via competitive exclusion [89]. Functional divergence is represented by the divergence in the distribution of species traits within the trait volume occupied, and is highly influenced by the functional dissimilarities among numerically-dominant species. Additionally, our study shows that the functional evenness and functional divergence increased in 60-year compared to 40-year-old forests. From 60-year-old to old-growth forests, functional evenness significantly decreased, and functional divergence showed a decreasing tendency. The increase from 40- to 60-year-old forests could be attributed to the loss in pioneer species, such as C. echinocarpa and A. yunnanensis, and the recruitment of evergreen and exclusive species, causing the functional strategies to not correspond to the strategies now present with the progression of succession [14]. The decrease in functional evenness and divergence from the 60-year-old to old-growth forests might be caused by the loss of pioneer and deciduous species, such as C. echinocarpa and A. yunnanensis, which dominated in secondary forests. These results suggest that species replacement is associated with functional traits, and functional niche spaces in the tropical monsoon forests are potentially evenly distributed across a range of old-growth forests. However, the pattern of niche differentiation might be modified by human activities like shifting cultivation.

5. Conclusions

The study results show that stem density was relatively high in the 60-year-old recovery forests, but the species composition of different tree size classes was significantly lower in secondary than in old-growth forests, especially for adult trees. Species richness (S), the Shannon–Weaver index (H) and Pielou’s evenness (J) significantly increased with succession stage. Overall, the study results show a slow recovery rate during secondary succession in tropical monsoon forests.
Our findings also show that leaf trait strategies changed from conservation to acquisition during succession in tropical monsoon forests, which supported some previous studies of tropical dry forests [11,12,40], but the responses were different to those observed in tropical humid forests [60,61]. Wood density changed from acquisitive to conservative strategies which is similar to some reports focused on tropical humid forest succession [11,57,83], and seed mass showed no significant changes. Functional richness significantly increased with succession. Functional evenness was highest in the 60-year-old forests, followed by the 40-year-old forests, and was lowest in the old-growth forests. Functional divergence showed no significant changes but had a higher tendency in 60-year-old forests.
Restoration time was a key variable that determined the changes in forest structure, species composition, leaf trait strategies, and species and functional diversity during succession that acted on plant functional traits to constrain species to a particular set of environment conditions, such as the species pool, soil water stress, and nutrient availability [2]. We presume that water stress plays an important role in the overall trait recovery patterns during the succession of tropical monsoon forests. Lohbeck [11] reported that water stress was the most important filter during the early successional stage in tropical seasonal dry forests. Most species that can successfully survive the early successional stresses would have deciduous leaves, possibly leading to lower leaf life spans [11,40]. These results are different from those observed in tropical humid forest succession [60,61], where light plays a critical role in determining the community assembly and functional composition.
Soil nutrient availability also plays a significant role in tropical forest growth, especially under conditions of limited nutrients [2], which potentially determines the forest growth, recovery rate, diversity, and productivity [21,62]. The results also show that soil nutrients were largely correlated with most of the leaf traits, especially LNC, LPC, and LKC, but weakly related to wood and seed traits, and species and functional diversity.
Our study indicates that the recovery of tropical monsoon forests is rather slow—secondary stands were less community structured and had less species and functional diversity than the old-growth stands, even after about half a century of recovery, highlighting the importance of conservation for old growth tropical monsoon forest ecosystems. We suggest restoration time was a key variable that determined the changes in forest structure, species composition, functional traits, and diversity, which was related to water stress and available soil nutrients.

Supplementary Materials

Supplementary File 1

Author Contributions

Z.R. designed this study, developed and implemented the sampling design, reviewed and edited the writing. D.F. and H.Y. collaborated on Funding acquisition, data analyses, and wrote the original draft.

Funding

This study was funded by the National Natural Science Foundation of China (31460112 and 31100391).

Acknowledgments

We were very grateful to Kingsly Bengd and Kycle W. Tomsilon, for the valuable comments of the editor and reviewers for improvements to the early manuscript, and to Ding Yi for his assistance with some parts of R programming, and to the Xishuangbanna Ecological Station for support of field work and data management.

Conflicts of Interest

The authors declare no conflicts of interest.

Appendix A

Table A1. Tree species composition for three recovery forests (p < 0.05): 40-year-old forests (40-year), 60-year-old forests (60-year) and old-growth forest (old). The number of observed stems for each species and the indicator species value were shown. Significant associations with each of the different restored forests were tested using the probabilities of obtaining as great an indicator value as observed over 1000 iterations (p). Parameters and abbreviation: 40-year-old forests (40y), 60-year-old forests (60y), old-growth forests (OG).
Species40y60yOGPreferred TimeIndicator Valuep
Castanopsis echinocarpa Miq.259201040y56.30.0022
Aporosa yunnanensis (Pax & K.Hoffm.) F.P.Metcalf11365140y63.10.0004
Cyclobalanopsis fleuryi (Hickel & A.Camus) W.T.Chun610040y72.70.0002
Castanopsis hystrix Miq.3715140y57.10.0018
Castanopsis mekongensis A.Camus3114140y55.10.0036
Adenanthera pavonina L.181040y68.90.0002
Ternstroemia gymnanthera (Wight & Arn.) Sprague70040y36.40.0252
Winchia calophylla A.DC.61040y390.0272
Machilus austroguizhouensis S.K. Lee & F.N. Wei891431160y58.80.0006
Ardisia tenera Mez22632160y48.60.0376
Garcinia yunnanensis Hu201251760y77.20.0002
Pittosporopsis kerrii Craib1915511260y54.20.0056
Engelhardtia spicata Lechen ex Blume619160y39.90.0442
Metadina trichotoma (Zoll. & Moritzi) Bakh.f.512160y42.40.0326
Memecylon polyanthum H.L. Li219060y57.60.001
Syzygium forrestii Merr. & L.M.Perry210060y45.50.0108
Litchi chinensis Sonn.0261060y52.50.0072
Artocarpus heterophyllus Lam033660y61.50.0006
Elae spp.030360y49.60.0062
Alchornea tiliifolia (Benth.) Müll.Arg.025160y69.90.0002
Cryptocarya densiflora Blume011060y45.50.0048
Schefflera octophylla (Lour.) Harms010060y54.50.0012
Barringtonia racemosa (L.) Spreng.09060y54.50.0016
Xanthophyllum siamense Comm.4012Old40.90.0068
Macropanax oreophilus Miq.3115Old43.10.021
Saprosma ternatum (Wall.) Hook.f.0071Old63.60.0004
Baccaurea ramiflora Lour.0144Old97.80.0002
Polyalthia cheliensis Hu0042Old63.60.0008
Parashorea chinensis Hsie Wang0039Old63.60.0002
Aidia yunnanensis (Hutch.) T.Yamaz.0029Old63.60.0002
Gironniera subaequalis Planch.0228Old67.90.0002
Diospyros xishuangbannaensis C.Y.Wu & H.Chu0028Old63.60.0002
Drypetes indica (Müll.Arg.) Pax & K.Hoffm.0620Old62.90.0006
Diospyros atrotricha H.W.Li0113Old42.20.008
Chisocheton siamensis Craib0013Old45.50.0046
Diospyros nigrocortex C.Y.Wu0013Old36.40.025
Knema linifolia (Roxb.) Warb.0812Old49.10.0076
Ficus langkokensis Drake0011Old63.60.0002
Cinnamomum bejolghota (Buch.-Ham.) Sweet0011Old45.50.0056
Dysoxylum excelsum Blume0010Old54.50.0022
Antidesma montanum Blume009Old63.60.0008
Dichapetalum gelonioides (Roxb.) Engl.008Old63.60.0006
Pometia tomentosa (Blume) Teijsm. & Binn.007Old54.50.0018
Eurya acromonodontus W.R.Barker006Old36.40.022
Garcinia lancilimba C.Y.Wu ex Y.H.Li005Old45.50.0048
Dysoxylum binectariferum (Roxb.) Hook.f. ex Bedd.005Old36.40.0308
Cryptocarya yunnanensis H.W.Li004Old36.40.0238

References

  1. Vicente-Silva, J.; Bergamin, R.S.; Zanini, K.J.; Pillar, V.D.; Müller, S.C. Assembly patterns and functional diversity of tree species in a successional gradient of Araucaria forest in Southern Brazil. Nat. Conserv. 2016, 14, 67–73. [Google Scholar] [CrossRef]
  2. Boukili, V.K.; Chazdon, R.L. Environmental filtering, local site factors and landscape context drive changes in functional trait composition during tropical forest succession. Perspect. Plant Ecol. Evol. Syst. 2017, 24, 37–47. [Google Scholar] [CrossRef]
  3. Mouchet, M.A.; Villéger, S.; Mason, N.W.H.; Mouillot, D. Functional diversity measures: An overview of their redundancy and their ability to discriminate community assembly rules. Funct. Ecol. 2010, 24, 867–876. [Google Scholar] [CrossRef]
  4. Lebrija-Trejos, E.; Pérez-García, E.A.; Meave, J.A.; Bongers, F.; Poorter, L. Functional traits and environmental filtering drive community assembly in a species-rich tropical system. Ecology 2010, 91, 386–398. [Google Scholar] [CrossRef] [PubMed]
  5. Lasky, J.R.; Uriarte, M.; Boukili, V.K.; Chazdon, R.L. Trait-mediated assembly processes predict successional changes in community diversity of tropical forests. Proc. Natl. Acad. Sci. USA 2014, 111, 5616–5621. [Google Scholar] [CrossRef] [PubMed] [Green Version]
  6. Meiners, S.J.; Cadotte, M.W.; Fridley, J.D.; Pickett, S.T.A.; Walker, L.R. Is successional research nearing its climax? New approaches for understanding dynamic communities. Funct. Ecol. 2015, 29, 154–164. [Google Scholar] [CrossRef] [Green Version]
  7. Westoby, M.; Wright, I.J. Land-plant ecology on the basis of functional traits. Trends Ecol. Evol. 2006, 21, 261–268. [Google Scholar] [CrossRef] [PubMed]
  8. Laughlin, D.C.; Joshi, C.; van Bodegom, P.M.; Bastow, Z.A.; Fulé, P.Z. A predictive model of community assembly that incorporates intraspecific trait variation. Ecol. Lett. 2012, 15, 1291–1299. [Google Scholar] [CrossRef] [PubMed]
  9. Menge, D.N.L.; Chazdon, R.L. Higher survival drives the success of nitrogen-fixing trees through succession in Costa Rican rainforests. New Phytol. 2015, 209, 965–977. [Google Scholar] [CrossRef] [PubMed] [Green Version]
  10. Vieira, D.L.M.; Scariot, A. Principles of natural regeneration of tropical dry forests for restoration. Restor. Ecol. 2006, 14, 11–20. [Google Scholar] [CrossRef]
  11. Lohbeck, M.; Lebrija-Trejos, E.; Martínez-Ramos, M.; Meave, J.A.; Poorter, L.; Bongers, F. Functional trait strategies of trees in dry and wet tropical forests are similar but differ in their consequences for succession. PLoS ONE 2015, 10, e0123741. [Google Scholar] [CrossRef] [PubMed]
  12. Poorter, L. Leaf traits show different relationships with shade tolerance in moist versus dry tropical forests. New Phytol. 2009, 181, 890–900. [Google Scholar] [CrossRef] [PubMed]
  13. Plourde, B.T.; Boukili, V.K.; Chazdon, R.L. Radial changes in wood specific gravity of tropical trees: Inter- and intra-specific variation during secondary succession. Funct. Ecol. 2015, 29, 111–120. [Google Scholar] [CrossRef]
  14. Lohbeck, M.; Poorter, L.; Paz, H.; Pla, L.; van Breugel, M.; Martínez-Ramos, M.; Bongers, F. Functional diversity changes during tropical forest succession. Perspect. Plant Ecol. Evol. Syst. 2012, 14, 89–96. [Google Scholar] [CrossRef]
  15. Bu, W.; Zang, R.; Ding, Y. Field observed relationships between biodiversity and ecosystem functioning during secondary succession in a tropical lowland rainforest. Acta Oecol. 2014, 55, 1–7. [Google Scholar] [CrossRef]
  16. Lohbeck, M.; Poorter, L.; Martínez-Ramos, M.; Bongers, F. Biomass is the main driver of changes in ecosystem process rates during tropical forest succession. Ecology 2015, 96, 1242–1252. [Google Scholar] [CrossRef] [PubMed]
  17. Lebrija-Trejos, E.; Perez, G.E.A.; Meave, J.A.; Poorter, L.; Bongers, F. Environmental changes during secondary succession in a tropical dry forest in Mexico. J. Trop. Ecol. 2011, 27, 477–489. [Google Scholar] [CrossRef] [Green Version]
  18. Pineda-Garcı’a, F.; Paz, H.; Meinzer, F.C. Drought resistance in early and late secondary successional species from a tropical dry forest: The interplay between xylem resistance to embolism, sapwood water storage and leaf shedding. Plant Cell Environ. 2013, 36, 405–418. [Google Scholar] [CrossRef] [PubMed]
  19. Balvanera, P.; Quijas, S.; Perez-Jimenez, A. Distribution patterns of tropical dry forest trees along a mesoscale water availability gradient. Biotropica 2011, 43, 414–422. [Google Scholar] [CrossRef]
  20. Ding, Y.; Zang, R.; Liu, S.; He, F.; Letcher, S.G. Recovery of woody plant diversity in tropical rain forests in southern China after logging and shifting cultivation. Biol. Conserv. 2012, 145, 225–233. [Google Scholar] [CrossRef]
  21. Guariguata, M.R.; Ostertag, R. Neotropical secondary forest succession: Changes in structural and functional characteristics. For. Ecol. Manag. 2001, 148, 185–206. [Google Scholar] [CrossRef]
  22. Wright, S.J.; Kitajima, K.; Kraft, N.J.B.; Reich, P.B.; Wright, I.J.; Bunker, D.E.; Condit, R.; Dalling, J.W.; Davies, S.J.; Díaz, S.; et al. Functional traits and the growth—Mortality trade-off in tropical trees. Ecology 2010, 91, 3664–3674. [Google Scholar] [CrossRef] [PubMed]
  23. Wu, Z.Y. Vegetation of China; Science Press: Beijing, China, 1980; pp. 363–397. [Google Scholar]
  24. Editorial Committee of Flora of China. Flora Reipublicae Popularis Sinicae; Science Press: Beijing, China, 1988. [Google Scholar]
  25. Long, W.; Zang, R.; Schamp, B.S.; Ding, Y. Within- and among-species variation in specific leaf area drive community assembly in a tropical cloud forest. Oecologia 2011, 167, 1103–1113. [Google Scholar] [CrossRef] [PubMed]
  26. Hoffmann, W.A.; Geiger, E.L.; Gotsch, S.G.; Rossatto, D.R.; Silva, L.C.R.; Lau, O.L.; Haridasan, M.; Franco, A.C. Ecological thresholds at the savanna-forest boundary: How plant traits, resources and fire govern the distribution of tropical biomes. Ecol. Lett. 2012, 15, 759–768. [Google Scholar] [CrossRef] [PubMed]
  27. Wright, I.J.; Reich, P.B.; Westoby, M.; Ackerly, D.D.; Baruch, Z.; Bongers, F.; Cavender-Bares, J.; Chapin, T.; Cornelissen, J.H.C.; Diemer, M.; et al. The worldwide leaf economics spectrum. Nature 2004, 428, 821–827. [Google Scholar] [CrossRef] [PubMed] [Green Version]
  28. Lu, X.; Zang, R.; Ding, Y.; Letcher, S.G.; Long, W.; Huang, Y. Variations and trade-offs in functional traits of tree seedlings during secondary succession in a tropical lowland rain forest. Biotropica 2014, 46, 404–414. [Google Scholar] [CrossRef]
  29. Poorter, L.; Bongers, F. Leaf traits are good predictors of plant performance across 53 rain forest species. Ecology 2006, 87, 1733–1743. [Google Scholar] [CrossRef]
  30. Chave, J.; Coomes, D.; Lewis, O.T.; Swenson, N.G.; Zanne, A.E. Towards a worldwide wood economics spectrum. Ecol. Lett. 2009, 12, 351–366. [Google Scholar] [CrossRef] [PubMed] [Green Version]
  31. Poorter, L.; Wright, S.J.; Paz, H.; Ackerly, D.D.; Condit, R.; Ibarra-Manríquez, G.; Harms, K.E.; Licona, J.C.; Martínez-Ramos, M.; Mazer, S.J.; et al. Are Functional Traits Good Predictors of Demographic Rates? Evidence from Five Neotropical Forests. Ecology 2008, 89, 1908–1920. [Google Scholar] [CrossRef] [PubMed]
  32. Niinemets, Ü. Research review. Components of leaf dry mass per area—Thickness and density—Alter leaf photosynthetic capacity in reverse directions in woody plants. New Phytol. 1999, 144, 35–47. [Google Scholar] [CrossRef]
  33. Cornelissen, J.H.C. A handbook of protocols for standardised and easy measurement of plant functional traits worldwide. Aust. J. Bot. 2003, 51, 335–380. [Google Scholar] [CrossRef] [Green Version]
  34. Zhang, J.; Cheng, K.; Zang, R.; Ding, Y. Environmental filtering of species with different functional traits into plant assemblages across a tropical coniferous-broadleaved forest ecotone. Plant Soil 2014, 380, 361–374. [Google Scholar] [CrossRef]
  35. Gusmán-M, E.; de la Cruz, M.; Espinosa, C.I.; Escudero, A. Focusing on individual species reveals the specific nature of assembly mechanisms in a tropical dry-forest. Perspect. Plant Ecol. Evol. Syst. 2018. [Google Scholar] [CrossRef]
  36. Hoeber, S.; Leuschner, C.; Köhler, L.; Arias-Aguilar, D.; Schuldt, B. The importance of hydraulic conductivity and wood density to growth performance in eight tree species from a tropical semi-dry climate. For. Ecol. Manag. 2014, 330, 126–136. [Google Scholar] [CrossRef]
  37. Chave, J.; Muller-Landau, H.C.; Baker, T.R.; Easdale, T.A.; Steege, H.T.; Webb, C.O. Regional and phylogenetic variation of wood density across 2456 neotropical tree species. Ecol. Appl. 2006, 16, 2356–2367. [Google Scholar] [CrossRef]
  38. The State Forestry Administration. Seeds of Woody Plants in China; China Forestry Publishing House: Devon, UK, 2001.
  39. Kew, R.B.G. Seed Information Database (SID), Version 7.1. Available online: http://www.rbgkew.org. uk/data/sid/ (accessed on 1 May 2008).
  40. Maeshiro, R.; Kusumoto, B.; Fujii, S.; Shiono, T.; Kubota, Y. Using tree functional diversity to evaluate management impacts in a subtropical forest. Ecosphere 2013, 4, 1–17. [Google Scholar] [CrossRef]
  41. Díaz, S.; Lavorel, S.; de Bello, F.; Quétier, F.; Grigulis, K.; Robson, T.M. Incorporating plant functional diversity effects in ecosystem service assessments. Proc. Natl. Acad. Sci. USA 2007, 104, 20684–20689. [Google Scholar] [CrossRef] [PubMed] [Green Version]
  42. Tilman, D. Causes, consequences and ethics of biodiversity. Nature 2000, 405, 208–211. [Google Scholar] [CrossRef] [PubMed]
  43. Tilman, D. Functional Diversity. In Encyclopedia of Biodiversity; Levin, S.A., Ed.; Academic Press: San Diego, CA, USA, 2001; pp. 109–120. [Google Scholar]
  44. Lavorel, S.; Grigulis, K.; McIntyre, S.; Williams, N.S.G.; Garden, D.; Dorrough, J.; Berman, S.; Quétier, F.; Thébault, A.; Bonis, A. Assessing functional diversity in the field—Methodology matters! Funct. Ecol. 2008, 22, 134–147. [Google Scholar] [CrossRef]
  45. R Development Core Team. R: A Language and Environment for Statistical Computing; R Foundation for Statistical Computing: Vienna, Austria, 2014. [Google Scholar]
  46. Rangel, T.F.; Diniz, J.A.F.; Bini, L.M. SAM: A comprehensive application for spatial analysis in macroecology. Ecography 2010, 33, 46–50. [Google Scholar] [CrossRef]
  47. Dufrene, M.; Legendre, P. Species assemblages and indicator species: The need for a flexible asymmetrical approach. Ecol. Monogr. 1997, 67, 345–356. [Google Scholar] [CrossRef]
  48. Denslow, J.S.; Guzman, S. Variation in stand structure, light, and seedling abundance across a tropical moist forest chronosequence, Panama. J. Veg. Sci. 2000, 11, 201–212. [Google Scholar] [CrossRef]
  49. Letcher, S.G.; Chazdon, R.L. Rapid recovery of biomass, species richness, and species composition in a forest chronosequence in Northeastern Costa Rica. Biotropica 2009, 41, 608–617. [Google Scholar] [CrossRef]
  50. Oliver, C.D.; Larson, B.C. Forest Stand Dynamics; McGraw-Hill Publishing Company: New York, NY, USA, 1990. [Google Scholar]
  51. Hu, J.; Herbohn, J.; Chazdon, R.L.; Baynes, J.; Wills, J.; Meadows, J.; Sohel, M.S.I. Recovery of species composition over 46 years in a logged Australian tropical forest following different intensity silvicultural treatments. For. Ecol. Manag. 2018, 409, 660–666. [Google Scholar] [CrossRef]
  52. Lawrence, D. Erosion of tree diversity during 200 years of shifting cultivation in Bornean rain forest. Ecol. Appl. 2004, 14, 1855–1869. [Google Scholar] [CrossRef]
  53. Chazdon, R.L. Regenerating tropical forest ecosystems. In Encyclopedia of Biodiversity, 2nd ed.; Levin, S.A., Ed.; Academic Press: Waltham, MA, USA, 2013; pp. 277–286. [Google Scholar]
  54. Baker, P.J.; Bunyavejchewin, S.; Oliver, C.D.; Ashton, D.H. Disturbance history and historical stand dynamics of a seasonal tropical forest in Wentern Thailand. Ecol. Monogr. 2005, 75, 317–343. [Google Scholar] [CrossRef]
  55. Hacke, U.G.; Sperry, J.S.; Pockman, W.T.; Davis, S.D.; McCulloh, K.A. Trends in wood density and structure are linked to prevention of xylem implosion by negative pressure. Oecologia 2001, 126, 457–461. [Google Scholar] [CrossRef] [PubMed]
  56. Dent, D.H.; DeWalt, S.J.; Denslow, J.S. Secondary forests of central Panama increase in similarity to old-growth forest over time in shade tolerance but not species composition. J. Veg. Sci. 2013, 24, 530–542. [Google Scholar] [CrossRef]
  57. Lohbeck, M.; Poorter, L.; Martínez-Ramos, M.; Rodriguez-Velázquez, J.; van Breugel, M.; Bongers, F.; Dalling, J. Changing drivers of species dominance during tropical forest succession. Funct. Ecol. 2014, 28, 1052–1058. [Google Scholar] [CrossRef] [Green Version]
  58. Tan, Z.-H.; Cao, M.; Yu, G.-R.; Tang, J.-W.; Deng, X.-B.; Song, Q.-H.; Tang, Y.; Zheng, Z.; Liu, W.-J.; Feng, Z.-L.; et al. High sensitivity of a tropical rainforest to water variability: Evidence from 10 years of inventory and eddy flux data. J. Geophys. Res. Atmos. 2013, 118, 9393–9400. [Google Scholar] [CrossRef] [Green Version]
  59. Lin, H.; Cao, M.; Stoy, P.C.; Zhang, Y. Assessing self-organization of plant communities—A thermodynamic approach. Ecol. Model. 2009, 220, 784–790. [Google Scholar] [CrossRef]
  60. Baraloto, C.; Hardy, O.J.; Paine, C.E.T.; Dexter, K.G.; Cruaud, C.; Dunning, L.T.; Gonzalez, M.-A.; Molino, J.-F.; Sabatier, D.; Savolainen, V.; et al. Using functional traits and phylogenetic trees to examine the assembly of tropical tree communities. J. Ecol. 2012, 100, 690–701. [Google Scholar] [CrossRef] [Green Version]
  61. Carreño-Rocabado, G.; Peña-Claros, M.; Bongers, F.; Alarcón, A.; Licona, J.-C.; Poorter, L. Effects of disturbance intensity on species and functional diversity in a tropical forest. J. Ecol. 2012, 100, 1453–1463. [Google Scholar] [CrossRef] [Green Version]
  62. Kattge, J.; Díaz, S.; Lavorel, S.; Prentice, I.C.; Leadley, P.; Bönisch, G.; Garnier, E.; Westoby, M.; Reich, P.B.; Wright, I.J.; et al. TRY—A global database of plant traits. Glob. Chang. Biol. 2011, 17, 2905–2935. [Google Scholar] [CrossRef] [Green Version]
  63. Mason, N.W.H.; Richardson, S.J.; Peltzer, D.A.; de Bello, F.; Wardle, D.A.; Allen, R.B. Changes in coexistence mechanisms along a long-term soil chronosequence revealed by functional trait diversity. J. Ecol. 2012, 100, 678–689. [Google Scholar] [CrossRef] [Green Version]
  64. Coelho, M.S.; Carlos, P.P.; Pinto, V.D.; Meireles, A.; Negreiros, D.; Morellato, L.P.C.; Fernandes, G.W. Connection between tree functional traits and environmental parameters in an archipelago of montane forests surrounded by rupestrian grasslands. Flora 2018, 238, 51–59. [Google Scholar] [CrossRef]
  65. Lachenbruch, B.; McCulloh, K.A. Traits, properties, and performance how woody plants combine hydraulic and mechanical functions in a cell, tissue, or whole plant—Lachenbruch. New Phytol. 2014, 204, 747–764. [Google Scholar] [CrossRef] [PubMed]
  66. Padilha, D.L.; De Marco Júnior, P. A gap in the woods: Wood density knowledge as impediment to develop sustainable use in Atlantic. For. Ecol. Manag. 2018, 424, 448–457. [Google Scholar] [CrossRef]
  67. Ali, A.; Mattsson, E. Wood density is a sustainability indicator for the management of dry zone homegarden agroforests: Evidences from biodiversity–ecosystem function relationships. Ecol. Indic. 2018. [Google Scholar] [CrossRef]
  68. Zanne, A.E.; Westoby, M.; Falster, D.S.; Ackerly, D.D.; Loarie, S.R.; Arnold, S.E.J.; Coomes, D.A. Angiosperm wood structure: Global patterns in vessel anatomy and their relation to wood density and potential conductivity. Am. J. Bot. 2010, 97, 207–215. [Google Scholar] [CrossRef] [PubMed] [Green Version]
  69. Nguyen, H.; Firn, J.; Lamb, D.; Herbohn, J. Wood density: A tool to find complementary species for the design of mixed species plantations. For. Ecol. Manag. 2014, 334, 106–113. [Google Scholar] [CrossRef]
  70. Pratt, R.B.; Jacobsen, A.L.; Ewers, F.W.; Davis, S.D. Relationships among xylem transport, biomechanics and storage in stems and roots. New Phytol. 2007, 174, 787–798. [Google Scholar] [CrossRef] [PubMed]
  71. Scholz, F.G.; Bucci, S.J.; Goldstein, G.; Meinzer, F.C.; Franco, A.C.; Miralles-Wilhelm, F. Biophysical properties and functional significance of stem water storage tissues in Neotropical savanna trees. Plant Cell Environ. 2007, 30, 236–248. [Google Scholar] [CrossRef] [PubMed] [Green Version]
  72. Machado, S.R.; Rodella, R.A.; Angyalossy, V.; Marcati, C.R. Structural variations in root and stem wood of Styrax (Styracaceae) from Brazilian forest and cerrado. IAWA J. 2007, 28, 173–188. [Google Scholar] [CrossRef]
  73. Ackerly, Y. Functional strategies of chaparral shubs in relation to seaonal water defict and disturbance. Ecol. Monogr. 2004, 74, 25–44. [Google Scholar] [CrossRef]
  74. Choat, B.; Jansen, S.; Brodribb, T.J.; Cochard, H.; Delzon, S.; Bhaskar, R.; Bucci, S.J.; Feild, T.S.; Gleason, S.M.; Hacke, U.G.; et al. Global convergence in the vulnerability of forests to drought. Nature 2012, 491, 752–755. [Google Scholar] [CrossRef] [PubMed] [Green Version]
  75. Worbes, M.; Blanchart, S.; Fichtler, E. Relations between water balance, wood traits and phenological behavior of tree species from a tropical dry forest in Costa Rica—A multifactorial study. Tree Physiol. 2013, 33, 527–536. [Google Scholar] [CrossRef] [PubMed]
  76. Choat, B.; Ball, M.C.; Luly, J.G.; Holtum, J.A.M. Hydraulic architecture of deciduous and evergreen dry rainforest tree species from north-eastern Australia. Trees 2005, 19, 305–311. [Google Scholar] [CrossRef]
  77. Niklas, K.J.; Spatz, H.C. Wordwide correlation of mechanical properites and wood density. Am. J. Bot. 2010, 97, 1587–1594. [Google Scholar] [CrossRef] [PubMed]
  78. Pittermann, J.; Choat, B.; Jansen, S.; Stuart, S.A.; Lynn, L.; Dawson, T.E. The Relationships between Xylem Safety and Hydraulic Efficiency in the Cupressaceae: The Evolution of Pit Membrane Form and Function. Plant Physiol. 2010, 153, 1919–1931. [Google Scholar] [CrossRef] [PubMed] [Green Version]
  79. Lens, F.; Sperry, J.S.; Christman, M.A.; Choat, B.; Rabaey, D.; Jansen, S. Testing hypotheses that link wood anatomy to cavitation resistance and hydraulic conductivity in the genus Acer. New Phytol. 2011, 190, 709–723. [Google Scholar] [CrossRef] [PubMed]
  80. Markesteijn, L.; Poorter, H.; Paz, H.; Sack, L. Ecological dfferentiation in xylemcavitation resistance is associated with stem and leaf structural traits. Plant Cell Environ. 2011, 34, 137–148. [Google Scholar] [CrossRef] [PubMed]
  81. Lopez-Iglesias, B.; Villar, R.; Poorter, L. Functional traits predict drought performance and distribution of Mediterranean woody species. Acta Oecol. 2014, 56, 10–18. [Google Scholar] [CrossRef]
  82. Ster Steege, H.; Hammond, D.S. Character convergence, diversity, and distrubance in tropical rain forest in Guyana. Ecology 2001, 82, 3197–3212. [Google Scholar] [CrossRef]
  83. Lohbeck, M.; Poorter, L.; Lebrija-Teros, E.; Matrinez-Ramos, M.; Maeave, J.A.; Paz, H.; Perez-Garcia, E.A.; Romero-Perez, I.E.; Tauro, A.; Bongers, F. Successional changes in functional composition contrast for dry and wet tropical forest. Ecology 2013, 94, 1211–1216. [Google Scholar] [CrossRef] [PubMed] [Green Version]
  84. Foster, S.; Janson, C.H. The relationship between seed size and establishment conditions in tropical woody plants. Ecology 1985, 66, 773–780. [Google Scholar] [CrossRef]
  85. Dalling, J.W.; Hubbel, S.P. Seed size, growth rate and gap microsite conditions as determinants of recruitment success for pioneer species. J. Ecol. 2002, 90, 557–568. [Google Scholar] [CrossRef] [Green Version]
  86. Hammond, D.S.; Brown, W.K. Seed size of woody plants in relation to disturbance, dispersal, soil type in wet Neotropical forests. Ecology 1995, 76, 2544–2561. [Google Scholar] [CrossRef]
  87. Jansen, P.A.; Bongers, F.; van der Meer, P.J. Is farther seed dispersal better? Spatial patterns of offspring mortality in three rainforest tree species with different dispersal abilities? Ecography 2008, 31, 43–52. [Google Scholar] [CrossRef]
  88. Salvador-Van Eysenrode, D.; Bogaert, J.; van Hecke, P.; Impens, I. Forest canopy perforation in time and space in Amazonian Ecuador. Acta Oecol. 2000, 21, 285–291. [Google Scholar] [CrossRef]
  89. Villéger, S.; Mason, N.W.H.; Mouillot, D. New multidimensional functional diversity indices for a multifaceted framework in functional ecology. Ecology 2008, 89, 2290–2301. [Google Scholar] [CrossRef] [PubMed]
Figure 1. The multidimensional scaling (MDS) ordination plots of species abundance in tropical monsoon forests at different stages: the plots for 40-year forests were represented by the marks from S4001 to S4011; the plots for 60-year forests were represented by the marks from S6001 to S6011, and the plots for old-grown forests were represented by the marks from OG01 to OG11.
Forests 09 00506 g001
Figure 2. The species–area accumulation curves (AC), species–individual accumulation curves (DF), and species rank–abundance diagrams (GI) for saplings, treelets, and adult trees among the different recovery ages (40-year forests, 60-year forests, and old-growth forests) in the tropical monsoon forests. Saplings, 1 cm ≤ DBH < 5 cm; treelets, 5 cm ≤ DBH < 10 cm, and adult trees DBH ≥ 10 cm. DBH, diameter at breast height. Grey dashed lines represented 40-year forests, black dotted lines represented 60-year forests, and black solid lines represented old-growth forests.
Forests 09 00506 g002
Figure 3. The changes in species diversity (mean ± SD) with secondary succession of monsoon forests. Subfigures (AC) respectively showed the changes of species richness (S), Shannon -Weaver index (H) and Pielu’s evenn. The successional stages were 40-year-old forests (40y), 60-year-old forests (60y) and old-growth forests (OG). Different letters (a, b, c) demonstrated significant different at p < 0.05.
Forests 09 00506 g003
Figure 4. The changes in nine functional traits (mean ± SD) with the secondary succession of monsoon forests. Subfigures (AI) respectively showed the changes of deciduousness (Deciduous), specific leaf area (SLA), leaf dry matter content (LDMC), leaf nitrogen content (LNC), leaf phosphorus content (LPC,), leaf potassium content (LKC), leaf carbon content (LCC), wood density (WD) and mass (SMass, g). The nine functional traits using community-weighted means were computed based on tree basal area, and all traits were log-transformed. The successional stages were 40-year-old forests (40y), 60-year-old forests (60y), old-growth forests (OG). Different letters (a, b, c) demonstrated significant different at p < 0.05.
Forests 09 00506 g004
Figure 5. The changes in functional diversity (mean ± SD) with secondary succession of monsoon forests. Subfigures (AC) respectively showed the changes of functional richness (FRic), functional Evenness (FEven), functional divergence (FDiv). Functional diversity was computed based on the tree basal area and all traits were log-transformed. The successional stages were 40-year-old forests (40y), 60-year-old forests (60y) and old-growth forests (OG). Different letters (a, b, c) demonstrated significant different at p < 0.05.
Forests 09 00506 g005
Figure 6. Comparison of soil nutrient factors (mean ± SD) during succession in tropical monsoon forests. Subfigures (AH) respectively showed the changes of soil pH (pH), soil organic matter content (SOM), total nitrogen content (TN), total phosphorus content (TP), total potassium content (TK), available nitrogen content (AN), available phosphorus content (AP), available potassium content (AK). The successional stages were 40-year-old forests (40y), 60-year-old forests (60y) and old-growth forests (OG). Different letters (a, b, c) demonstrated significant different at p < 0.05.
Forests 09 00506 g006
Table 1. Number of stems, species, and species showing a significant preference for different tree sizes.
Tree SizeNo. of StemsNo. of SpeciesNo. Species Showing Preference
40y60yOGTotal40y60yOGTotal40y60yOGTotal
Saplings235482308102529476197411924
Treelets31242725199034486110169823
Adult trees27529627084123346894321217
Total8221205829285644651021358152447
Note: Preference for forest recovery stage was analyzed using an indicator species value [47]. Significant associations with each of the restored forests were tested using the probabilities of obtaining as great an indicator value as that observed over 1000 iterations. Parameters and abbreviation 40-year-old forests (40y), 60-year-old forests (60y), old-growth forests (OG).
Table 2. The selected models with delta Akaike information criterion (AIC), the importance of each environment parameter, the correlation direction, and residual spatial autocorrelation (RSA) (Moran’s values, p < 0.05, are in bold). The nine functional traits using community-weighted means and functional diversity were computed based on tree basal area. The data of environmental factors and functional richness, were log-transformed. Parameters and abbreviation: deciduousness (Deciduous), specific leaf area (SLA); leaf dry matter content (LDMC); leaf nitrogen content (LNC); leaf phosphorus content (LPC); leaf potassium content (LKC); leaf carbon content (LCC); wood density (WD); and seed mass (SMass, g); species richness (S), Shannon -Weaver index (H), Pielu’s evenness (J), functional richness (FRic), functional Evenness (FEven), functional divergence (FDiv); soil pH (pH), soil organic matter content (SOM), total nitrogen content (TN), total phosphorus content (TP), total potassium content (TK), available nitrogen content (AN), available phosphorus content (AP), available potassium content (AK).
DeciduousSLALDMCLNCLPCLKCLCCWDSmassSHJLog_FRicFEveFDiv
Model#219#484#493#457#107#363#484#255#194#131#1#384#226#481#380
r_adj0.7990.7770.6110.8060.8240.3170.6720.105−0.2920.6440.415−0.1970.384−0.3240.429
Rtime−0.976+0.664−0.442+0.695+0.863+0.293−0.314+0.67−0.982+0.991+0.971+0.219+0.987−0.38−0.217
Log_pH+0.382−0.577+0.492−0.544−0.917−0.6+0.329+0.444−0.317+0.275+0.216−0.458−0.217−0.239−0.531
Log_SOM+0.214−0.338+0.292−0.308−0.274−0.44+0.352−0.277+0.261+0.609+0.237−0.259+0.229+0.344+0.39
Log_TN−0.959+0.267+0.289+0.514+0.422−0.319+0.482+0.399+0.324−0.525+0.205+0.236−0.283−0.26−0.377
Log_TP−0.247+0.94−0.887+0.783+0.706+0.751−0.924+0.425+0.238+0.265+0.218+0.274−0.569−0.486+0.428
Log_TK+0.224−0.415+0.296−0.572−0.659+0.467+0.519−0.262+0.433−0.297+0.289+0.581−0.256−0.249−0.469
Log_AN+0.966+0.434−0.777−0.418−0.307+0.522−0.921−0.262+0.226+0.254+0.197+0.204+0.214−0.388−0.797
Log_AP−0.212+0.51−0.32+0.667−0.55+0.388−0.393−0.396+0.261+0.251+0.245−0.243+0.532+0.437+0.802
Log_AK+0.335+0.386+0.565+0.785+0.978−0.465+0.374+0.492+0.27−0.335+0.24+0.541+0.227−0.252+0.68
DistCntrMoran’s IMoran’s IMoran’s IMoran’s IMoran’s IMoran’s IMoran’s IMoran’s IMoran’s IMoran’s IMoran’s IMoran’s IMoran’s IMoran’s IMoran’s I
0.1990.023−0.187−0.156−0.169−0.189−0.105−0.2070.036−0.048−0.057−0.072−0.057−0.075−0.0460.187
0.601−0.165−0.113−0.031−0.117−0.077−0.1380.033−0.069−0.083−0.179−0.22−0.255−0.131−0.1280.229
1.1320.163−0.043−0.0890.025−0.012−0.022−0.0740.238−0.0050.1110.1540.0910.0940.0330.042
1.60.0050.2590.1120.2350.180.1480.069−0.0460.0580.0190.0070.036−0.074−0.154−0.115
1.873−0.274−0.113−0.015−0.133−0.026−0.1220.098−0.280.207−0.169−0.164−0.114−0.140.05−0.194
2.106−0.054−0.145−0.114−0.15−0.161−0.098−0.188−0.025−0.210.0050.1320.0720.1390.031−0.196
2.396−0.1220.1760.0640.1210.0990.1460.078−0.022−0.073−0.156−0.1730.014−0.24−0.025−0.244
2.7930.139−0.10.007−0.096−0.069−0.089−0.026−0.099−0.0590.1420.062−0.0480.1480.0520.057

