Plant Hydraulic Trait Covariation: A Global Meta-Analysis to Reduce Degrees of Freedom in Trait-Based Hydrologic Models


Abstract
1. Introduction
1.1. Functional Trait Covariation
1.2. Hydraulic Functional Strategies
1.3. Hydraulic Strategies and the Emergence of Plant Hydrodynamic Models
1.4. Hypotheses
2. Methods
3. Results
4. Discussion
5. Conclusions
Supplementary Materials
Author Contributions
Funding
Conflicts of Interest
References
- Ackerly, D.D.; Dudley, S.A.; Sultan, S.E.; Schmitt, J.; Coleman, J.S.; Linder, C.R.; Sandquist, D.R.; Geber, M.A.; Evans, A.S.; Dawson, T.E.; et al. The evolution of plant ecophysiological traits: Recent advances and future directions new research addresses natural selection, genetic constraints, and the adaptive evolution of plant ecophysiological traits. Bioscience 2000, 50, 979–995. [Google Scholar] [CrossRef]
- Freschet, G.T.; Cornelissen, J.H.C.; van Logtestijn, R.S.P.; Aerts, R. Evidence of the ‘plant economics spectrum’ in a subarctic flora. J. Ecol. 2010, 98, 362–373. [Google Scholar] [CrossRef]
- Chave, J.; Coomes, D.; Jansen, S.; Lewis, S.L.; Swenson, N.G.; Zanne, A.E. Towards a worldwide wood economics spectrum. Ecol. Lett. 2009, 12, 351–366. [Google Scholar] [CrossRef] [PubMed]
- Reich, P.B. The world-wide ‘fast-slow’ plant economics spectrum: A traits manifesto. J. Ecol. 2014, 102, 275–301. [Google Scholar] [CrossRef]
- Sakschewski, B.; von Bloh, W.; Boit, A.; Rammig, A.; Kattge, J.; Poorter, L.; Penuelas, J.; Thonicke, K. Leaf and stem economics spectra drive diversity of functional plant traits in a dynamic global vegetation model. Glob. Chang. Biol. 2015, 21, 2711–2725. [Google Scholar] [CrossRef] [PubMed]
- Wright, I.J.; Reich, P.B.; Westoby, M.; Ackerly, D.D.; Baruch, Z.; Bongers, F.; Cavender-Bares, J.; Chapin, T.; Cornelissen, J.H.C.; Diemer, M.; et al. The worldwide leaf economics spectrum. Nature 2004, 428, 821–827. [Google Scholar] [CrossRef] [PubMed]
- Reich, P.B.; Wright, I.J.; Lusk, C.H. Predicting leaf physiology from simple plant and climate attributes: A global glopnet analysis. Ecol. Appl. 2007, 17, 1982–1988. [Google Scholar] [CrossRef] [PubMed]
- Wright, I.J.; Reich, P.B.; Cornelissen, J.H.C.; Falster, D.S.; Garnier, E.; Hikosaka, K.; Lamont, B.B.; Lee, W.; Oleksyn, J.; Osada, N.; et al. Assessing the generality of global leaf trait relationships. New Phytol. 2005, 166, 485–496. [Google Scholar] [CrossRef] [PubMed]
- Messier, J.; McGill, B.J.; Lechowicz, M.J. How do traits vary across ecological scales? A case for trait-based ecology. Ecol. Lett. 2010, 13, 838–848. [Google Scholar] [CrossRef] [PubMed]
- Zhu, S.-D.; Chen, Y.-J.; Ye, Q.; He, P.-C.; Liu, H.P.; Li, R.-H.; Fu, P.-L.; Jiang, G.-F.; Cao, K.-F. Leaf turgor loss point is correlated with drought tolerance and leaf carbon economics traits. Tree Physiol. 2018, 38, 658–663. [Google Scholar] [CrossRef] [PubMed]
- Sack, L.; Holbrook, N.M. Leaf hydraulics. In Annual Review Plant biology; Annual Reviews: Palo Alto, CA, USA, 2006; Volume 57, pp. 361–381. [Google Scholar]
- Fu, P.-L.; Jiang, Y.-J.; Wang, A.-Y.; Brodribb, T.J.; Zhang, J.-L.; Zhu, S.-D.; Cao, K.-F. Stem hydraulic traits and leaf water-stress tolerance are co-ordinated with the leaf phenology of angiosperm trees in an Asian tropical dry karst forest. Ann. Bot. 2012, 110, 189–199. [Google Scholar] [CrossRef] [PubMed]
- Nardini, A.; Peda, G.; La Rocca, N. Trade-offs between leaf hydraulic capacity and drought vulnerability: Morpho-anatomical bases, carbon costs and ecological consequences. New Phytol. 2012, 196, 788–798. [Google Scholar] [CrossRef] [PubMed]
- Jin, Y.; Wang, C.K.; Zhou, Z.H.; Li, Z.M. Co-ordinated performance of leaf hydraulics and economics in 10 Chinese temperate tree species. Funct. Plant Biol. 2016, 43, 1082–1090. [Google Scholar] [CrossRef]
- Tyree, M.T.; Zimmermann, M.H. Xylem structure and the ascent of sap. In Xylem Structure and the Ascent of Sap; Springer: New York, NY, USA, 2002. [Google Scholar]
- Manzoni, S.; Vico, G.; Katul, G.G.; Palmroth, S.; Jackson, R.B.; Porporato, A. Hydraulic limits on maximum plant transpiration and the emergence of the safety-efficiency trade-off. New Phytol. 2013, 198, 169–178. [Google Scholar] [CrossRef] [PubMed]
- Gleason, S.M.; Westoby, M.; Jansen, S.; Choat, B.; Hacke, U.G.; Pratt, R.B.; Bhaskar, R.; Brodribb, T.J.; Bucci, S.J.; Cao, K.F.; et al. Weak tradeoff between xylem safety and xylem-specific hydraulic efficiency across the world’s woody plant species. New Phytol. 2016, 209, 123–136. [Google Scholar] [CrossRef] [PubMed]
- Matheny, A.M.; Mirfenderesgi, G.; Bohrer, G. Trait-based representation of hydrological functional properties of plants in weather and ecosystem models. Plant Divers. 2017, 39, 1–12. [Google Scholar] [CrossRef]
- Griffin-Nolan, R.J.; Bushey, J.A.; Carroll, C.J.W.; Challis, A.; Chieppa, J.; Garbowski, M.; Hoffman, A.M.; Post, A.K.; Slette, I.J.; Spitzer, D.; et al. Trait selection and community weighting are key to understanding ecosystem responses to changing precipitation regimes. Funct. Ecol. 2018. [Google Scholar] [CrossRef]
- Allen, C.D.; Macalady, A.K.; Chenchouni, H.; Bachelet, D.; McDowell, N.; Vennetier, M.; Kitzberger, T.; Rigling, A.; Breshears, D.D.; Hogg, E.H.; et al. A global overview of drought and heat-induced tree mortality reveals emerging climate change risks for forests. For. Ecol. Manag. 2010, 259, 660–684. [Google Scholar] [CrossRef]
- Anderegg, W.R.L.; Berry, J.A.; Smith, D.D.; Sperry, J.S.; Anderegg, L.D.L.; Field, C.B. The roles of hydraulic and carbon stress in a widespread climate-induced forest die-off. Proc. Natl. Acad. Sci. USA 2012, 109, 233–237. [Google Scholar] [CrossRef] [PubMed]
- Fu, R.; Yin, L.; Li, W.H.; Arias, P.A.; Dickinson, R.E.; Huang, L.; Chakraborty, S.; Fernandes, K.; Liebmann, B.; Fisher, R.; et al. Increased dry-season length over southern amazonia in recent decades and its implication for future climate projection. Proc. Natl. Acad. Sci. USA 2013, 110, 18110–18115. [Google Scholar] [CrossRef] [PubMed]
- Bonal, D.; Burban, B.; Stahl, C.; Wagner, F.; Herault, B. The response of tropical rainforests to drought-lessons from recent research and future prospects. Ann. For. Sci. 2016, 73, 27–44. [Google Scholar] [CrossRef] [PubMed]
- Phillips, O.L.; van der Heijden, G.; Lewis, S.L.; Lopez-Gonzalez, G.; Aragao, L.; Lloyd, J.; Malhi, Y.; Monteagudo, A.; Almeida, S.; Davila, E.A.; et al. Drought-mortality relationships for tropical forests. New Phytol. 2010, 187, 631–646. [Google Scholar] [CrossRef] [PubMed]
- McDowell, N.; Pockman, W.T.; Allen, C.D.; Breshears, D.D.; Cobb, N.; Kolb, T.; Plaut, J.; Sperry, J.S.; West, A.; Williams, D.G.; et al. Mechanisms of plant survival and mortality during drought: Why do some plants survive while others succumb to drought? New Phytol. 2008, 178, 719–739. [Google Scholar] [CrossRef] [PubMed]
- McDowell, N.G.; Fisher, R.A.; Xu, C.G.; Domec, J.C.; Holtta, T.; Mackay, D.S.; Sperry, J.S.; Boutz, A.; Dickman, L.; Gehres, N.; et al. Evaluating theories of drought-induced vegetation mortality using a multimodel-experiment framework. New Phytol. 2013, 200, 304–321. [Google Scholar] [CrossRef] [PubMed]
- Matheny, A.M.; Bohrer, G.; Vogel, C.S.; Morin, T.H.; He, L.; Frasson, R.P.M.; Mirfenderesgi, G.; Schäfer, K.V.R.; Gough, C.M.; Ivanov, V.Y.; et al. Species-specific transpiration responses to intermediate disturbance in a northern hardwood forest. J. Geophys. Res. 2014, 119, 2292–2311. [Google Scholar] [CrossRef]
- Ford, C.R.; Hubbard, R.M.; Kloeppel, B.D.; Vose, J.M. A comparison of sap flux-based evapotranspiration estimates with catchment-scale water balance. Agric. For. Meteorol. 2007, 145, 176–185. [Google Scholar] [CrossRef]
- Pappas, C.; Matheny, A.M.; Baltzer, J.L.; Barr, A.G.; Black, T.A.; Bohrer, G.; Detto, M.; Maillet, J.; Roy, A.; Sonnentag, O.; et al. Boreal tree hydrodynamics: Asynchronous, diverging, yet complementary. Tree Physiol. 2018, 38, 953–964. [Google Scholar] [CrossRef] [PubMed]
- McCulloh, K.A.; Johnson, D.M.; Meinzer, F.C.; Voelker, S.L.; Lachenbruch, B.; Domec, J.-C. Hydraulic architecture of two species differing in wood density: Opposing strategies in co-occurring tropical pioneer trees. Plant Cell Environ. 2012, 35, 116–125. [Google Scholar] [CrossRef] [PubMed]
- Breshears, D.D.; Myers, O.B.; Johnson, S.R.; Meyer, C.W.; Martens, S.N. Differential use of spatially heterogeneous soil moisture by two semiarid woody species: Pinus edulis and Juniperus monosperma. J. Ecol. 1997, 85, 289–299. [Google Scholar] [CrossRef]
- Anderegg, W.R.L.; Klein, T.; Bartlett, M.; Sack, L.; Pellegrini, A.F.A.; Choat, B.; Jansen, S. Meta-analysis reveals that hydraulic traits explain cross-species patterns of drought-induced tree mortality across the globe. Proc. Natl. Acad. Sci. USA 2016, 113, 5024–5029. [Google Scholar] [CrossRef] [PubMed]
- Bartlett, M.K.; Klein, T.; Jansen, S.; Choat, B.; Sack, L. The correlations and sequence of plant stomatal, hydraulic, and wilting responses to drought. Proc. Natl. Acad. Sci. USA 2016, 113, 13098–13103. [Google Scholar] [CrossRef] [PubMed]
- Bartlett, M.K.; Scoffoni, C.; Sack, L. The determinants of leaf turgor loss point and prediction of drought tolerance of species and biomes: A global meta-analysis. Ecol. Lett. 2012, 15, 393–405. [Google Scholar] [CrossRef] [PubMed]
- Bartlett, M.K.; Zhang, Y.; Kreidler, N.; Sun, S.W.; Ardy, R.; Cao, K.F.; Sack, L. Global analysis of plasticity in turgor loss point, a key drought tolerance trait. Ecol. Lett. 2014, 17, 1580–1590. [Google Scholar] [CrossRef] [PubMed]
- Maréchaux, I.; Bartlett, M.K.; Gaucher, P.; Sack, L.; Chave, J. Causes of variation in leaf-level drought tolerance within an amazonian forest. J. Plant Hydraul. 2016, 3, e004. [Google Scholar] [CrossRef]
- Choat, B.; Jansen, S.; Brodribb, T.J.; Cochard, H.; Delzon, S.; Bhaskar, R.; Bucci, S.J.; Feild, T.S.; Gleason, S.M.; Hacke, U.G.; et al. Global convergence in the vulnerability of forests to drought. Nature 2012, 491, 752–756. [Google Scholar] [CrossRef] [PubMed]
- Hoffmann, W.A.; Marchin, R.M.; Abit, P.; Lau, O.L. Hydraulic failure and tree dieback are associated with high wood density in a temperate forest under extreme drought. Glob. Chang. Biol. 2011, 17, 2731–2742. [Google Scholar] [CrossRef]
- Meinzer, F.C.; Woodruff, D.R.; Marias, D.E.; Smith, D.D.; McCulloh, K.A.; Howard, A.R.; Magedman, A.L. Mapping ‘hydroscapes’ along the iso- to anisohydric continuum of stomatal regulation of plant water status. Ecol. Lett. 2016, 19, 1343–1352. [Google Scholar] [CrossRef] [PubMed]
- Santiago, L.S.; De Guzman, M.E.; Baraloto, C.; Vogenberg, J.; Brodie, M.; Herault, B.; Fortunel, C.; Bonal, D. Coordination and trade-offs among hydraulic safety, efficiency, and drought avoidance traits in amazonian rainforest canopy tree species. New Phytol. 2018, 218, 1015–1024. [Google Scholar] [CrossRef] [PubMed]
- Matheny, A.M.; Fiorella, R.P.; Bohrer, G.; Poulsen, C.J.; Morin, T.H.; Wunderlich, A.; Vogel, C.S.; Curtis, P.S. Contrasting strategies of hydraulic control in two codominant temperate tree species. Ecohydrology 2017, 10, e1815. [Google Scholar] [CrossRef]
- Mirfenderesgi, G.; Bohrer, G.; Matheny, A.M.; Fatichi, S.; Frasson, R.P.M.; Schäfer, K.V.R. Tree level hydrodynamic approach for resolving aboveground water storage and stomatal conductance and modeling the effects of tree hydraulic strategy. J. Geophys. Res. 2016, 121, 1792–1813. [Google Scholar] [CrossRef]
- Fatichi, S.; Pappas, C.; Ivanov, V.Y. Modeling plant–water interactions: An ecohydrological overview from the cell to the global scale. Wiley Interdiscip. Rev. Water 2016, 3, 327–368. [Google Scholar] [CrossRef]
- Christoffersen, B.O.; Gloor, M.; Fauset, S.; Fyllas, N.M.; Galbraith, D.R.; Baker, T.R.; Kruijt, B.; Rowland, L.; Fisher, R.A.; Binks, O.J.; et al. Linking hydraulic traits to tropical forest function in a size-structured and trait-driven model (tfs v.1-hydro). Geosci. Model Dev. 2016, 9, 4227–4255. [Google Scholar] [CrossRef]
- Xu, X.; Medvigy, D.; Powers, J.S.; Becknell, J.M.; Guan, K. Diversity in plant hydraulic traits explains seasonal and inter-annual variations of vegetation dynamics in seasonally dry tropical forests. New Phytol. 2016, 121, 80–95. [Google Scholar] [CrossRef] [PubMed]
- Fisher, R.A.; Koven, C.D.; Anderegg, W.R.L.; Christoffersen, B.O.; Dietze, M.C.; Farrior, C.E.; Holm, J.A.; Hurtt, G.C.; Knox, R.G.; Lawrence, P.J.; et al. Vegetation demographics in earth system models: A review of progress and priorities. Glob. Chang. Biol. 2018, 24, 35–54. [Google Scholar] [CrossRef] [PubMed]
- Mirfenderesgi, G.; Matheny, A.M.; Bohrer, G. Hydrodynamics trait coordination and cost-benefit trade-offs throughout the isohydric-anisohydric continuum in trees. Ecohydrology 2017. accepted. [Google Scholar]
- Lawrence, D.; Fisher, R.; Koven, C.; Oleson, K.W.; Vertenstein, M.; Andre, B.; Bonan, G.; Ghimire, B.; van Kampenhout, L.; Kennedy, D.; et al. Technical Description of Version 5.0 of the Community Land Model (Clm); Research, N.C.f.A., Ed.; National Center for Atmospheric Research: Boulder, CO, USA, 2018. [Google Scholar]
- Gentine, P.; Guérin, M.; Uriarte, M.; McDowell, N.G.; Pockman, W.T. An allometry-based model of the survival strategies of hydraulic failure and carbon starvation. Ecohydrology 2015, 9, 529–546. [Google Scholar] [CrossRef]
- Roman, D.T.; Novick, K.A.; Brzostek, E.R.; Dragoni, D.; Rahman, F.; Phillips, R.P. The role of isohydric and anisohydric species in determining ecosystem-scale response to severe drought. Oecologia 2015, 179, 641–654. [Google Scholar] [CrossRef] [PubMed]
- Sperry, J.S.; Adler, F.R.; Campbell, G.S.; Comstock, J.P. Limitation of plant water use by rhizosphere and xylem conductance: Results from a model. Plant Cell Environ. 1998, 21, 347–359. [Google Scholar] [CrossRef]
- Matheny, A.M.; Garrity, S.R.; Bohrer, G. The calibration and use of capacitance sensors to monitor stem water content in trees. J. Vis. Exp. 2017, e57062. [Google Scholar] [CrossRef]
- Huang, C.-W.; Domec, J.-C.; Ward, E.J.; Duman, T.; Manoli, G.; Parolari, A.J.; Katul, G.G. The effect of plant water storage on water fluxes within the coupled soil–plant system. New Phytol. 2017, 213, 1093–1106. [Google Scholar] [CrossRef] [PubMed]
- Fatichi, S.; Ivanov, V.Y. Interannual variability of evapotranspiration and vegetation productivity. Water Resour. Res. 2014, 50, 3275–3294. [Google Scholar] [CrossRef]
- Sperry, J.S.; Venturas, M.D.; Anderegg, W.R.L.; Mencuccini, M.; Mackay, D.S.; Wang, Y.P.; Love, D.M. Predicting stomatal responses to the environment from the optimization of photosynthetic gain and hydraulic cost. Plant Cell Environ. 2017, 40, 816–830. [Google Scholar] [CrossRef] [PubMed]
- Wolf, A.; Anderegg, W.R.; Pacala, S.W. Optimal stomatal behavior with competition for water and risk of hydraulic impairment. Proc. Natl Acad. Sci. 2016, 113, E7222–E7230. [Google Scholar] [CrossRef] [PubMed]
- Kattge, J.; Diaz, S.; Lavorel, S.; Prentice, C.; Leadley, P.; Bonisch, G.; Garnier, E.; Westoby, M.; Reich, P.B.; Wright, I.J.; et al. Try—A global database of plant traits. Glob. Change Biol. 2011, 17, 2905–2935. [Google Scholar] [CrossRef]
- Martinez-Vilalta, J.; Poyatos, R.; Aguade, D.; Retana, J.; Mencuccini, M. A new look at water transport regulation in plants. New Phytol. 2014, 204, 105–115. [Google Scholar] [CrossRef] [PubMed]
- Medlyn, B.; Badeck, F.W.; De Pury, D.; Barton, C.; Broadmeadow, M.; Ceulemans, R.; De Angelis, P.; Forstreuter, M.; Jach, M.; Kellomäki, S. Effects of elevated [CO2] on photosynthesis in european forest species: A meta-analysis of model parameters. Plant Cell Environ. 1999, 22, 1475–1495. [Google Scholar] [CrossRef]
- Preston, K.A.; Cornwell, W.K.; DeNoyer, J.L. Wood density and vessel traits as distinct correlates of ecological strategy in 51 California coast range angiosperms. New Phytol. 2006, 170, 807–818. [Google Scholar] [CrossRef] [PubMed]
- Green, W.A. USDA Plants Compilation; Version 1; 09-02; 2009. Available online: https://plants.sc.egov.usda.gov/java/ (accessed on 25 July 2018).
- Fitter, A.H.; Peat, H.J. The ecological flora database. J. Ecol. 1994, 82, 415–425. [Google Scholar] [CrossRef]
- Diaz, S.; Hodgson, J.; Thompson, K.; Cabido, M.; Cornelissen, J.H.C.; Jalili, A.; Montserrat-Marti, G.; Grime, J.; Zarrinkamar, F.; Asri, Y. The plant traits that drive ecosystems: Evidence from three continents. J. Veg. Sci. 2004, 15, 295–304. [Google Scholar] [CrossRef]
- Zanne, A.E.; Westoby, M.; Falster, D.S.; Ackerly, D.D.; Loarie, S.R.; Arnold, S.E.; Coomes, D.A. Angiosperm wood structure: Global patterns in vessel anatomy and their relation to wood density and potential conductivity. Am. J. Bot. 2010, 97, 207–215. [Google Scholar] [CrossRef] [PubMed]
- Anderegg, W.R.L. Spatial and temporal variation in plant hydraulic traits and their relevance for climate change impacts on vegetation. New Phytol. 2015, 205, 1008–1014. [Google Scholar] [CrossRef] [PubMed]
- Skelton, R.P.; West, A.G.; Dawson, T.E. Predicting plant vulnerability to drought in biodiverse regions using functional traits. Proc. Natl. Acad. Sci. USA 2015, 112, 5744–5749. [Google Scholar] [CrossRef] [PubMed]
- Manzoni, S.; Katul, G.; Porporato, A. A dynamical system perspective on plant hydraulic failure. Water Resour. Res. 2014, 50, 5170–5183. [Google Scholar] [CrossRef]
- Manzoni, S.; Vico, G.; Katul, G.; Palmroth, S.; Porporato, A. Optimal plant water-use strategies under stochastic rainfall. Water Resour. Res. 2014, 50, 5379–5394. [Google Scholar] [CrossRef]
- Santiago, L.S.; Goldstein, G.; Meinzer, F.C.; Fisher, J.B.; Machado, K.; Woodruff, D.; Jones, T. Leaf photosynthetic traits scale with hydraulic conductivity and wood density in panamanian forest canopy trees. Oecologia 2004, 140, 543–550. [Google Scholar] [CrossRef] [PubMed]
- Zhou, S.X.; Medlyn, B.; Sabate, S.; Sperlich, D.; Prentice, I.C. Short-term water stress impacts on stomatal, mesophyll and biochemical limitations to photosynthesis differ consistently among tree species from contrasting climates. Tree Physiol. 2014, 34, 1035–1046. [Google Scholar] [CrossRef] [PubMed]
- Blackman, C.J.; Gleason, S.M.; Cook, A.M.; Chang, Y.; Laws, C.A.; Westoby, M. The links between leaf hydraulic vulnerability to drought and key aspects of leaf venation and xylem anatomy among 26 australian woody angiosperms from contrasting climates. Ann. Bot. 2018, 122, 59–67. [Google Scholar] [CrossRef] [PubMed]
- Anderegg, W.R.L.; Wolf, A.; Arango-Velez, A.; Choat, B.; Chmura, D.J.; Jansen, S.; Kolb, T.; Li, S.; Meinzer, F.C.; Pita, P.; et al. Woody plants optimise stomatal behaviour relative to hydraulic risk. Ecol. Lett. 2018, 21, 968–977. [Google Scholar] [CrossRef] [PubMed]
- Hochberg, U.; Rockwell, F.E.; Holbrook, N.M.; Cochard, H. Iso/anisohydry: A plant–environment interaction rather than a simple hydraulic trait. Trends Plant Sci. 2018, 23, 112–120. [Google Scholar] [CrossRef] [PubMed]
- Berger Landefeldt, U. Das wasserhaushalt der alpenflanzen. Bibl. Bot 1936, 115, 81. [Google Scholar]
- Voelker, S.L.; DeRose, R.J.; Bekker, M.F.; Sriladda, C.; Leksungnoen, N.; Kjelgren, R.K. Anisohydric water use behavior links growing season evaporative demand to ring-width increment in conifers from summer-dry environments. Trees 2018, 32, 735–749. [Google Scholar] [CrossRef]
- Konings, A.G.; Williams, A.P.; Gentine, P. Sensitivity of grassland productivity to aridity controlled by stomatal and xylem regulation. Nat. Geosci. 2017, 10, 284. [Google Scholar] [CrossRef]
- Anderegg, L.D.L.; Berner, L.T.; Badgley, G.; Sethi, M.L.; Law, B.E.; HilleRisLambers, J. Within-species patterns challenge our understanding of the leaf economics spectrum. Ecol. Lett. 2018, 21, 734–744. [Google Scholar] [CrossRef] [PubMed]
- Yang, Y.Z.; Zhu, Q.A.; Peng, C.H.; Wang, H.; Chen, H. From plant functional types to plant functional traits: A new paradigm in modelling global vegetation dynamics. Prog. Phys. Geogr. 2015, 39, 514–535. [Google Scholar] [CrossRef]
- Matheny, A.M.; Bohrer, G.; Stoy, P.C.; Baker, I.; Black, A.T.; Desai, A.R.; Dietze, M.; Gough, C.M.; Ivanov, V.Y.; Jassal, R.; et al. Characterizing the diurnal patterns of errors in the prediction of evapotranspiration by several land-surface models: An nacp analysis. J. Geophys. Res. 2014, 119, 1458–1473. [Google Scholar] [CrossRef]
- Sitch, S.; Smith, B.; Prentice, I.C.; Arneth, A.; Bondeau, A.; Cramer, W.; Kaplan, J.O.; Levis, S.; Lucht, W.; Sykes, M.T.; et al. Evaluation of ecosystem dynamics, plant geography and terrestrial carbon cycling in the lpj dynamic global vegetation model. Glob. Change Biol. 2003, 9, 161–185. [Google Scholar] [CrossRef]
- Sun, W.X.; Liang, S.L.; Xu, G.; Fang, H.L.; Dickinson, R. Mapping plant functional types from modis data using multisource evidential reasoning. Remote Sens. Environ. 2008, 112, 1010–1024. [Google Scholar] [CrossRef]
- Poulter, B.; Ciais, P.; Hodson, E.; Lischke, H.; Maignan, F.; Plummer, S.; Zimmermann, N.E. Plant functional type mapping for earth system models. Geosci. Model Dev. 2011, 4, 993–1010. [Google Scholar] [CrossRef]
- Pappas, C.; Fatichi, S.; Burlando, P. Modeling terrestrial carbon and water dynamics across climatic gradients: Does plant trait diversity matter? New Phytol. 2016, 209, 137–151. [Google Scholar] [CrossRef] [PubMed]
- Musavi, T.; Mahecha, M.D.; Migliavacca, M.; Reichstein, M.; van de Weg, M.J.; van Bodegom, P.M.; Bahn, M.; Wirth, C.; Reich, P.B.; Schrodt, F.; et al. The imprint of plants on ecosystem functioning: A data-driven approach. Int. J. Appl. Earth Obs. Geoinf. 2015, 43, 119–131. [Google Scholar] [CrossRef]
- Reichstein, M.; Bahn, M.; Mahecha, M.D.; Kattge, J.; Baldocchi, D.D. Linking plant and ecosystem functional biogeography. Proc. Natl Acad. Sci. USA 2014, 111, 13697–13702. [Google Scholar] [CrossRef] [PubMed]


| Mean Annual Temperature | MAT | Manzoni, et al. [16], Choat, et al. [37], Medlyn, et al. [59] |
|---|---|---|
| Mean annual precipitation | MAP | Manzoni, et al. [16], Choat, et al. [37], Medlyn, et al. [59], Preston, et al. [60] |
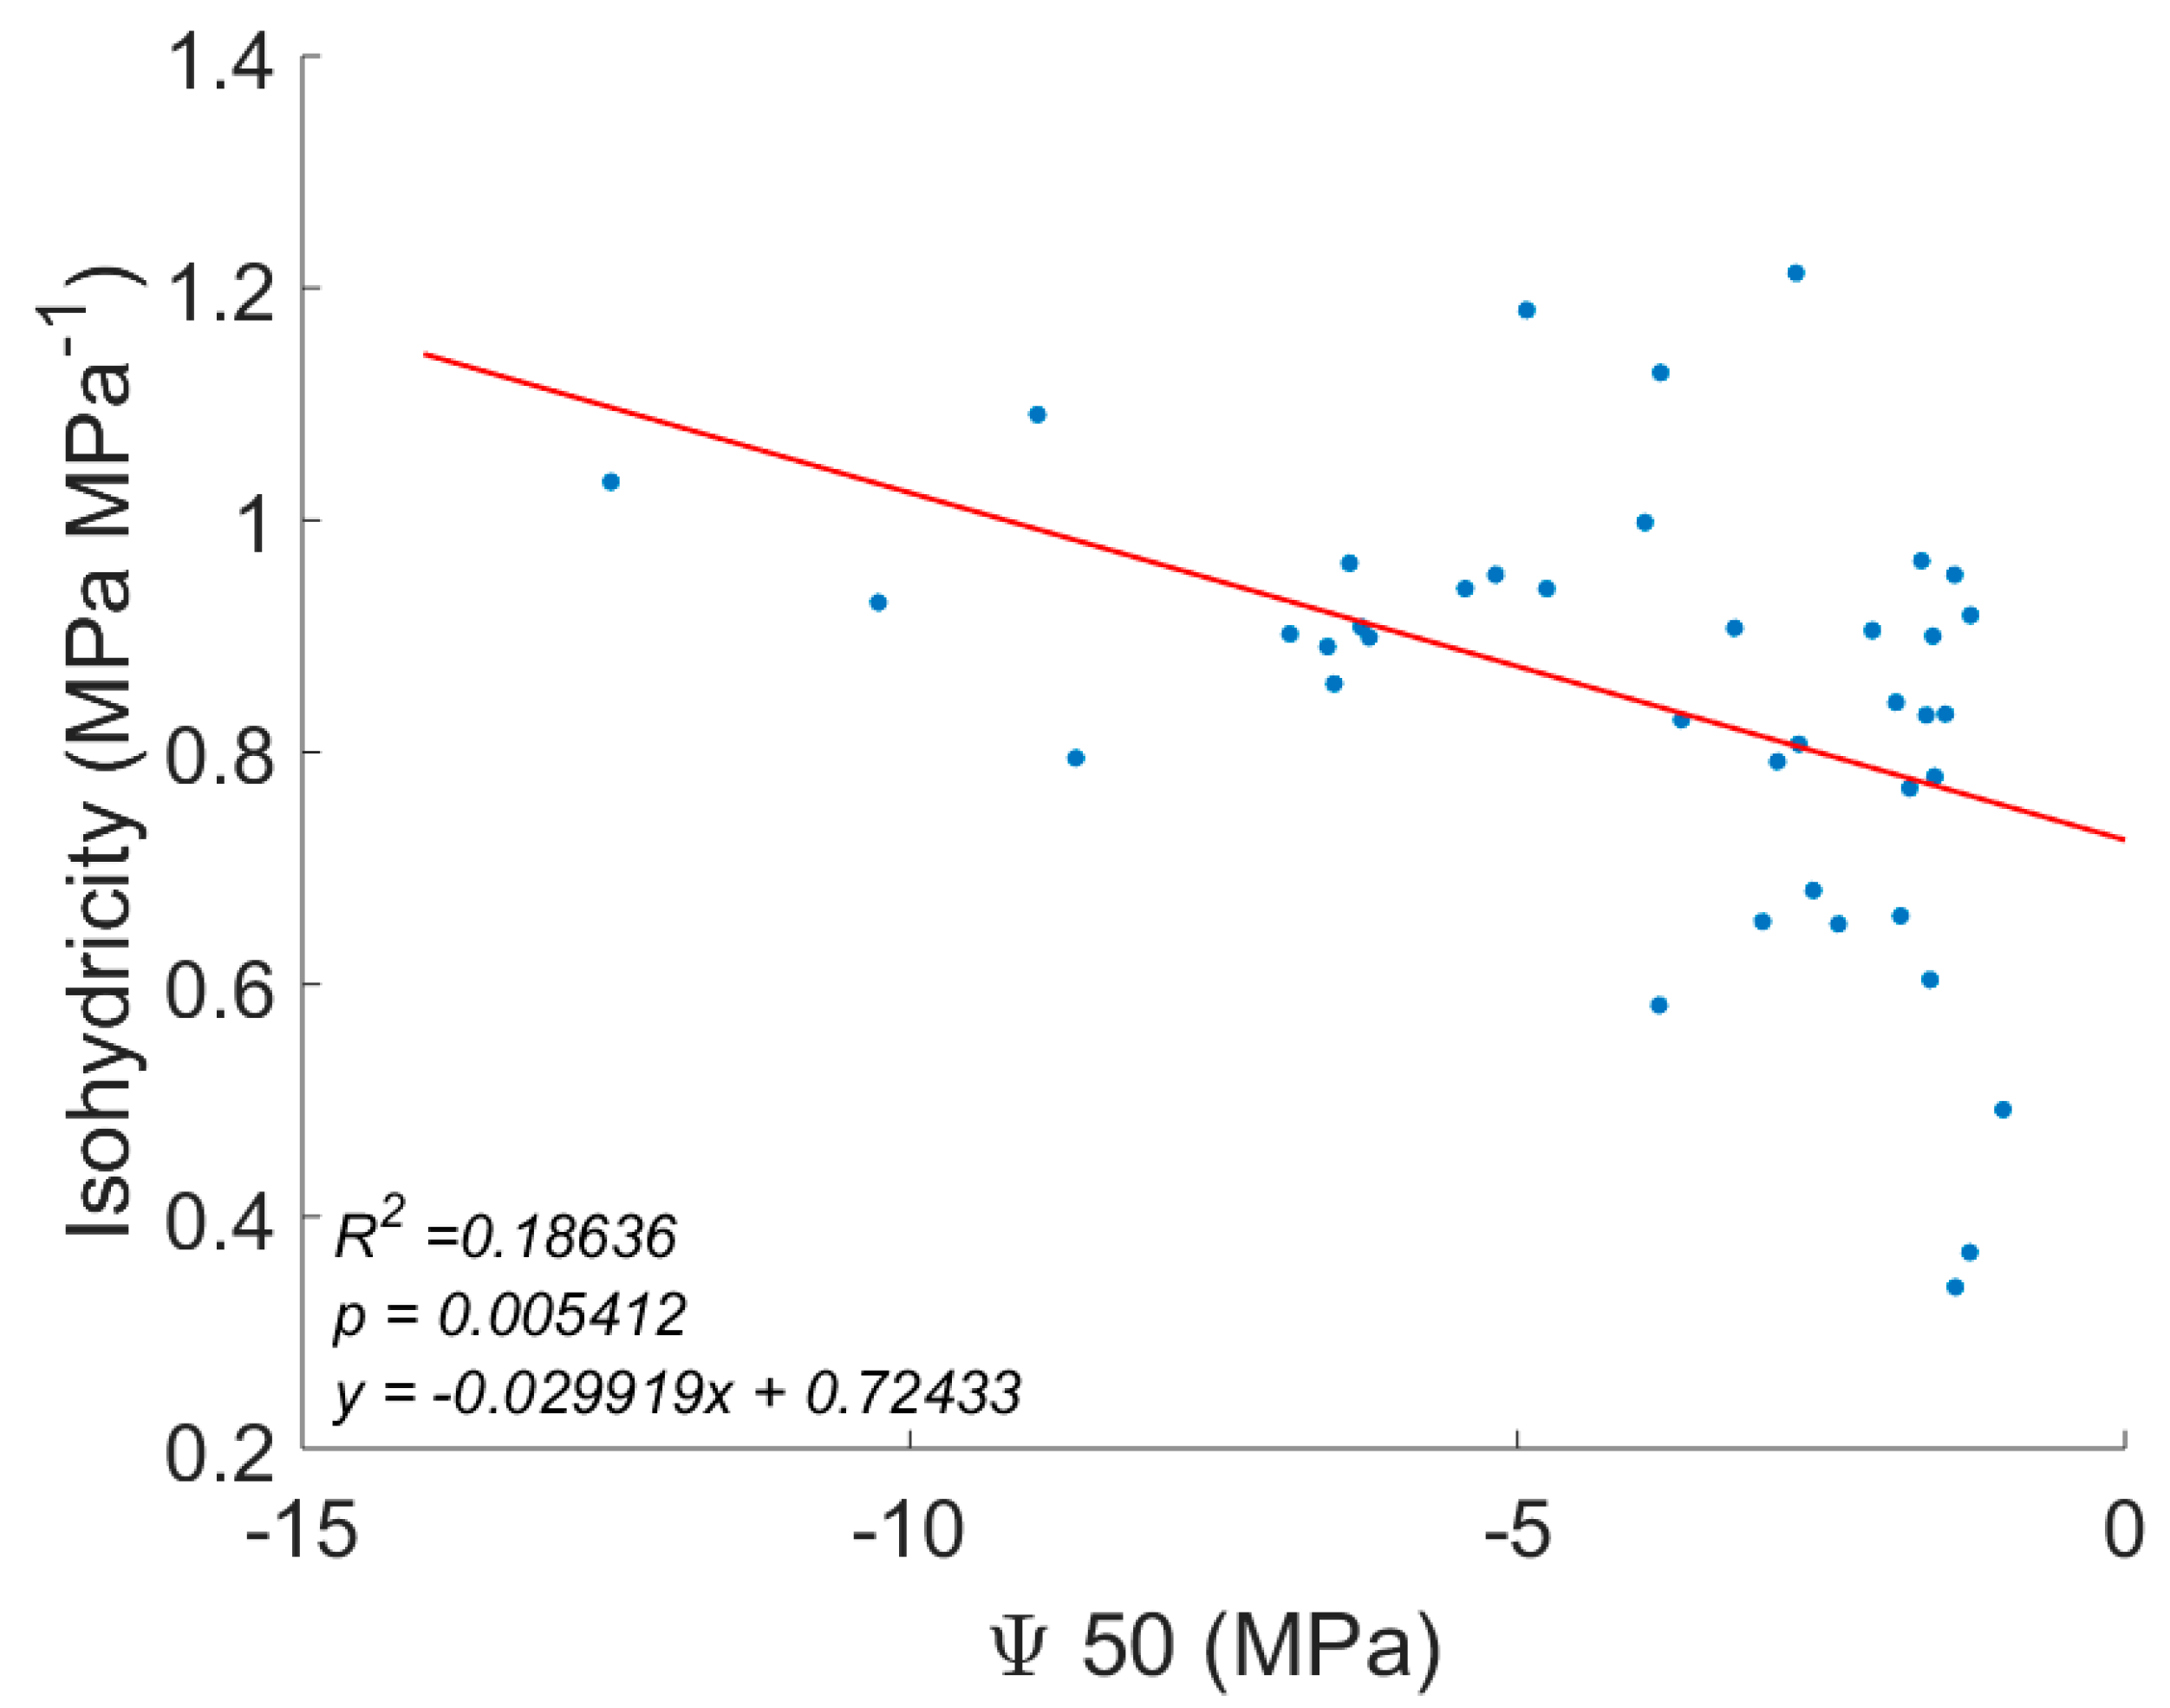
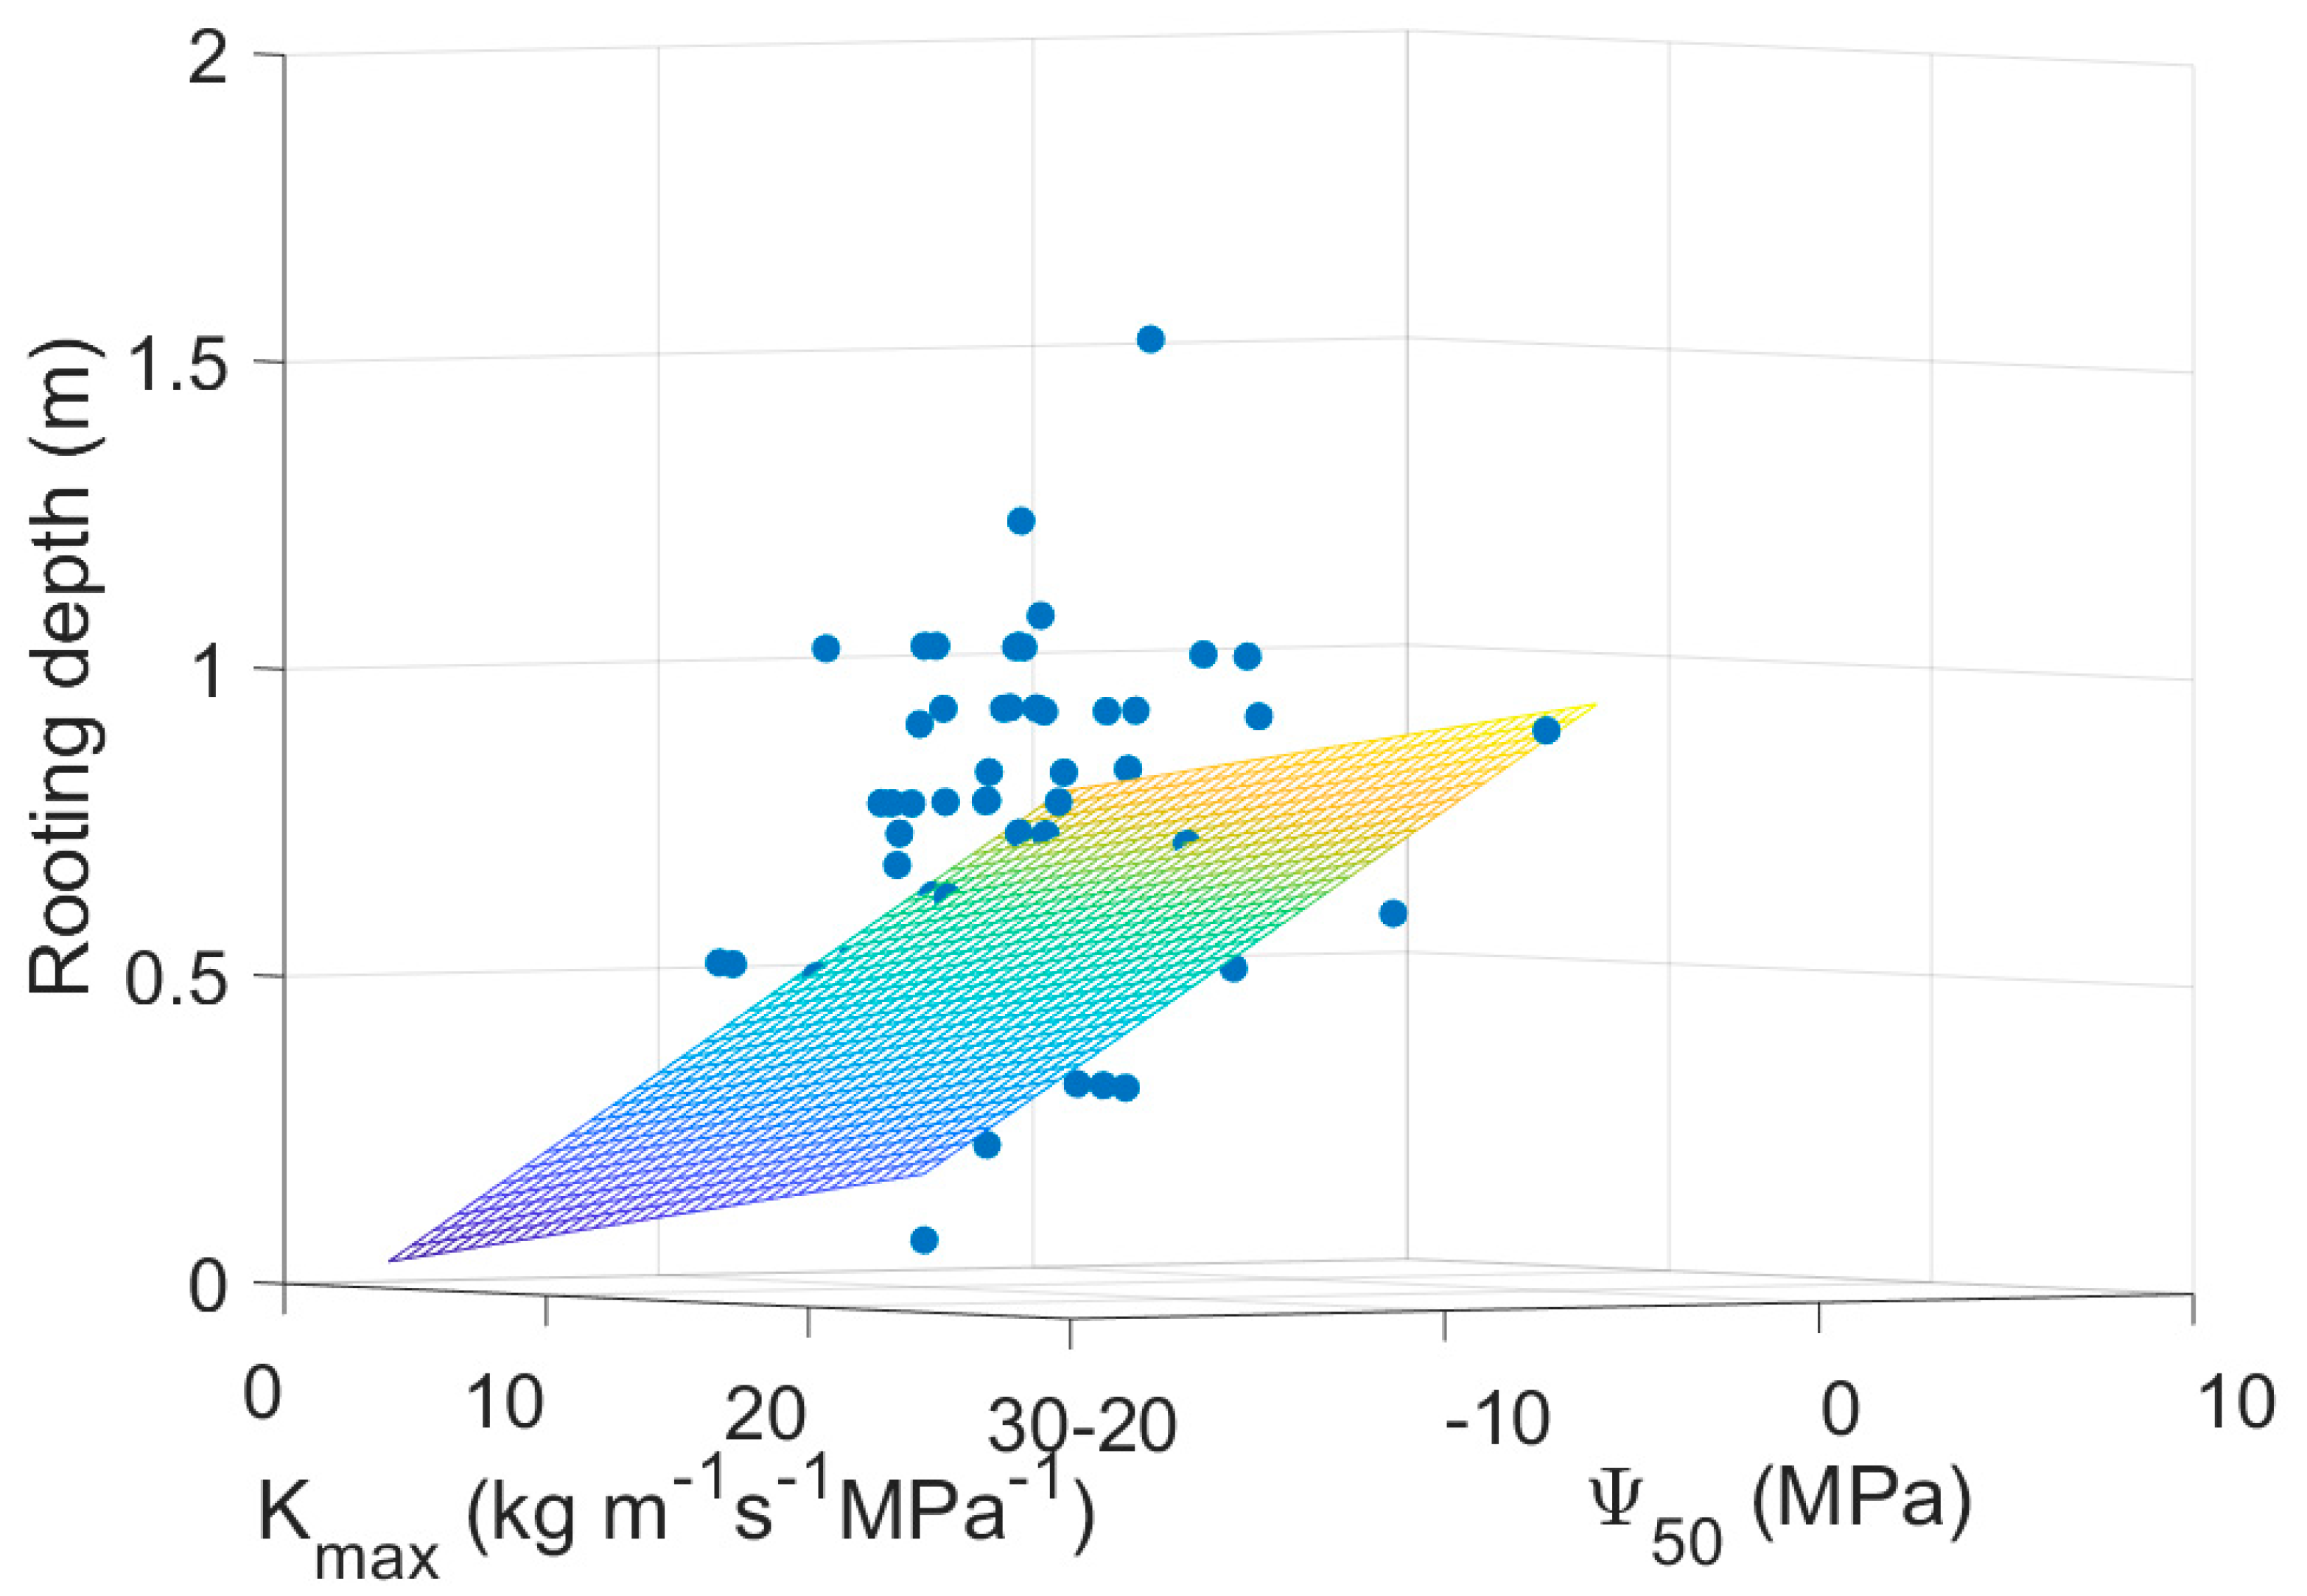
| 50% loss of hydraulic conductivity | Ψ50 | Choat, et al. [37], Manzoni, et al. [16] |
| Slope of cavitation curve at Ψ50 | a | Choat, et al. [37], Manzoni, et al. [16] |
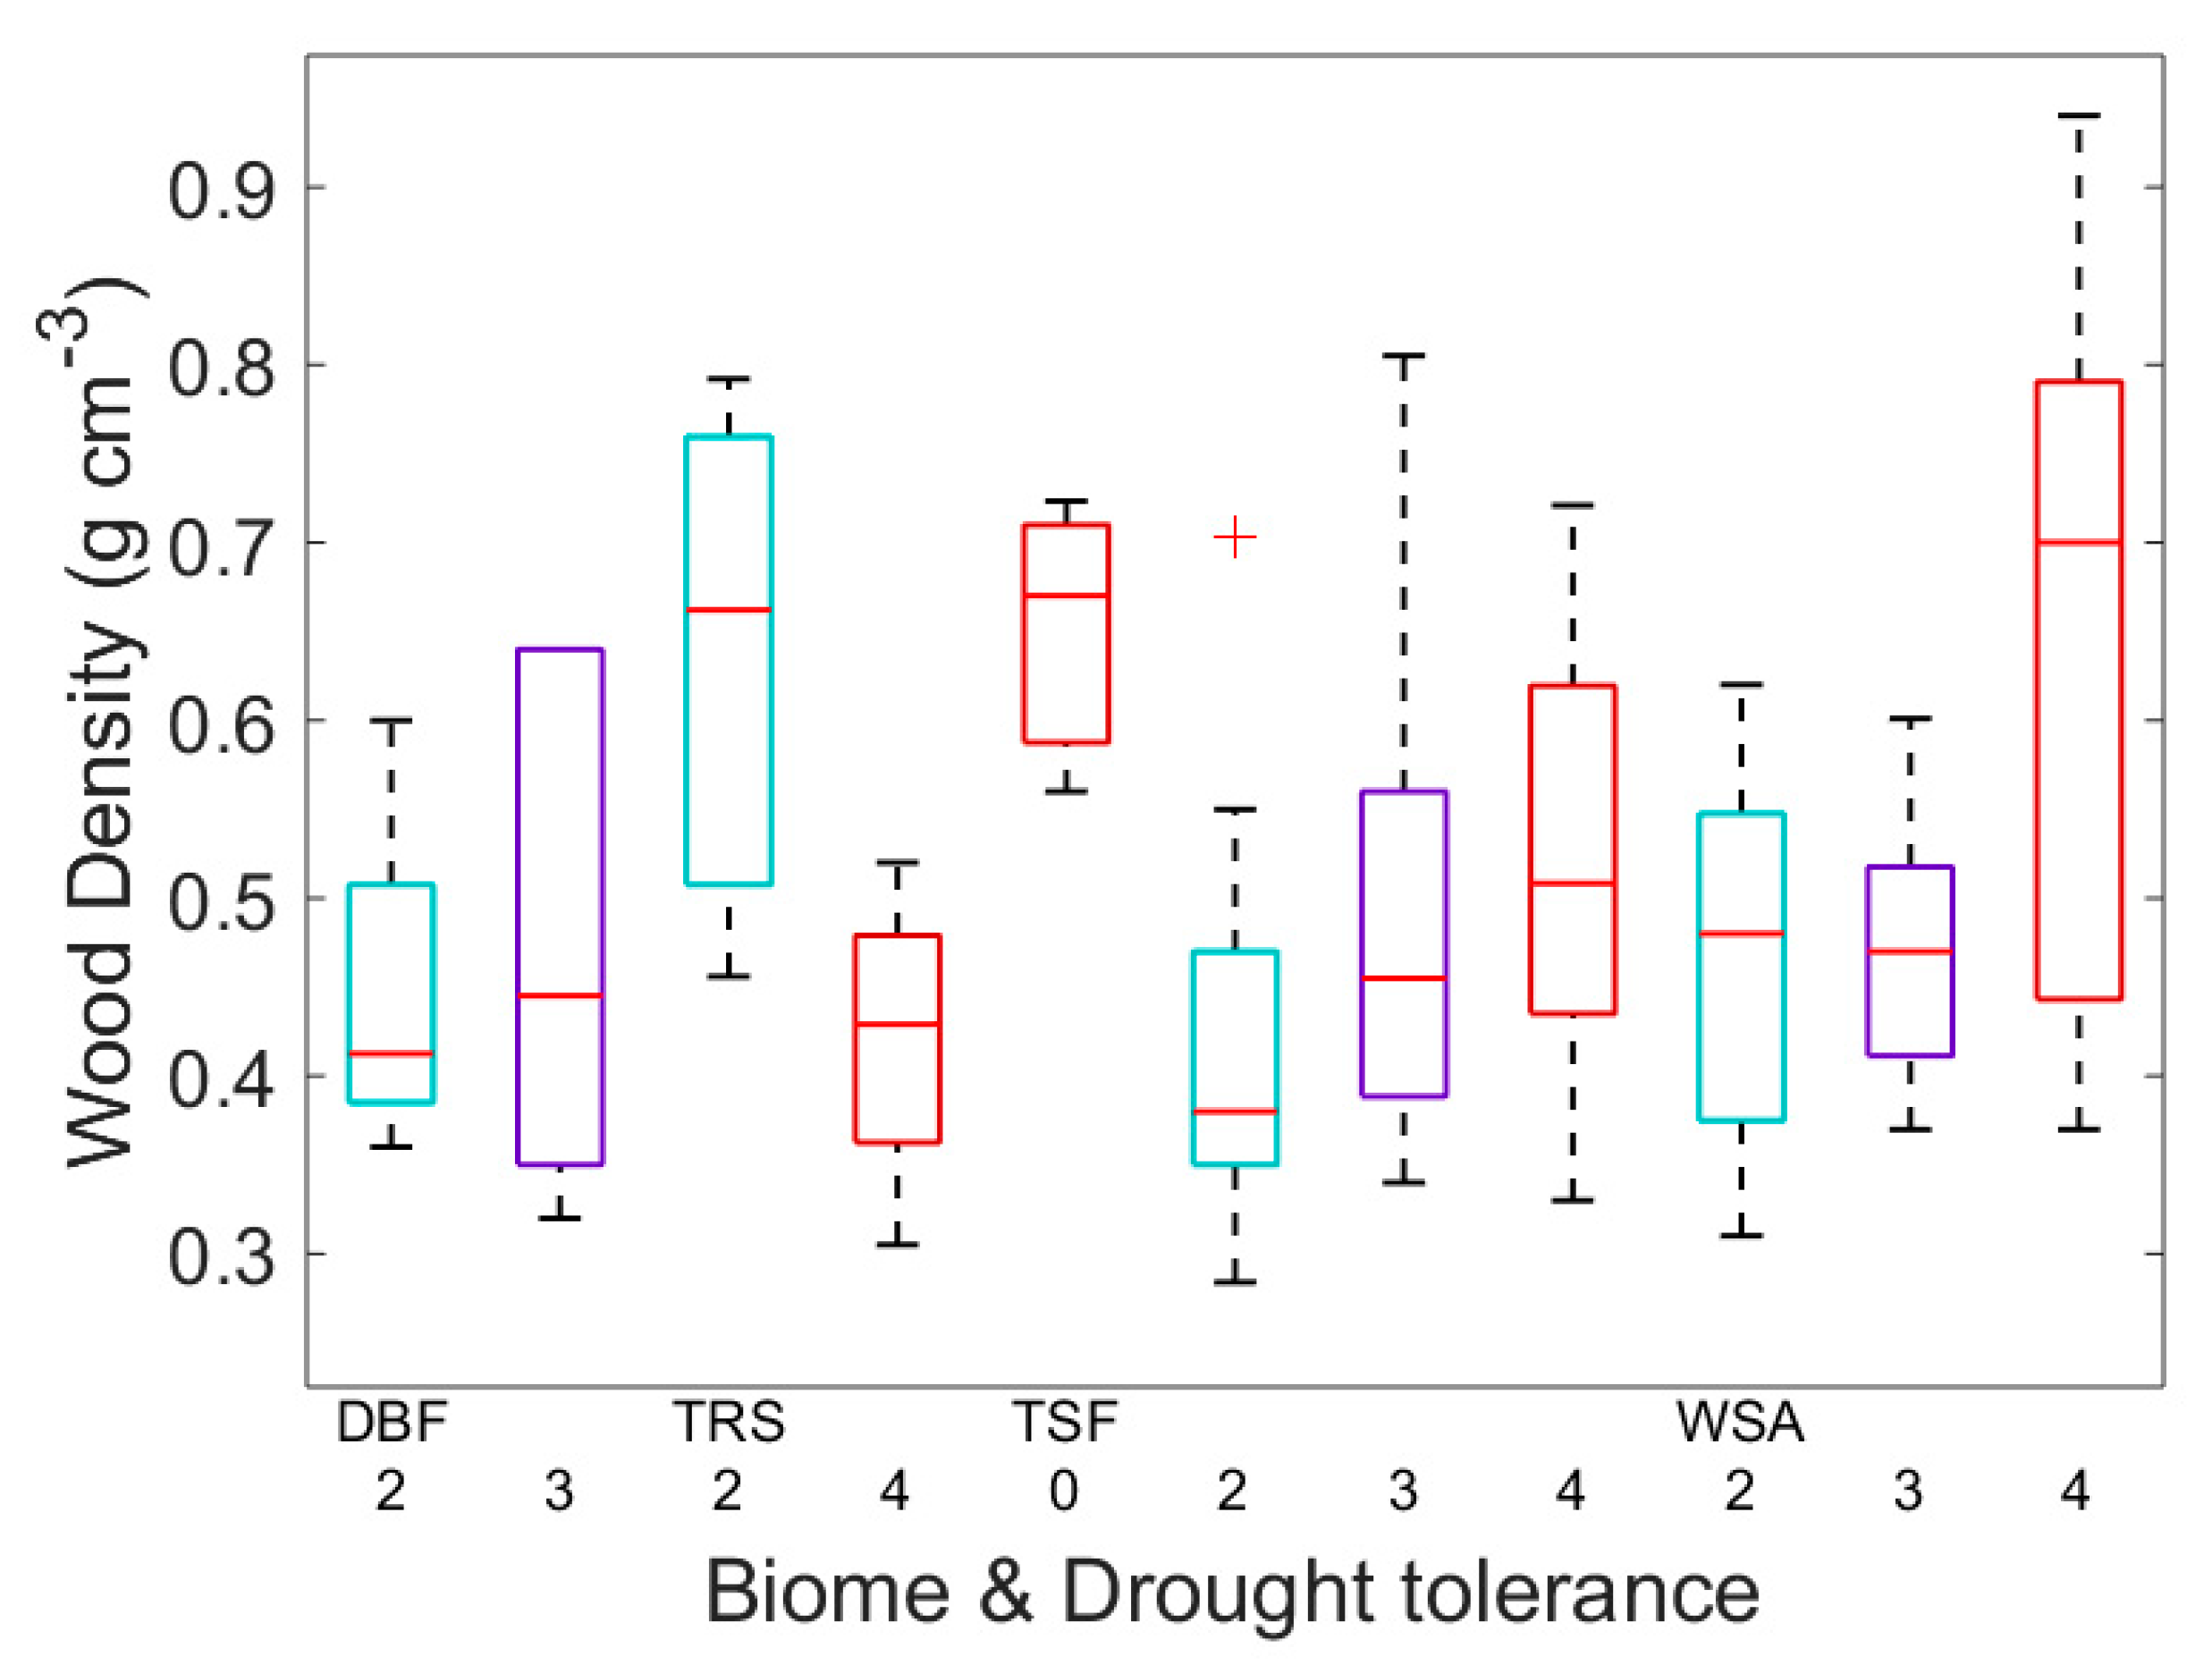
| Biome | biome | Choat, et al. [37], Martinez-Vilalta, et al. [58] |
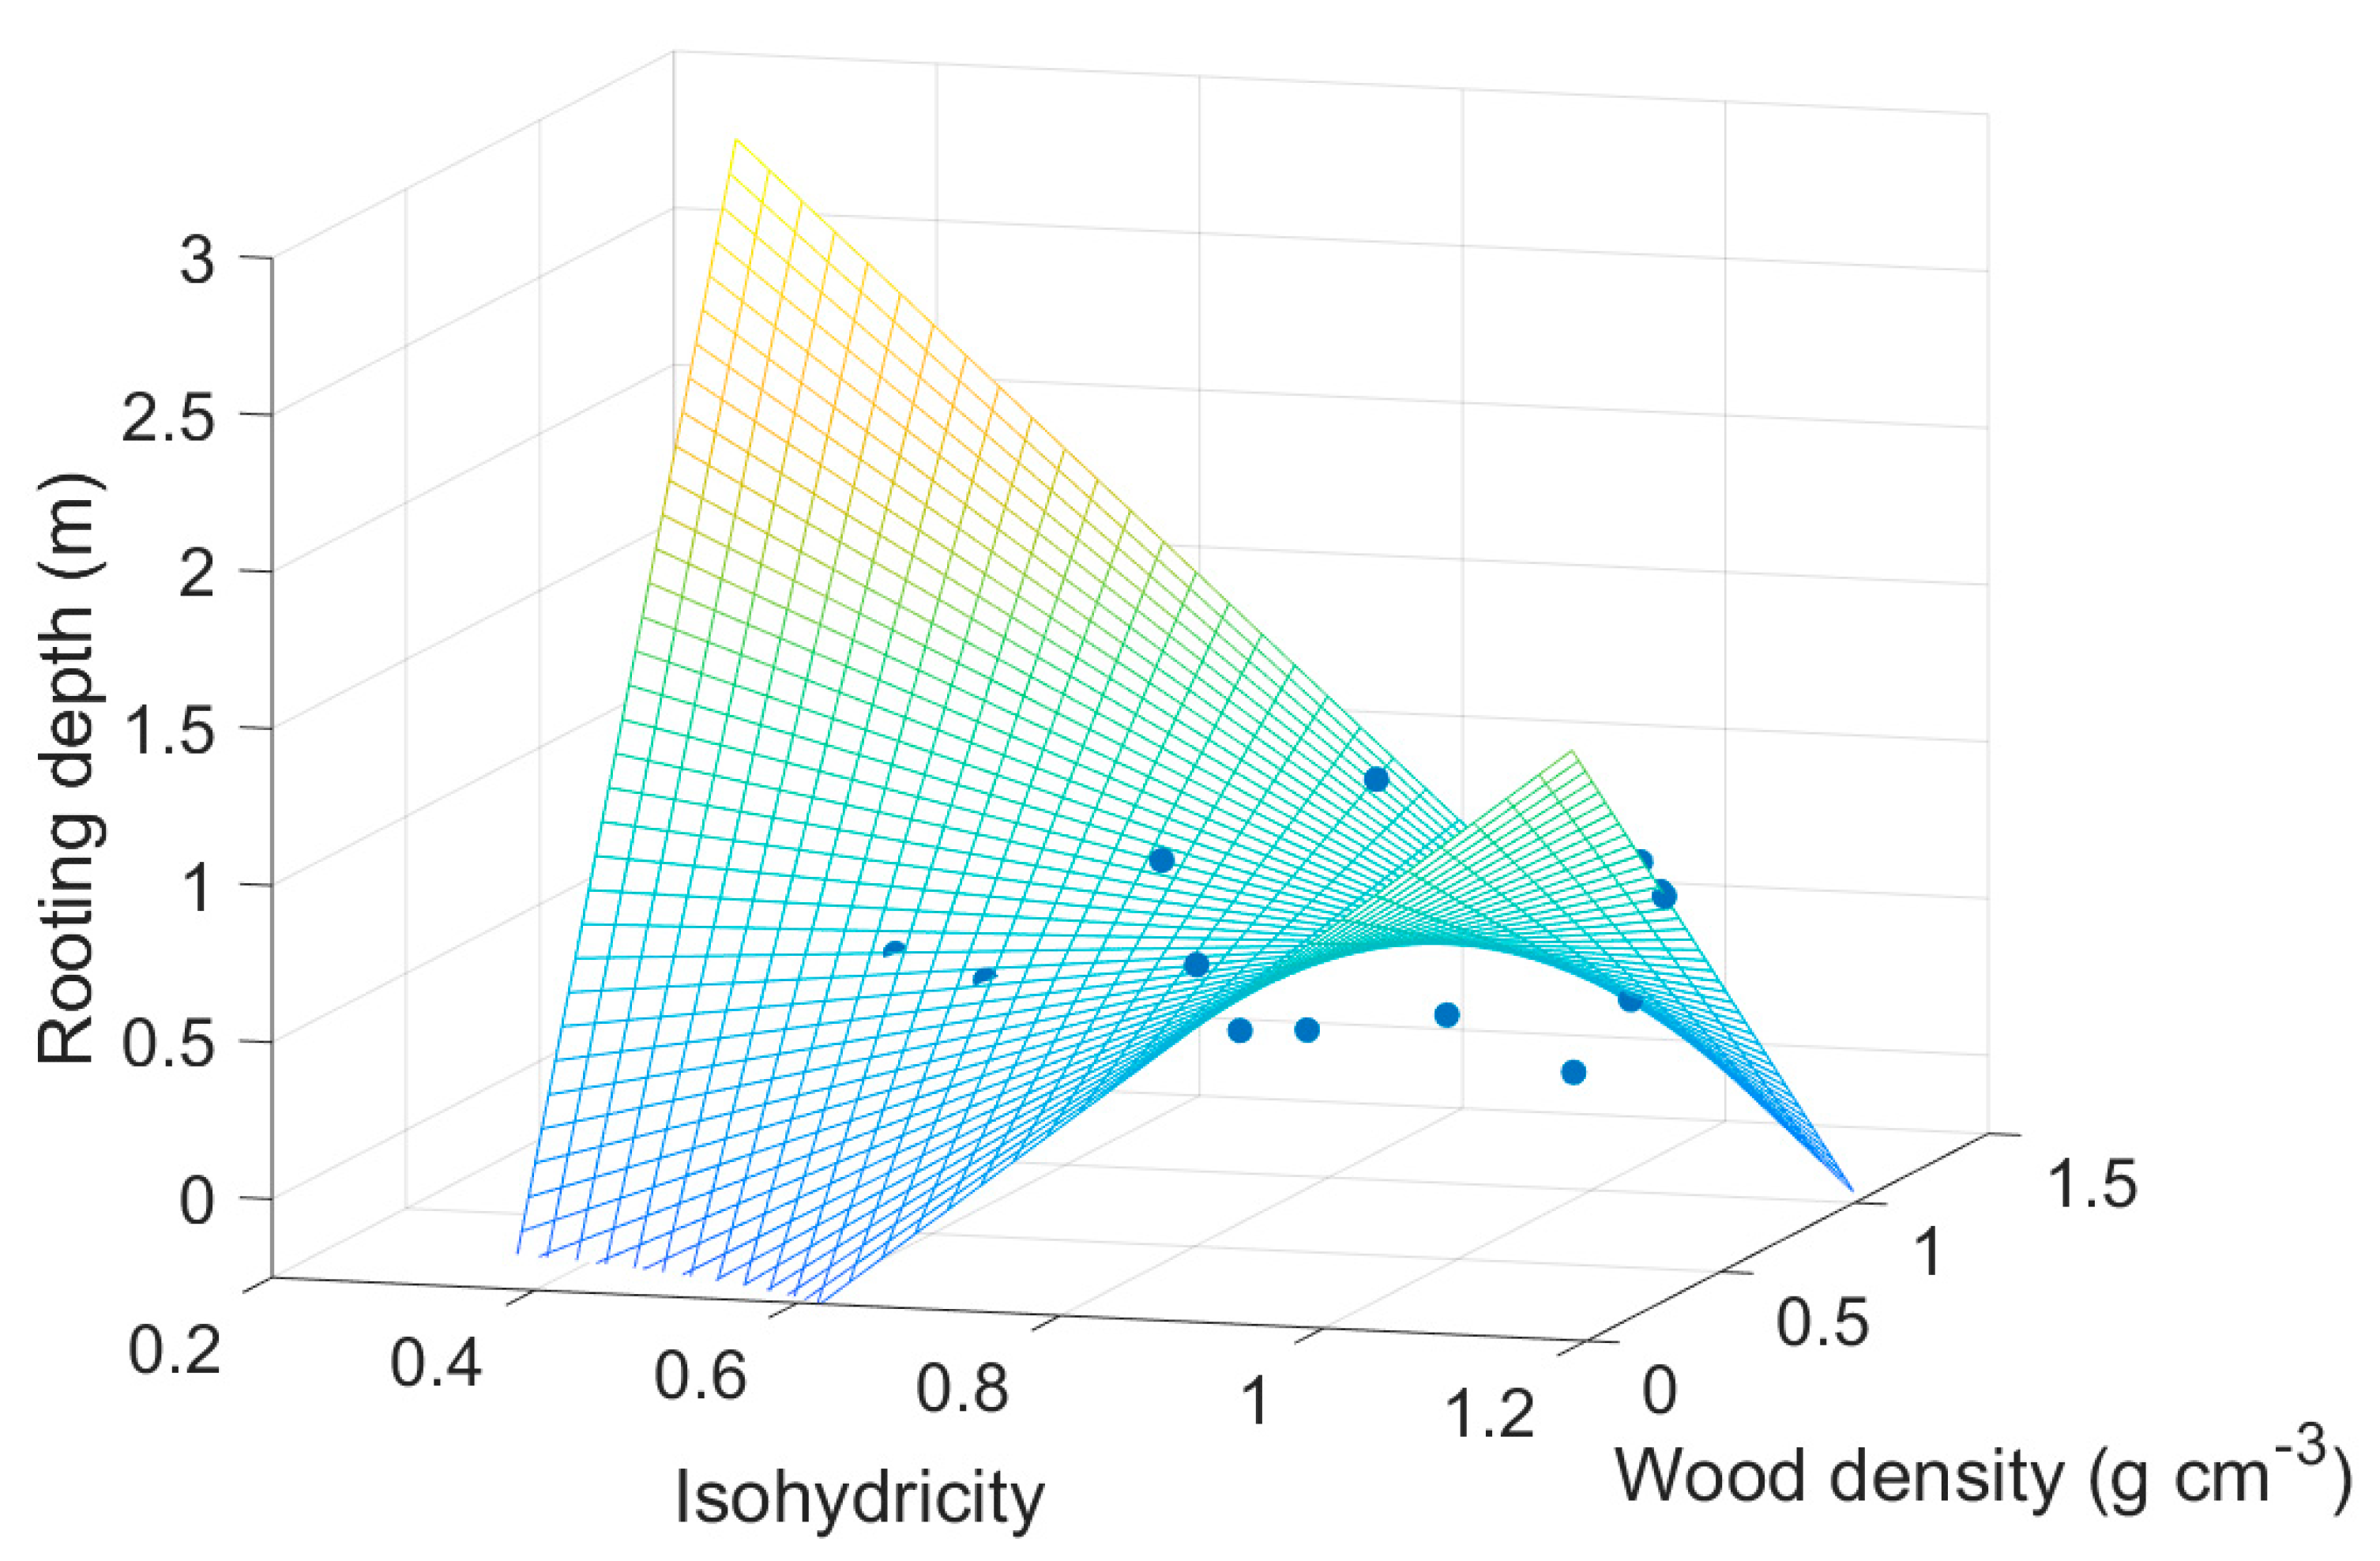
| Rooting depth | z | Green [61], Fitter and Peat [62], Diaz, et al. [63] |
| Drought tolerance | DT | Green [61], Fitter and Peat [62] |
| Sapwood specific conductivity | Kmax | Manzoni, et al. [16] |
| Conduit density | CD | Preston, et al. [60] |
| Wood density | WD | Chave, et al. [3], Zanne, et al. [64] |
| Isohydricity | σ | Martinez-Vilalta, et al. [58] |
| Estimate | SE | t Stat | p Value | |
|---|---|---|---|---|
| Intercept | 3.4292 | 0.5491 | 6.2455 | 0.0001 |
| Wood density | 0.9212 | 0.7688 | 1.1983 | 0.2584 |
| Rooting depth | −1.2877 | 0.3644 | −3.5340 | 0.0054 |
| Isohydricity | 0.4552 | 0.5172 | 0.8801 | 0.3995 |
© 2018 by the authors. Licensee MDPI, Basel, Switzerland. This article is an open access article distributed under the terms and conditions of the Creative Commons Attribution (CC BY) license (http://creativecommons.org/licenses/by/4.0/).
Share and Cite
Mursinna, A.R.; McCormick, E.; Van Horn, K.; Sartin, L.; Matheny, A.M. Plant Hydraulic Trait Covariation: A Global Meta-Analysis to Reduce Degrees of Freedom in Trait-Based Hydrologic Models. Forests 2018, 9, 446. https://doi.org/10.3390/f9080446
Mursinna AR, McCormick E, Van Horn K, Sartin L, Matheny AM. Plant Hydraulic Trait Covariation: A Global Meta-Analysis to Reduce Degrees of Freedom in Trait-Based Hydrologic Models. Forests. 2018; 9(8):446. https://doi.org/10.3390/f9080446
Chicago/Turabian StyleMursinna, A. Rio, Erica McCormick, Katie Van Horn, Lisa Sartin, and Ashley M. Matheny. 2018. "Plant Hydraulic Trait Covariation: A Global Meta-Analysis to Reduce Degrees of Freedom in Trait-Based Hydrologic Models" Forests 9, no. 8: 446. https://doi.org/10.3390/f9080446
APA StyleMursinna, A. R., McCormick, E., Van Horn, K., Sartin, L., & Matheny, A. M. (2018). Plant Hydraulic Trait Covariation: A Global Meta-Analysis to Reduce Degrees of Freedom in Trait-Based Hydrologic Models. Forests, 9(8), 446. https://doi.org/10.3390/f9080446