What Drives Low-Severity Fire in the Southwestern USA?


Abstract
:1. Introduction
2. Materials and Methods
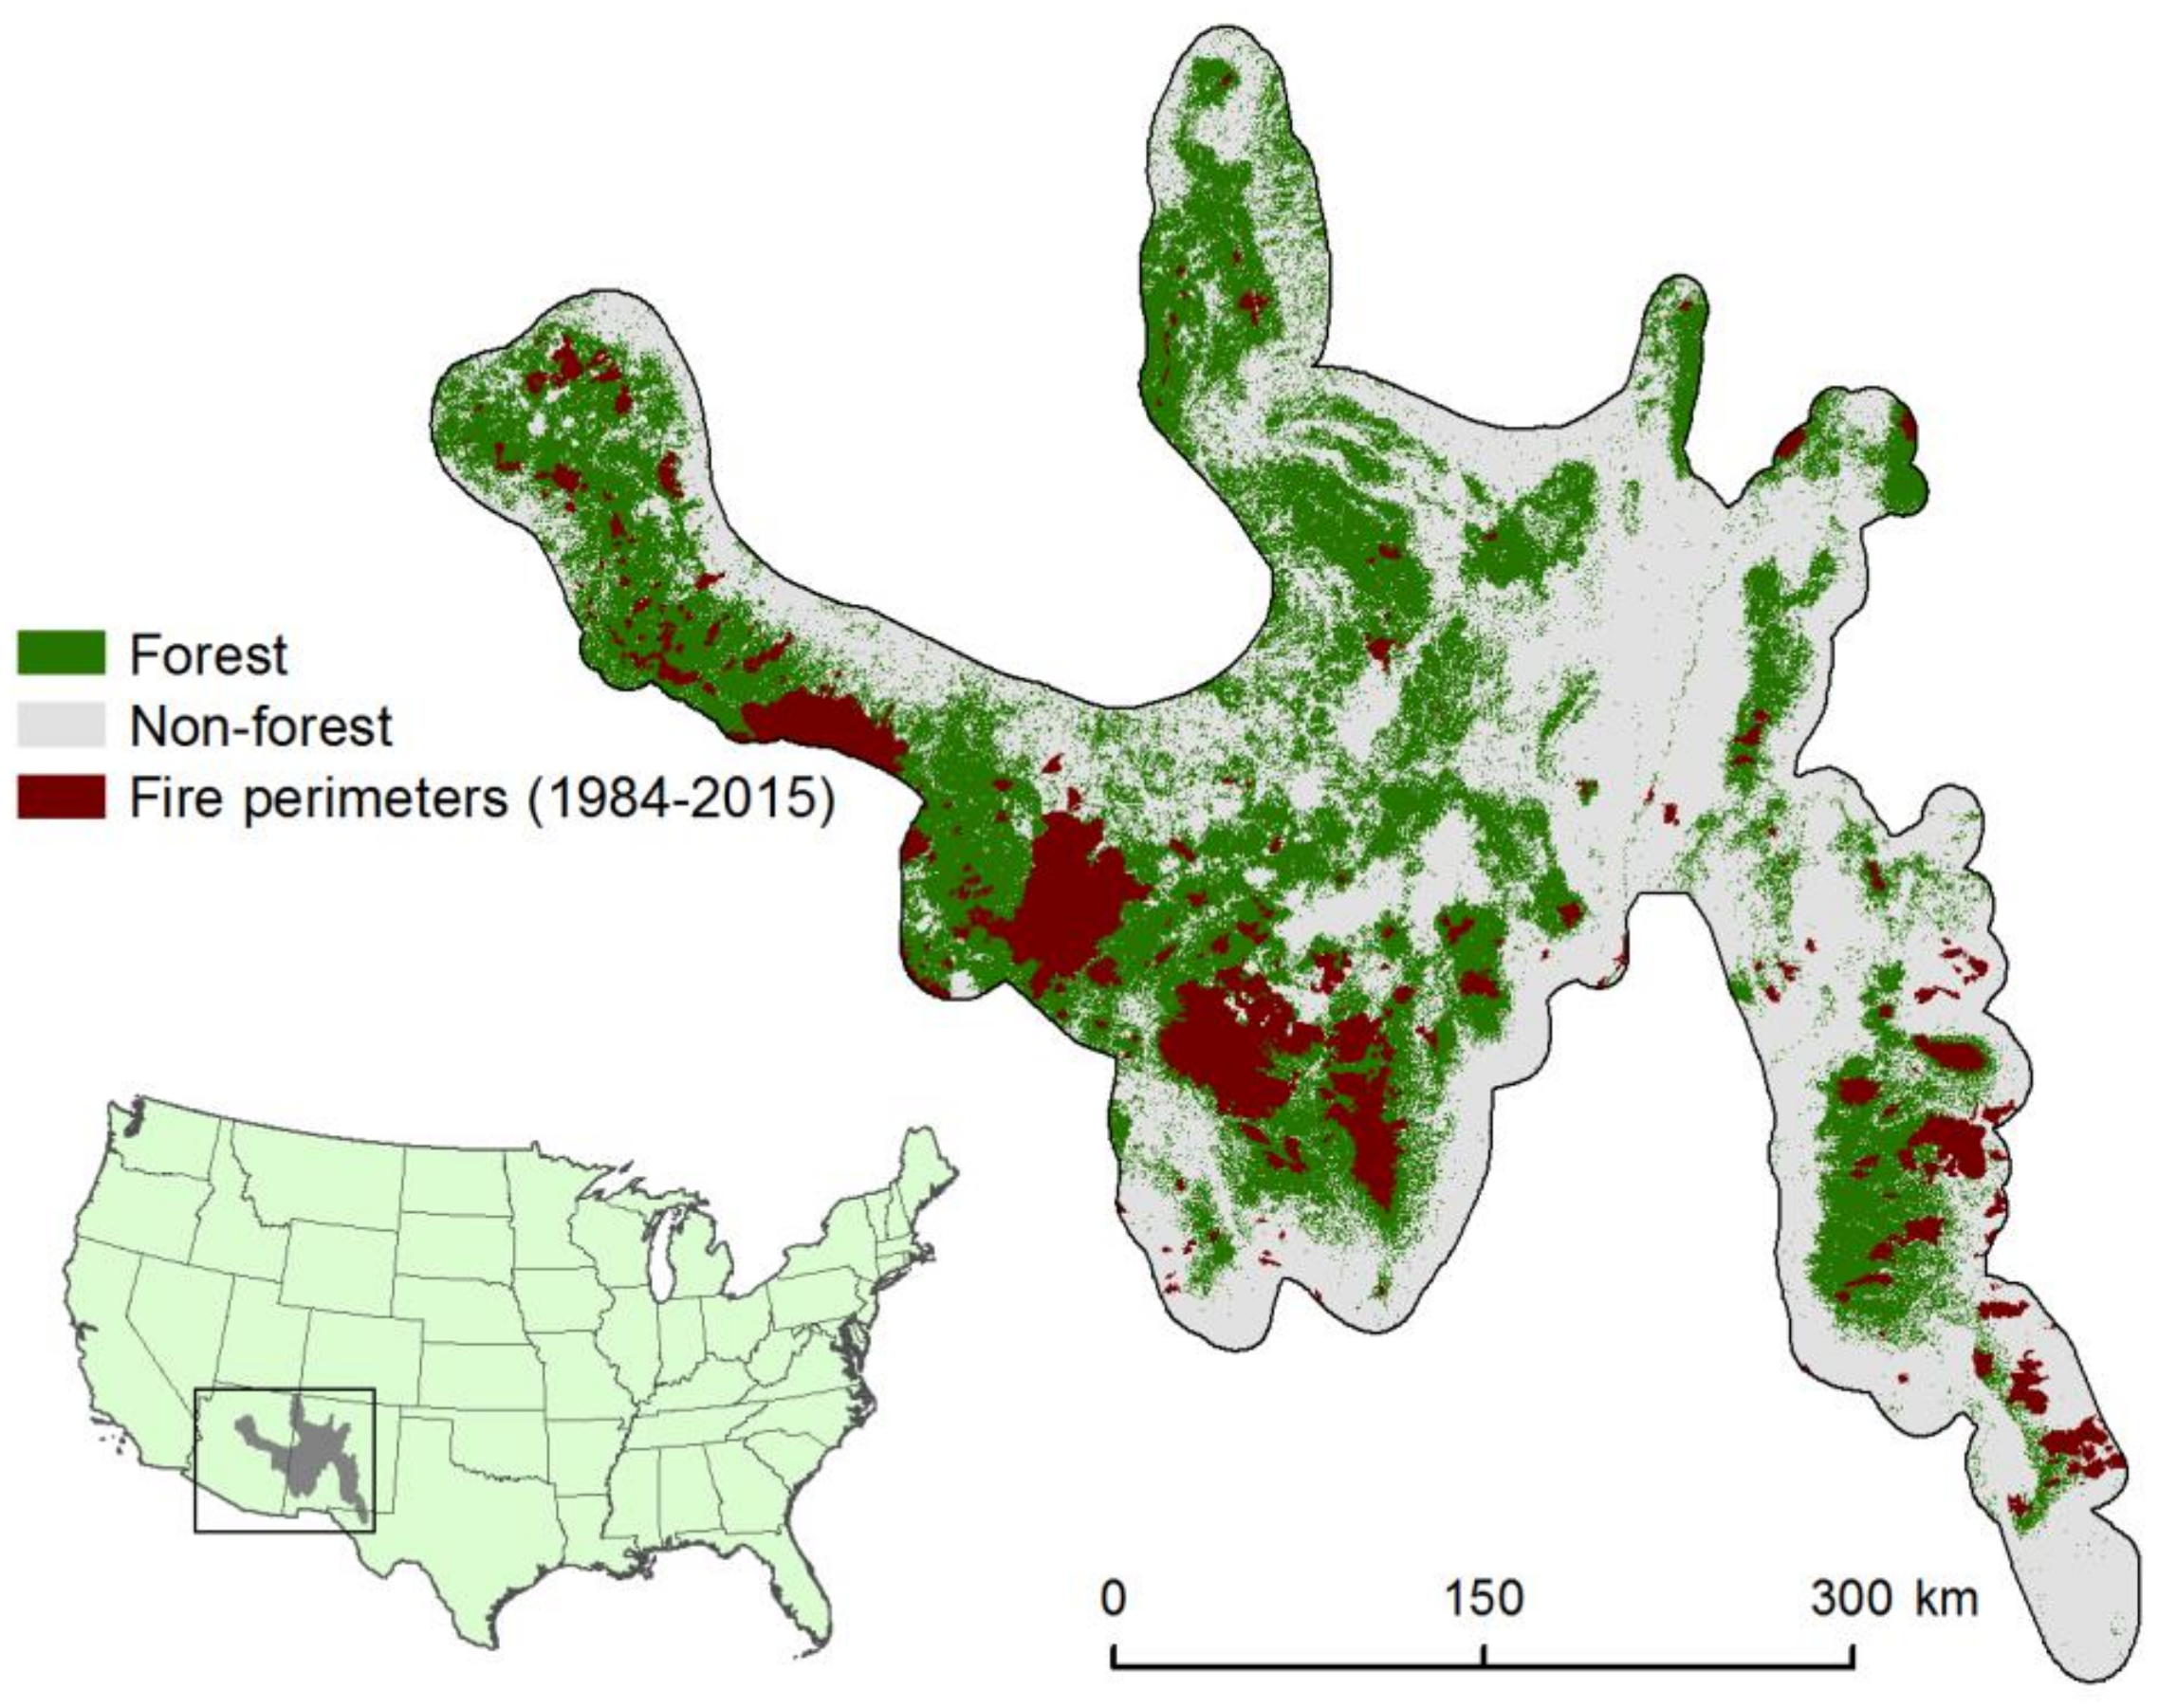
2.1. Study Area
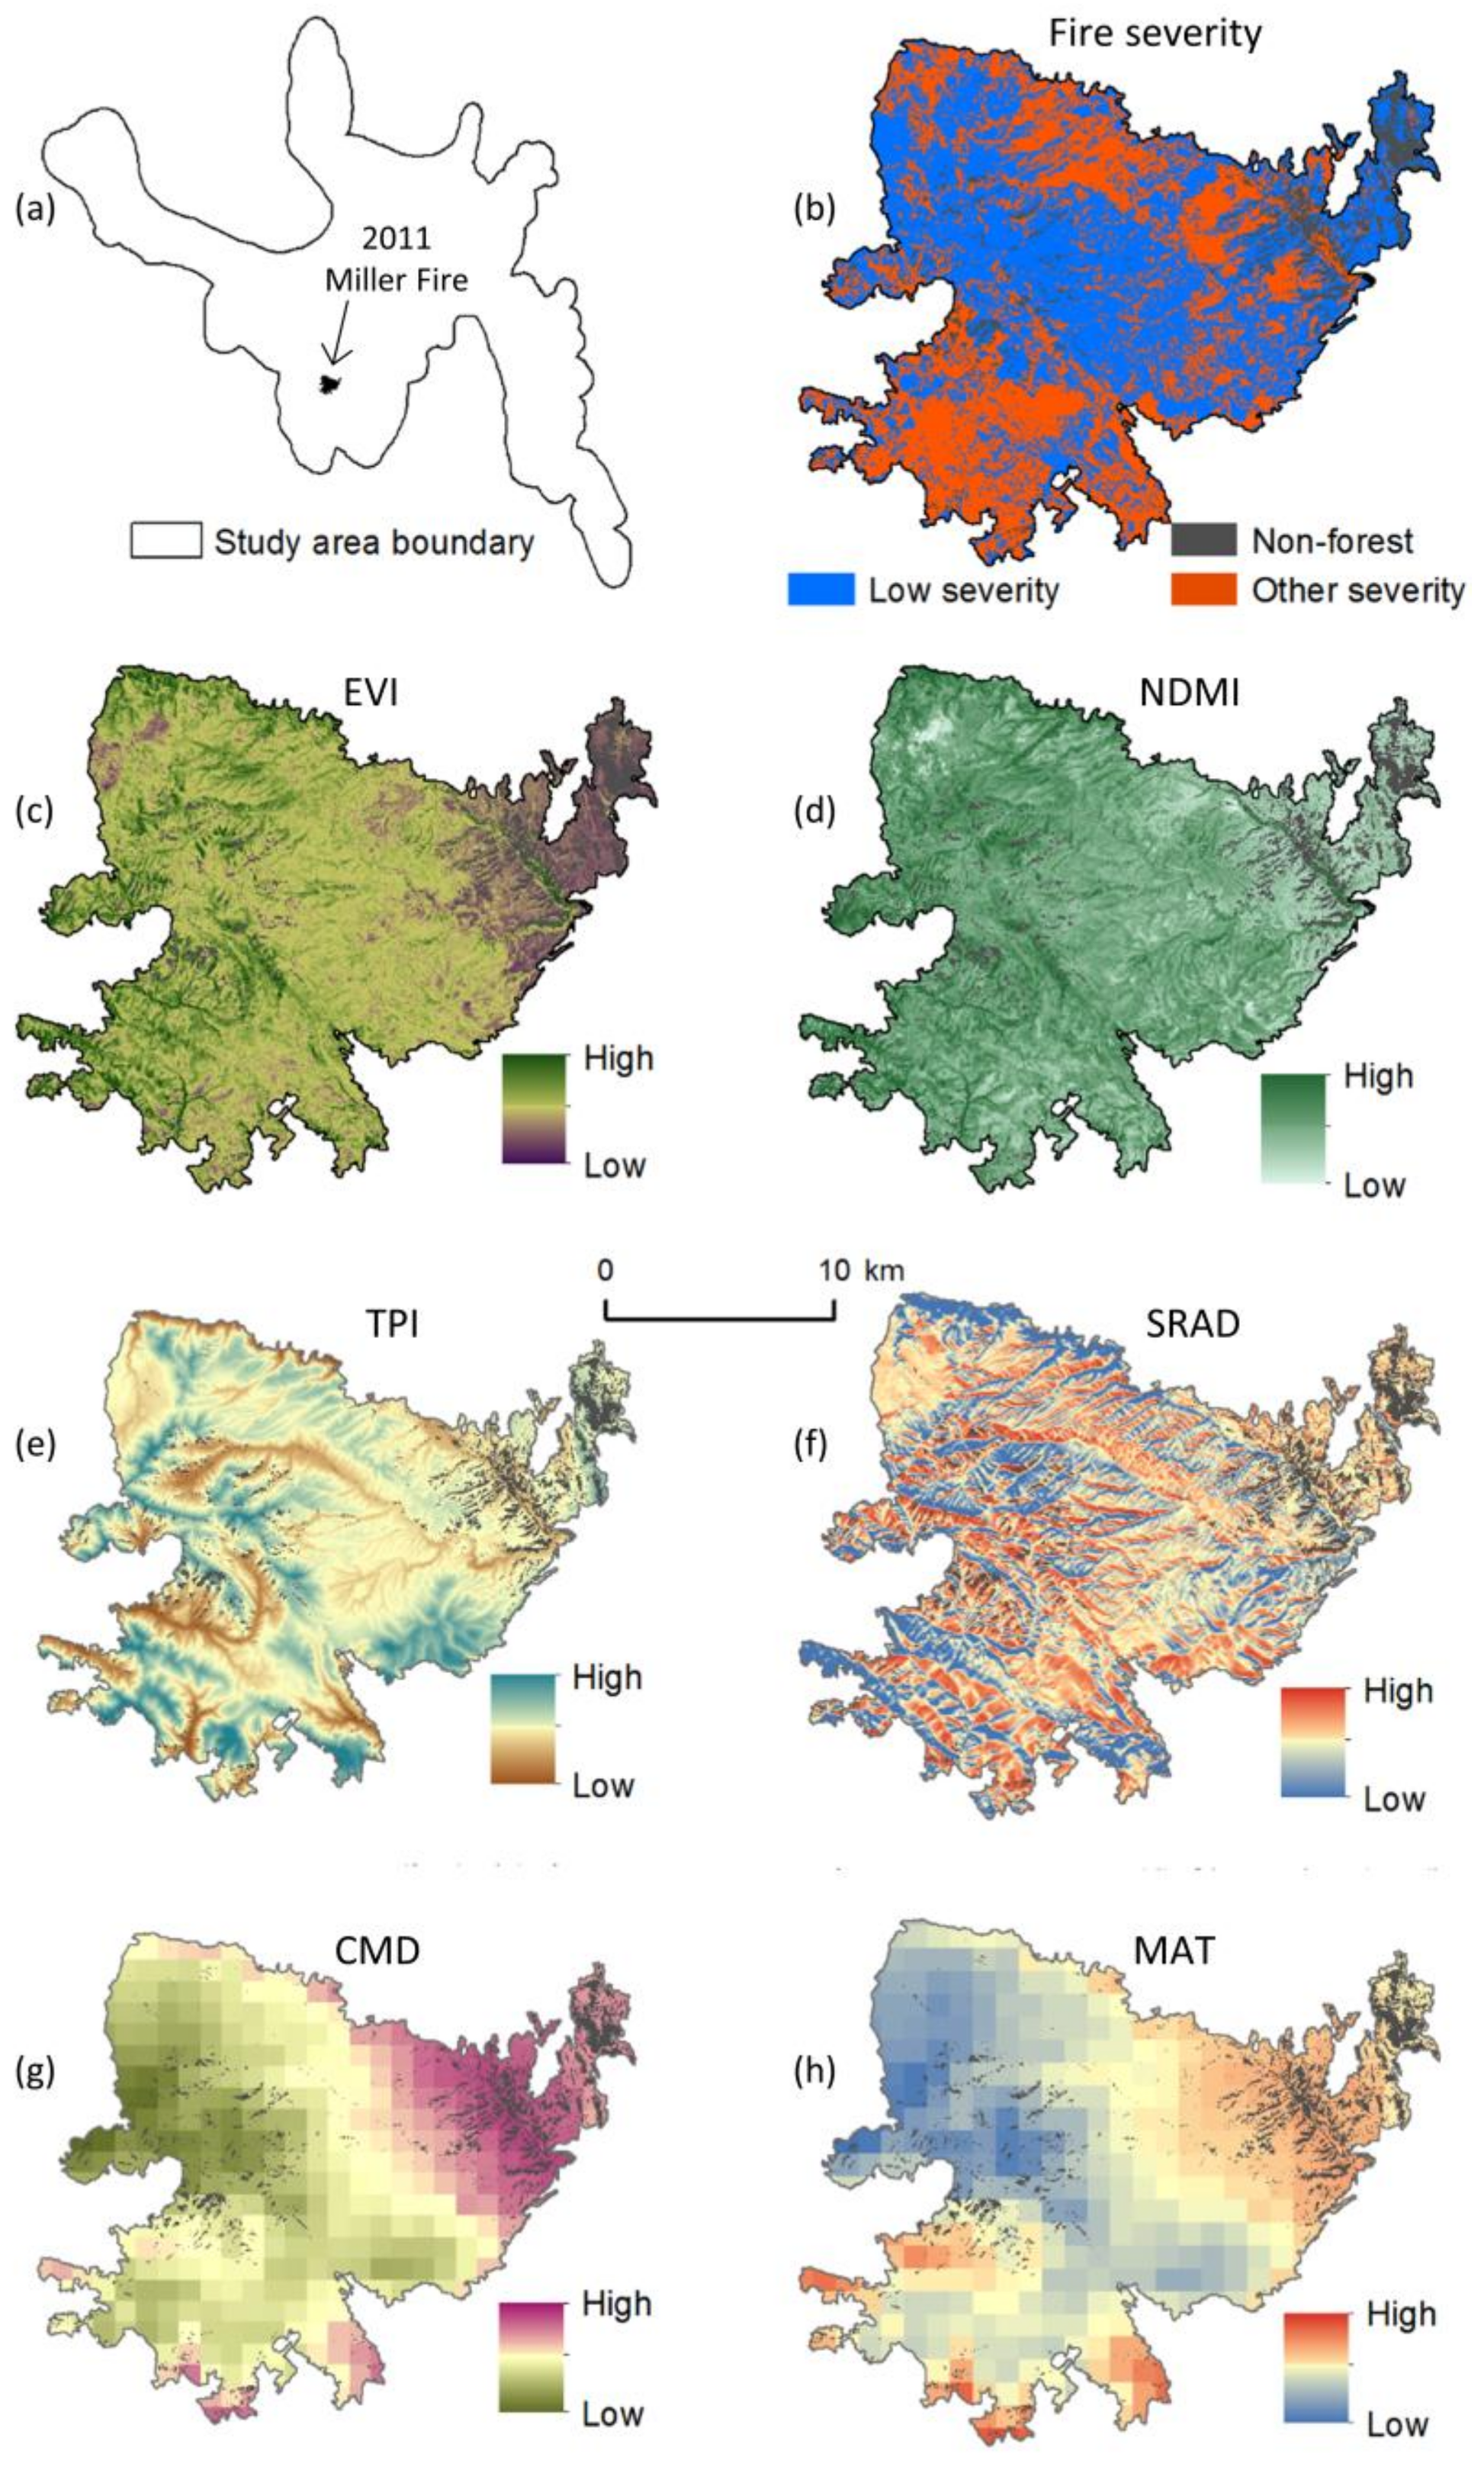
2.2. Data
2.3. Sampling Design and Statistical Model
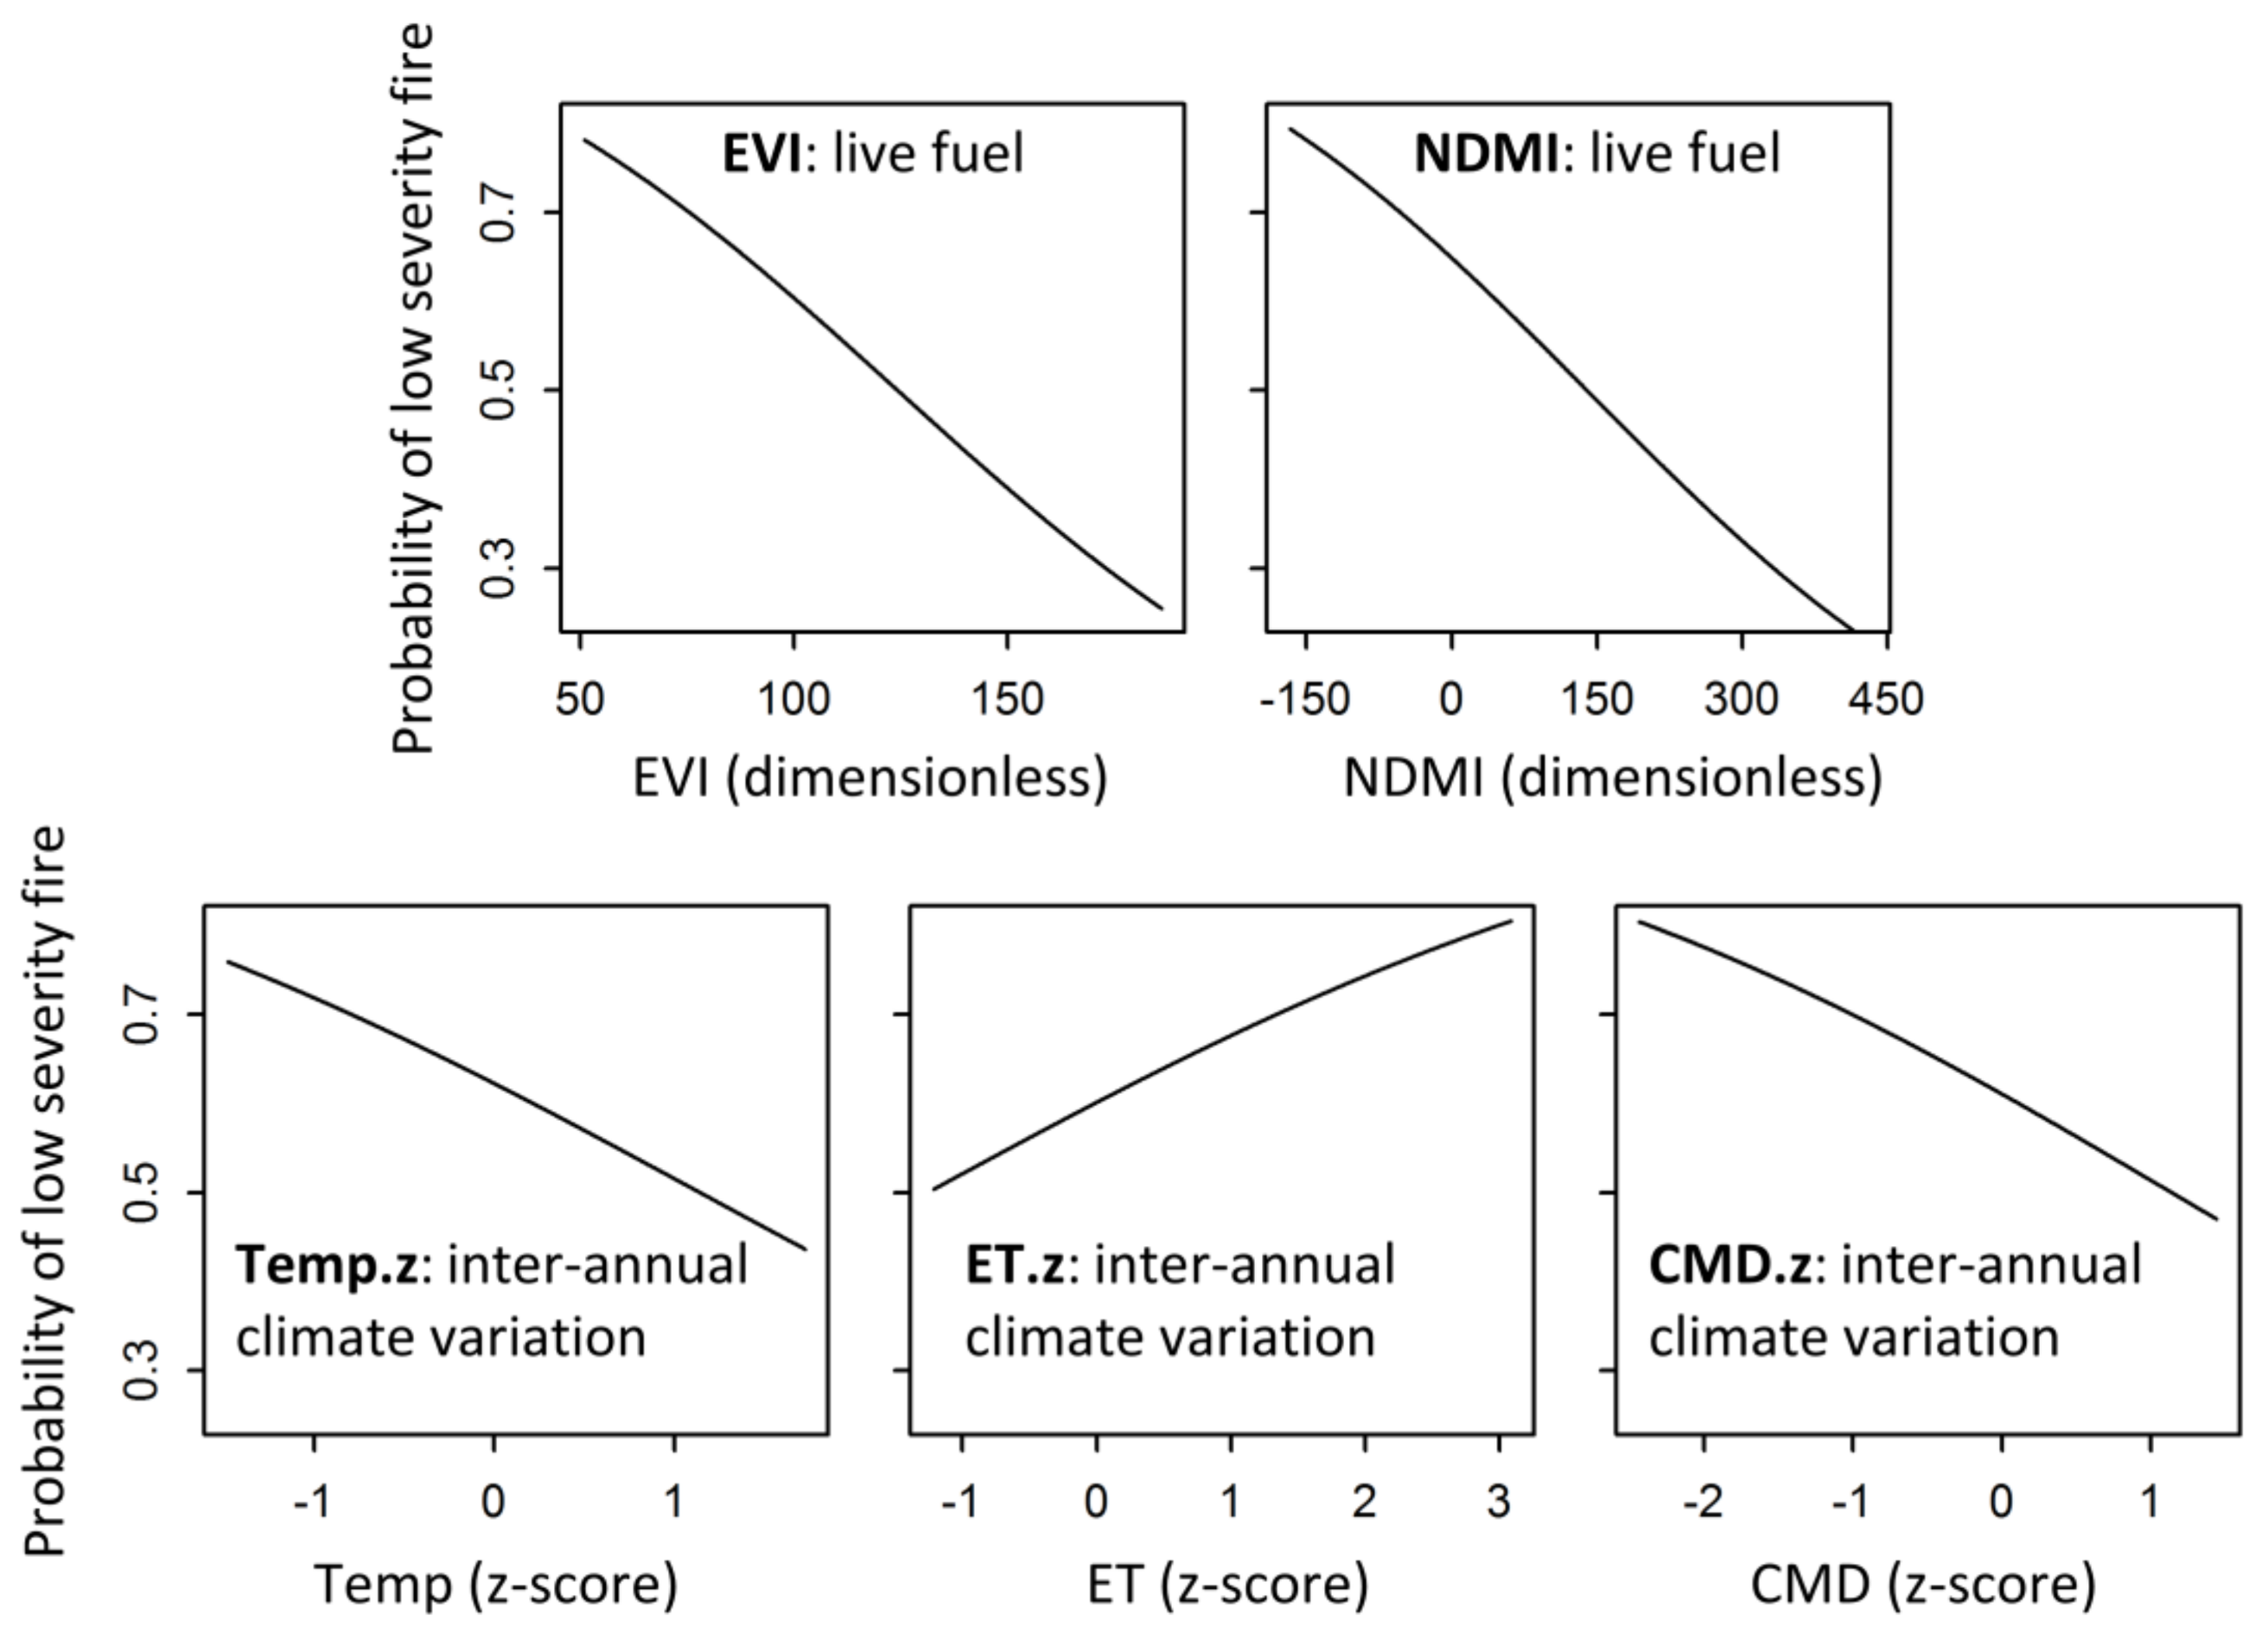
3. Results
4. Discussion
5. Conclusions
Acknowledgments
Author Contributions
Conflicts of Interest
References
- Agee, J.K. Fire Ecology of Pacific Northwest Forests; Island Press: Washington, DC, USA, 1993. [Google Scholar]
- Margolis, E.Q.; Malevich, S.B. Historical dominance of low-severity fire in dry and wet mixed-conifer forest habitats of the endangered terrestrial Jemez Mountains salamander (Plethodon neomexicanus). For. Ecol. Manag. 2016, 375, 12–26. [Google Scholar] [CrossRef]
- Touchan, R.; Allen, C.D.; Swetnam, T.W. Fire history and climatic patterns in ponderosa pine and mixed-conifer forests of the Jemez Mountains, northern New Mexico. In Fire Effects in Southwestern Forests: Proceedings of the Second La Mesa Fire Symposium; Allen, C.D., Ed.; General Technical Report RM-GTR-286; USDA Forest Service: Fort Collins, CO, USA, 1996; pp. 33–46. [Google Scholar]
- Baisan, C.H.; Swetnam, T.W. Fire history on a desert mountain range: Rincon Mountain Wilderness, Arizona, USA. Can. J. For. Res. 1990, 20, 1559–1569. [Google Scholar] [CrossRef]
- Swetnam, T.W.; Baisan, C.H. Historical fire regime patterns in the southwestern United States since AD 1700. In Fire Effects in Southwestern Forests: Proceedings of the Second La Mesa Fire Symposium; Allen, C.D., Ed.; General Technical Report RM-GTR-286; USDA Forest Service: Fort Collins, CO, USA; 1996; pp. 11–32. [Google Scholar]
- Fulé, P.Z.; Covington, W.W.; Moore, M.M. Determining reference conditions for ecosystem management of southwestern ponderosa pine forests. Ecol. Appl. 1997, 7, 895–908. [Google Scholar] [CrossRef]
- Covington, W.W.; Moore, M.M. Southwestern ponderosa forest structure: Changes since Euro-American settlement. J. For. Soc. Am. For. 1994, 92, 39–47. [Google Scholar]
- Swetnam, T.W.; Allen, C.D.; Betancourt, J.L. Applied historical ecology: Using the past to manage for the future. Ecol. Appl. Ecol. Soc. Am. 1999, 9, 1189–1206. [Google Scholar] [CrossRef]
- Savage, M.; Mast, J.N. How resilient are southwestern ponderosa pine forests after crown fires? Can. J. For. Res. 2005, 35, 967–977. [Google Scholar] [CrossRef]
- Williams, J. Exploring the onset of high-impact mega-fires through a forest land management prism. For. Ecol. Manag. 2013, 294, 4–10. [Google Scholar] [CrossRef]
- Mallek, C.; Safford, H.; Viers, J.; Miller, J. Modern departures in fire severity and area vary by forest type, Sierra Nevada and southern Cascades, California, USA. Ecosphere 2013, 4, 1–28. [Google Scholar] [CrossRef]
- O’Connor, C.D.; Falk, D.A.; Lynch, A.M.; Swetnam, T.W. Fire severity, size, and climate associations diverge from historical precedent along an ecological gradient in the Pinaleño Mountains, Arizona, USA. For. Ecol. Manag. 2014, 329, 264–278. [Google Scholar] [CrossRef]
- Fornwalt, P.J.; Huckaby, L.S.; Alton, S.K.; Kaufmann, M.R.; Brown, P.M.; Cheng, A.S. Did the 2002 Hayman Fire, Colorado, USA, burn with uncharacteristic severity. Fire Ecol. 2016, 12, 117–132. [Google Scholar] [CrossRef]
- Chambers, M.E.; Fornwalt, P.J.; Malone, S.L.; Battaglia, M.A. Patterns of conifer regeneration following high severity wildfire in ponderosa pine—Dominated forests of the Colorado Front Range. For. Ecol. Manag. 2016, 378, 57–67. [Google Scholar] [CrossRef]
- Rother, M.T.; Veblen, T.T. Limited conifer regeneration following wildfires in dry ponderosa pine forests of the Colorado Front Range. Ecosphere 2016, 7. [Google Scholar] [CrossRef]
- Stevens-Rumann, C.S.; Kemp, K.B.; Higuera, P.E.; Harvey, B.J.; Rother, M.T.; Donato, D.C.; Morgan, P.; Veblen, T.T. Evidence for declining forest resilience to wildfires under climate change. Ecol. Lett. 2018, 21, 243–252. [Google Scholar] [CrossRef] [PubMed]
- Coop, J.D.; Parks, S.A.; Mcclernan, S.R.; Holsinger, L.M. Influences of prior wildfires on vegetation response to subsequent fire in a reburned southwestern landscape. Ecol. Appl. 2016, 26, 346–354. [Google Scholar] [CrossRef] [PubMed]
- Coppoletta, M.; Merriam, K.E.; Collins, B.M. Post-fire vegetation and fuel development influences fire severity patterns in reburns. Ecol. Appl. 2016, 26, 686–699. [Google Scholar] [CrossRef] [PubMed]
- Stevens-Rumann, C.; Morgan, P. Repeated wildfires alter forest recovery of mixed-conifer ecosystems. Ecol. Appl. 2016, 26, 1842–1853. [Google Scholar] [CrossRef] [PubMed]
- Mast, J.N.; Fule, P.Z.; Moore, M.M.; Covington, W.W.; Waltz, A.E.M. Restoration of presettlement age structure of an Arizona ponderosa pine forest. Ecol. Appl. 1999, 9, 228–239. [Google Scholar] [CrossRef]
- Brown, R.T.; Agee, J.K.; Franklin, J.F. Forest restoration and fire: Principles in the context of place. Conserv. Biol. 2004, 18, 903–912. [Google Scholar] [CrossRef]
- Agee, J.K.; Skinner, C.N. Basic principles of forest fuel reduction treatments. For. Ecol. Manag. 2005, 211, 83–96. [Google Scholar] [CrossRef]
- North, M.; Brough, A.; Long, J.; Collins, B.; Bowden, P.; Yasuda, D.; Miller, J.; Sugihara, N. Constraints on Mechanized Treatment Significantly Limit Mechanical Fuels Reduction Extent in the Sierra Nevada. J. For. 2015, 113, 40–48. [Google Scholar] [CrossRef]
- Moritz, M.A.; Batllori, E.; Bradstock, R.A.; Gill, A.M.; Handmer, J.; Hessburg, P.F.; Leonard, J.; McCaffrey, S.; Odion, D.C.; Schoennagel, T.; et al. Learning to coexist with wildfire. Nature 2014, 515, 58. [Google Scholar] [CrossRef] [PubMed]
- North, M.P.; Stephens, S.L.; Collins, B.M.; Agee, J.K.; Aplet, G.; Franklin, J.F.; Fulé, P.Z. Reform Forest Fire Management. Science 2015, 349, 1280–1281. [Google Scholar] [CrossRef] [PubMed]
- Allen, C.D.; Savage, M.; Falk, D.A.; Suckling, K.F.; Swetnam, T.W.; Schulke, T.; Stacey, P.B.; Morgan, P.; Hoffman, M.; Klingel, J.T. Ecological restoration of southwestern ponderosa pine ecosystems: A broad perspective. Ecol. Appl. 2002, 12, 1418–1433. [Google Scholar] [CrossRef]
- Zimmerman, T.; Frary, T.; Crook, S.; Fay, B.; Koppenol, P.; Lasko, R. Wildland fire use: Challenges associated with program management across multiple ownerships and land use situations. In Fuels Manag How to Meas Success; Andrews, P.L., Butl, B.W., Eds.; USDA For Serv Rocky Mt Res Station: Fort Collins, CO, USA, 2006; p. 809. [Google Scholar]
- Krawchuk, M.A.; Haire, S.L.; Coop, J.; Parisien, M.-A.; Whitman, E.; Chong, G.; Miller, C. Topographic and fire weather controls of fire refugia in forested ecosystems of northwestern North America. Ecosphere 2016, 7. [Google Scholar] [CrossRef]
- Camp, A.; Oliver, C.; Hessburg, P.; Everett, R. Predicting late-successional fire refugia pre-dating European settlement in the Wenatchee Mountains. For. Ecol. Manag. 1997, 95, 63–77. [Google Scholar] [CrossRef]
- Parks, S.A.; Dillon, G.K.; Miller, C. A new metric for quantifying burn severity: The relativized burn ratio. Remote Sens. 2014, 6, 1827–1844. [Google Scholar] [CrossRef]
- Rollins, M.G. LANDFIRE: A nationally consistent vegetation, wildland fire, and fuel assessment. Int. J. Wildl. Fire 2009, 18, 235–249. [Google Scholar] [CrossRef]
- Olson, D.M.; Dinerstein, E. The Global 200: Priority ecoregions for global conservation. Ann. Mo. Bot. Gard. 2002, 89, 199–224. [Google Scholar] [CrossRef]
- AdaptWest Project. Gridded Current and Projected Climate Data for North America at 1 km Resolution, Interpolated Using the ClimateNA v5.10 Software [Internet]. 2015. Available online: adaptwest.databasin.org (accessed on 2 April 2015).
- Fick, S.E.; Hijmans, R.J. WorldClim 2: New 1-km spatial resolution climate surfaces for global land areas. Int. J. Climatol. 2017, 37, 4302–4315. [Google Scholar] [CrossRef]
- Rollins, M.G.; Morgan, P.; Swetnam, T. Landscape-scale controls over 20th century fire occurrence in two large Rocky Mountain (USA) wilderness areas. Landsc. Ecol. 2002, 17, 539–557. [Google Scholar] [CrossRef]
- Adams, D.K.; Comrie, A.C. The north American monsoon. Bull. Am. Meteorol. Soc. 1997, 78, 2197–2213. [Google Scholar] [CrossRef]
- Holden, Z.A.; Morgan, P.; Evans, J.S. A predictive model of burn severity based on 20-year satellite-inferred burn severity data in a large southwestern US wilderness area. For. Ecol. Manag. 2009, 258, 2399–2406. [Google Scholar] [CrossRef]
- Swetnam, T.W.; Dieterich, J.H. Fire history of ponderosa pine forests in the Gila Wilderness, New Mexico. In Gen Tech Rep INT-GTR-182; US Department of Agriculture, Forest Service, Intermountain Forest and Range Experiment Station: Ogden, UT, USA, 1985. [Google Scholar]
- Savage, M.; Mast, J.N.; Feddema, J.J. Double whammy: High-severity fire and drought in ponderosa pine forests of the Southwest. Can. J. For. Res. 2013, 43, 570–583. [Google Scholar] [CrossRef]
- Walker, R.B.; Coop, J.D.; Parks, S.A.; Trader, L. Fire regimes approaching historic norms reduce wildfire-facilitated conversion from forest to non-forest. Ecosphere 2018, in press. [Google Scholar]
- Dillon, G.K.; Holden, Z.A.; Morgan, P.; Crimmins, M.A.; Heyerdahl, E.K.; Luce, C.H. Both topography and climate affected forest and woodland burn severity in two regions of the western US, 1984 to 2006. Ecosphere 2011, 2. [Google Scholar] [CrossRef]
- Eidenshink, J.C.; Schwind, B.; Brewer, K.; Zhu, Z.-L.; Quayle, B.; Howard, S.M. A project for monitoring trends in burn severity. Fire Ecol. 2007, 3, 3–21. [Google Scholar] [CrossRef]
- Key, C.H. Ecological and sampling constraints on defining landscape fire severity. Fire Ecol. 2006, 2, 34–59. [Google Scholar] [CrossRef]
- Pettorelli, N.; Vik, J.O.; Mysterud, A.; Gaillard, J.-M.; Tucker, C.J.; Stenseth, N.C. Using the satellite-derived NDVI to assess ecological responses to environmental change. Trends Ecol. Evol. 2005, 20, 503–510. [Google Scholar] [CrossRef] [PubMed]
- Chu, T.; Guo, X.; Takeda, K. Temporal dependence of burn severity assessment in Siberian larch (Larix sibirica) forest of northern Mongolia using remotely sensed data. Int. J. Wildl. Fire 2016, 25, 685–698. [Google Scholar] [CrossRef]
- McDonald, A.J.; Gemmell, F.M.; Lewis, P.E. Investigation of the utility of spectral vegetation indices for determining information on coniferous forests. Remote Sens. Environ. 1998, 66, 250–272. [Google Scholar] [CrossRef]
- Huete, A.; Didan, K.; Miura, T.; Rodriguez, E.P.; Gao, X.; Ferreira, L.G. Overview of the radiometric and biophysical performance of the MODIS vegetation indices. Remote Sens. Environ. 2002, 83, 195–213. [Google Scholar] [CrossRef]
- Evans, I.S. General geomorphometry, derivatives of altitude, and descriptive statistics. In Spatial Analysis in Geomorphology; 1972; pp. 17–90. Available online: https://books.google.com/books/about/Spatial_Analysis_in_Geomorphology.html?id=rvANAAAAQAAJ (accessed on 21 March 2018).
- Flint, A.L.; Flint, L.E.; Hevesi, J.A.; Blainey, J.B. Fundamental concepts of recharge in the desert southwest: A regional modeling perspective. In Groundwater Recharge in a Desert Environment: The Southwestern United States; Hogan, J.F., Phillips, F.M., Scanlon, B.R., Eds.; 2004; Available online: https://agupubs.onlinelibrary.wiley.com/doi/book/10.1029/WS009 (accessed on 21 March 2018). [CrossRef]
- Wang, T.; Hamann, A.; Spittlehouse, D.; Carroll, C. Locally downscaled and spatially customizable climate data for historical and future periods for North America. PLoS ONE 2016, 11, e0156720. [Google Scholar] [CrossRef] [PubMed]
- Kane, V.R.; Cansler, C.A.; Povak, N.A.; Kane, J.T.; McGaughey, R.J.; Lutz, J.A.; Churchill, D.J.; North, M.P. Mixed severity fire effects within the Rim fire: Relative importance of local climate, fire weather, topography, and forest structure. For. Ecol. Manag. 2015, 358, 62–79. [Google Scholar] [CrossRef]
- Parks, S.A.; Parisien, M.A.; Miller, C.; Dobrowski, S.Z. Fire activity and severity in the western US vary along proxy gradients representing fuel amount and fuel moisture. PLoS ONE 2014, 9, e99699. [Google Scholar] [CrossRef] [PubMed]
- McKenzie, D.; Littell, J.S. Climate change and the eco-hydrology of fire: Will area burned increase in a warming western USA? Ecol. Appl. 2017, 27, 26–36. [Google Scholar] [CrossRef] [PubMed]
- USDA Forest Service. MODIS Fire Detection GIS Data [Internet]. 2016. Available online: http://activefiremaps.fs.fed.us/gisdata.php (accessed on 3 January 2016).
- Abatzoglou, J.T.; Kolden, C.A.; Williams, A.P.; Lutz, J.A.; Smith, A.M.S. Climatic influences on interannual variability in regional burn severity across western US forests. Int. J. Wildl. Fire 2017, 26, 269–275. [Google Scholar] [CrossRef]
- Keyser, A.; Westerling, A. Climate drives inter-annual variability in probability of high severity fire occurrence in the western United States. Environ. Res. Lett. 2017, 12, 065003. [Google Scholar] [CrossRef]
- Huang, C.; Goward, S.N.; Masek, J.G.; Thomas, N.; Zhu, Z.; Vogelmann, J.E. An automated approach for reconstructing recent forest disturbance history using dense Landsat time series stacks. Remote Sens. Environ. 2010, 114, 183–198. [Google Scholar] [CrossRef]
- Stevens-Rumann, C.; Prichard, S.; Strand, E.; Morgan, P. Prior wildfires influence burn severity of subsequent large fires. Can. J. For. Res. 2016, 46, 1375–1385. [Google Scholar] [CrossRef]
- Parks, S.A.; Miller, C.; Nelson, C.R.; Holden, Z.A. Previous Fires Moderate Burn Severity of Subsequent Wildland Fires in Two Large Western US Wilderness Areas. Ecosystems 2014, 17, 29–42. [Google Scholar] [CrossRef]
- Kane, V.R.; Lutz, J.A.; Alina Cansler, C.; Povak, N.A.; Churchill, D.J.; Smith, D.F.; Kane, J.T.; North, M.P. Water balance and topography predict fire and forest structure patterns. For. Ecol. Manag. 2015, 338, 1–13. [Google Scholar] [CrossRef]
- R Core Team. R: A Language and Environment for Statistical Computing [Internet]; R foundation for Statistical Computing: Vienna, Austria, 2016; Available online: https://www.r-project.org/ (accessed on 1 July 2017).
- Parks, S.A.; Holsinger, L.M.; Panunto, M.H.; Jolly, W.M.; Dobrowski, S.Z.; Dillon, G.K. High-severity fire: Evaluating its key drivers and mapping its probability across western US forests. Environ. Res. Lett. 2018, in press. [Google Scholar] [CrossRef]
- Cansler, C.A.; McKenzie, D. Climate, fire size, and biophysical setting control fire severity and spatial pattern in the northern Cascade Range, USA. Ecol. Appl. Ecol. Soc. Am. 2014, 24, 1037–1056. [Google Scholar] [CrossRef]
- Harvey, B.J.; Donato, D.C.; Turner, M.G. Drivers and trends in landscape patterns of stand-replacing fire in forests of the US Northern Rocky Mountains (1984–2010). Landsc. Ecol. 2016, 1–17. [Google Scholar] [CrossRef]
- North, M.; Collins, B.M.; Stephens, S. Using fire to increase the scale, benefits, and future maintenance of fuels treatments. J. For. Soc. Am. For. 2012, 110, 392–401. [Google Scholar] [CrossRef]
- Stephens, S.L.; Collins, B.M.; Biber, E.; Fulé, P.Z. US federal fire and forest policy: Emphasizing resilience in dry forests. Ecosphere 2016, 7. [Google Scholar] [CrossRef]
- Tepley, A.J.; Thompson, J.R.; Epstein, H.E.; Anderson-Teixeira, K.J. Vulnerability to forest loss through altered postfire recovery dynamics in a warming climate in the Klamath Mountains. Glob. Chang. Biol. 2017, 23, 4117–4132. [Google Scholar] [CrossRef] [PubMed]
- Fang, L.; Yang, J.; Zu, J.; Li, G.; Zhang, J. Quantifying influences and relative importance of fire weather, topography, and vegetation on fire size and fire severity in a Chinese boreal forest landscape. For. Ecol. Manag. 2015, 356, 2–12. [Google Scholar] [CrossRef]
- Lydersen, J.M.; Collins, B.M.; Brooks, M.L.; Matchett, J.R.; Shive, K.L.; Povak, N.A.; Kane, V.R.; Smith, D.F. Evidence of fuels management and fire weather influencing fire severity in an extreme fire event. Ecol. Appl. 2017, 27, 2013–2030. [Google Scholar] [CrossRef] [PubMed]
- Harris, L.; Taylor, A.H. Topography, Fuels, and Fire Exclusion Drive Fire Severity of the Rim Fire in an Old-Growth Mixed-Conifer Forest, Yosemite National Park, USA. Ecosystems 2015, 18, 1192–1208. [Google Scholar] [CrossRef]
- Fang, L.; Yang, J.; White, M.; Liu, Z. Predicting Potential Fire Severity Using Vegetation, Topography and Surface Moisture Availability in a Eurasian Boreal Forest Landscape. Forests 2018, 9, 130. [Google Scholar] [CrossRef]
- Birch, D.S.; Morgan, P.; Kolden, C.A.; Abatzoglou, J.T.; Dillon, G.K.; Hudak, A.T.; Smith, A.M.S. Vegetation, topography and daily weather influenced burn severity in central Idaho and western Montana forests. Ecosphere 2015, 6. [Google Scholar] [CrossRef]
- Kennedy, M.C.; Johnson, M.C. Fuel treatment prescriptions alter spatial patterns of fire severity around the wildland—Urban interface during the Wallow Fire, Arizona, USA. For. Ecol. Manag. 2014, 318, 122–132. [Google Scholar] [CrossRef]
- Mitchell, S.R.; Harmon, M.E.; O’connell, K.E.B. Forest fuel reduction alters fire severity and long-term carbon storage in three Pacific Northwest ecosystems. Ecol. Appl. 2009, 19, 643–655. [Google Scholar] [CrossRef] [PubMed]
- Ager, A.A.; Finney, M.A.; Kerns, B.K.; Maffei, H. Modeling wildfire risk to northern spotted owl (Strix occidentalis caurina) habitat in Central Oregon, USA. For. Ecol. Manag. 2007, 246, 45–56. [Google Scholar] [CrossRef]
- Finney, M.A.; McHugh, C.W.; Grenfell, I.C. Stand- and landscape-level effects of prescribed burning on two Arizona wildfires. Can. J. For. Res. 2005, 35, 1714–1722. [Google Scholar] [CrossRef]
- Wimberly, M.C.; Cochrane, M.A.; Baer, A.D.; Pabst, K. Assessing fuel treatment effectiveness using satellite imagery and spatial statistics. Ecol. Appl. 2009, 19, 1377–1384. [Google Scholar] [CrossRef] [PubMed]
- Preisler, H.K.; Riley, K.L.; Stonesifer, C.S.; Calkin, D.E.; Jolly, W.M. Near-term probabilistic forecast of significant wildfire events for the Western United States. Int. J. Wildl. Fire 2016, 25, 1169–1180. [Google Scholar] [CrossRef]
- Preisler, H.K.; Westerling, A.L.; Gebert, K.M.; Munoz-Arriola, F.; Holmes, T.P. Spatially explicit forecasts of large wildland fire probability and suppression costs for California. Int. J. Wildl. Fire 2011, 20, 508–517. [Google Scholar] [CrossRef]
- Estes, B.L.; Knapp, E.E.; Skinner, C.N.; Miller, J.D.; Preisler, H.K. Factors influencing fire severity under moderate burning conditions in the Klamath Mountains, northern California, USA. Ecosphere 2017, 8. [Google Scholar] [CrossRef]
- Parks, S.A.; Holsinger, L.M.; Miller, C.; Parisien, M.-A. Analog-based fire regime and vegetation shifts in mountainous regions of the western US. Ecography 2018, in press. [Google Scholar] [CrossRef]
- Kolden, C.A.; Lutz, J.A.; Key, C.H.; Kane, J.T.; van Wagtendonk, J.W. Mapped versus actual burned area within wildfire perimeters: Characterizing the unburned. For. Ecol. Manag. 2012, 286, 38–47. [Google Scholar] [CrossRef]
- Kolden, C.A.; Abatzoglou, J.T.; Lutz, J.A.; Cansler, C.A.; Kane, J.T.; Van Wagtendonk, J.W.; Key, C.H. Climate contributors to forest mosaics: Ecological persistence following wildfire. Northwest Sci. 2015, 89, 219–238. [Google Scholar] [CrossRef]
- Meddens, A.J.H.; Kolden, C.A.; Lutz, J.A. Detecting unburned areas within wildfire perimeters using Landsat and ancillary data across the northwestern United States. Remote Sens. Environ. 2016, 186, 275–285. [Google Scholar] [CrossRef]
- Kolden, C.A.; Bleeker, T.M.; Smith, A.; Poulos, H.M.; Camp, A.E. Fire Effects on Historical Wildfire Refugia in Contemporary Wildfires. Forests 2017, 8, 400. [Google Scholar] [CrossRef]
- Haire, S.L.; Coop, J.D.; Miller, C. Characterizing Spatial Neighborhoods of Refugia Following Large Fires in Northern New Mexico USA. Land 2017, 6, 19. [Google Scholar] [CrossRef]
- Berry, L.E.; Driscoll, D.A.; Stein, J.A.; Blanchard, W.; Banks, S.C.; Bradstock, R.A.; Lindenmayer, D.B. Identifying the location of fire refuges in wet forest ecosystems. Ecol. Appl. 2015, 25, 2337–2348. [Google Scholar] [CrossRef] [PubMed]
- Morgan, P.; Keane, R.E.; Dillon, G.K.; Jain, T.B.; Hudak, A.T.; Karau, E.C.; Sikkink, P.G.; Holden, Z.A.; Strand, E.K. Challenges of assessing fire and burn severity using field measures, remote sensing and modelling. Int. J. Wildl. Fire 2014, 23, 1045–1060. [Google Scholar] [CrossRef]
- Reinhardt, E.D.; Keane, R.E.; Brown, J.K. Modeling fire effects. Int. J. Wildl. Fire 2001, 10, 373–380. [Google Scholar] [CrossRef]
- Parks, S.A. Mapping day-of-burning with coarse-resolution satellite fire-detection data. Int. J. Wildl. Fire 2014, 23, 215–223. [Google Scholar] [CrossRef]
- Veraverbeke, S.; Sedano, F.; Hook, S.J.; Randerson, J.T.; Jin, Y.; Rogers, B.M. Mapping the daily progression of large wildland fires using MODIS active fire data. Int. J. Wildl. Fire 2014, 23, 655–667. [Google Scholar] [CrossRef]
- Holsinger, L.; Parks, S.A.; Miller, C. Weather, fuels, and topography impede wildland fire spread in western US landscapes. For. Ecol. Manag. 2016, 380. [Google Scholar] [CrossRef]
- Finney, M.A. The challenge of quantitative risk analysis for wildland fire. For. Ecol. Manag. 2005, 211, 97–108. [Google Scholar] [CrossRef]
- Safford, H.D.; Stevens, J.T.; Merriam, K.; Meyer, M.D.; Latimer, A.M. Fuel treatment effectiveness in California yellow pine and mixed conifer forests. For. Ecol. Manag. 2012, 274, 17–28. [Google Scholar] [CrossRef]
- Ryan, K.C.; Knapp, E.E.; Varner, J.M. Prescribed fire in North American forests and woodlands: History, current practice, and challenges. Front. Ecol. Environ. 2013, 11, s1. [Google Scholar] [CrossRef]
- Vaillant, N.M.; Fites-Kaufman, J.A.; Stephens, S.L. Effectiveness of prescribed fire as a fuel treatment in Californian coniferous forests. Int. J. Wildl. Fire 2009, 18, 165–175. [Google Scholar] [CrossRef]
- Becker, K.M.L.; Lutz, J.A. Can low-severity fire reverse compositional change in montane forests of the Sierra Nevada, California, USA? Ecosphere 2016, 7. [Google Scholar] [CrossRef]
- Collins, B.M.; Miller, J.D.; Thode, A.E.; Kelly, M.; van Wagtendonk, J.W.; Stephens, S.L. Interactions Among Wildland Fires in a Long-Established Sierra Nevada Natural Fire Area. Ecosystems 2009, 12, 114–128. [Google Scholar] [CrossRef]
- Hood, S.; Sala, A.; Heyerdahl, E.K.; Boutin, M. Low-severity fire increases tree defense against bark beetle attacks. Ecology 2015, 96, 1846–1855. [Google Scholar] [CrossRef] [PubMed]
- Fulé, P.Z.; Swetnam, T.W.; Brown, P.M.; Falk, D.A.; Peterson, D.L.; Allen, C.D.; Aplet, G.H.; Battaglia, M.A.; Binkley, D.; Farrsi, C.; et al. Unsupported inferences of high-severity fire in historical dry forests of the western United States: Response to Williams and Baker. Glob. Ecol. Biogeogr. 2014, 23, 825–830. [Google Scholar] [CrossRef]

| Group | Variable Name | Description | Source |
|---|---|---|---|
| Live fuel | NDVI | Normalized differenced vegetation index. Calculated using pre-fire imagery distributed by the Monitoring Trends in Burn Severity (MTBS) program [41]. | Pettorelli et al. [44] |
| NDMI | Normalized differenced moisture index. Calculated using pre-fire imagery distributed by MTBS [41]. | McDonald et al. [46] | |
| EVI | Enhanced vegetation index. Calculated using pre-fire imagery distributed by MTBS [41]. | Huete [47] | |
| Topography | DISS | Dissection index with a 450 m radius. DISS is a measure of topographic complexity. | Evans [48] |
| TPI | Topographic position index. TPI is a measure of valley bottom vs. ridge top and measures the elevational difference (meters) between each pixel and an annulus with a 2000-m radius. | NA | |
| SRAD | Potential solar radiation, as calculated using the SOLPET6 model. | Flint et al. [49] | |
| Slope | Slope angle | NA | |
| Climate | CMD | Climatic moisture deficit [49]. Mean over the 1981–2010 time period. | Wang et al. [50]; https://adaptwest.databasin.org/ |
| ET | Evapotranspiration (i.e., Eref-CMD). Mean over the 1981–2010 time period. | ||
| MAT | Mean annual temperature. Mean over the 1981–2010 time period. | ||
| Inter-annual climate variation | Temp.z | Mean June temperature for the year in which the fire occurred. Converted to a z-score. | ClimateNA software package; Wang et al. [50] |
| ET.z | Mean June evapotranspiration for the year in which the fire occurred. Converted to a z-score. | ||
| CMD.z | Mean June climatic moisture deficit for the year in which the fire occurred. Converted to a z-score. |
© 2018 by the authors. Licensee MDPI, Basel, Switzerland. This article is an open access article distributed under the terms and conditions of the Creative Commons Attribution (CC BY) license (http://creativecommons.org/licenses/by/4.0/).
Share and Cite
Parks, S.A.; Dobrowski, S.Z.; Panunto, M.H. What Drives Low-Severity Fire in the Southwestern USA? Forests 2018, 9, 165. https://doi.org/10.3390/f9040165
Parks SA, Dobrowski SZ, Panunto MH. What Drives Low-Severity Fire in the Southwestern USA? Forests. 2018; 9(4):165. https://doi.org/10.3390/f9040165
Chicago/Turabian StyleParks, Sean A., Solomon Z. Dobrowski, and Matthew H. Panunto. 2018. "What Drives Low-Severity Fire in the Southwestern USA?" Forests 9, no. 4: 165. https://doi.org/10.3390/f9040165
APA StyleParks, S. A., Dobrowski, S. Z., & Panunto, M. H. (2018). What Drives Low-Severity Fire in the Southwestern USA? Forests, 9(4), 165. https://doi.org/10.3390/f9040165