Designing Wood Supply Scenarios from Forest Inventories with Stratified Predictions

 , and
, and
Abstract
1. Introduction
2. Materials and Method
2.1. Focus
2.2. Data Sources
2.3. Response Attributes
2.4. Predicting Attributes
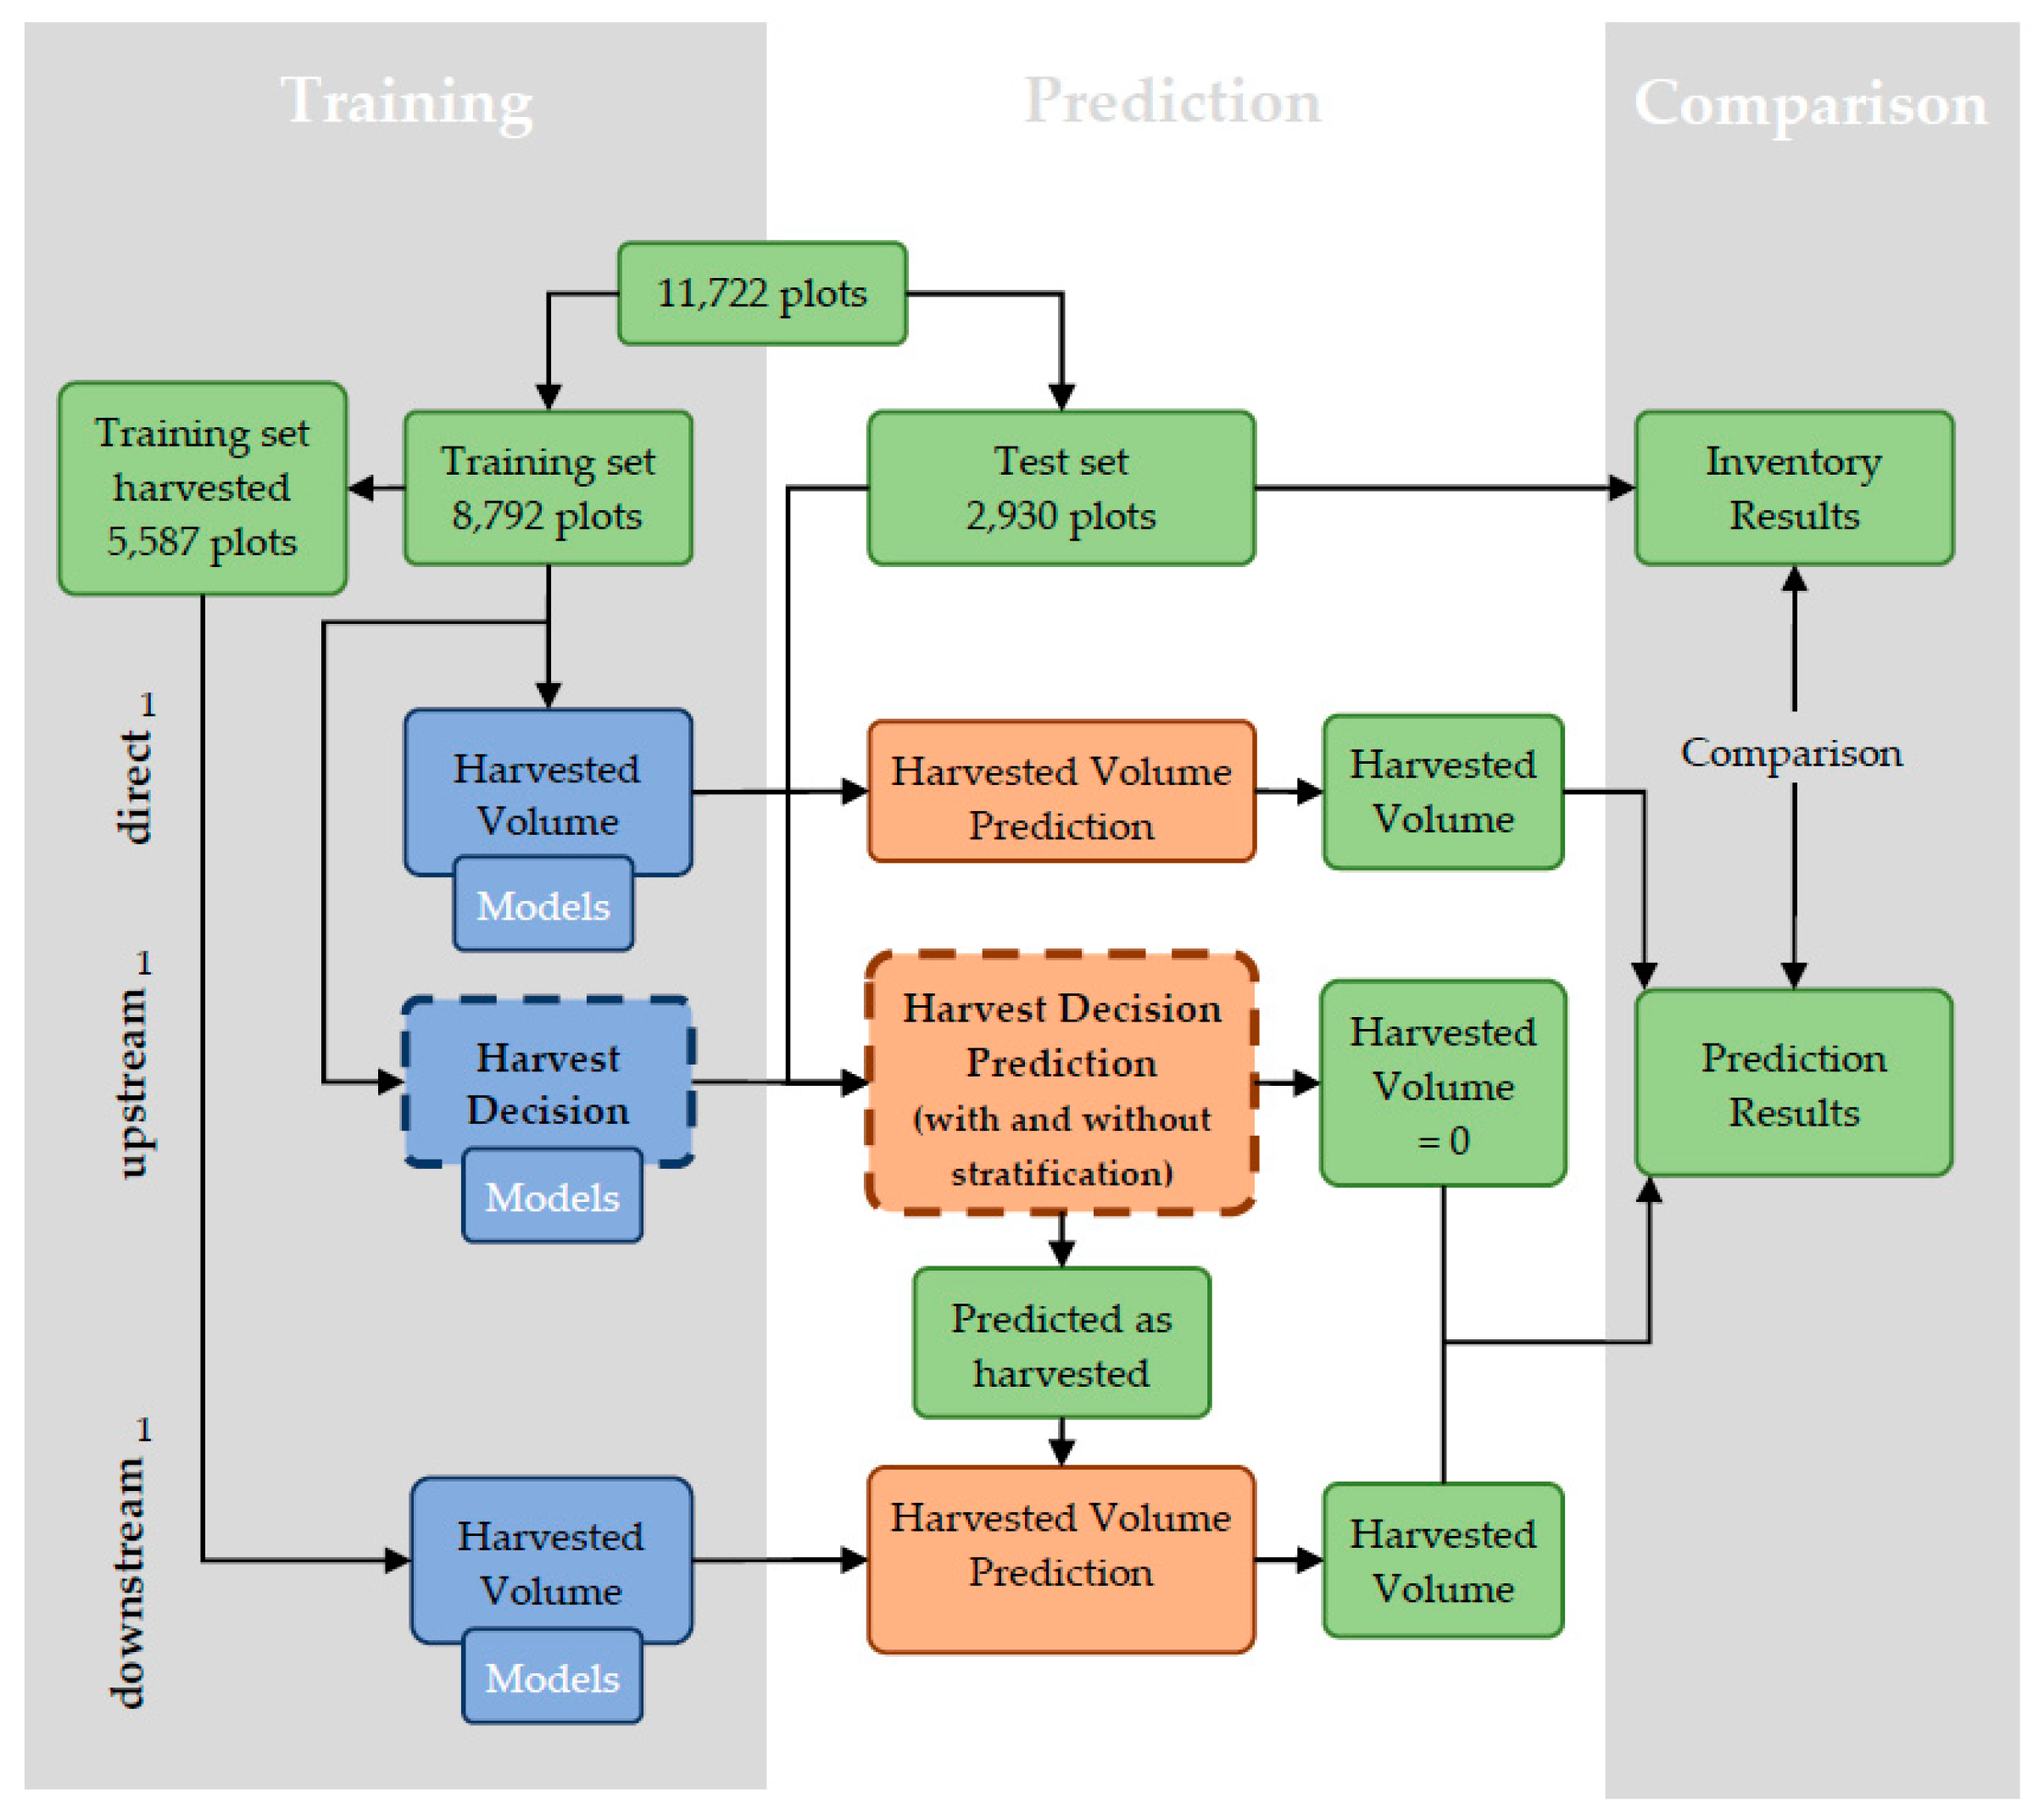
2.5. Research Design
2.6. Stratified Learning and Prediction
2.6.1. Stratification Model
2.6.2. Stratified Random Prediction
2.6.3. Stratified Trained Prediction
2.6.4. Harvested Volume Predictions
2.7. Direct Harvested Volumes Prediction
2.8. Harvested Decision Prediction with Logistic Regression
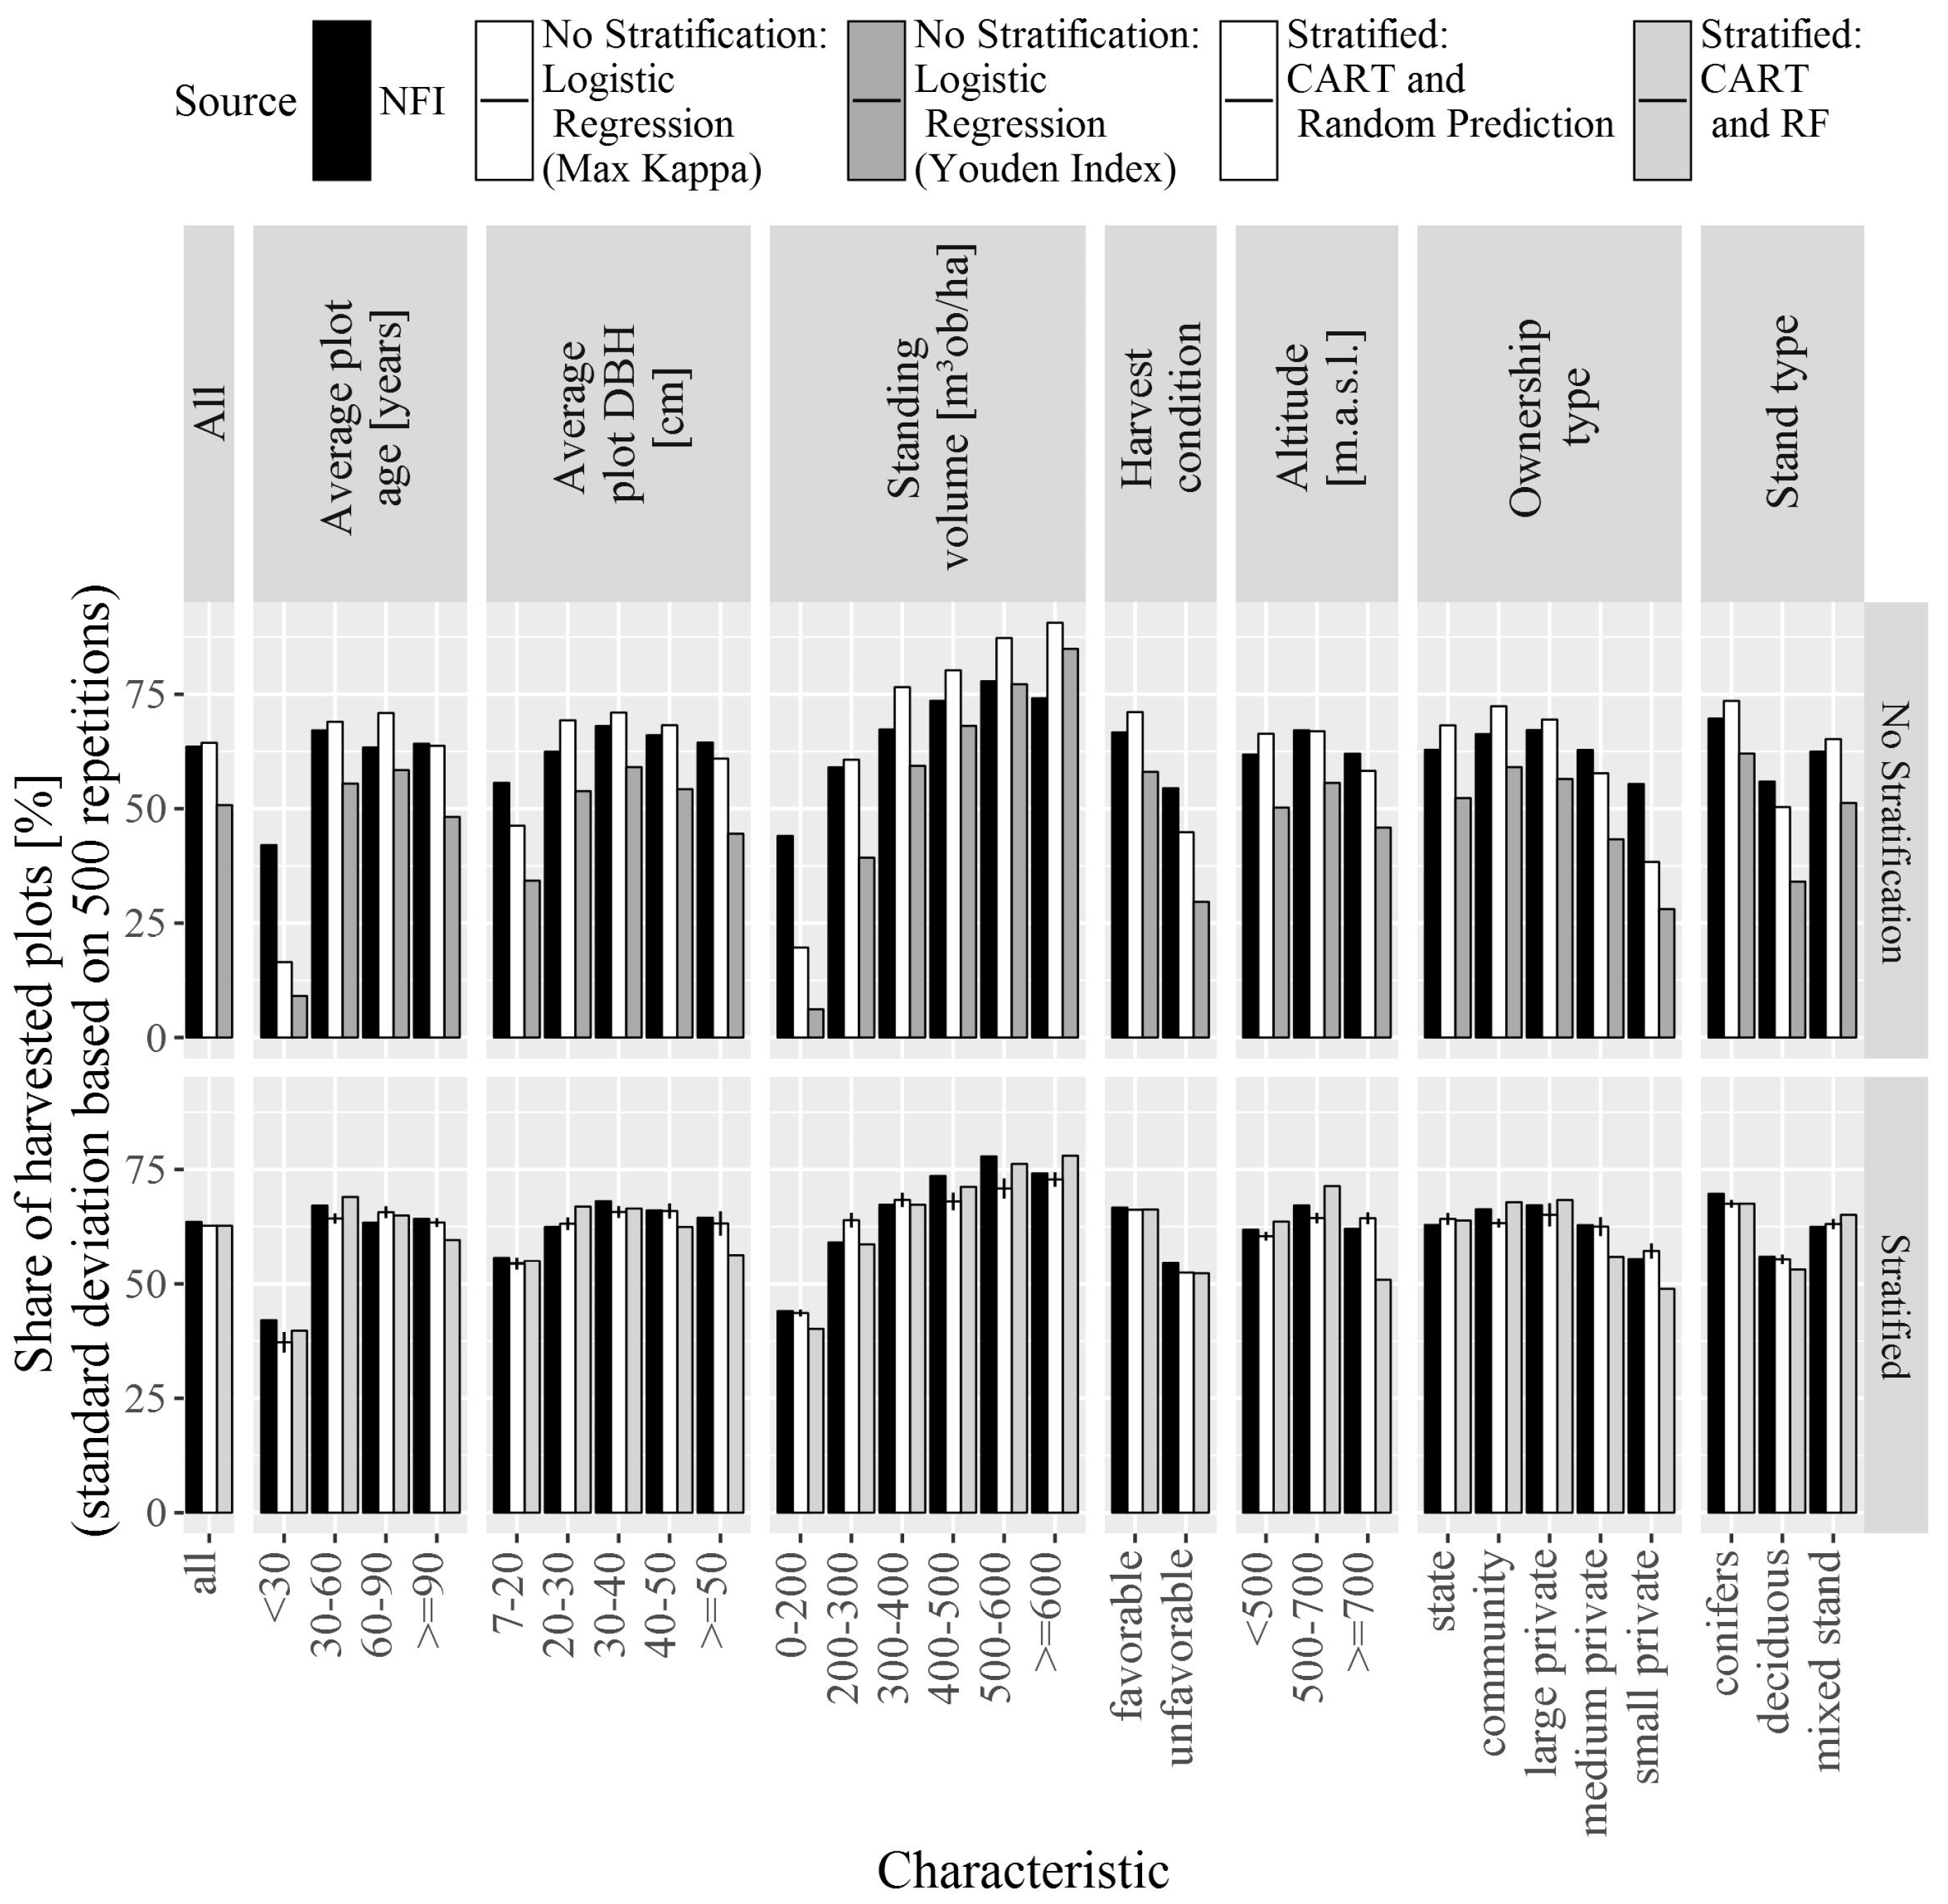
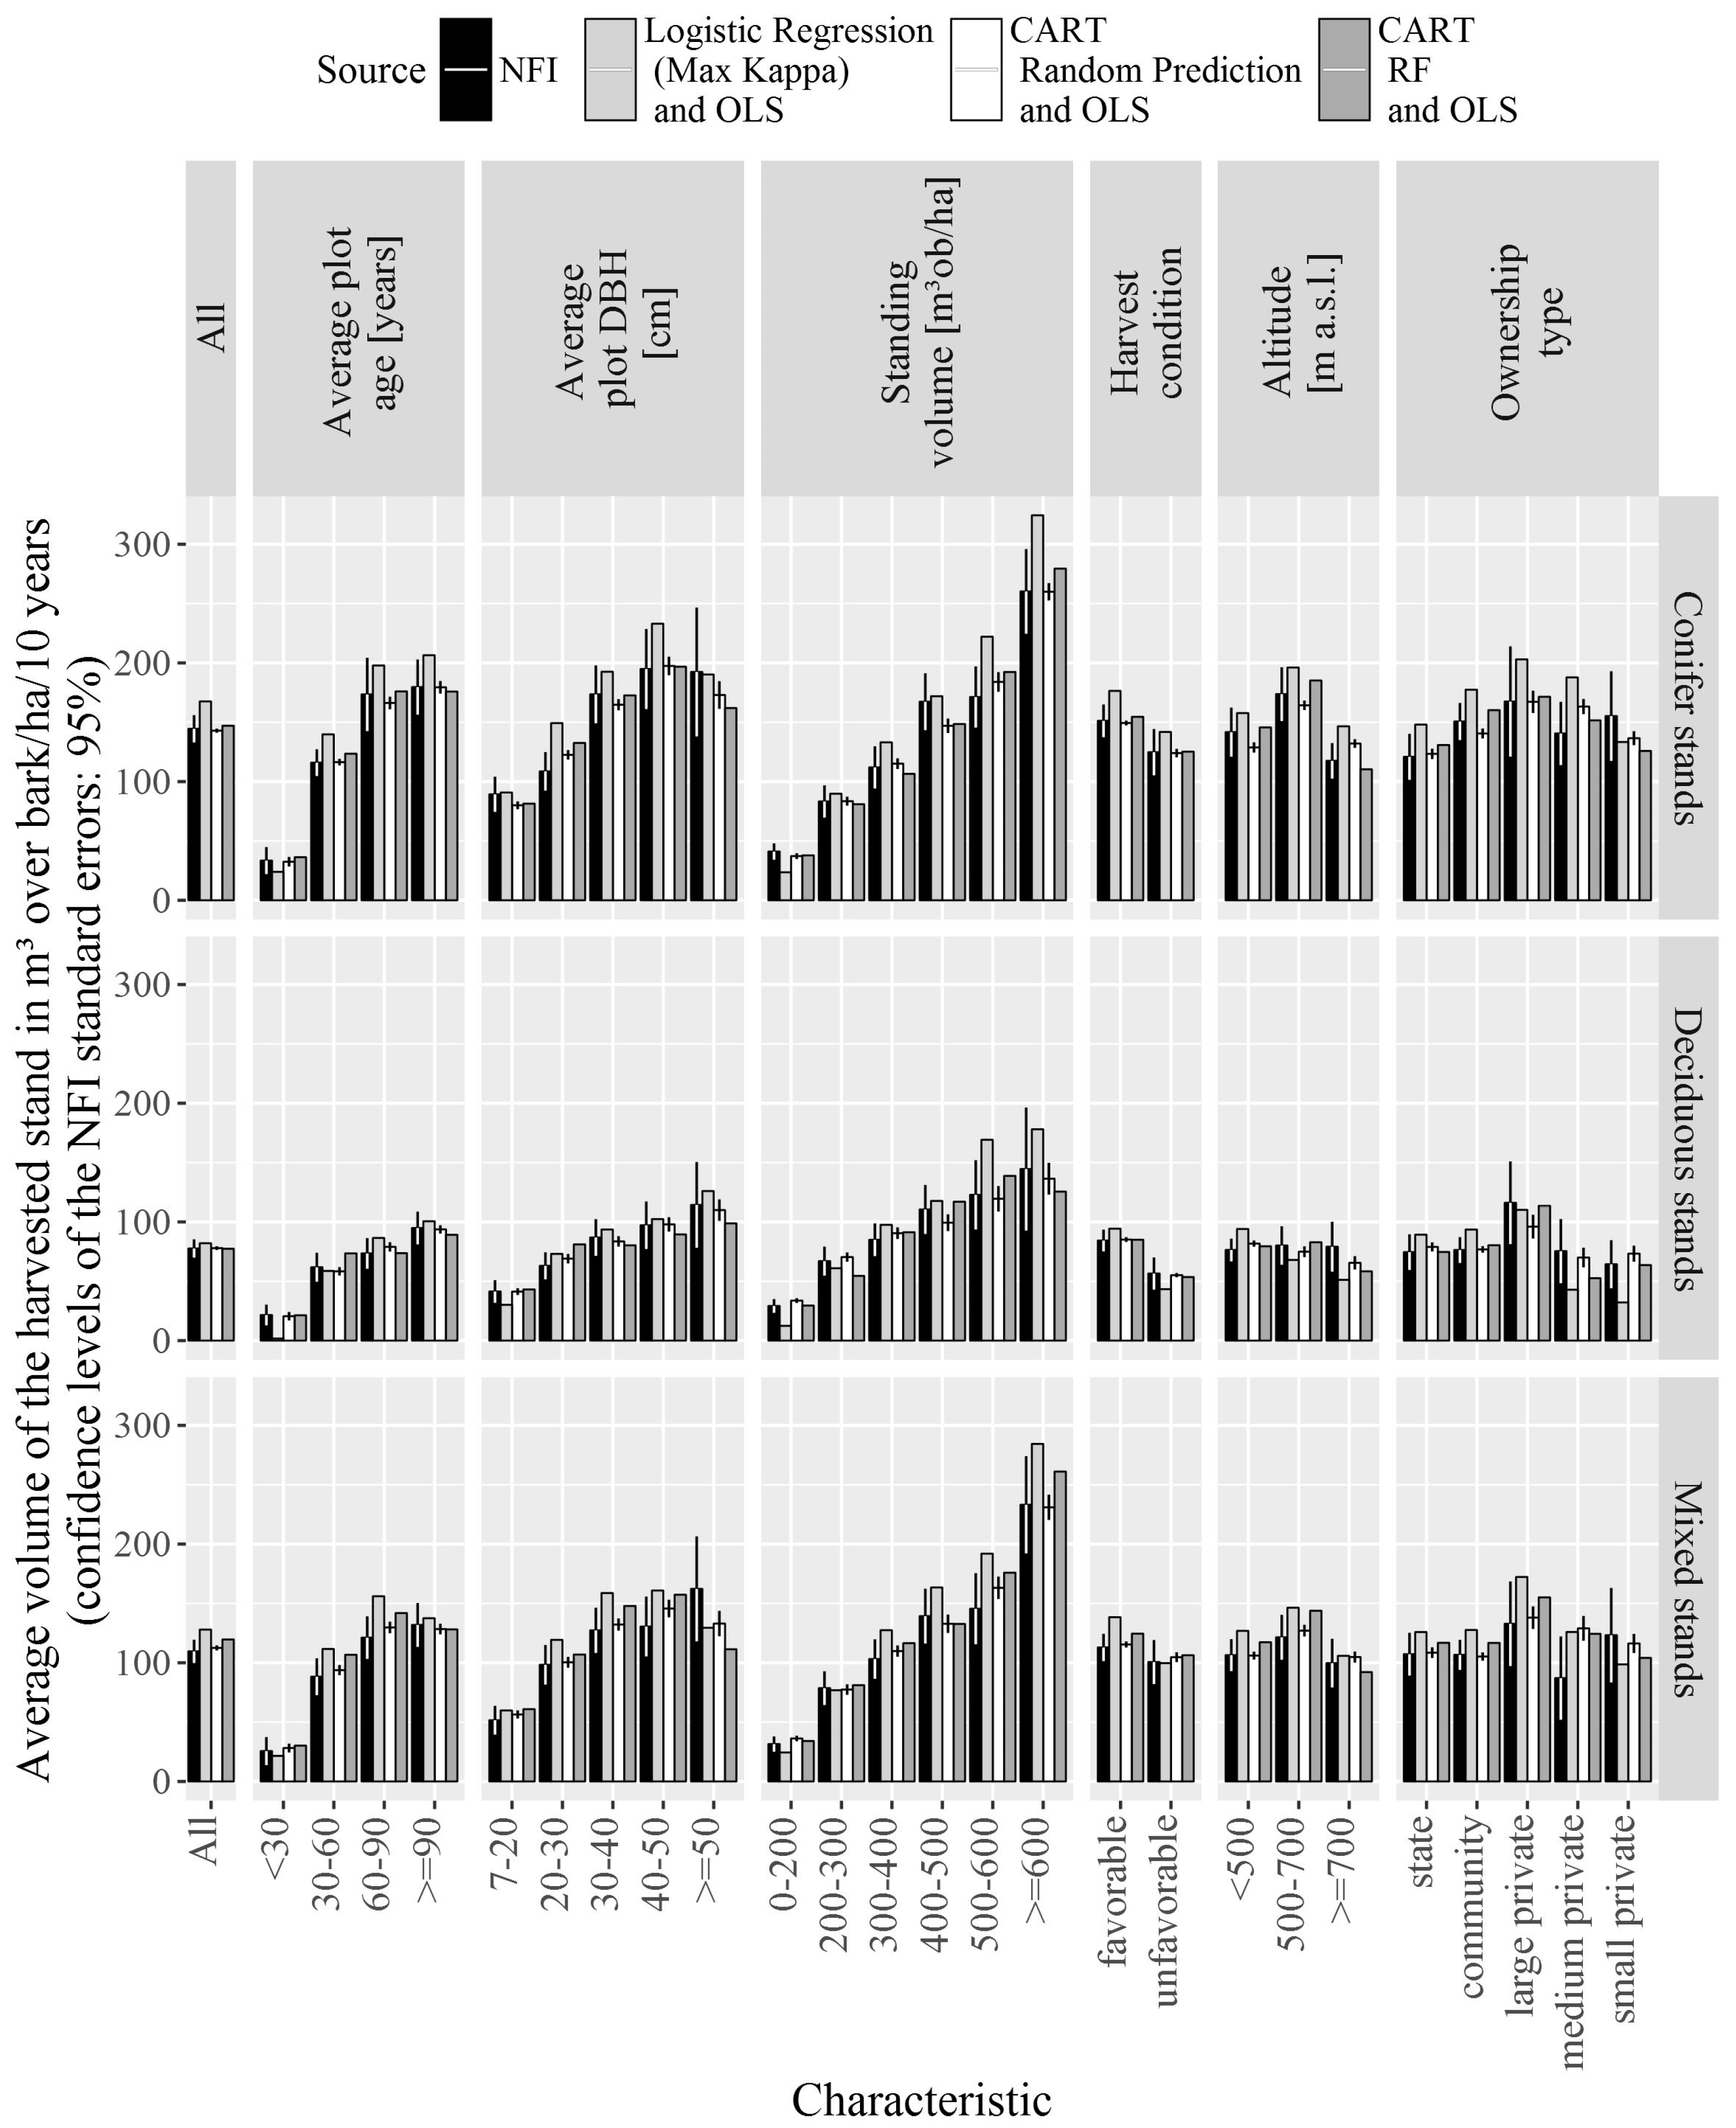
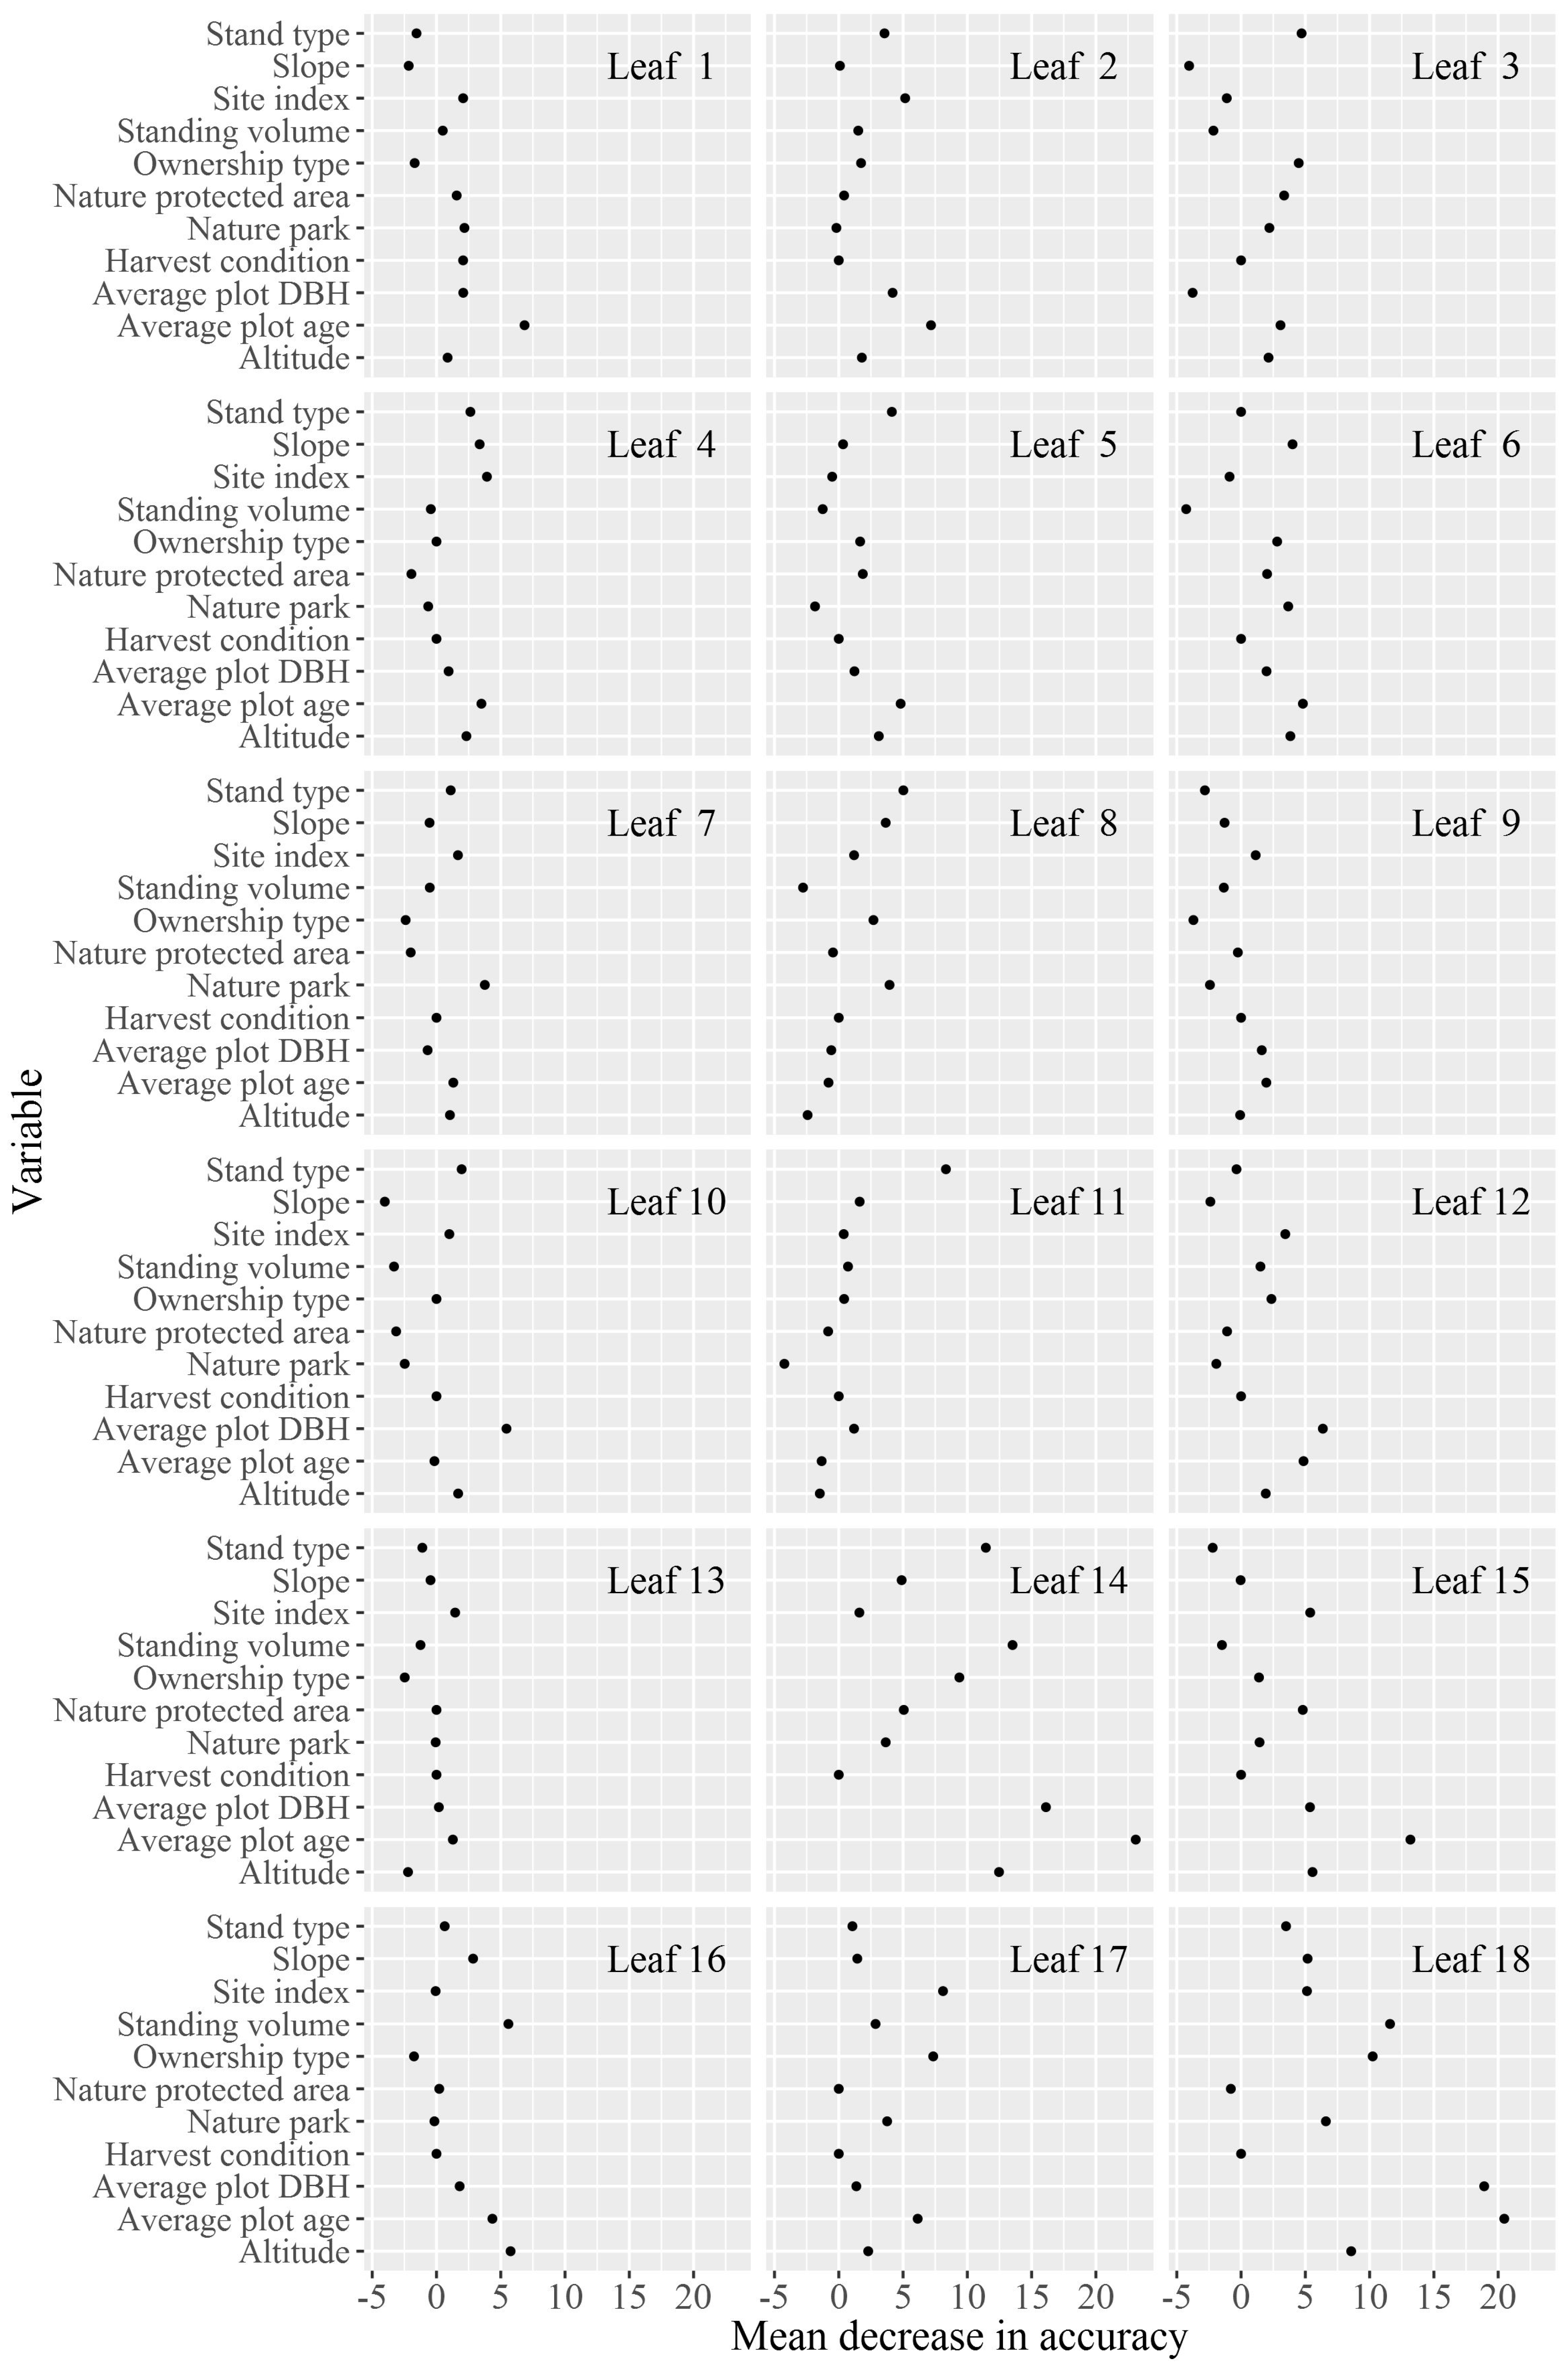
3. Results
4. Discussion
5. Conclusions
Acknowledgments
Author Contributions
Conflicts of Interest
Appendix A

| Variable | Range | Mean | SD |
|---|---|---|---|
| Harvested Volume (m³ob/ha in 10 years) | 0–1300 | 96.2 | 136.0 |
| Standing volume (m³ob/ha) | 6–2138 | 387.6 | 238.3 |
| Av. stand DBH2 (cm) | 7–124 | 32.6 | 13.0 |
| Av. stand age (years) | 12–380 | 79.7 | 37.3 |
| Slope (%) | 0–77 | 11.9 | 10.3 |
| Site index (m³ob/ha at the age of 100) | 2–21 | 10.0 | 4.12 |
| Altitude (m a.s.l.) | 90–1370 | 557.3 | 220.6 |
| Variable | Characteristics (with Frequencies) |
|---|---|
| Harvest decision | yes (7449); no (4273) |
| Stand type | conifers (4873); mixed (3571); deciduous (3278) |
| Harvest condition | favorable (8784); unfavorable (2938) |
| Nature park | yes (6232); no (5490) |
| Nature protected area | yes (11,352); no (370) |
| Ownership type | state (2795); community (4719); large private (1155); medium private (1432), small private (1621) |
| Stand Type | Description |
|---|---|
| Conifers 1 | spruce pure stand, spruce pure stand with small parts of coniferous trees, spruce pure stand with low parts of deciduous trees, spruce mixed stand with coniferous trees, fir pure stand, Douglas stand with low parts of deciduous or conifer trees, Douglas mixed stand with coniferous trees (some deciduous trees possible) |
| Mixed 1 | spruce mixed stand with coniferous and deciduous trees, spruce mixed stand with deciduous trees, spruce mixed stand with deciduous and coniferous trees, fir, spruce, beech mountain stand, Douglas mixed stand with deciduous trees (some coniferous trees possible) |
| Conifers 2 | pine pure stand, pine pure stand with low parts of coniferous trees, pine pure stand with low parts of deciduous trees, pine mixed stand with coniferous trees, larch stand (some mix possible), other soft wood |
| Mixed 2 | pine mixed stand with coniferous and deciduous trees, pine mixed stand with deciduous trees, pine mixed stand with deciduous and coniferous trees, oak (Quercus robur, Quercus petraea) mixed stand, beech mixed stand with coniferous trees (few deciduous trees possible), beech mixed stand with coniferous trees |
| Deciduous | oak pure stand with low parts of coniferous trees, oak mixed stand with few coniferous or deciduous trees, oak mixed stand with deciduous trees (few coniferous trees possible), beech pure stand, beech pure stand with low parts of coniferous trees, beech pure stand with low parts of deciduous trees, beech mixed stand with deciduous trees (few coniferous trees possible), other hard wood |
| Attributes | Harvest Decision Logistic Regression | Harvested Volume OLS |
|---|---|---|
| Standing volume (m³/ha) | 0.004 *** (0.000) | 0.532 *** (0.019) |
| Stand type (conifers 1 & mixed 1 vs. conifers 2 & mix. 2 & deciduous) | −0.383 *** (0.068) | −43.547 *** (4.480) |
| Ownership type (small private vs. community) | 1.023 *** (0.075) | |
| Ownership type (small private vs. state and large priv.) | 0.866 *** (0.077) | |
| Ownership type (small private vs. medium priv.) | 0.496 *** (0.093) | |
| Ownership type (large private vs. state, and community) | −25.177 *** (5.294) | |
| Ownership type (large private vs. medium and small private) | −46.713 *** (5.854) | |
| Harvest condition (favorable vs. unfavorable) | −0.376 *** (0.074) | |
| Site index (m³ob/ha at the age of 100) | −0.018 ** (0.009) | 1.909 *** (0.497) |
| Altitude (m a.s.l.) | −0.001 *** (0.000) | −0.041 *** (0.008) |
| Slope (%) | −0.015 *** (0.003) | −1.053 *** (0.161) |
| Average plot DBH (cm) | −0.01 *** (0.003) | |
| Average plot age (years) | −0.004 *** (0.001) | |
| Nature park (no vs. yes) | −0.179 *** (0.054) | −17.257 *** (3.440) |
| Nature protected area (no vs. yes) | −0.633 *** (0.137) | |
| Standing volume: Ownership type (other vs. small or medium private) | −0.001 *** (0.000) | |
| Standing volume: Ownership type (large private vs. state, and community) | −0.126 *** (0.021) | |
| Standing volume: Ownership type (large private vs. medium and small private) | −0.224 *** (0.022) | |
| Standing volume: Average plot DBH | 0.001 ** (0.001) | |
| Standing volume: Stand type (conifers 1 & mixed 1 vs. deciduous & conifers 2 & mix. 2) | −0.156 *** (0.014) | |
| Standing volume: Average plot age | −0.000 *** (0.000) | |
| Average plot Age: Average plot DBH | 0.000 *** (0.000) | |
| Constant | 0.410 *** (0.078) | 154.412 *** (8.359) |
| Observations | 8792 | 8792 |
| R2 | 0.278 | |
| Adjusted R2 | 0.277 | |
| Log Likelihood | −5134.677 | |
| Akaike Inf. Crit. | 10,303.350 | |
| Residual Std. Error | 144.740 (df = 8779) | |
| F Statistic | 281.502 *** (df = 12; 8779) | |


References
- Bundesministerium für Ernährung, Landwirtschaft und Verbraucherschutz (BMELV). Aktionsplan der Bundesregierung zur Stofflichen Nutzung Nachwachsender Rohstoffe; Bundesministerium für Ernährung, Landwirtschaft und Verbraucherschutz: Berlin, Germany, 2009; p. 40. [Google Scholar]
- McCormick, K.; Kautto, N. The bioeconomy in Europe: An overview. Sustainability 2013, 5, 2589–2608. [Google Scholar] [CrossRef]
- EU Commission. Innovating for Sustainable Growth: A Bioeconomy for Europe; EU Commission: Brussels, Belgium, 2012. [Google Scholar]
- Vauhkonen, J.; Packalen, T. A Markov Chain Model for Simulating Wood Supply from Any-Aged Forest Management Based on National Forest Inventory (NFI) Data. Forests 2017, 8, 307. [Google Scholar] [CrossRef]
- Raunikar, R.; Buongiorno, J.; Turner, J.A.; Zhu, S. Global outlook for wood and forests with the bioenergy demand implied by scenarios of the Intergovernmental Panel on Climate Change. For. Policy Econ. 2010, 12, 48–56. [Google Scholar] [CrossRef]
- Food and Agriculture Organization (FAO). Emerging Approaches to Forest Reference Emission Levels and/or Forest Reference Levels for REDD+; 978-92-5-108840-1; Food and Agriculture Organization of the United Nations: Rome, Italy, 2015. [Google Scholar]
- Olander, L.P.; Gibbs, H.K.; Steininger, M.; Swenson, J.J.; Murray, B.C. Reference scenarios for deforestation and forest degradation in support of REDD: A review of data and methods. Environ. Res. Lett. 2008, 3, 025011. [Google Scholar] [CrossRef]
- Kändler, G. The design of the second German national forest inventory. In Proceedings of the Eighth Annual Forest Inventory and Analysis Symposium, Monterey, CA, USA, 16–19 October 2006; McRoberts, R.E., Reams, G.A., Van Duesen, P.C., McWilliams, W.H., Eds.; U.S. Department of Agriculture: Washington, DC, USA, 2006; pp. 19–24. [Google Scholar]
- Tomppo, E.; Schadauer, K.; McRoberts, R.E.; Gschwantner, T.; Gabler, K.; Ståhl, G. Introduction. In National Forest Inventories: Pathways for Common Reporting; Tomppo, E., Gschwantner, T., Lawrence, M., McRoberts, R.E., Eds.; Springer: Dordrecht, The Netherlands, 2010; pp. 1–18. [Google Scholar]
- Fischer, C.; Gasparini, P.; Nylander, M.; Redmond, J.; Hernandez, L.; Brändli, U.-B.; Pastor, A.; Rizzo, M.; Alberdi, I. Joining Criteria for Harmonizing European Forest Available for Wood Supply Estimates. Case Studies from National Forest Inventories. Forests 2016, 7, 104. [Google Scholar] [CrossRef]
- Barreiro, S.; Schelhaas, M.-J.; Kändler, G.; Antón-Fernández, C.; Colin, A.; Bontemps, J.-D.; Alberdi, I.; Condés, S.; Dumitru, M.; Ferezliev, A.; et al. Overview of methods and tools for evaluating future woody biomass availability in European countries. Ann. For. Sci. 2016, 73, 823–837. [Google Scholar] [CrossRef]
- Rock, J.; Gerber, K.; Klatt, S.; Oehmichen, K. Das WEHAM 2012 “Basisszenario”: Mittellinie oder Leitplanke?—The WEHAM 2012 “Baseline scenario”: Center line or guardrail? Forstarchiv 2016, 87, 66–69. [Google Scholar]
- Mahmoud, M.; Liu, Y.; Hartmann, H.; Stewart, S.; Wagener, T.; Semmens, D.; Stewart, R.; Gupta, H.; Dominguez, D.; Dominguez, F. A formal framework for scenario development in support of environmental decision-making. Environ. Model. Softw. 2009, 24, 798–808. [Google Scholar] [CrossRef]
- Intergovernmental Panel on Climate Change (IPPC). Available online: http://www.ipcc-data.org/guidelines/pages/definitions.html (accessed on 7 September 2017).
- Rounsevell, M.D.A.; Metzger, M.J. Developing qualitative scenario storylines for environmental change assessment. Wires Clim. Chang. 2010, 1, 606–619. [Google Scholar] [CrossRef]
- Wear, D.N.; Parks, P.J. The economics of timber supply: An analytical synthesis of modeling approaches. Nat. Resour. Model. 1994, 8, 199–223. [Google Scholar] [CrossRef]
- Polyakov, M.; Wear, D.N.; Huggett, R.N. Harvest choice and timber supply models for forest forecasting. For. Sci. 2010, 56, 344–355. [Google Scholar]
- Rinaldi, F.; Jonsson, R.; Sallnäs, O.; Trubins, R. Behavioral modelling in a decision support system. Forests 2015, 6, 311–327. [Google Scholar] [CrossRef]
- Rinaldi, F.; Jonsson, R. Risks, information and short-run timber supply. Forests 2013, 4, 1158–1170. [Google Scholar] [CrossRef]
- Henderson, J.D.; Abt, R.C. An agent-based model of heterogeneous forest landowner decisionmaking. For. Sci. 2016, 62, 364–376. [Google Scholar] [CrossRef]
- Antón-Fernández, C.; Astrup, R. Empirical harvest models and their use in regional business-as-usual scenarios of timber supply and carbon stock development. Scand. J. For. Res. 2012, 27, 379–392. [Google Scholar] [CrossRef]
- Amacher, G.S.; Conway, M.C.; Sullivan, J. Econometric analyses of nonindustrial forest landowners: Is there anything left to study? J. For. Econ. 2003, 9, 137–164. [Google Scholar] [CrossRef]
- Beach, R.H.; Pattanayak, S.K.; Yang, J.-C.; Murray, B.C.; Abt, R.C. Econometric studies of non-industrial private forest management: A review and synthesis. For. Policy Econ. 2005, 7, 261–281. [Google Scholar] [CrossRef]
- Favada, I.M.; Kuuluvainen, J.; Uusivuori, J. Consistent estimation of long-run nonindustrial private forest owner timber supply using micro data. Can. J. For. Res. 2007, 37, 1485–1494. [Google Scholar] [CrossRef]
- Kuuluvainen, J.; Karppinen, H.; Ovaskainen, V. Landowner objectives and nonindustrial private timber supply. For. Sci. 1996, 42, 300–309. [Google Scholar]
- Vokoun, M.; Amacher, G.S.; Wear, D.N. Scale of harvesting by non-industrial private forest landowners. J. For. Econ. 2006, 11, 223–244. [Google Scholar] [CrossRef]
- Koch, S.P.; Schwarzbauer, P.; Stern, T. Monthly wood supply behavior of associated forest owners in Austria—Insights from the analysis of a micro-econometric panel. J. For. Econ. 2013, 19, 331–346. [Google Scholar] [CrossRef]
- Bolkesjø, T.F.; Solberg, B. A Panel Data Analysis of Nonindustrial Private Roundwood Supply with Emphasis on the Price Elasticity. For. Sci. 2003, 49, 530–538. [Google Scholar]
- Butler, B.J.; Hewes, J.H.; Dickinson, B.J.; Andrejczyk, K.; Butler, S.M.; Markowski-Lindsay, M. Family Forest Ownerships of the United States, 2013: Findings from the USDA Forest Service’s National Woodland Owner Survey. J. For. 2016, 114, 638–647. [Google Scholar] [CrossRef]
- Bolkesjø, T.F.; Solberg, B.; Wangen, K.R. Heterogeneity in nonindustrial private roundwood supply: Lessons from a large panel of forest owners. J. For. Econ. 2007, 13, 7–28. [Google Scholar] [CrossRef]
- Silver, E.J.; Leahy, J.E.; Weiskittel, A.R.; Noblet, C.L.; Kittredge, D.B. An Evidence-Based Review of Timber Harvesting Behavior among Private Woodland Owners. J. For. 2015, 113, 490–499. [Google Scholar] [CrossRef]
- Tomppo, E.; Gschwantner, T.; Lawrence, M.; McRoberts, R.E. National Forest Inventories: Pathways for Common Reporting; Springer: Dordrecht, The Netherlands, 2010; p. 607. [Google Scholar]
- Sterba, H.; Golser, M.; Schadauer, K. Evaluating a model to predict timber harvesting in Austria. In Integrated Tools for Natural Resources Inventories in the 21st Century. General Technical Report NC-212; Hansen, M., Burk, T., Eds.; USDA Forest Service North Central Forest Experiment Station: Saint Paul, MN, USA, 2000; pp. 569–604. [Google Scholar]
- Nabuurs, G.-J.; Schelhaas, M.-J.; Pussinen, A. Validation of the European Forest Information Scenario Model (EFISCEN) and a projection of Finnish forests. Silva Fenn. 2000, 34, 167–179. [Google Scholar] [CrossRef]
- Thürig, E.; Schelhaas, M.-J. Evaluation of a large-scale forest scenario model in heterogeneous forests: A case study for Switzerland. Can. J. For. Res. 2006, 36, 671–683. [Google Scholar] [CrossRef]
- Dennis, D.F. A probit analysis of the harvest decision using pooled time-series and cross-sectional data. J. Environ. Econ. Manag. 1990, 18, 176–187. [Google Scholar] [CrossRef]
- Prestemon, J.P.; Wear, D.N. Linking harvest choices to timber supply. For. Sci. 2000, 46, 377–389. [Google Scholar]
- Verkerk, P.J.; Levers, C.; Kuemmerle, T.; Lindner, M.; Valbuena, R.; Verburg, P.H.; Zudin, S. Mapping wood production in European forests. For. Ecol. Manag. 2015, 357, 228–238. [Google Scholar] [CrossRef]
- Zhang, D.; Sun, X.; Butler, B.J.; Prestemon, J.P. Harvesting Choices and Timber Supply among Landowners in the Southern United States. Can. J. Agric. Econ. 2015, 63, 409–429. [Google Scholar] [CrossRef]
- Breiman, L.; Friedman, J.; Olshen, R.; Stone, C. Classification and Regression Trees; Taylor & Franxis Group, LLC: Boca Raton, FL, USA, 1984. [Google Scholar]
- López-Ratón, M.; Rodríguez-Álvarez, M.X.; Cadarso-Suárez, C.; Gude-Sampedro, F. OptimalCutpoints: An R Package for Selecting Optimal Cutpoints in Diagnostic Tests. J. Stat. Softw. 2014, 61, 36. [Google Scholar] [CrossRef]
- Breiman, L. Random Forests. Mach. Learn. 2001, 45, 5–32. [Google Scholar] [CrossRef]
- Kändler, G.; Riemer, U. Chapter 14—Germany. In Forest Inventory-Based Projection Systems for Wood and Biomass Availability; Barreiro, S., Schelhaas, M.J., McRoberts, R.E., Kändler, G., Eds.; Springer: Cham, Switzerland, 2017; pp. 175–183. [Google Scholar]
- Thünen Institut (TI). Dritte Bundeswaldinventur (2012). Available online: https://bwi.info/ (accessed on 8 July 2017).
- Ministerium für Ländlichen Raum (MLR). Clusterstudie Forst und Holz Baden-Württemberg—Analyse der Spezifischen Wettbewerbssituation des Clusters Forst und Holz und Ableitung von Handlungsempfehlungen; Ministerium für Ländlichen Raum und Verbraucherschutz Baden-Württemberg: Stuttgart, Germany, 2010; p. 177. [Google Scholar]
- Schmitz, F.; Polley, H.; Henning, P.; Dunger, K.; Schwitzgebel, F. Die zweite Bundeswaldinventur BWI 2: Inventur- und Auswertungsmethoden—The Second National Forest Inventory NFI 2: Inventory and Evaluation Methods; Bundesministerium für Ernährung, Landwirtschaft und Verbraucherschutz (BMELV): Braunschweig, Germany, 2008; p. 85. [Google Scholar]
- Bundesministerium für Ernährung, Landwirtschaft und Verbraucherschutz (BMELV). Aufnahmeanweisung für die Dritte Bundeswaldinventur (BWI 3) (2011–2012); BMELV: Bonn, Germany, 2011; p. 111. [Google Scholar]
- Sloboda, B.; Gaffrey, D.; Matsumura, N. Regionale und lokale Systeme von Höhenkurven für gleichaltrige Waldbestände. Allg. For. Jagdztg. 1993, 164, 225–228. [Google Scholar]
- Ministerium für Ländlichen Raum (MLR). Hilfstabellen für die Forsteinrichtung; MLR: Stuttgart, Germany, 1993; p. 188. [Google Scholar]
- Wenzelides, M.; Hagemann, H. Bestimmung des nachhaltig mobilisierbaren Dendromassepotenzials in Nordrhein-Westfalen anhand der Auswertung von Bundes-und Landeswaldinventur. Forstarchiv 2007, 78, 73–81. [Google Scholar]
- Selter, A.; Hartebrodt, C.; Brandl, H.; Herbohn, J. A critical comparison of typologies of small-scale forestry in Baden-Württemberg derived using single and multiple criteria. Small-Scale For. 2009, 8, 25–42. [Google Scholar] [CrossRef]
- Kuhn, M. Building predictive models in R using the caret package. J. Stat. Softw. 2008, 28, 1–26. [Google Scholar] [CrossRef]
- R-Core-Team. R: A Language and Environment for Statistical Computing, version 3.1.1; R Foundation for Statistical Computing: Vienna, Austria, 2014. [Google Scholar]
- Hastie, T.; Tibshirani, R.; Friedman, J.; Hastie, T.; Friedman, J.; Tibshirani, R. The Elements of Statistical Learning; Springer: New York, NY, USA, 2013; Volume 10. [Google Scholar]
- Zhou, Z.-H. Ensemble Methods—Foundations and Algorithms; CRC Press: Boca Raton, FL, USA, 2012. [Google Scholar]
- Negnevitsky, M. Artificial Intelligence—A Guide to Intelligent Systems; Pearson Education Limited: Harlow, UK, 2002; Volume 2. [Google Scholar]
- Domingos, P. Knowledge discovery via multiple models. Intell. Data Anal. 1998, 2, 187–202. [Google Scholar] [CrossRef]
- Therneau, T.; Atkinson, B.; Ripley, B. Rpart: Recursive Partitioning and Regression Trees, R Package Version 4.1-11. Available online: https://cran.r-project.org/web/packages/rpart/index.html (accessed on 9 November 2017).
- Therneau, T.; Atkinson, B.; Ripley, B. Documentation for Package ‘Rpart’ Version 4.1-11. Available online: https://stat.ethz.ch/R-manual/R-devel/library/rpart/html/00Index.html (accessed on 9 November 2017).
- Kabacoff, R.I. Quick-R. Available online: https://www.statmethods.net/advstats/cart.html (accessed on 9 November 2017).
- Liaw, A.; Matthew, W. Classification and Regression by randomForest. R News 2002, 2, 18–22. [Google Scholar]
- Liaw, A.; Wiener, M. Package ‘randomForest’—Breiman and Cutler’s Random Forest for Classification, Version 4.6-12. Available online: https://cran.r-project.org/web/packages/randomForest/randomForest.pdf (accessed on 22 November 2017).
- Hayes, A.F.; Cai, L. Using heteroskedasticity-consistent standard error estimators in OLS regression: An introduction and software implementation. Behav. Res. Methods 2007, 39, 709–722. [Google Scholar] [CrossRef] [PubMed]
- Cohen, J. A Coefficient of Agreement for Nominal Scales. Educ. Psychol. Meas. 1960, 20, 37–46. [Google Scholar] [CrossRef]
- Youden, W.J. Index for rating diagnostic tests. Cancer 1950, 3, 32–35. [Google Scholar] [CrossRef]
- Eid, T. Testing a large-scale forestry scenario model by means of successive inventories on a forest property. Silva Fenn. 2004, 38, 305–317. [Google Scholar] [CrossRef]
- Kramer, H.; Akça, A. Leitfaden zur Waldmesslehre; J. D. Sauerländers Verlag: Frankfurt, Germany, 2008; Volume 5, p. 226. [Google Scholar]
- Quinlan, J.R. C4.5—Programs for Machine Learning; Morgan Kaufmann: San Francisco, CA, USA, 1993. [Google Scholar]
- Rock, J.; Bösch, B.; Kändler, G. WEHAM 2012—Waldentwicklungs- und Holzaufkommensmodellierung für die dritte Bundeswaldinventur. In Beiträge zur Jahrestagung 13.–15. Mai 2013; Klädtke, J., Kohnle, U., Eds.; Deutscher Verband Forstlicher Forschungsanstalten (DVFFA), Sektion Ertragskunde: Rychnov nad Kněžnou, Czech Republic, 2013; pp. 127–133. [Google Scholar]
- Urquhart, J.; Courtney, P.; Slee, B. Private woodland owners’ perspectives on multifunctionality in English woodlands. J. Rural Stud. 2012, 28, 95–106. [Google Scholar] [CrossRef]
- Becker, D.R.; Eryilmaz, D.; Klapperich, J.J.; Kilgore, M.A. Social availability of residual woody biomass from nonindustrial private woodland owners in Minnesota and Wisconsin. Biomass Bioenergy 2013, 56, 82–91. [Google Scholar] [CrossRef]
- Härdter, U. Waldbesitzer in Deutschland—Zwischen Tradition und Moderne: Eine Untersuchung der Neuen Eigentümerstrukturen im Kontext Gesellschaftlicher Entwicklungstrends; Kessel: Remagen-Oberwinter, Germany, 2004; Volume 6, p. 309. [Google Scholar]
- Mutz, R. Privatwaldforschung in Deutschland—Überblick und Folgerungen. Schweiz. Z. Forstwes. 2007, 158, 285–292. [Google Scholar] [CrossRef]
- Schlüter, A. Hemmnisse institutionellen Wandels im Kleinprivatwald aus der Sicht der Neuen Institutionenökonomik—Constraints on institutional change in smallscale forestry: A New Institutional Economics perspective. Schweiz. Z. Forstwes. 2006, 157, 84–90. [Google Scholar] [CrossRef]
- Seidl, R.; Schelhaas, M.-J.; Lindner, M.; Lexer, M.J. Modelling bark beetle disturbances in a large scale forest scenario model to assess climate change impacts and evaluate adaptive management strategies. Reg. Environ. Chang. 2009, 9, 101–119. [Google Scholar] [CrossRef]


| Attributes | Harvested Volume OLS (Trained on Harvested Plots) |
|---|---|
| Standing volume (m³ob/ha) | 0.571 *** (0.026) |
| Stand type (conifers 1 & mixed 1 vs. conifers 2 & mixed 2 & deciduous) | −40.655 *** (4.658) |
| Ownership type (large private vs. state, community, medium and small private) | −31.601 *** (6.782) |
| Site index (m³ob/ha at the age of 100) | 1.470 ** (0.672) |
| Altitude (m a.s.l.) | −0.041 *** (0.011) |
| Average plot DBH (cm) | 0.986 *** (0.183) |
| Nature park (no vs. yes) | −20.301 *** (4.334) |
| Standing volume: Ownership type (large priv. vs. state, community, medium and small priv.) | −0.221 *** (0.027) |
| Standing volume: Average plot DBH | 0.002 ** (0.001) |
| Standing volume: Stand type (conifers & mixed vs. deciduous) | −0.220 *** (0.027) |
| Constant | 207.551 *** (11.150) |
| Observations | 5587 |
| R2 | 0.294 |
| Adjusted R2 | 0.292 |
| Residual Std. Error | 151.670 (df = 5576) |
| F Statistic | 231.730 *** (df = 10; 5576) |
| Method | Classification Accuracy | Precision | Sensitivity | Specificity | Cohen’s Kappa | |||||
|---|---|---|---|---|---|---|---|---|---|---|
| Logistic Regression (MK) | 0.670 | 0.737 | 0.747 | 0.536 | 0.280 | |||||
| Logistic Regression (YI) | 0.642 | 0.773 | 0.618 | 0.684 | 0.280 | |||||
| CART and Random Forest (RF) | 0.639 | 0.719 | 0.709 | 0.516 | 0.220 | |||||
| CART and random prediction 1 | 0.586 | (0.008) | 0.676 | (0.007) | 0.667 | (0.006) | 0.444 | (0.011) | 0.110 | (0.018) |
© 2018 by the authors. Licensee MDPI, Basel, Switzerland. This article is an open access article distributed under the terms and conditions of the Creative Commons Attribution (CC BY) license (http://creativecommons.org/licenses/by/4.0/).
Share and Cite
Kilham, P.; Kändler, G.; Hartebrodt, C.; Stelzer, A.-S.; Schraml, U. Designing Wood Supply Scenarios from Forest Inventories with Stratified Predictions. Forests 2018, 9, 77. https://doi.org/10.3390/f9020077
Kilham P, Kändler G, Hartebrodt C, Stelzer A-S, Schraml U. Designing Wood Supply Scenarios from Forest Inventories with Stratified Predictions. Forests. 2018; 9(2):77. https://doi.org/10.3390/f9020077
Chicago/Turabian StyleKilham, Philipp, Gerald Kändler, Christoph Hartebrodt, Anne-Sophie Stelzer, and Ulrich Schraml. 2018. "Designing Wood Supply Scenarios from Forest Inventories with Stratified Predictions" Forests 9, no. 2: 77. https://doi.org/10.3390/f9020077
APA StyleKilham, P., Kändler, G., Hartebrodt, C., Stelzer, A.-S., & Schraml, U. (2018). Designing Wood Supply Scenarios from Forest Inventories with Stratified Predictions. Forests, 9(2), 77. https://doi.org/10.3390/f9020077