Article

Environmental Conditions and Species Identity Drive Metabolite Levels in Green Leaves and Leaf Litter of 14 Temperate Woody Species

1
Plant Interactions Ecophysiology Group, Department of Biology, University of Konstanz, Universitätsstrasse 10, 78457 Konstanz, Germany
2
Department of Biology, University of Konstanz, Universitätsstrasse 10, 78457 Konstanz, Germany
3
Faculty of Forest Sciences and Forest Ecology, University of Göttingen, Büsgenweg 2, 37077 Göttingen, Germany
4
Natural Resources Institute Finland (LUKE), Latokartanonkaari 9, 00790 Helsinki, Finland
*
Author to whom correspondence should be addressed.
Forests 2018, 9(12), 775; https://doi.org/10.3390/f9120775
Submission received: 30 October 2018 / Revised: 30 November 2018 / Accepted: 11 December 2018 / Published: 15 December 2018

Abstract

:
Research Highlights: Leaf chemistry is a key driver of litter decomposition; however, studies directly comparing metabolites that are important for tree growth and defence across different woody species are scarce. Background and Objectives: Choosing 14 temperate woody species differing in their growth rates, nutrient demand, shade tolerance, and drought sensitivity, we hypothesized that the species would group according to their metabolite profiles based on their ecological background. Materials and Methods: We analysed total N and C, soluble amino acid, protein, and phenolic levels in green leaves and leaf litter of these species, each in two consecutive years. Results: Metabolite levels varied significantly across species and between the sampling years which differed in temperature and precipitation (i.e., colder/drier vs warmer/ wetter). Conclusions: The 14 woody species could not be grouped according to their green leaf or leaf litter metabolite profiles. In litter leaves, most of the variation was explained by total phenolics and total nitrogen levels, and in green leaves by total phenolics and total soluble amino acid levels. Local climate variation between the two consecutive years for green leaves or leaf litter led to significant differences in metabolite levels, although some of them were species-specific.

1. Introduction

Litter degradation in deciduous and evergreen forest ecosystems is mainly driven by climate (in particular precipitation and temperature) and soil microbial communities, as well as litter quality [1,2,3,4]. Litter quality, in turn, is largely determined by litter chemistry, particularly nitrogen (N), carbon (C) (e.g., [5,6]), and also plant secondary metabolites (PSM), such as polyphenols (e.g., [4,7,8]). The influence of N and C levels in litter on its degradation is well studied (e.g., [9,10,11,12]), showing that, for example, high C/N ratios in litter lead to slowed or even incomplete decomposition processes in the soil. However, only little is known about how PSM (constituting up to 30% of plant dry weight) [13] can influence litter decomposition and nutrient cycling [14,15]. Litter chemistry is also influenced by climate [16], which has mainly been studied in the past at a global or regional scale, whereas studies at the local scale are scarce [12,17,18].
Plants can regulate soil N and C cycling via their litter chemistry, but they are also affected by their interactions with soil microorganisms with regard to plant N acquisition (e.g., [19,20]). For example, with high levels of N in the soil or substrate, “microbial N mining” by microorganisms (i.e., the microbial use of plant-derived labile C substrates to acquire N) is inhibited, resulting in slower litter degradation rates [21,22]. Nutrient contents in green and senescent leaves differ [23,24], because nutrient resorption varies across species depending on abiotic factors such as annual precipitation and temperature during summer [25,26]. Only limited data is available on the influence of climate stressors on the chemical composition of initial litter via PSM, and this data is inconsistent [4,27]. However, condensed tannins—a group within the phenolics—slow down degradation processes [4,28], and thus, C and N cycling [14] via the formation of complexes with proteins [7,15].
Hagen-Thorn et al.´s study [26] on four deciduous tree species showed that nutrient resorption rates were species-specific. However, overall, species variation is rarely compared with regard to their nutrient content in leaves (green or senescent) [29,30,31], and studies are mainly focused on N and C, and/or specific ratios (e.g., C/N, lignin/N), though including mostly only one species e.g., [24,31,32,33]. Foliar amino acids and proteins represent a major source for dissolved organic nitrogen (DON) from litter (e.g., [34,35]), whereas PSM, for example, phenolics, serve as a chemical defence [15]. Only few studies have considered amino acid or protein levels in litter leaves [34,36,37], but—to our knowledge—no study has so far looked at the variation across species and/or directly compared how foliar N metabolites and PSM vary across species. Therefore, the aim of our study was to provide a comparison of 14 temperate woody species common in Central European forest ecosystems with regard to their metabolite levels (i.e., total soluble amino acid, protein, and phenolic concentration) in fresh leaf litter and green leaves, both for two consecutive years. More specifically, we aimed to understand the potential contribution of soluble N metabolites—as easily available N sources in N-limiting ecosystems—as well as potential inhibitors such as phenolics contributing to soil N cycling depending on the species. We hypothesised that species metabolite profiles would group according to their ecological background, for example, slow vs fast growth.

2. Materials and Methods

2.1. Plant Species and Leaf Sampling

This study included 14 angiospermous species typical for a Central European deciduous broadleaf forest [38] growing at the campus of the University of Konstanz, Germany (47.689047, 9.188604): Acer platanoides L. (Sapindaceae), Acer pseudoplatanus L. (Sapindaceae), Betula pendula Roth. (Betulaceae), Carpinus betulus L. (Betulaceae), Corylus avellana L. (Betulaceae), Fagus sylvatica L. (Fagaceae), Fraxinus excelsior L. (Oleaceae), Populus tremula L. (Salicaceae), Prunus avium (L.) L. (Rosaceae), Quercus robur L. (Fagaceae), Sorbus torminalis (L.) Crantz (Rosaceae), Tilia cordata Mill. (Malvaceae), Tilia platyphyllos Scop. (Malvaceae), and Ulmus glabra Huds. (Ulmaceae). Tree age varied between 15 and 30 years for most species; Fagus, Fraxinus, and Quercus were between 60 and 80 years (V. Doerken, personal observation). The chosen taxa cover a broad range of different ecological conditions (Table 1). The chosen species are typical for the forest occurring in the Konstanz area. Mean annual temperature and precipitation are 9.8 °C and 845 mm, respectively, at the weather station Konstanz (#2712, 47.6774, 9.1901, 443 m above sea level; 1981–2010, Deutscher Wetterdienst DWD). Mean temperature and precipitation of the vegetation period prior to sampling of leaf litter and green leaves are shown in Table S1. For leaf litter, the growth period May to October was considered for each year. In 2014, mean air temperature was 4.1% lower than in 2015, with 6.5% less rainfall. For green leaves, the period from mid-October to mid-May was considered for each year. Here, winter 2015/16 was 11.1% warmer than 2016/17, with 31.6% more rainfall.
We conducted sampling of leaf litter in October after leaf fall and of new fully developed leaves in early June, both in two consecutive years to account for climatic variation. To avoid the effects of light conditions on the studied plant traits, we selected only shoots/leaves from green parts exposed to the sun for the green leaves. Per species, 3–5 individual trees were sampled. We collected 20 sunlit branches from the crown surface of each tree to minimize the variation. All sampled branches included more than 10 current-year shoots. A total of ~20 shoots or ~100 compound leaves were randomly selected for each species and year. Leaf litter samples also included ~100 compound leaves per individual. Leaves/litter of individuals per species were pooled and analysed in three replicates per species, year, and tissue. After collection, green and litter leaves were carefully wiped with tissue containing tap water to remove dirt particles and other contaminates. All leaf and litter samples were then shock-frozen in liquid nitrogen and stored at −80 °C until further analysis.

2.2. Quantitative Foliar Chemical Analyses

To quantify total N and C, dried aliquots (48 hr, 70 °C) of green and litter leaf samples were ground using a ball mill (TissueLyser, Retsch, Haan, Germany). Aliquots of 1–2 mg of sample were weighed into 4–6 mm tin capsules (IVA Analysentechnik, Meerbusch, Germany) and analysed with a TOC/TN analyser (Dimatoc 100, Dimatec Analysentechnik GmbH, Essen, Germany). KNO3 and (NH4)2SO4 were used as standards for N (1000 mg/L), and potassium hydrogen phthalate for C (1000 mg/L). To quantify total soluble amino acid, protein, and phenolic concentrations, leaf samples were ground in liquid nitrogen to a fine homogenous powder. Aliquots of ~40–50 mg frozen tissue were used for all extractions. Total soluble protein content in the leaves was determined according to Grüning et al. [41]: Leaf tissue was extracted in 1.5 mL of buffer containing 50 mM Tris-HCl (pH 8), 1 mM EDTA, 15% glycerol (v/v), 5 mM dithiothreitol, 0.1% Triton X-100, and two tablets of protease inhibitor cocktail (EDTA-free, Complete, Roche Diagnostics, Mannheim, Germany), and quantified using Bradford reagent (Amresco Inc., Solon, OH, USA) at 595 nm in a spectrophotometer (Ultrospec 3100 pro, Amersham Biosciences, Piscataway, NJ, USA) using bovine serum albumin as a standard. Total soluble amino acids in the leaves were extracted according to Winter et al. [42], as described in Li et al. [43], in 0.2 mL buffer containing 20 mM HEPES, 50 mM EGTA, 10 mM NaF (pH 7), and 1 mL methanol/chloroform (3.5:1.5, v/v). The concentration of total amino acids was quantified according to Liu et al. [44] at 570 nm in a spectrophotometer, with l-glutamine as a standard. Total phenolics were extracted according to Simon et al. [45] in 50% acetone, and quantified using Folin–Ciocalteu reagent. Absorption was measured at 765 nm in a spectrophotometer using gallic acid as a standard.

2.3. Statistical Analyses

Data were tested for normality and homogeneity of variance. Differences between years for both green leaves and leaf litter were tested using t-tests. The differences between species (both years combined) were tested using ANOVA on ranks followed by Dunn’s test. These statistical analyses were performed using Sigmaplot 13.0 (Systat Software GmbH, Erkrath, Germany). In addition, principal component analysis (PCA) was conducted to expose potential differences in the combination of primary vs secondary metabolism between the different species, using MetaboAnalyst 4.0 [46,47,48,49,50,51,52]. Before PCA analyses, data were pre-processed by log transformation.

3. Results

3.1. Species-Specific Differences between Leaf Metabolites

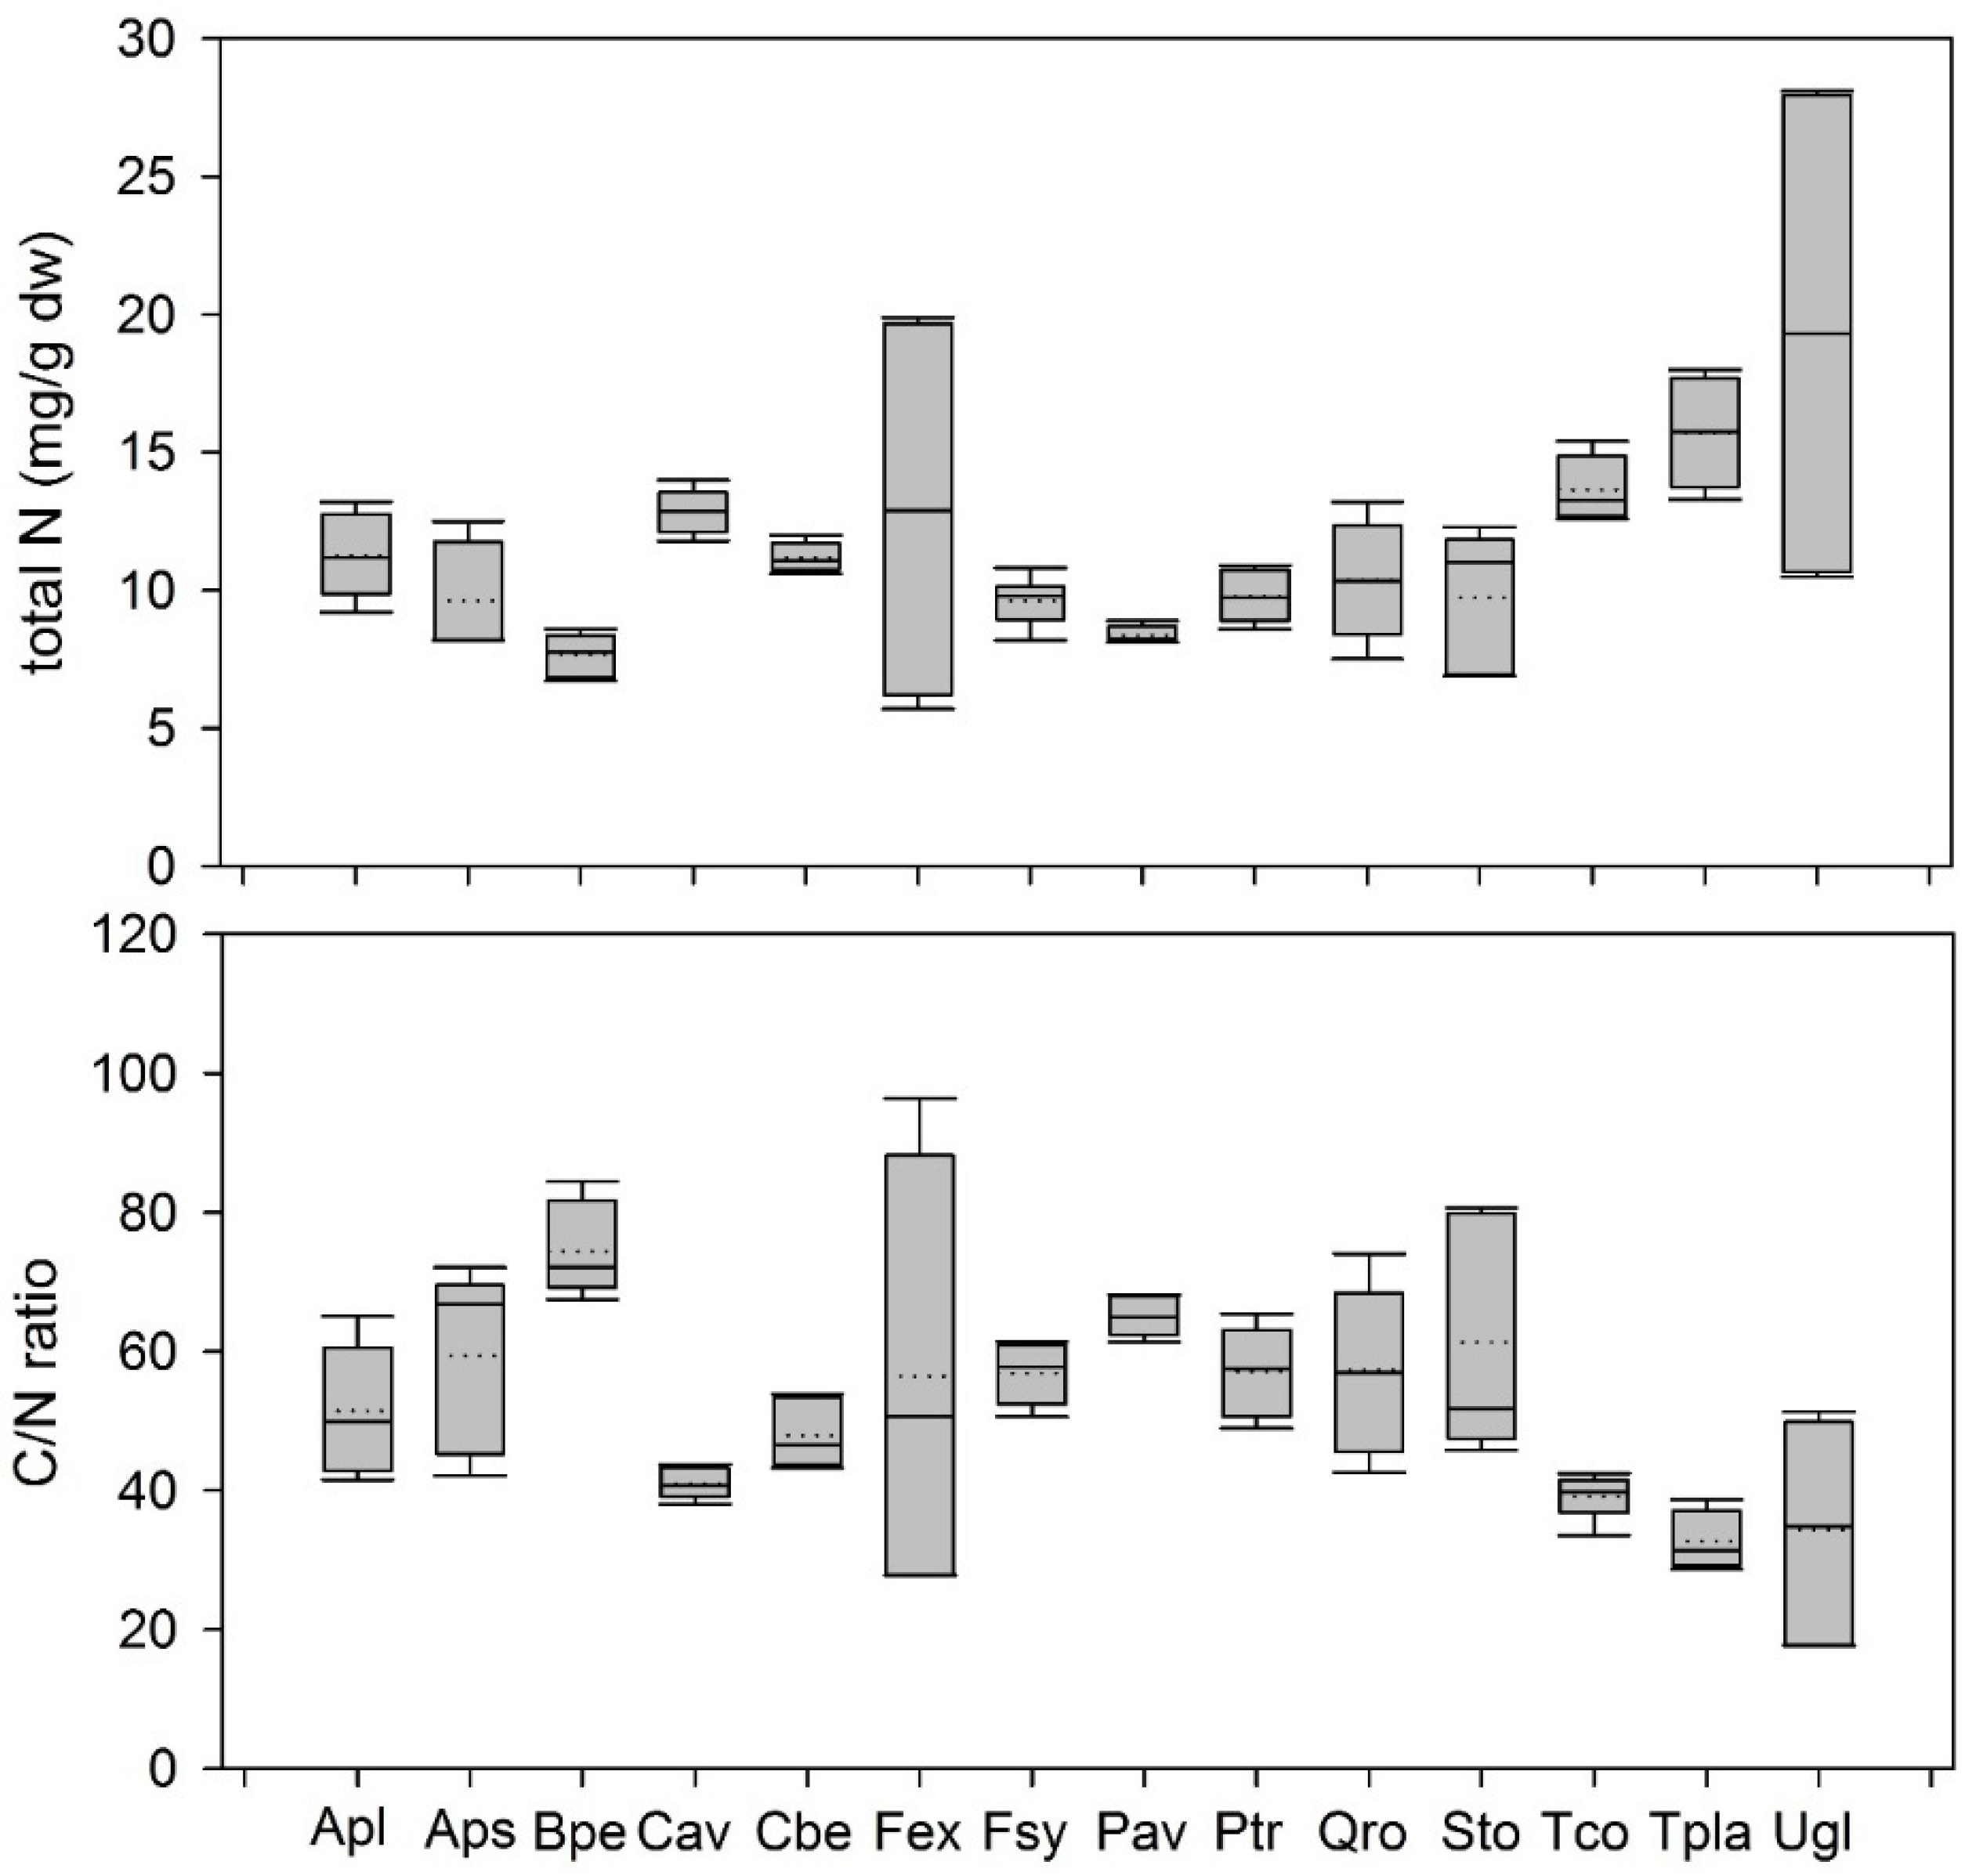
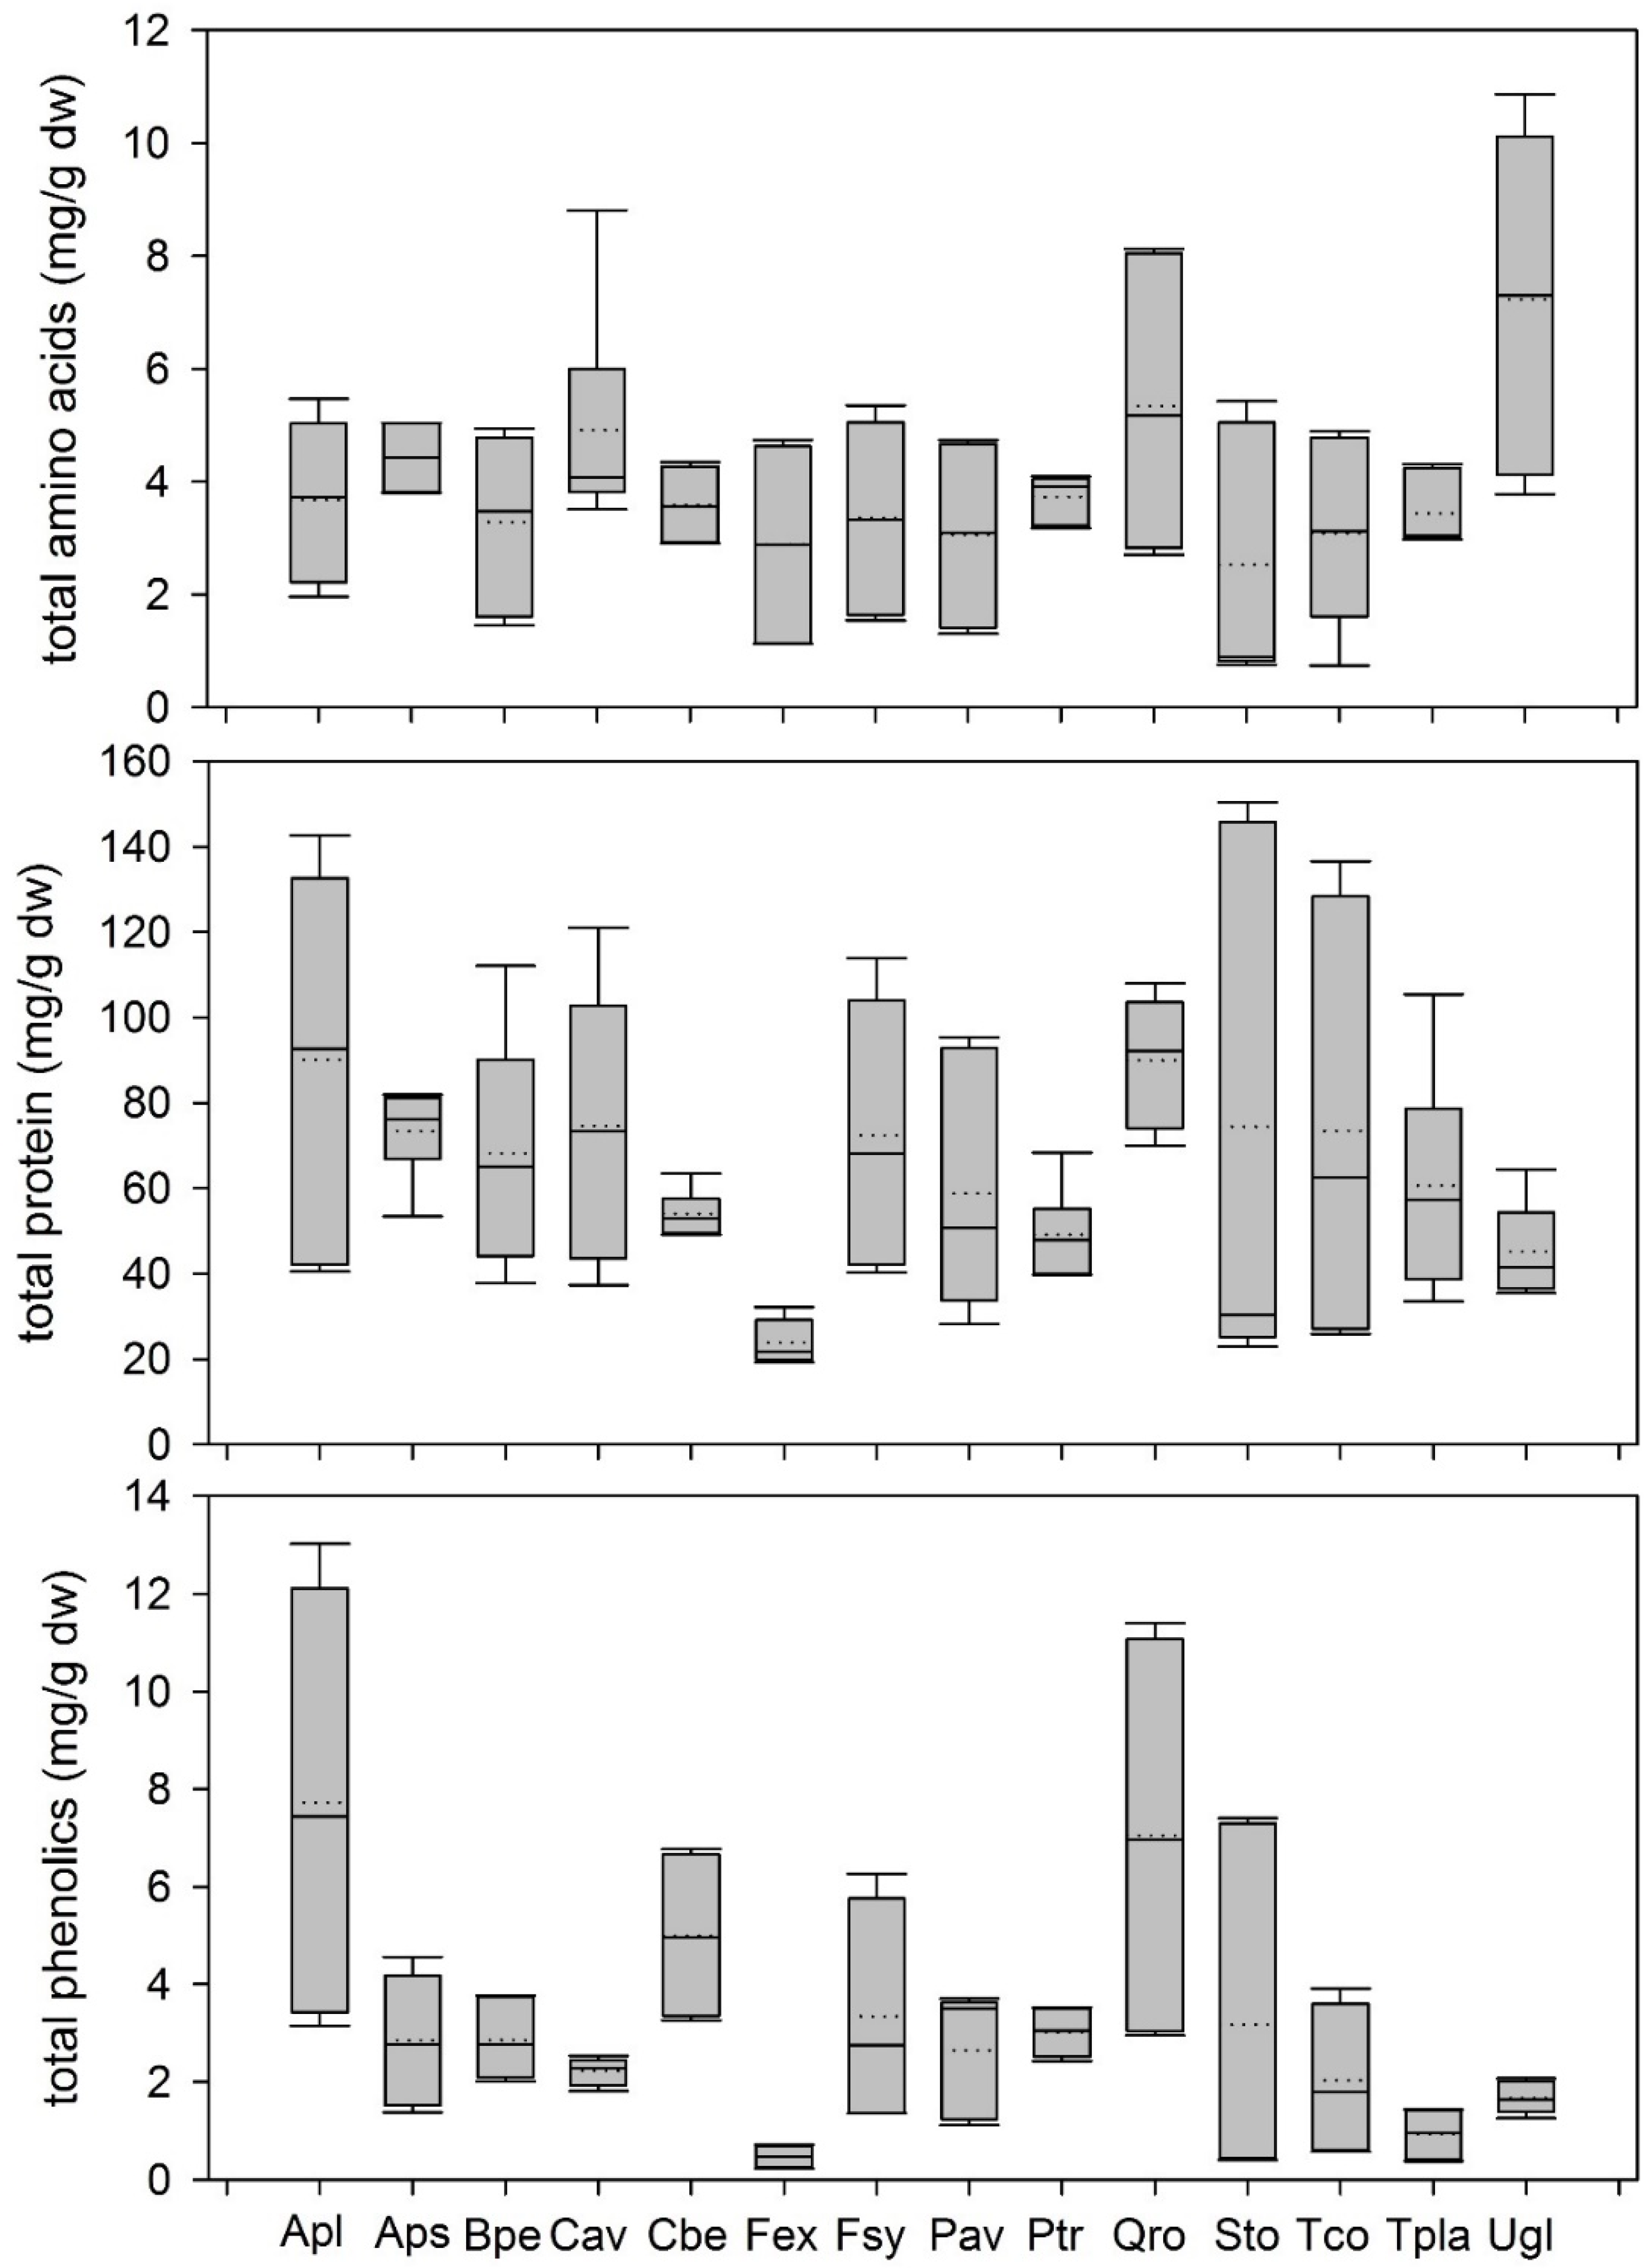
3.1.1. Variation of Leaf Metabolites in Leaf Litter

Species varied significantly in their C/N ratio, total N, total soluble protein, and phenolic concentrations (p <0.001), but not total amino acid content in leaf litter (Figure 1 and Figure 2, Tables S2 and S3). C/N ratio of B. pendula was higher than that of T. platyphyllos, T. cordata, C. avellana, and U. glabra; that of P. avium was higher compared to T. platyphyllos (p ≤ 0.012). Total N levels were generally higher in both Tilia species compared to B. pendula and P. avium, in C. avellana and U. glabra higher than in B. pendula (p ≤ 0.035). Total soluble protein concentrations were lower in F. excelsior than Q. robur and both Acer species (p ≤ 0.041). Total phenolic concentrations were higher in A. platanoides and Q. robur compared to F. excelsior and T. platyphyllos, and higher in C. betulus than F. excelsior (p ≤ 0.046). All other species combinations for the measured parameters were not significantly different.
Within each species, the measured parameters in leaf litter differed significantly between years. Total N was significantly higher in the drier/colder year for all species (p ≤ 0.021), whereas the C/N ratio was lower (p ≤ 0.039), except for C. betulus, F. sylvatica (both parameters), and T. cordata (only C/N ratio). Total C concentration did not vary for any species between the two years. Total soluble amino acid and protein concentrations in leaf litter were lower in the drier/colder year in all species (p ≤ 0.029), except for C. avellana, P. tremula, and T. platyphyllos (for amino acids) and A. pseudoplatanus, C. betulus, F. excelsior, P. tremula, and U. glabra (for proteins). Total phenolic concentration was also lower in the drier/colder year in all species (p ≤ 0.005), except for P. tremula for which it was higher (p < 0.001), and C. avellana in which it did not differ significantly between years.

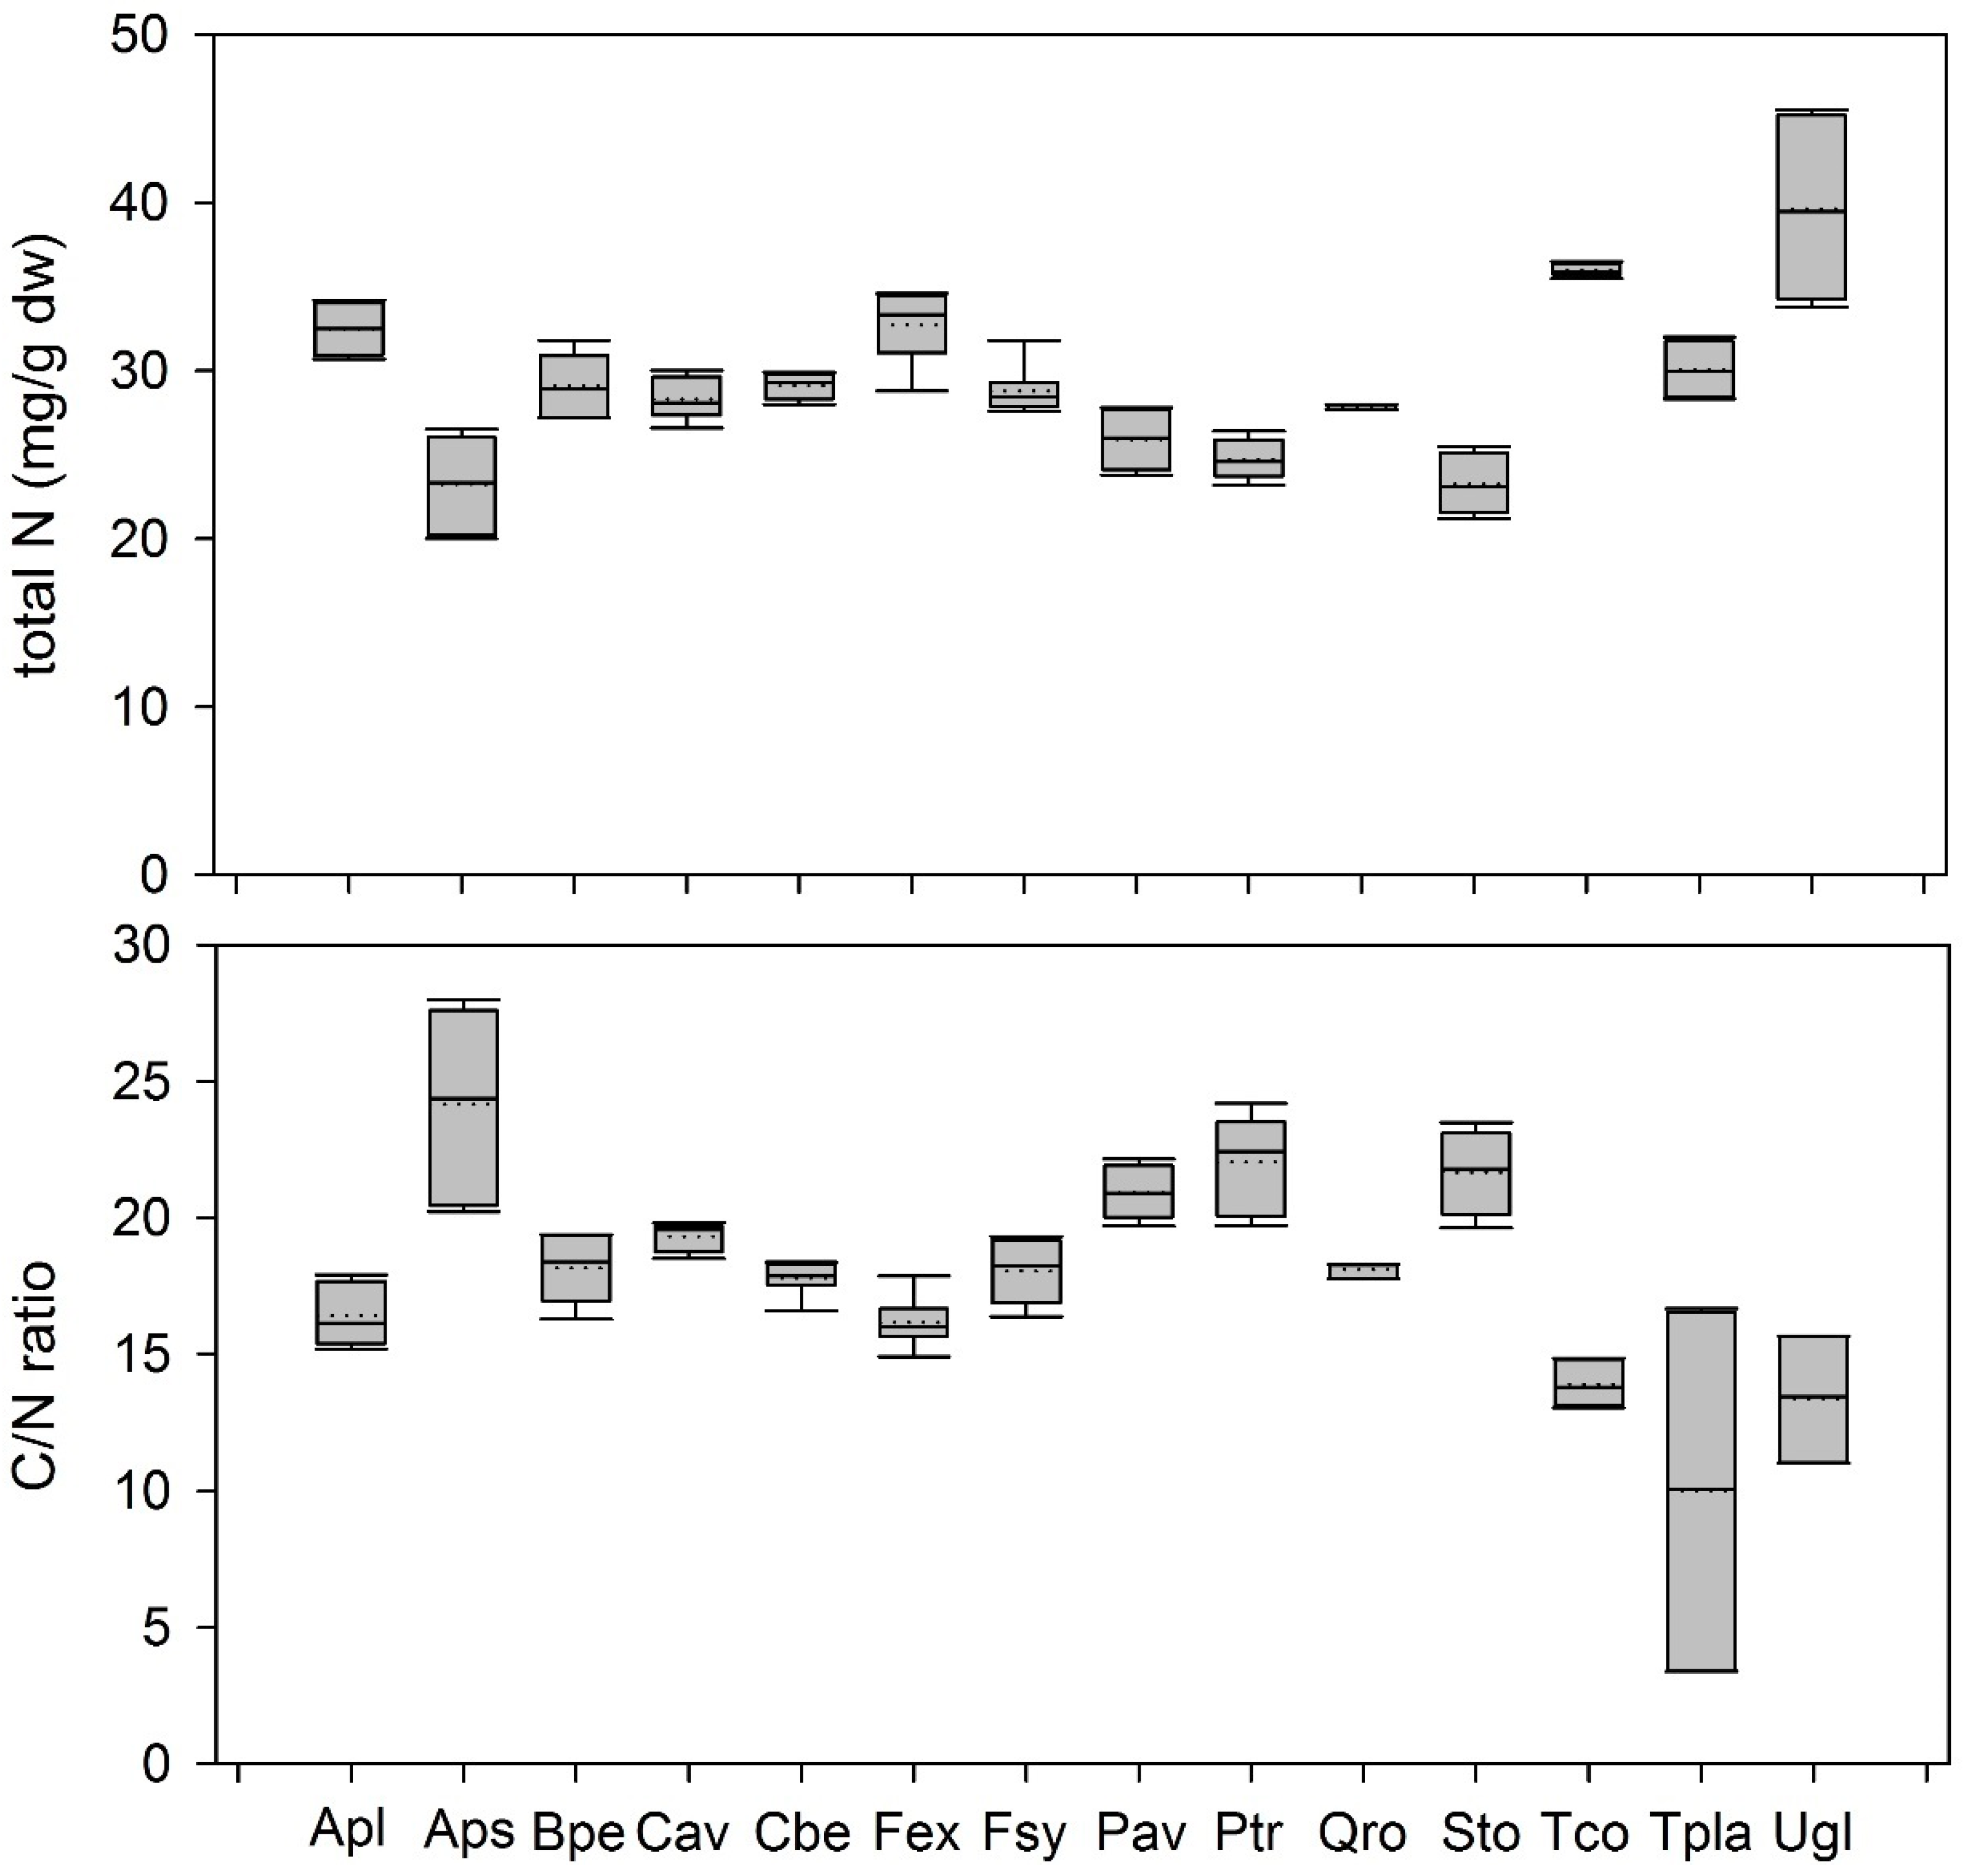
3.1.2. Variation of Leaf Metabolites in Green Leaves

In green leaves, species varied significantly in their C/N ratio, total N, total soluble protein, and phenolic concentrations (p ≤ 0.013), but not total amino acid content. C/N ratio was higher in A. pseudoplatanus, P. tremula, S. torminalis, and P. avium compared to both Tilia species and U. glabra (Figure 3 and Figure 4, Tables S2 and S3). In addition, C/N ratio was lower in F. excelsior compared to A. pseudoplatanus and P. tremula, and in A. platanoides compared to A. pseudoplatanus. Total N content was higher in T. cordata, U. glabra, F. excelsior, and A. platanoides compared to S. torminalis, A. pseudoplatanus, P. tremula, and lower in P. avium compared to T. cordata and U. glabra (p ≤ 0.037). Total soluble protein concentration was lower in F. excelsior compared to F. sylvatica, P. tremula, and A. platanoides. Total soluble phenolic content was higher in Q. robur, C. betulus, P. tremula, and both Acer species compared to U. glabra and F. excelsior (not A. platanoides), and higher in Q. robur and C. betulus than in T. cordata (p ≤ 0.046). All other species combinations for the measured parameters were not significantly different.
Measured parameters in green leaves differed significantly between years within each species. Compared to leaf litter, there was a less clear tendency of influence of climate on leaf metabolites. Total N concentration in green leaves was significantly higher in the colder/drier year in both Acer species, B. pendula, P. tremula, S. torminalis, and U. glabra (p ≤ 0.004), whereas it was lower in C. betulus, C. avellana, P. avium, and T. platyphyllos (p ≤ 0.041). C/N ratio was generally lower in the colder/drier year for both Acer species, B. pendula, P. tremula, S. torminalis, both Tilia species, and U. glabra; however, for P. avium, it was lower in the colder/drier year (p ≤ 0.013). Total C concentration was lower in the colder/drier year only in C. avellana, P. tremula, P. avium, both Tilia species, and U. glabra (p ≤ 0.043), with no significant differences between years for the other species. Total soluble amino acid concentration in green leaves was lower in the colder/drier year for all species (p ≤ 0.014), except B. pendula, C. betulus, P. tremula, P. avium, and T. cordata with no significant differences between years. In contrast, total soluble protein concentration was higher in the colder/drier year for all species (p ≤ 0.020), except C. betulus, C. avellana, F. excelsior, P. tremula, S. torminalis, and T. platyphyllos with no differences between years. Total phenolic concentration differed between years depending on the species: In the colder/drier year, it was lower in both Acer species, F. sylvatica, F. excelsior, P. avium, S. torminalis, and U. glabra (p ≤ 0.039), higher in B. pendula, C. avellana, P. tremula, and in both Tilia species (≤0.012), with no difference between the two years in C. betulus.

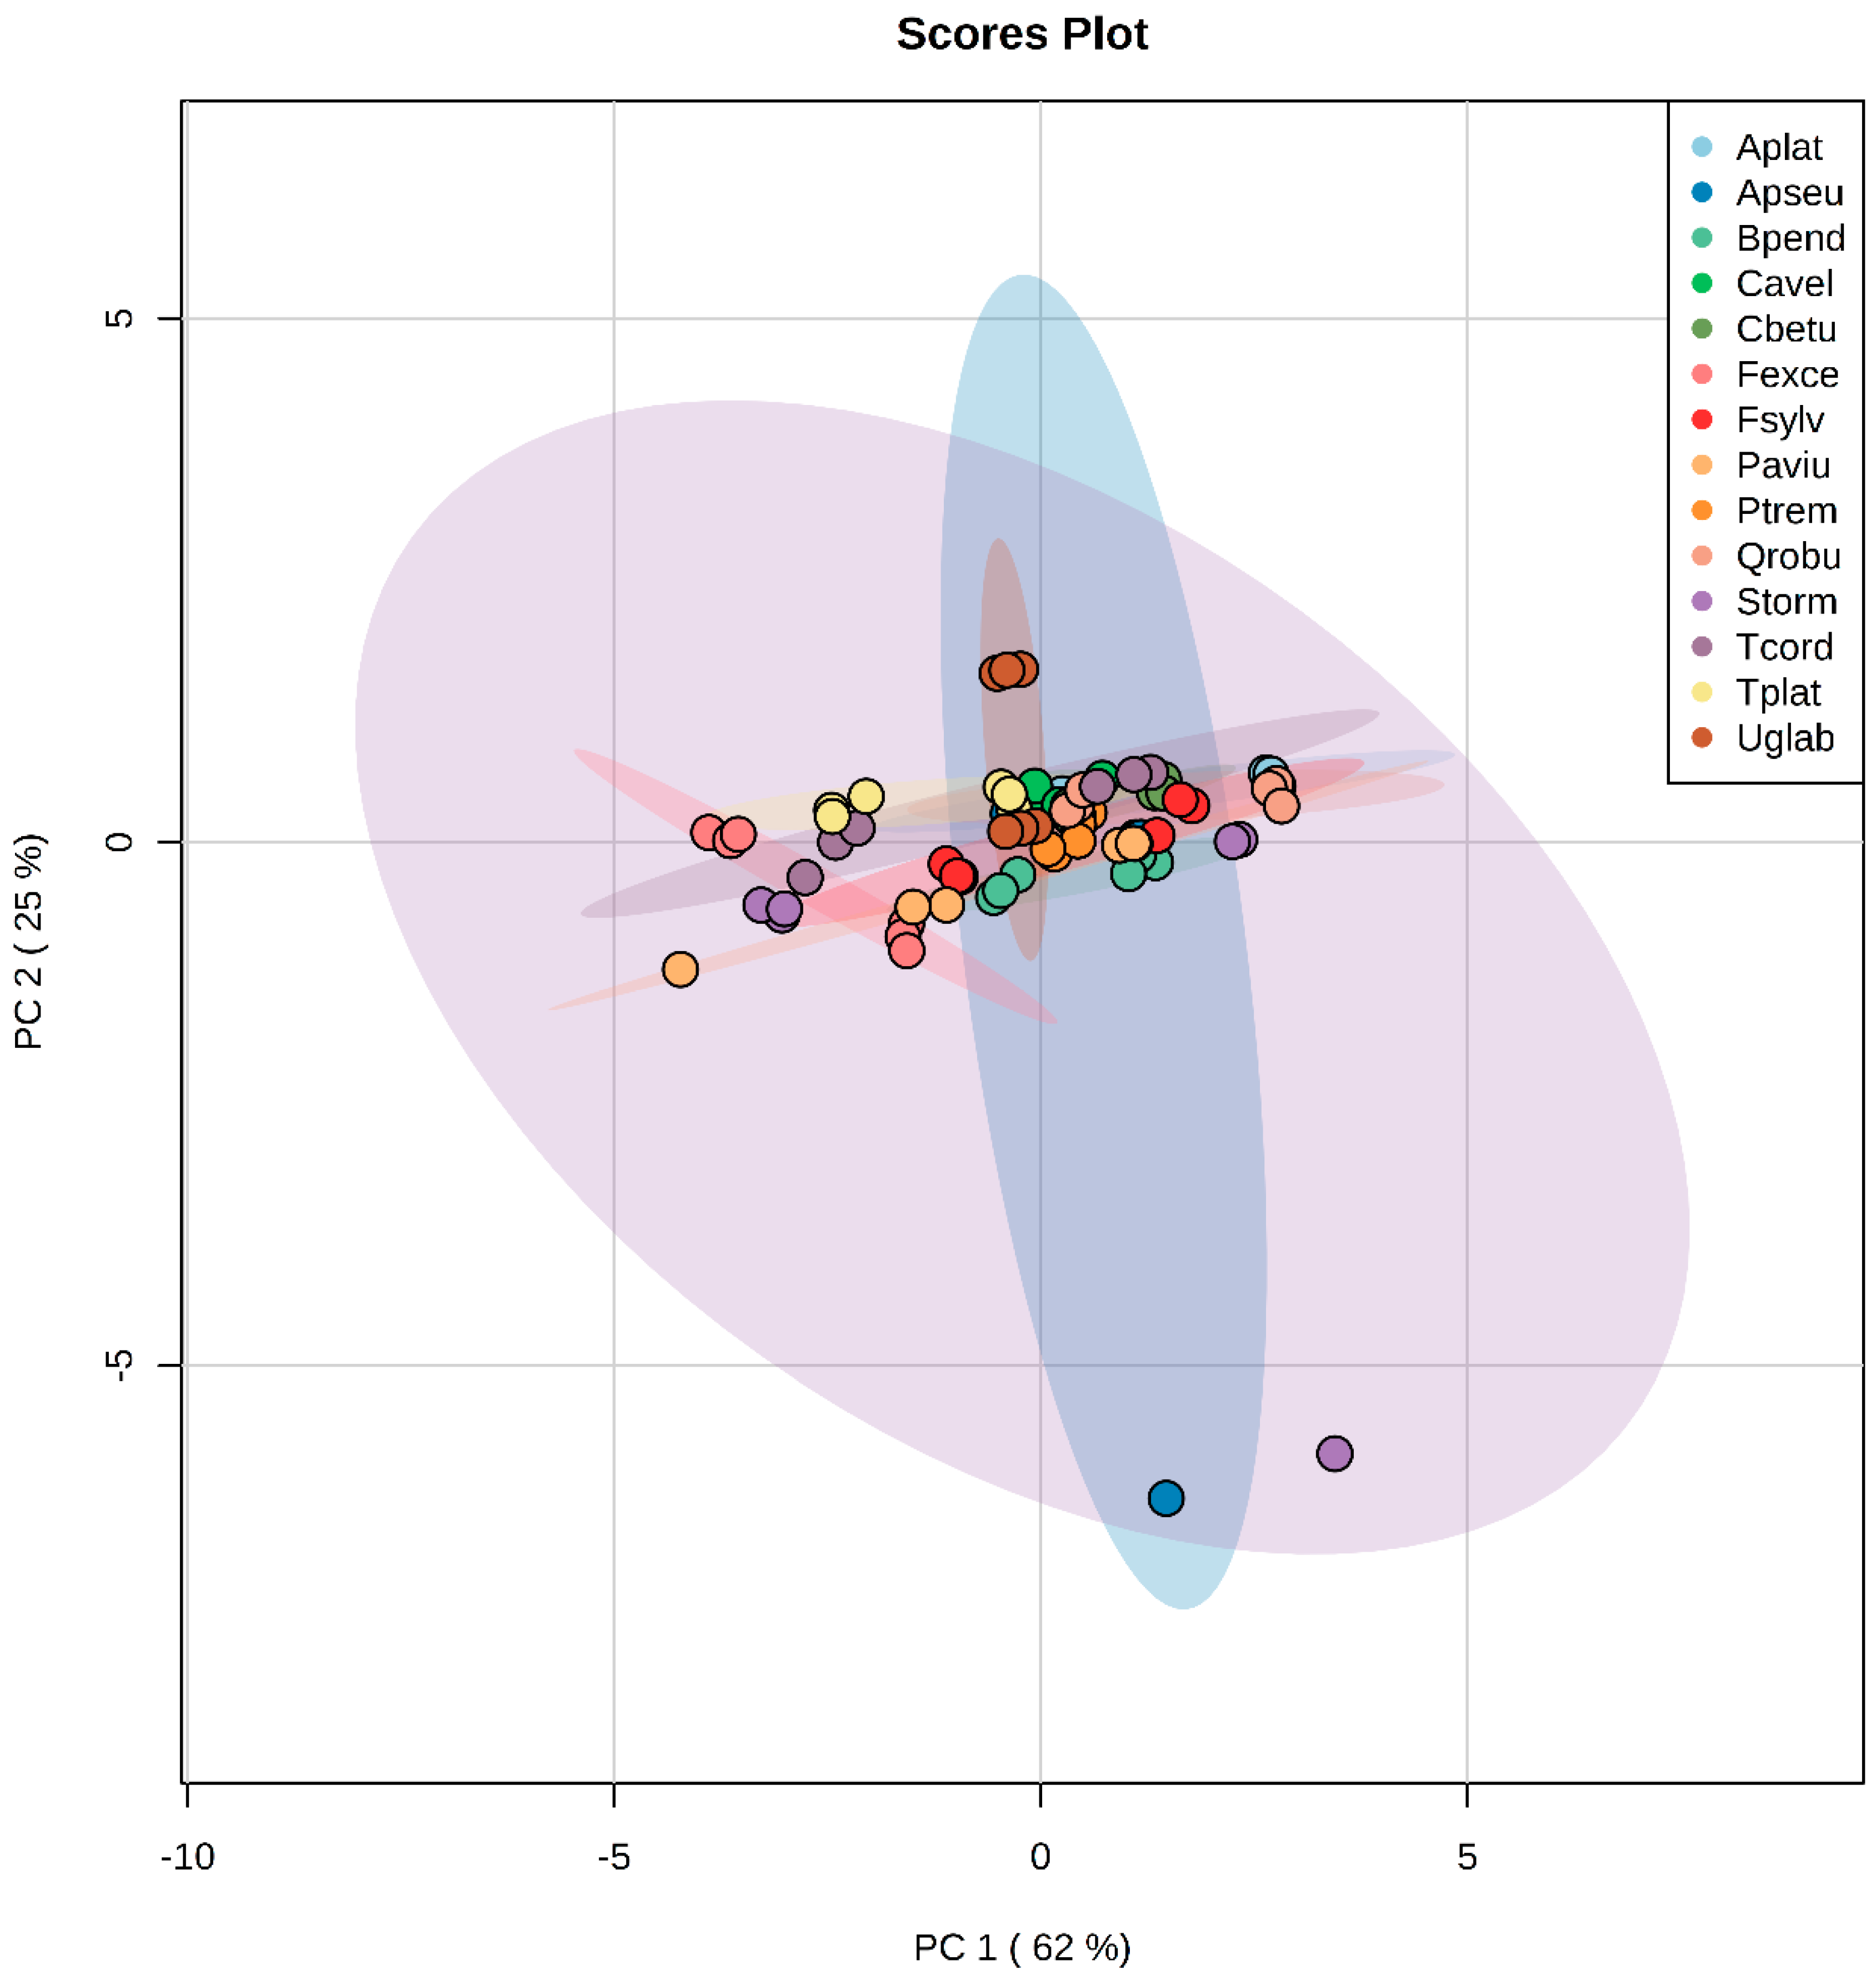
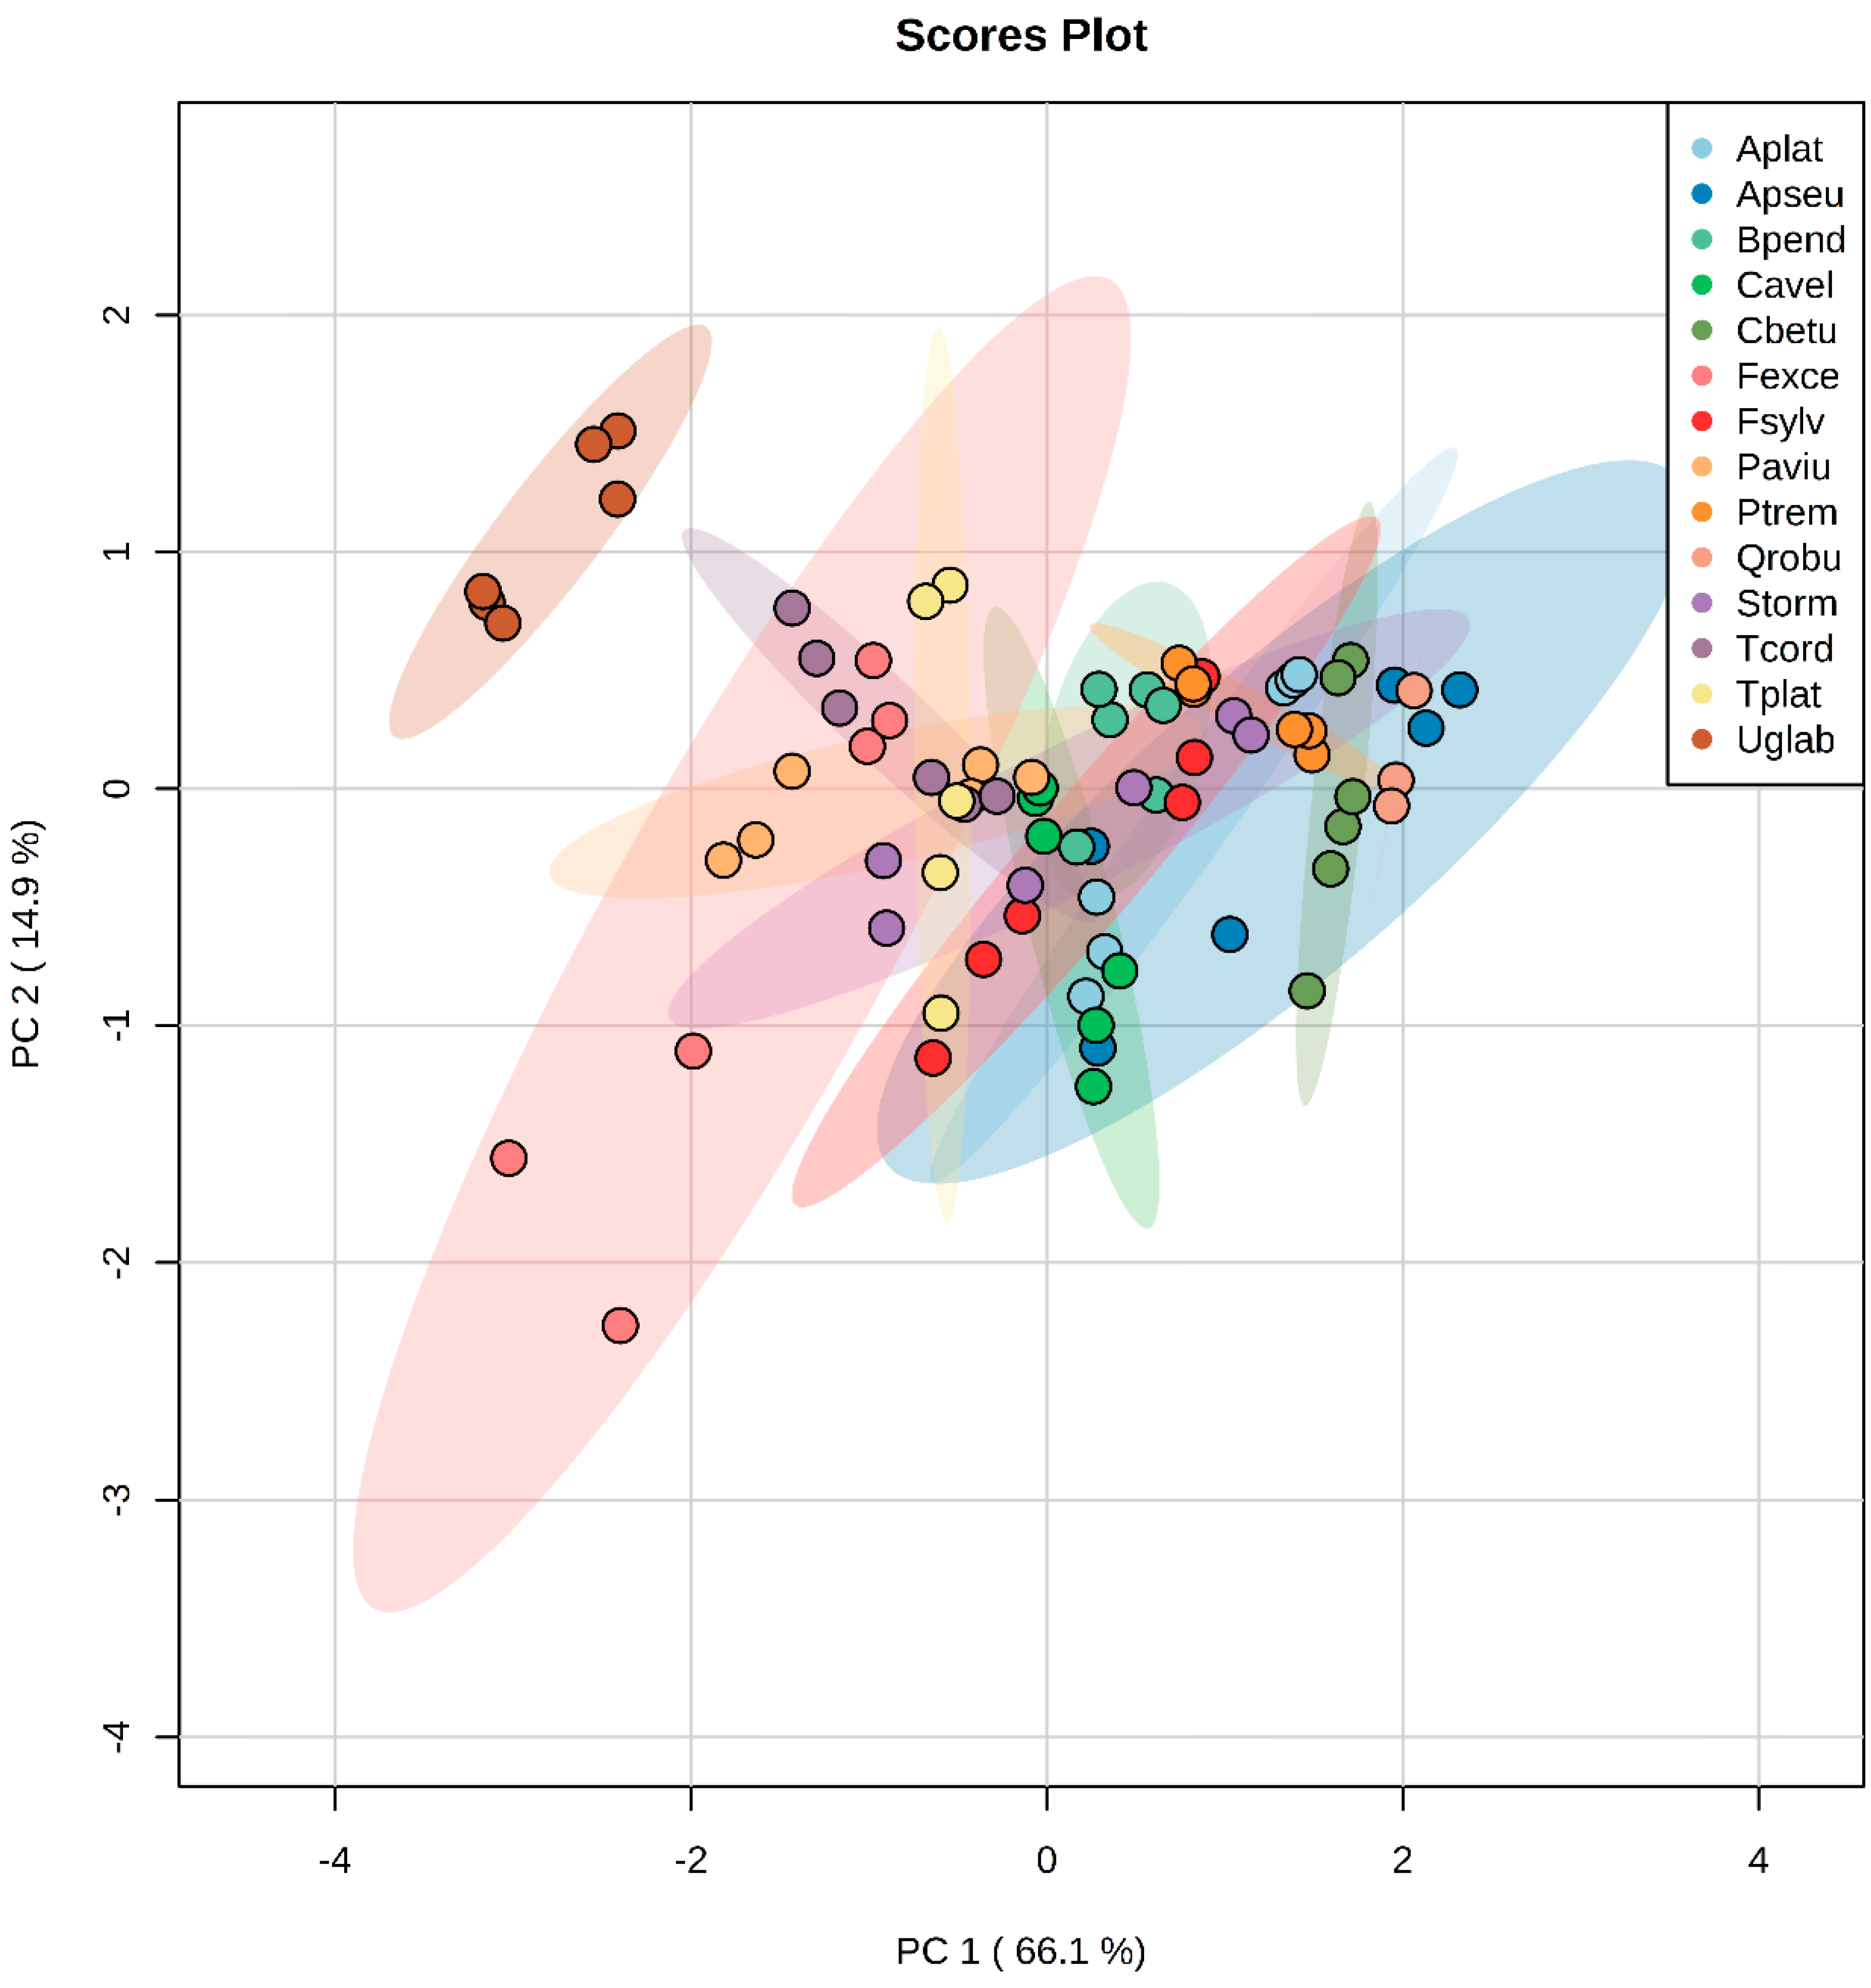
3.1.3. Principal Component Analysis in Green and Litter Leaves

Considering total N and C, total soluble amino acid, protein, and phenolic concentrations, we conducted principal component analyses (PCA) for the combined years of green leaves and leaf litter (Figure 5 and Figure 6). PCA indicated that the functional traits measured in our study differed between species: For leaf litter, 62% were explained by total soluble phenolic levels and 25% by total nitrogen, whereas the other parameters accounted for less than 9% each (Figure 5, Table S4). For the green leaves, 66.1% were explained by total soluble phenolics, 14.9% by total soluble amino acids, and less than 10.5% each by the other parameters (Figure 6, Table S4). For green leaves, Ulmus glabra formed a separate group, whereas for the other species, there was no clear distinction between species, but rather, some overlay. For leaf litter, there was no clear species distinction at all.

4. Discussion

4.1. No General Patterns across Metabolite Profiles in Leaf Litter and Green Leaves between Species

Comparing the metabolite profiles of 14 different temperate woody species with regard to their total N, C, soluble amino acid, protein, and phenolic levels in the leaves (i.e., green or litter) using principal component analysis (PCA), we found no distinct pattern between species, such as a grouping into the species according to growth strategies as proposed by Reich et al. [53], except for Ulmus in green leaves. The separation of Ulmus from the others species might be explained by the major growth increase of the annual long shoot axes (>1 m), corresponding with relatively large leaves compared to the other species, which had an annual growth increase in the long shoots of ~20 cm (V. Doerken, personal observation). In resource-limited habitats, inherently slow-growing species are typical that show slow growth even grown under optimal conditions, e.g., [54,55], because of trade-offs between leaf functional traits in favour of nutrient conservation, e.g., [53,56]. For example, lower photosynthesis rates associated with slow growth rates are related to a longer leaf life-span, and in turn, longer nutrient residence times in the leaves, e.g., [57]. However, these leaf trait interactions also shift with changing environmental conditions, for example, precipitation, e.g., [54,58]. Furthermore, leaf chemistry varies amongst other aspects depending on species and tree age, as well as annual variation due to climate differences [59]. Although our investigated species differ in their growth rates, nutrient demand, shade tolerance, and drought sensitivity [38,40], this did not result in different profiles of the measured metabolites. Tree age also varied between our study species, which also did not lead to a separation between the species in the PCA. However, in our study, all species were sampled at the same location, thereby minimizing the influences of environmental variation, such as differences in temperature and/or precipitation. Regarding the different parameters, total soluble phenolic levels explained 62% and 66.1% of the variation between the species in litter leaves and green leaves, respectively. Phenolics serve as a major chemical defence in green leaves [15] and their significant role in litter decomposition processes via their regulation of soil microbe activity has recently been reviewed [14]. For litter leaves, our results suggest that phenolics and total N levels drive most of the variation across species, which is in accordance with other studies [4,5,6,7,8]. For green leaves, we found that phenolics and total soluble amino acid levels drive most of the species variation. Although, total nitrogen content represents a key functional trait with regard to leaf economics and especially longer nutrient residence times in the leaves e.g., [53,56], overall total N content might be more similar in green leaves of different species, whereas amino acid levels differ.

4.2. Variation between Metabolites in Leaf Litter between Different Temperate Woody Species

Leaf litter metabolites varied significantly across all species. A higher C/N ratio was linked to a lower total N concentration, because total C concentrations in leaf litter did not vary significantly between species. Low initial nitrogen levels in litter indicate slower degradation rates of organic matter e.g., [2,11,12,60] because the soil microorganisms degrading the litter—mainly fungi and bacteria—have a high demand for N; thus, with only low initial N amounts available for them to feed upon, the growth of microbial populations is slow [21,61]. Microbial community composition and activity with regard to litter degradation is regulated by a plant species’ litter chemistry [62] via accessible resources, such as carbon, energy, and nutrients that are provided for them [63,64], rhizodeposition [62], but also abiotic influences, as well as consequences of biotic interactions, e.g., [63,65,66]. Total soluble protein levels—a major source for dissolved organic N e.g., [34,35]—as well as total phenolic levels—a class which includes chemical defence compounds [15]—also varied significantly between our study species. Interestingly, Fraxinus excelsior leaf litter had lower soluble phenolic levels compared to that of Quercus robur and Acer platanoides which suggests that the degradation of Fraxinus leaf litter might be faster than in these species. Skorupski et al. [31] compared the chemical composition of leaf litter from exotic and native tree species—including Quercus robur, Carpinus betulus, Tilia cordata, Tilia platyphyllos, and Corylus avellana, without finding differences between the two groups when comparing C/N ratio or contents of total N and C, as well as total phenolics; however, the native species were analysed as a mix rather than a single species; thus, a direct species comparison with our results is not possible.
Comparing total N concentrations and C/N ratios of leaf litter from the species used in our study to those from previous studies, we found that total N levels in litter were generally similar (e.g., [26,29,30,32,33,59]), whereas C/N ratios were similar only for some species (i.e., Acer platanoides, Carpinus betulus, Fagus sylvatica, Tilia cordata (see [29,30,33,57,67])), but lower in others (i.e., both Acer species, Betula pendula, Fraxinus excelsior, Quercus robur, e.g., [29,30,32]). However, to our knowledge, some species included here are presented for the first time, for example Corylus avellana, Populus tremula, Prunus avium, Sorbus torminalis, Tilia platyphyllos, and Ulmus glabra. The few multi-species studies by others found that total N (based on leaf area) levels were higher in Fraxinus excelsior and Quercus robur than in Tilia cordata [26], and higher in Tilia cordata and Fraxinus excelsior than in Fagus sylvatica (also for C/N ratio) [59], which was not found in our study. Furthermore, Lorenz et al. [33] compared Fagus sylvatica and Quercus robur, finding that they had similar total N levels and C/N ratios. Jacob et al. [29] did not compare between species; however, the results indicate that total N levels were lowest in Fagus sylvatica corresponding to the highest C/N ratio, whereas Fraxinus excelsior had the highest total N levels corresponding to the lowest C/N ratio; Tilia spp. Carpinus betulus, Acer pseudoplatanus, and Acer platanoides showed similar concentrations and ratios. Environmental differences between our study and previous studies could explain the differences, because variation in climate influences litter chemistry (see also Section 4.4).

4.3. Variation between Metabolites in Green Leaves between Different Temperate Woody Species

Growth and biomass production depend on the size of internal N pools from which N can be remobilized in spring [68], as well as external N uptake [69,70], especially in woody seedlings [71,72]. A metabolically active protein that also serves as N storage pool is RuBisCo, and N storage pools turn over completely during periods of N remobilization [73]. The contributions of N remobilization to the seasonal growth of trees differs across species and varies from 37%–48% for Acer pseudoplatanus and Betula pendula, to 14%–29% for Fraxinus excelsior, Fagus sylvatica, and Prunus avium, with an almost complete dependence of 80%–100% for Quercus robur (reviewed in [73]). In our study, the levels of the measured metabolites also varied between species in fully developed green leaves, which can be attributed to the differences in their internal N allocation strategies. Total soluble amino acid levels did not change overall between species. Previous studies found that the main amino acids translocated via the xylem sap during spring N remobilization also vary between species (reviewed in [73]): In Acer pseudoplatanus, mainly Asn, but also Gln is translocated, whereas in Betula pendula, it is mainly Cit, but also Gln, and in Prunus avium, Gln is the main translocated amino acid, but also Asn and Asp. We did not measure individual amino acid profiles in our study, which might have shown differences with regard to the preferred amino acids across species. The variation in total soluble phenolic levels between species suggests varying chemical defence strategies against herbivory. With regard to leaf soluble amino acid, protein, and phenolic levels, previous studies investigated them mainly during different developmental stages or as influenced by environmental conditions e.g., [74,75,76]. With regard to phenolic compounds, various studies have investigated the composition of phytochemical compounds rather than quantifying concentrations, for example, for Acer platanoides [77], Betula pendula [78], Carpinus betulus [79], Corylus avellana, e.g., [80,81,82].

4.4. Metabolite Levels in Green Leaves and Leaf Litter Differ between Years

Metabolite levels shifted significantly between the two investigated years. In leaf litter, levels of total N were generally lower in the colder and drier year, whereas C/N ratios, total soluble amino acids and protein levels were higher. Total phenolic concentration variation was species-specific. Litter studies investigating temperature and water availability have mainly focused on increased warming in combination with drought, e.g., [83]. Total N concentration in decomposed litter of Acer rubrum was lower; in turn, the C:N ratio was higher, after the exclusion of rainfall [84], suggesting that water availability might have a stronger influence on metabolite levels rather than temperature. Furthermore, Tharayil et al. [83] found an increase in highly reactive tannins—a subgroup of phenolics—with warming and drought due to changes in their structural composition. These changes might have severe consequences for ecosystem C and N cycling in the future, because a slowed soil microbial enzyme activity due to inactivation via tannins would lead to a reduction in litter decomposition rates. Zimmer et al. [85] reported that intraspecific variation in phenolics and their capacity to bind proteins depended on abiotic rather than genetic factors for European beech. Similar to leaf litter, the metabolite levels in green leaves also changed between the investigated years: C/N ratio, total C and soluble amino acid concentration was generally lower in the colder/drier year, whereas total soluble protein levels were higher. Total N and soluble phenolic concentration changes to climate depended on the species. A decrease of total soluble amino acid levels coupled with an increase in protein levels in the leaves indicates de novo protein synthesis in the colder/drier year. This strong variation of leaf functional traits depending on environmental factors has also been shown by Reich et al. [53] and Wright et al. [56], and is included in the leaf economics spectrum (e.g., [56,58]).

5. Conclusions

In conclusion, our study showed that 14 temperate woody species common to Central Europe could not be separated into different groups, such as slow vs fast growing species, according to the metabolite profiles measured in leaf litter and green leaves, although in general, the species differ in their growth rates, nutrient demand, shade tolerance, and drought sensitivity [38,58]. Total phenolic levels were the main drivers of variation between the 14 species in both litter and green leaves. Because species were sampled at the same location, environmental influences that might affect species differently at a given time were minimized. However, the local climate variation of two consecutive years led to significant differences in metabolite levels, although some of these differences were species-specific. Overall, metabolite levels in green and litter leaves of 14 temperate woody species are driven by species identity, as well as environmental conditions.

Supplementary Materials

The following are available online at https://www.mdpi.com/1999-4907/9/12/775/s1, Table S1: Temperature (°C) and total precipitation (mm) for the growth periods (GP, mid-May to mid-October) and non-growth periods (NGP, mid-October to mid-May), as well as annual for the different years. Table S2: Total N and C concentrations (mg/g dw) and C/N ratios in two consecutive years in leaf litter and green leaves. Table S3: Total soluble amino acid, protein, and phenolic concentrations (mg/g dw) in two consecutive years in leaf litter and green leaves. Table S4: Principal Component Analysis—Loading for the measured parameters.

Author Contributions

Conceptualization, J.S. and V.M.D.; methodology, J.S. and B.A.; sampling, V.M.D. and J.S.; data analysis and collection, J.S. and A.I.-M.-A.; data evaluation, J.S.; writing—original draft preparation, J.S., B.A., V.M.D.; writing—review and editing, J.S., B.A., V.M.D., A.I.-M.-A.; visualization, J.S.; project administration, J.S.

Funding

This research received no external funding.

Acknowledgments

We thank Sarah Stahl for help with the chemical analysis of the samples.

Conflicts of Interest

The authors declare no conflict of interest.

References

  1. Parton, W.; Silver, W.L.; Burke, I.C.; Grassens, L.; Harmon, M.E.; Currie, W.S.; King, J.Y.; Adair, E.C.; Brandt, L.A.; Hart, S.C.; et al. Global-scale similarities in nitrogen release patterns during long-term decomposition. Science 2007, 315, 361–364. [Google Scholar] [CrossRef]
  2. Cornwell, W.K.; Cornelissen, J.H.C.; Amatangelo, K.; Dorrepaal, E.; Eviner, V.T.; Godoy, O.; Hobbie, S.E.; Hoorens, B.; Kurokawa, H.; Pérez-Harguindeguy, N.; et al. Plant species traits are the predominant control on litter decomposition rates within biomes worldwide. Ecol. Lett. 2008, 11, 1065–1071. [Google Scholar] [CrossRef]
  3. Schmidt, M.W.I.; Torn, M.S.; Abiven, S.; Dittmar, T.; Guggenberger, G.; Janssens, I.A.; Kleber, M.; Kögel-Knabner, I.; Lehmann, J.; Manning, D.A.C.; et al. Persistence of soil organic matter as an ecosystem property. Nature 2011, 478, 49–56. [Google Scholar] [CrossRef] [Green Version]
  4. Garcia-Palacios, P.; Shaw, E.A.; Wall, D.H.; Hattenschwiler, S. Temporal dynamics of biotic and abiotic drivers of litter decomposition. Ecol. Lett. 2016, 19, 554–563. [Google Scholar] [CrossRef]
  5. Aber, J.D.; Melillo, J.M.; McClaugherty, C.A. Predicting long-term patterns of mass loss, nitrogen dynamics, and soil organic matter formation from initial fine litter chemistry in temperate forest ecosystems. Can. J. Bot. 1990, 68, 2201–2208. [Google Scholar] [CrossRef]
  6. Gholz, H.L.; Wedin, D.A.; Smitherman, S.M.; Harmon, M.E.; Parton, W.J. Long-term dynamics of pine and hardwood litter in contrasting environments: Toward a global model of decomposition. Glob. Change Biol. 2000, 6, 751–765. [Google Scholar] [CrossRef]
  7. Horner, J.D.; Gosz, J.R.; Cates, R.G. The role of carbon-based plant secondary metabolites in decomposition in terrestrial ecosystems. Am. Nat. 1988, 132, 869–883. [Google Scholar] [CrossRef]
  8. Kraus, T.E.C.; Dahlgren, R.A.; Zasoski, R.J. Tannins in nutrient dynamics of forest ecosystems—A review. Plant Soil 2003, 256, 41–66. [Google Scholar] [CrossRef]
  9. Aerts, R.; Chapin, F.S., III. The mineral nutrition of wild plants revisited: A re-evaluation of processes and patterns. Adv. Ecol. Res. 2000, 30, 1–67. [Google Scholar] [CrossRef]
  10. Güsewell, S.; Gessner, M.O. N:P ratios influence litter decomposition and colonization by fungi and bacteria in microcosms. Funct. Ecol. 2009, 23, 211–219. [Google Scholar] [CrossRef]
  11. Hättenschwiler, S.; Coq, S.; Barantal, S.; Handa, I.T. Leaf traits and decomposition in tropical rainforest: Revisiting some commonly held views towards a new hypothesis. New Phytol. 2011, 189, 950–965. [Google Scholar] [CrossRef] [PubMed]
  12. Zhang, H.-Y.; Lu, X.-T.; Hartmann, H.; Keller, A.; Han, X.-G.; Trumbore, S.; Phillips, R.P. Foliar nutrient resorption differs between arbuscular mycorrhizal and ectomycorrhizal trees at local and global scale. Glob. Ecol. Biogeogr. 2018, 27, 875–885. [Google Scholar] [CrossRef]
  13. Horwath, W. Carbon Cycling: The dynamics and formation of organic matter in soil microbiology, ecology, and biochemistry. In Soil Microbiology, Ecology and Biochemistry, 4th ed.; Paul, E.A., Ed.; Academic Press: Boston, MA, USA, 2015; pp. 339–382. ISBN 9789124159556. [Google Scholar]
  14. Chomel, M.; Guittonny-Larcheveque, M.; Fernandez, C.; Gallet, C.; Desrochers, A.; Paré, D.; Jackson, B.G.; Baldy, V. Plant secondary metabolites: A key driver of litter decomposition and nutrient cycling. J. Ecol. 2016, 104, 1527–1541. [Google Scholar] [CrossRef]
  15. Adamczyk, B.; Simon, J.; Kitunen, V.; Adamczyk, S.; Smolander, A. Tannins and their complex interaction with different organic nitrogen compounds and enzymes: Old paradigms versus recent advances. ChemistryOpen 2017, 6, 610–614. [Google Scholar] [CrossRef] [PubMed]
  16. Suseela, V.; Tharayil, N. Decoupling the direct and indirect effects of climate on plant litter decomposition: Accounting for stress-induced modifications in plant chemistry. Glob. Change Biol. 2018, 24, 1428–1451. [Google Scholar] [CrossRef] [PubMed]
  17. Bradford, M.A.; Warren, R.J., II; Baldrian, P.; Crowther, T.W.; Maynard, D.S.; Oldfield, E.E.; Wieder, W.R.; Wood, S.A.; King, J.R. Climate fails to predict wood decomposition at regional scales. Nat. Clim. Chang. 2014, 4, 625–630. [Google Scholar] [CrossRef] [Green Version]
  18. Bradford, M.A.; Berg, B.; Maynard, D.S.; Wieder, W.R.; Wood, S.A. Understanding the dominant controls on litter decomposition. J. Ecol. 2016, 104, 229–238. [Google Scholar] [CrossRef]
  19. Ehrenfeld, J.G.; Ravit, B.; Elgersma, K. Feedback in the plant-soil system. Annu. Rev. Environ. Resour. 2005, 30, 75–115. [Google Scholar] [CrossRef]
  20. Wurzburger, N.; Hendrick, R.L. Plant litter chemistry and mycorrhizal roots promote a nitrogen feedback in temperate forests. J. Ecol. 2009, 97, 528–536. [Google Scholar] [CrossRef]
  21. Craine, J.M.; Morrow, C.; Fierer, N. Microbial nitrogen limitation increases decomposition. Ecology 2007, 88, 2105–2113. [Google Scholar] [CrossRef]
  22. Knicker, H. Soil organic N—An under-rated player for C sequestration in soils? Soil Biol. Biochem. 2011, 43, 1118–1129. [Google Scholar] [CrossRef]
  23. Sariyildiz, T.; Anderson, J.M. Interactions between litter quality, decomposition, and soil fertility: A laboratory study. Soil Biol. Biochem. 2003, 35, 391–399. [Google Scholar] [CrossRef]
  24. Sariyildiz, T.; Anderson, J.M. Variation in the chemical composition of green leaves and leaf litters from three deciduous tree species growing in different soil types. For. Ecol. Manag. 2005, 210, 303–319. [Google Scholar] [CrossRef]
  25. Nordell, K.O.; Karlsson, P.S. Resorption of nitrogen and dry matter prior to leaf abscission: Variation among individuals, sites and years in the mountain birch. Funct. Ecol. 1995, 9, 326–333. [Google Scholar] [CrossRef]
  26. Hagen-Thorn, A.; Varnagiryte, I.; Nihlgard, B.; Armolaitis, K. Autumn nutrient resorption and losses in four deciduous tree species. For. Ecol. Manag. 2006, 228, 33–39. [Google Scholar] [CrossRef]
  27. Hättenschwiler, S.; Bracht-Jorgensen, H. Carbon quality rather than stoichiometry controls litter decomposition in a tropical rain forest. J. Ecol. 2010, 98, 754–763. [Google Scholar] [CrossRef] [Green Version]
  28. Coq, S.; Souquet, J.M.; Meudec, E.; Cheynier, V.; Hättenschwiler, S. Interspecific variation in leaf litter tannins drives decomposition in a tropical rain forest of French Guiana. Ecology 2010, 91, 2080–2091. [Google Scholar] [CrossRef]
  29. Jacob, M.; Weland, N.; Platner, C.; Schaefer, M.; Leuschner, C.; Thomas, F.M. Nutrient release from decompositing leaf litter of temperate deciduous forest trees along a gradient of increasing tree species diversity. Soil Biol. Biochem. 2009, 41, 2122–2130. [Google Scholar] [CrossRef]
  30. Hobbie, S.E.; Reich, P.B.; Oleksyn, J.; Ogdahl, M.; Zytkowiak, R.; Hale, C.; Karolewski, P. Tree species effects on decomposition and forest floor dynamics in a common garden. Ecology 2006, 87, 2288–2297. [Google Scholar] [CrossRef]
  31. Skorupski, M.; Jagodzinski, A.M.; Zytkowiak, R.; Karolewski, P. Differences in chemical composition of needle and leaf litter from exotic and native tree species stands. Dendrobiology 2012, 68, 101–112. [Google Scholar]
  32. Cotrufo, M.F.; Ineson, P. Elevated CO2 reduces field decomposition rates of Betula pendula (Roth.) leaf litter. Oecologia 1996, 106, 525–530. [Google Scholar] [CrossRef] [PubMed]
  33. Lorenz, K.; Preston, C.M.; Krumrei, S.; Feger, K.-H. Decomposition of needle/leaf litter from Scots pine, black cherry, common oak and European beech at a conurbation site. Eur. J. For. Res. 2004, 123, 177–188. [Google Scholar] [CrossRef]
  34. Top, S.M.; Filley, T.R. Effects of elevated CO2 on the extractable amino acids of leaf litter and fine roots. New Phytol. 2014, 202, 1257–1265. [Google Scholar] [CrossRef] [PubMed]
  35. Harris, C.W.; Silvester, E.; Rees, G.N.; Pengelly, J.; Puskar, L. Proteins are a major component of dissolved organic nitrogen (DON) leached from terrestrially aged Eucalyptus camaldulensis leaves. Environ. Chem. 2016, 13, 877–887. [Google Scholar] [CrossRef]
  36. Rawlins, A.J.; Bull, I.D.; Poirier, N.; Ineson, P.; Evershed, R.P. The biochemical transformation of oak (Quercus robur) leaf litter consumed by the pill millipede (Glomeris marginata). Soil Biol. Biochem. 2006, 38, 1063–1076. [Google Scholar] [CrossRef]
  37. Hicks, R.E.; Lee, C.; Marinucci, A.C. Loss and recycling of amino acids and protein from smooth cordgrass (Spartina alterniflora) litter. Estuaries 1991, 14, 430–439. [Google Scholar] [CrossRef]
  38. Ellenberg, H.; Leuschner, C. Vegetation Mitteleuropas mit den Alpen in Ökologischer, Dynamischer und Historischer SICHT, 6th ed.; Ulmer Verlag: Stuttgart, Germany, 2014; p. 1333. ISBN 9783825281045. [Google Scholar]
  39. Kiermeier, P. Die Lebensbereiche der Gehölze Eingeteilt nach dem Kennziffernsystem, 3rd ed.; Verlagsgesellschaft Grün ist Leben mbH: Pinneberg, Germany, 1993; p. 31. ISBN 38781510047. [Google Scholar]
  40. Professur für Waldbau und Professur für Forstschutz und Dendrologie der ETH Zürich. Mitteleuropäische Waldbaumarten; Artbeschreibung und Ökologie unter Besonderer Berücksichtigung der Schweiz; ETH-Zürich: Zürich, Switzerland, 2002. [Google Scholar]
  41. Grüning, M.; Simon, J.; Rennenberg, H.; l-M-Arnold, A. Defoliating insect mass infestation affects soil N fluxes and tree N nutrition in Scots pine forests. Front. Plant Sci. 2017, 8, 954. [Google Scholar] [CrossRef]
  42. Winter, H.; Lohaus, G.; Heldt, H.W. Phloem transport of amino acids in relation to their cytosolic levels in barley leaves. Plant Physiol. 1992, 99, 996–1004. [Google Scholar] [CrossRef]
  43. Li, X.; Rennenberg, H.; Simon, J. Seasonal variation in N uptake strategies in the understorey of a beech-dominated N-limited forest ecosystem depends on N source and species. Tree Physiol. 2016, 36, 589–600. [Google Scholar] [CrossRef] [Green Version]
  44. Liu, X.-P.; Grams, T.E.E.; Matyssek, R.; Rennenberg, H. Effects of elevated pCO2 and/or pO3 on C-, N-, and S-metabolites in the leaves of juvenile beech and spruce differ between trees grown in monoculture and mixed culture. Plant Physiol. Biochem. 2005, 43, 147–154. [Google Scholar] [CrossRef]
  45. Simon, J.; Gleadow, R.M.; Woodrow, I.E. Allocation of nitrogen to chemical defence and plant functional traits is constrained by soil N. Tree Physiol. 2010, 30, 1111–1117. [Google Scholar] [CrossRef] [PubMed] [Green Version]
  46. Xia, J.; Psychogios, N.; Young, N.; Wishart, D.S. MetaboAnalyst: A web server for metabolomic data analysis and interpretation. Nucleic Acids Res. 2009, 37, W652–W660. [Google Scholar] [CrossRef] [PubMed]
  47. Xia, J.; Wishart, D.S. Metabolomic data processing, analysis, and interpretation using MetaboAnalyst. Curr. Protoc. Bioinform. 2011, 14.10.1–14.10.48. [Google Scholar] [CrossRef] [PubMed]
  48. Xia, J.; Wishart, D.S. Web-based inference of biological patterns, functions and pathways from metabolomic data using MetaboAnalyst. Nat. Prococ. 2011, 6, 743–760. [Google Scholar] [CrossRef] [PubMed]
  49. Xia, J.; Mandal, R.; Sinelnikov, I.; Broadhurst, D.; Wishart, D.S. MetaboAnalyst 2.0—A comprehensive server for metabolomic data analysis. Nucleic Acids Res. 2012, 40, W127–W133. [Google Scholar] [CrossRef] [PubMed]
  50. Xia, J.; Sinelnikov, I.; Han, B.; Wishart, D.S. MetaboAnalyst 3.0—Making metabolomics more meaningful. Nucleic Acids Res. 2015, 43, W251–W257. [Google Scholar] [CrossRef]
  51. Xia, J.; Wishart, D.S. Using MetaboAnalyst 3.0 for comprehensive metabolomics data analysis. Curr. Protoc. Bioinform. 2016, 55, 14.10.1–14.10.91. [Google Scholar] [CrossRef]
  52. Chong, J.; Soufan, O.; Li, C.; Caraus, I.; Li, S.; Bourque, G.; Wishart, D.S.; Xia, J. MetaboAnalyst 4.0: Towards more transparent and integrative metabolomics analysis. Nucleic Acids Res. 2018. [Google Scholar] [CrossRef]
  53. Reich, P.B.; Walters, M.B.; Ellsworth, D.S. From tropics to tundra: Global convergence in plant functioning. Proc. Natl. Acad. Sci. USA 1997, 94, 13730–13734. [Google Scholar] [CrossRef] [Green Version]
  54. Grime, J.P.; Hunt, R. Relative growth rate: Its range and adaptive significance in a local flora. J. Ecol. 1975, 63, 393–422. [Google Scholar] [CrossRef]
  55. Lambers, H.; Poorter, H.; van Vuuren, M. Research on variation in plant growth rate—Introduction. In Inherent Variation in Plant Growth. Physiological Mechanism and Ecological Consequences; Lambers, H., Poorter, H., van Vuuren, M., Eds.; Backhuys Publishers: Leiden, The Netherlands, 1998; pp. 1–4. ISBN 90-73348-96-X. [Google Scholar]
  56. Wright, I.J.; Reich, P.B.; Westoby, M.; Ackerly, D.D.; Baruch, Z.; Bongers, F.; Cavender-Bares, J.; Chapin, T.; Cornelissen, J.H.C.; Diemer, M.; et al. The worldwide leaf economics spectrum. Nature 2004, 428, 821–827. [Google Scholar] [CrossRef] [PubMed] [Green Version]
  57. Poorter, H.; Garnier, E. Ecological significance of inherent variation in relative growth rate and its components. In Handbook of Functional Plant Ecology; Pugnaire, F.I., Valladares, F., Eds.; M Dekker: New York, NY, USA, 1999; pp. 81–120. ISBN 9780849374883. [Google Scholar]
  58. Reich, P.B.; Buschena, C.; Tjoelker, M.G.; Wrage, K.; Knops, J.; Tilman, D.; Machado, J.L. Variation in growth rate among 34 grassland and savanna species under contrasting N-supply: A test of functional group differences. New Phytol. 2003, 157, 617–631. [Google Scholar] [CrossRef]
  59. Langenbruch, C.; Helfrich, M.; Flessa, H. Effects of beech (Fagus sylvatica), ash (Fraxinus excelsior) and lime (Tilia spec.) on soil chemical properties in a mixed deciduous forest. Plant Soil 2012, 352, 389–403. [Google Scholar] [CrossRef]
  60. Zhou, G.; Zhang, J.; Qiu, X.; Wie, F.; Xu, X. Decomposing litter and associated microbial activity responses to nitrogen deposition in two subtropical forests containing nitrogen-fixing or non-nitrogen-fixing tree species. Sci. Rep. 2018, 8, 12934. [Google Scholar] [CrossRef] [PubMed]
  61. Cotrufo, M.F.; Miller, M.; Zeller, B. Litter decomposition. In Ecological Studies 142—Carbon and Nitrogen Cycling in European Forest Ecosystems; Schulze, E.-D., Ed.; Springer-Verlag: Berlin/Heidelberg, Germany, 2000; pp. 276–296. ISBN 3-540-67239-7. [Google Scholar]
  62. Austin, A.T.; Vivanco, L.; González-Arzac, A.; Pérez, L.I. There’s no place like home? An exploration of the mechanisms behind plant litter-decomposer affinity in terrestrial ecosystems. New Phytol. 2014, 204, 307–314. [Google Scholar] [CrossRef] [PubMed]
  63. Handa, I.T.; Aerts, R.; Berendse, F.; Berg, M.P.; Bruder, A.; Butenschoen, O.; Chauvet, E.; Gessner, M.O.; Jabiol, J.; Makkonen, M.; et al. Consequences of biodiversity loss for litter decomposition across biomes. Nature 2014, 509, 218–221. [Google Scholar] [CrossRef] [PubMed] [Green Version]
  64. Barbe, L.; Jung, V.; Prinzing, A.; Bittebiere, A.-K.; Butenschoen, O.; Mony, C. Functionally dissimilar neighbors accelerate litter decomposition in two grass species. New Phytol. 2017, 214, 1092–1102. [Google Scholar] [CrossRef] [PubMed] [Green Version]
  65. Eviner, V.T.; Chapin, F.S.; Vaughn, C.E. Seasonal variation in plant species effects on soil N and P dynamics. Ecology 2006, 87, 974–986. [Google Scholar] [CrossRef]
  66. Vivanco, L.; Rascovan, N.; Austin, A.T. Plant, fungal, bacterial, and nitrogen interactions in the litter layer of a native Patagonian forest. PeerJ 2018, 6, e4754. [Google Scholar] [CrossRef] [Green Version]
  67. Butenschoen, O.; Scheu, S. Climate change triggers effects of fungal pathogens and insect herbivores on litter decomposition. Acta Oecol. 2014, 60, 49–56. [Google Scholar] [CrossRef]
  68. Tagliavini, M.; Quartieri, M.; Millard, P. Remobilised nitrogen and root uptake of nitrate for spring leaf growth, flowers and developing fruits of pear (Pyrus communis L.) trees. Plant Soil 1997, 196, 137–142. [Google Scholar] [CrossRef]
  69. Millard, P. Ecophysiology of the internal cycling of nitrogen for tree growth. Z. Pflanzenern. Bodenk. 1996, 159, 1–10. [Google Scholar] [CrossRef]
  70. Dyckmans, J.; Flessa, H. Influence of tree internal N status on uptake and translocation of C and N in beech: A dual 13C and 15N labelling approach. Tree Physiol. 2001, 21, 395–401. [Google Scholar] [CrossRef] [PubMed]
  71. Fotelli, M.N.; Rienks, M.; Rennenberg, H.; Gessler, A. Climate and forest management affect 15N-uptake, N balance and biomass of European beech seedlings. Trees 2004, 18, 157–166. [Google Scholar] [CrossRef]
  72. Simon, J.; Dannenmann, M.; Gasche, R.; Holst, J.; Mayer, H.; Papen, H.; Rennenberg, H. Competition for nitrogen between adult European beech and its offspring is reduced by avoidance strategy. For. Ecol. Manag. 2011, 262, 105–114. [Google Scholar] [CrossRef]
  73. Millard, P.; Grelet, G.-A. Nitrogen storage and remobilization by trees: Ecophysiological relevance in a changing world. Tree Physiol. 2010, 30, 1083–1095. [Google Scholar] [CrossRef] [PubMed]
  74. Ruuhola, T.; Ossipov, V.; Lempa, K.; Haukioja, E. Amino acids during leaf development of mountain birch leaves. Chemoecology 2003, 13, 95–101. [Google Scholar] [CrossRef]
  75. Jeong, M.L.; Jiang, H.; Chen, H.-S.; Tsai, C.-J.; Harding, S.A. Metabolomic profiling of the sink-to-source transition in developing leaves of quaking aspen. Plant Physiol. 2004, 136, 3364–3375. [Google Scholar] [CrossRef]
  76. Tegelberg, R.; Julkunen-Tiitto, R.; Vartiainen, M.; Paunonen, R.; Rousi, M.; Kellomäki, S. Exposures to elevated CO2, elevated temperature and enhanced UV-B radiation modify activities of polyphenol oxidase and guaiacol peroxidase and concentrations of chlorophylls, polyamines and soluble proteins in the leaves of Betula pendula seedlings. Environ. Exp. Bot. 2008, 62, 308–315. [Google Scholar] [CrossRef]
  77. Zhang, L.; Tu, Z.C.; Yuan, T.; Ma, H.; Niesen, D.B.; Wang, H.; Seeram, N.P. New Gallotannin and other Phytochemicals from Sycamore Maple (Acer pseudoplatanus) Leaves. Nat. Prod. Commun. 2015, 10, 1977–1980. [Google Scholar]
  78. Chernyak, E.I.; Yushkova, Y.A.; Pavlushin, S.V.; Nikolenko, S.O.; Matem’yanov, V.V.; Morozov, S.V. Dynamics of biologically active compound contents from Betula pendula leaves during early leaf development. Chem. Nat. Compd. 2016, 52, 193–198. [Google Scholar] [CrossRef]
  79. Hofmann, T.; Nebehaj, E.; Albert, L. Antioxidant properties and detailed polyphenol profiling of European hornbeam (Carpinus betulus L.) leaves by multiple antioxidant capacity assays and high-performance liquid chromatograph/multistage electrospray mass spectrometry. Ind. Crops Prod. 2016, 87, 340–349. [Google Scholar] [CrossRef]
  80. Riethmüller, E.; Tóth, G.; Alberti, A.; Végh, K.; Burlini, I.; Könczöl, A.; Balogh, G.T.; Kéry, A. First characterisation of flavonoid- and diarylheptanoid-type antioxidant phenolics in Corylus maxima by HPLC-DAD-ESI-MS. J. Pharm. Biomed. Anal. 2015, 107, 159–167. [Google Scholar] [CrossRef] [PubMed]
  81. Riethmüller, E.; Alberti, A.; Tóth, G.; Béni, S.; Ortolano, F.; Kéry, A. Characterisation of diarylheptanoid- and flavonoid-type phenolics in Corylus avellana L. leaves and bark by HPLC/DAD-ESI/MS. Phytochem. Anal. 2013, 24, 493–503. [Google Scholar] [CrossRef] [PubMed]
  82. Amaral, J.S.; Ferreres, F.; Andrade, P.B.; Valentao, P.; Pinheiro, C.; Santos, A.; Seabra, R. Phenolic profile of hazelnut (Corylus avellana L.) leaves cultivars grown in Portugal. Nat. Prod. Res. 2005, 19, 157–163. [Google Scholar] [CrossRef] [PubMed]
  83. Tharayil, N.; Suseela, V.; Triebwasser, D.J.; Preston, C.M.; Gerard, P.D.; Dukes, J.S. Changes in the structural composition and reactivity of Acer rubrum leaf litter tannins exposed to warming and altered precipitation: Climatic stress-induced tannins are more reactive. New Phytol. 2011, 191, 132–145. [Google Scholar] [CrossRef] [PubMed]
  84. O’Neill, E.G.; Johnson, D.W.; Ledford, J.; Todd, D.E. Acute seasonal drought does not permanently alter mass loss and nitrogen dynamics during decomposition of red maple (Acer rubrum L.) litter. Glob. Change Biol. 2003, 9, 117–123. [Google Scholar] [CrossRef]
  85. Zimmer, M.; Auge, H.; von Wühlisch, G.; Schueler, S.; Haase, J. Environment rather than genetic background explains intraspecific variation in the protein-precipitating capacity of phenolic compounds in beech litter. Plant Ecol. Divers. 2015, 8, 73–79. [Google Scholar] [CrossRef]
Figure 1. Total N concentration (mg/g dw) (top) and C/N ratio (bottom) in leaf litter. Boxplots show mean (dotted line) and median (straight line) for the combined years. Apl = Acer platanoides, Aps = Acer pseudoplatanus, Bpe = Betula pendula, Cav = Corylus avellana, Cbe = Carpinus betulus, Fex = Fraxinus excelsior, Fsy = Fagus sylvatica, Pav = Prunus avium, Ptr = Populus tremula, Qro = Quercus robur, Sto = Sorbus torminalis, Tco = Tilia cordata, Tpla = Tilia platyphyllos, Ugl = Ulmus glabra.
Forests 09 00775 g001
Figure 2. Total soluble amino acid (top), protein (center), and phenolic (bottom) concentration (mg/g dw) in leaf litter. Boxplots show mean (dotted line) and median (straight line) for the combined years. Apl = Acer platanoides, Aps = Acer pseudoplatanus, Bpe = Betula pendula, Cav = Corylus avellana, Cbe = Carpinus betulus, Fex = Fraxinus excelsior, Fsy = Fagus sylvatica, Pav = Prunus avium, Ptr = Populus tremula, Qro = Quercus robur, Sto = Sorbus torminalis, Tco = Tilia cordata, Tpla = Tilia platyphyllos, Ugl = Ulmus glabra.
Forests 09 00775 g002
Figure 3. Total N concentration (mg/g dw) (top) and C/N ratio (bottom) in green leaves. Boxplots show mean (dotted line) and median (straight line) for the combined years. Data for Q. robur is only available for the first year. Apl = Acer platanoides, Aps = Acer pseudoplatanus, Bpe = Betula pendula, Cav = Corylus avellana, Cbe = Carpinus betulus, Fex = Fraxinus excelsior, Fsy = Fagus sylvatica, Pav = Prunus avium, Ptr = Populus tremula, Qro = Quercus robur, Sto = Sorbus torminalis, Tco = Tilia cordata, Tpla = Tilia platyphyllos, Ugl = Ulmus glabra.
Forests 09 00775 g003
Figure 4. Total soluble amino acid (top), protein (center), and phenolic (bottom) concentration (mg/g dw) in green leaves. Boxplots show mean (dotted line) and median (straight line) for the combined years. Data for Q. robur is only available for the first year. Apl = Acer platanoides, Aps = Acer pseudoplatanus, Bpe = Betula pendula, Cav = Corylus avellana, Cbe = Carpinus betulus, Fex = Fraxinus excelsior, Fsy = Fagus sylvatica, Pav = Prunus avium, Ptr = Populus tremula, Qro = Quercus robur, Sto = Sorbus torminalis, Tco = Tilia cordata, Tpla = Tilia platyphyllos, Ugl = Ulmus glabra.
Forests 09 00775 g004
Figure 5. Two-dimensional score plot of principal component analysis computed with concentrations of total N, soluble amino acids, proteins, and phenolics in leaf litter (after senescence) for the combined years. Subgroups are shown in different colours. The explained variances (in percentage) are reported in x- and y-axes in the plot.
Forests 09 00775 g005
Figure 6. Two-dimensional score plot of principal component analysis computed with concentrations of total N, soluble amino acids, proteins, and phenolics in green leaves (after leaf development) for the combined years. Data for Q. robur is only available for the first year. Subgroups are shown in different colours. The explained variances (in percentage) are reported in x- and y-axes in the plot.
Forests 09 00775 g006
Table 1. Relative growth rates, nutrient demand, drought resistance, and shade tolerance of the investigated species. Details were taken from Kiermeier et al. [39] for Corylus avellana, for all other species from Professur für Waldbau und Professur für Forstschutz und Dendrologie der ETH Zürich [40].
SpeciesRelative Growth RateNutrient DemandDrought ResistanceShade Tolerance
Acer platanoidesfastmedium/highhighhigh
Acer pseudoplatanusfastmedium/highhighmedium
Betula pendulafastlowmediumlow
Carpinus betulusslowmediummediummedium
Corylus avellanamediummedium/highmediummedium/high
Fagus sylvaticaslowlow/mediumhighhigh
Fraxinus excelsiorfastmedium/highmediumlow/medium
Populus tremulafastlowmediumlow
Prunus aviumfastmedium/highhighlow
Quercus roburmedium/fastlowmediumlow
Sorbus torminalisslowhighmedium/highmedium
Tilia cordataslowmediumhighhigh
Tilia platyphyllosslowmedium/highhighhigh
Ulmus glabrafasthighhighmedium

