Abstract
Ecosystem response to hurricane disturbance is complex and multi-faceted. The likelihood of increased frequency of severe hurricanes creates a need for the general public to understand how ecosystems respond to hurricanes. Yet, opportunities to study disturbances to complex systems are rare in U.S. K–12 schools. Educators and researchers in the Luquillo Long-Term Ecological Research program used the results of research on ecosystem response to hurricane disturbance in the Luquillo Experimental Forest as a foundation for the development of Journey to El Yunque, a web-based, middle-school curriculum unit. The program engages students in using models as evidence to develop explanations for how particular species respond to hurricane disturbance. Prior research in education has shown that engaging students in a particular role, like that of a scientist, could have detrimental effects on students’ abilities to transfer what is learned from one context to another. In this research, we sought to understand whether having students engage in authentic scientific practices could support transfer of knowledge to the abstract context of a standards-based assessment. Students were randomly assigned to engage in the program in the role of a scientist or in the role of a student learning about an ecosystem. The dependent variables included students’ comprehension of the background readings, their predictions of population changes, and their overall learning of ecology. The results indicate that taking on a scientist role during the learning activities had an indirect effect on general ecology knowledge by increasing the quality of students’ notetaking during background reading. The results also indicate that students struggled to use their knowledge to develop a robust explanation for how species respond to hurricane disturbance. Journey to El Yunque provides a framework for engaging students in authentic investigations of hurricane disturbance. Future research will examine how to improve the quality of students’ final explanations.
1. Introduction
Hurricane Maria made landfall in Puerto Rico as a category 4 hurricane on 20 September 2017. In the aftermath of the storm, the entire island was without running water, electricity, or communications [1]. In addition to concerns about the recovery of the infrastructure, there was much concern in the media and general public about the ability of the El Yunque National Forest in Puerto Rico to recover [2]. These concerns reveal common misconceptions about the dynamics of forest ecosystems. Seeing pictures of stripped and fallen trees, where once was luscious green forest, led many to believe that the forest was damaged beyond repair.
As the research in this volume suggests, ecologists paint a different picture of the El Yunque National Forest as part of the Luquillo Long-Term Ecological Research (LTER) program in Puerto Rico [3]. Rather than view the rainforest at a particular point in time, disturbance ecologists view the rainforest as a dynamic system that is adapted to being struck by hurricanes on a regular basis. There are a variety of species whose niche is the bright sunlight and abundant debris conditions that exist after a hurricane. These species keep precious nutrients in the forest and form the foundation for recovery.
Understanding the dynamics of complex systems is essential for scientific decision making [4]. Yet, complex systems are not generally taught in school, which has negative consequences for students’ ability to understand what happens when complex systems are impacted by disturbances [5]. Models are an important source of evidence about the dynamic, long-term changes within a system. Using models as evidence to develop an argument about how a system behaves is a complex task with a wide variety of subtasks. These subtasks related to comprehending evidence in relation to ideas, evaluating ideas in relation to evidence, and producing explanations based on evidence are complex and difficult. Most students have trouble with explanation and argumentation across all subject areas [6,7,8,9], but particularly with argumentation and explanation in science [10,11,12,13,14]. For instance, student explanations often focus on a single major cause to explain the scientific phenomena in question (i.e., lack completeness), while ignoring enabling and mediating factors (i.e., lack coherence) [15,16,17]. This difficulty with scientific explanation and argumentation is especially prevalent for phenomena that extend over large temporal and spatial scales, since students cannot directly experience the magnitude of the phenomena (e.g., climate, ecosystems) and the phenomena require the use of abstract models and textual descriptions to construct explanations and arguments [18].
We define a causal explanation as stating how one or more factors lead to the to-be-explained phenomenon through one or more intermediate processes, mechanisms or states [19,20]. When learning about a new topic in the science classroom, knowledge of potential explanations will generally come from reading texts or class instruction. This is not too different from how scientists learn about scientific phenomena by reading the work of other scientists [21,22,23]. We define scientific argumentation as the process of evaluating scientific explanations, weighing evidence and justifying conclusions. Students can provide evidence for an assertion that is both appropriate and sufficient. This process of scientific explanation is frequently instantiated in classroom settings as a Claim-Evidence-Reasoning framework [24]. Scientists generally gather evidence to support explanations from four sources: direct observations, empirical output from a model or simulation, experimental findings from scientific texts, and statements from experts or texts [22,23]. Students need to know the valid types of support in a given discipline and to practice using each of these sources [11,25,26]. Indeed, it is sometimes difficult to distinguish explanation and argumentation in scientific writings, but like Osborne and Patterson [20], we believe such a distinction is essential.
A key characteristic of our approach is placing students in the role of a scientist to develop an argument about the impact of hurricane disturbance on the El Yunque rainforest. Prior research has shown that having students take on roles related to the content discipline can have positive benefits for both motivation and learning (see [27] for a review). However, interventions designed to place students in specific roles have implications for the level of abstraction that is optimal for transfer. Son and Goldstone [28] found that taking a perspective that focused individuals on features of the particular context, which were unnecessary for understanding the primary concepts to be learned, decreased transfer. For example, in a study in which participants learned about signal detection theory, some were asked to take on the role of a doctor in order to explore signal detection theory in the context of a medical test. Learners who took on this role performed more poorly than those who did not take on a particular role. Likewise, contexts that are rich in detail can provide motivational benefits for students but could also focus student attention on seductive details that are less relevant for learning the primary concepts [29]. If the concrete situation only presents superficial similarity to the important concepts to be learned, transfer is hindered [30]. These studies present a dilemma. It is possible that although authentic experiences in science might promote involvement in science, they might also undermine the more general scientific principles that are intended to be learned.
While there is an abundance of literature that provides empirical support for learning principles related to role playing and using evidence to model complex systems, such as reading to learn, modeling, data analysis, explanation, and evaluating arguments, less work has been done on bringing these principles together to guide the development of units [31]. In this paper, we describe one attempt to bring these learning principles together to develop and study the Journey to El Yunque program, a middle school curriculum unit that places students in the role of a scientist and develops their ability to use modeling to construct explanations about the process of hurricane disturbance and recovery.
In order to test whether engaging students in the role of scientist can help students learn about the dynamics of complex systems like hurricane disturbance, we manipulated the role that students were asked to take while engaging with the Journey to El Yunque program. Students were randomly assigned to take on the role of a scientist or take on an explicit role of a student. Students assigned to the scientist role were prompted to think as a scientist and to focus on explaining how the species respond to a hurricane disturbance. Those who were assigned to the control condition took on the explicit role of a student and were prompted to think about learning specific content ideas as expressed by the middle school Illinois Learning Standards. It is typical for school management approaches to recommend that teachers provide students with explicit learning goals related to the standards. Students in each condition conducted the same set of exercises in Journey to El Yunque, but their purpose for doing so was based on the role they were assigned.
1.1. Journey to El Yunque
Journey to El Yunque (http://elyunque.net) is a web-based curriculum unit that aims to improve middle school students’ understanding of the dynamics of disturbance and recovery after severe hurricanes (for a detailed description of the program, see [18]). The program exposes students to the authentic research practices of ecologists in the Luquillo LTER. The research surrounding the recovery of species from these disturbances provides a rich example of basic ecosystem processes at work.
Journey to El Yunque engages students in the same problems that researchers in Luquillo are investigating. The program consists of five modules that support the overarching goal of investigating what will happen to the rainforest if severe hurricanes strike the rainforest more frequently, as suggested by climate models (see Figure 1). In the program, students learn about the historical patterns of hurricane frequency and damage in El Yunque, investigate what happened to the producers and consumers in El Yunque after Hurricane Hugo (1988), explore the impact of a hurricane on an entire food chain, and investigate how the cycles of water, carbon, and nitrogen resources are altered by hurricane disturbance.
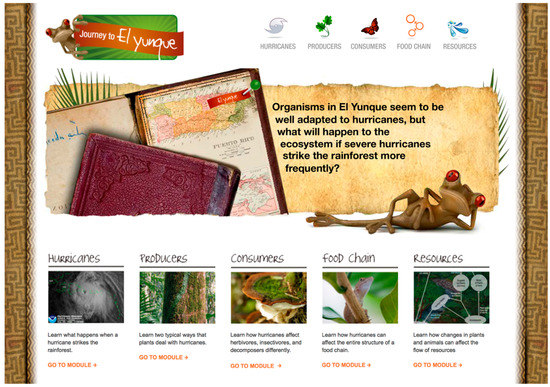
Figure 1.
Screenshot of the main page of Journey to El Yunque.
The background readings in this study come from the module on consumers. Prior to engaging in modeling activities, students are presented with background readings about the life history of each species. The program introduces students to six consumer species that are representative of the types of hurricane responses researchers have found in El Yunque [32]. There are two decomposers (mushrooms and snails), two primary consumers (caterpillars and walkingsticks), and two secondary consumers (anole and coquí). As part of the investigation cycle (see Figure 2), students read about the life history of their assigned consumer, make a prediction about the population dynamics after Hurricane Hugo, and explore a model of population dynamics to explain what happened to their species after Hurricane Hugo.
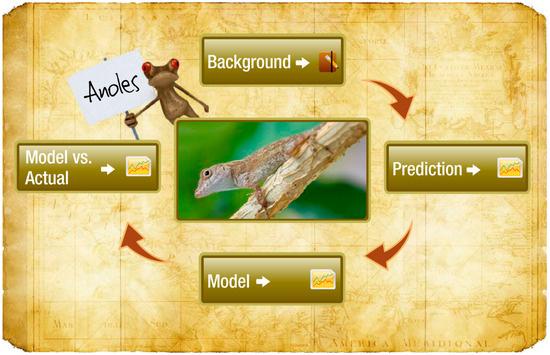
Figure 2.
Screenshot of the investigation cycle for the anole in Journey to El Yunque. All of the consumer species in Journey to El Yunque have the same set of steps.
When investigating population dynamics after a disturbance, scientists in El Yunque typically consider changes to five primary limiting factors for a given species: access to prey, avoidance of predators, direct mortality from the hurricane, and suitability to changes in environmental conditions, in particular drought conditions and the influx of forest debris from the hurricane. Each species has five background readings focused on providing the life history of each limiting factor. Each of the readings is around 500 words in length and written at a 5th grade reading level. Given the average reading fluency of a middle school student, it is expected that students would be able to complete all five readings in about 20 min. While the students are reading, they are provided with a notetaking template that provides boxes for students to take notes on what they learn about the life history of the species related to each of the limiting factors.
After completing the background readings, students are asked to predict the graph of the population of the species over the 5-year period following Hurricane Hugo. Figure 3 shows the process of making a prediction for the anole. Students are presented with a blank graph. Using the mouse, students click and drag within the graph to draw a blue line representing their prediction about the population levels of the anole in each month for 60 months. On their worksheet, students use their reading notes to provide a justification for their prediction. After writing their justification, they click on Test Prediction to see an orange graph of the interpolated population data that was collected by scientists after Hurricane Hugo. Students are given the opportunity to generate hypotheses about the factors that may explain the graph of the anole population.
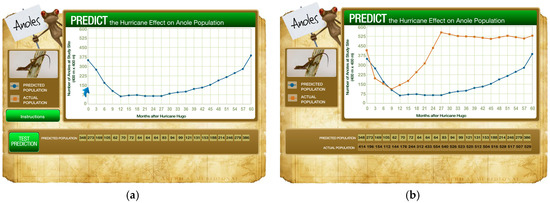
Figure 3.
Screenshots of the process of making a prediction. (a) The student has drawn out a prediction of the anole population numbers each month for 60 months. (b) The student has clicked on Test Prediction to see a graph of the interpolated population numbers collected by Luquillo scientists after Hurricane Hugo.
In order to support students in exploring the factors that affect population dynamics, Zimmerman developed computational models for each of the species in Journey to El Yunque using the Stella modeling software. He started each model by identifying a basic ecological model in Hannon and Ruth [33] that had similar characteristics to the targeted species. He then synthesized the relevant LTER literature about the target species to develop estimates of the parameters related to the limiting factors. For example, the loss of canopy created competition for the ground dwelling A. gundlachi as the canopy dwelling A. stratulus were forced to live on the forest floor. As the canopy recovered, the A. stratulus were able to return to the canopy thus reducing competition. In addition, the increase in ground cover from the increased exposure to direct sunlight brought an increase in the availability of insects, which are a primary food source for the anole. Figure 4 shows screenshots of the process of modeling. The first image shows a model run using the default parameters. The blue model output line remains stable and does not provide an approximation of the population dynamics after a hurricane, represented by the orange line. In the second image, the student altered the canopy parameter to simulate the complete loss of canopy and the gradual recovery. In addition, the student increased the input of prey to the system. The model output provides an approximation of the same actual data that appeared in the prediction activity. Students are expected to use their notes from the background readings and the evidence from the model to develop a scientific argument about the factors that might explain the dynamics of the anole population after a hurricane.
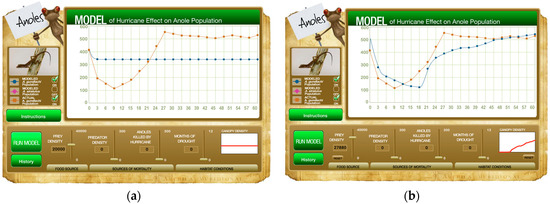
Figure 4.
Screenshots of the process of modeling population data. (a) The student has run the model without changing any of the input parameters. (b) The student has increased the availability of prey and has drawn the canopy to reflect the total loss of canopy after the hurricane and gradual return over a 5-year period.
1.2. Placing Students in the Role of Scientist
A key characteristic of the Journey to El Yunque program is placing students in the role of a scientist. There are a variety of programs that take a similar approach e.g., [27,34,35]. These experiences are made possible because scientists in federal agencies, academic settings, corporations, and nonprofit organizations have made a vast array of scientific resources available to K–12 educators. Across the network of 28 LTER sites, of which Luquillo is a part, each site receives funding to support students to engage in schoolyard research modeled after the research conducted at each LTER site (http://schoolyard.lternet.edu/). The assumption underlying all of these scientific experiences is that the process of engaging students as scientists is exciting for students and that exposing students to these disciplinary experiences will increase student involvement in tasks [36], interest in and identity with science [37,38] and lead to higher learning outcomes [39].
In the case of Journey to El Yunque, we used the cognitive apprenticeship framework, developed by Collins, Brown, and Newman [40], to guide the development of the program. The cognitive apprenticeship model has been used across a variety of disciplines (see [41] for a review). It uses traditional forms of apprenticeship as a starting point and applies those structures to fields of work that are primarily cognitive in nature, such as scientific inquiry. The model encompasses four primary components—content, method, sociology, and sequencing. These components address what content should be taught, the manner in which students should interact with the content, how the classroom should be organized, and how that content should be organized. The design of Journey to El Yunque addresses all four components of the cognitive apprenticeship model. At the heart of the cognitive apprenticeship model is a community of practice to whom the students are apprenticing. In the case of this project, the community of practice is comprised of the Luquillo ecologists who are studying the impact of hurricane disturbance on El Yunque. For this research, we address three of the four components of the framework: content, method, and sociology. Since this study focuses on one module within Journey to El Yunque, it does not involve the sequencing dimensions of cognitive apprenticeship. In this section, we discuss which parts of these three components were addressed in this research.
1.2.1. Cognitive Apprenticeship—Content
The cognitive apprenticeship framework differentiates content into four types of knowledge and strategies that comprise expertise in a subject area: domain knowledge, heuristic strategies, control strategies, and learning strategies. These types of content serve as the range of learning goals that a curriculum can have. In this study, we focus on domain and heuristic knowledge.
Domain Knowledge
Domain knowledge consists of the facts, concepts, and procedures explicitly identified as part of the subject area. In general, educational standards documents provide a good source for explicating the domain knowledge. For example, Journey to El Yunque addresses the major middle-school ecology domain knowledge standards that were recommended at the time by U.S. national standards (In the United States, each state determines the educational standards for their students. The national standards in the United States provide a national consensus from the scientific and educational community. Many states develop their state standards based on the national standards.) [42]. Ecology domain knowledge was measured as a learning outcome in the study.
Heuristic Strategies
Heuristic strategies describe the “rules of thumb” or problem-solving techniques used by experts in solving problems. These are developed through experience in the field and are usually tacit. There are five primary limiting factors that ecologists in El Yunque typically examine in relation to population dynamics after a hurricane disturbance—(a) access to prey, (a) avoidance of predators, (c) direct mortality from the hurricane, and environmental conditions related to (d) water and (e) debris. Students use these primary limiting factors to generate explanations of changes in population after the hurricane.
1.2.2. Cognitive Apprenticeship—Method
The cognitive apprenticeship model describes six general instructional methods that taken together comprise the cognitive apprenticeship approach: scaffolding, exploration, articulation, reflection, instructional modeling and coaching. The Journey to El Yunque program includes design features to support all six methods. In this study, we focus on scaffolding, exploration, and articulation.
Scaffolding
The cognitive apprenticeship model recommends that teachers pose complex problems just beyond students’ abilities, and then provide students with scaffolding supports so that students are successful in completing the complex problems [43,44]. Gallimore and Tharp [45] discuss cognitive structuring as one of the basic forms of scaffolding. Any assistance related to structuring a task, such as task instructions and worksheets, would be considered cognitive structuring. Providing cognitive structuring during extended problem-based learning experiences helps students maintain interest and keeps their focus on content goals rather than project management [46]. In this study, we provided cognitive structuring scaffolds to support students in learning about the effects of hurricane disturbance on population dynamics.
Exploration
The cognitive apprenticeship framework recommends that scaffolding be balanced with opportunities for exploration. There are two types of exploration that students engaged in during the study. First is free choice reading. Students were able to freely explore readings about the species in Luquillo. Second is scientific modeling. Students were able to explore the relationship between the heuristic factors and population dynamics.
Articulation
The cognitive apprenticeship framework states that it is important for students to articulate their understanding throughout the problem-solving process [47,48]. Student articulation supports learning since students need to reorganize their thoughts to present them to someone else [49]. In addition, when students make their thinking visible through articulation, teachers can provide students with feedback. Throughout the reading and modeling activities, student articulation of ideas was meant to help them learn from the experience as well as serve as assessment data.
1.2.3. Cognitive Apprenticeship—Sociology
The sociology dimension serves an important role in the framework by bringing together a cohesive perspective that underlies the collection of methods and sequencing. There are four characteristics in the sociology dimension: situated learning, intrinsic motivation, classroom community of practice, and exploit cooperation. In this study, we focused upon situated learning and intrinsic motivation. As will be discussed below, the study design necessitated that students complete the tasks individually. In normal classroom implementations, teachers take advantage of the classroom community to support cooperation and learning.
Situated Learning
The theoretical notion of situated learning suggests that students should engage in investigations that reflect the contexts in which they use their knowledge [50]. Journey to El Yunque engages students in investigations that are set in the context of El Yunque research, therefore, students’ participation reflects situated learning.
Intrinsic motivation
Intrinsic motivation occurs when students perform tasks because they are related to their own goals [51]. Journey to El Yunque is designed to present the phenomenon of disturbance as puzzling for students. In particular, the strategy of engaging students in prediction and providing them the results leads to natural curiosity when the results do not match the prediction [52].
2. Materials and Methods
2.1. Design
The study used a within-classroom, blocked randomized experimental design in which students within a class were randomly assigned to one of two levels of task role (either junior scientist or student). The students were blocked based on gender, race/ethnicity, ecology knowledge and interest prior to the random assignment. The study was conducted across six consecutive days during students’ science classes. The first and last days were reserved for collecting pre- and post-measures, leaving four days for the intervention itself. The dependent variables focused on in this article included students’ comprehension of the articles, their predictions of population changes, and their overall learning of ecology.
The manipulation of task role was designed to encourage students to take the role of a student (i.e., their typical role) or to take on the perspective of junior scientist. The role of student was designed to focus students on learning specific ecology concepts, consistent with a standards-based approach. The role of junior scientist was designed to focus students on the use of scientific practices to explain phenomena in the world. A focus on the use of scientific practices is a core tenet of the updated U.S. national standards known as the Next Generation Science Standards [53]. At each school, the study took place either in a computer lab or on laptops in the science classroom. The students worked individually on a computer with headphones. A researcher was present in the classroom during the intervention to monitor the implementation of the study. The manipulation was embedded into the online learning environment which made it possible to assign different roles to students in the same class and to control for teacher effects. The task instructions were provided in writing on the computer screen and they were narrated aloud. Since the students were wearing headphones, it was possible for students sitting next to each to be in different experimental conditions.
The instructions for each role were embedded in several places in order to strengthen the manipulation. Table 1 shows the introductory instructions for each condition. The bolded words highlight the key differences between the conditions. In the student condition, the instructions focus participants’ attention on general concepts related to ecology. In contrast, the instructions for the junior scientist condition focus participants’ attention on the specific species (coquí or anole), specific environment (El Yunque), and specific changes (hurricane). Messages that were specific to each condition were also conveyed in terms of their purpose of reading, the task for the day, and what they could expect to gain from the task. The instructions were presented to students in written form. The instructions were also read aloud to the students. At the end of the set of two days, students were asked to describe what they did in order to check whether students adopted different roles. The responses were coded for their level of concreteness (associated with the scientist role) or abstractness (associated with the student role). Students in the scientist role described their activities using more specificity in the content of what they were learning, which provides evidence that participants adopted their respective roles.

Table 1.
Introductory instructions for each of the experimental conditions.
The four days of instruction were organized such that students spent the first two days learning about the first species (i.e., coquí) and the second two days learning about the other species (i.e., anole). All students studied the same two species. They had access to five readings for each of the two species. While reading, the students took notes and summarized their notes. The online system tracked how long students spent on each reading. On the second day for a given species, the students were asked to summarize the key ideas from the prior day’s readings. They then made a prediction about the effects of hurricanes on the population of the targeted species and manipulated a model to use as evidence in an explanation of what happened to that species in the aftermath of the hurricane.
2.2. Participants
The sample included 476 seventh grade students from 8 urban and suburban elementary schools in the Chicago metropolitan area. Given the documented differences in general science assessment performance by race and gender in the United States [54], it was important for us to block on race and gender in the process of random assignment to ensure that the distribution of students by race and gender was equivalent across the two conditions. We, therefore, asked students to voluntarily report their race and gender. Of the 468 students who reported demographic information, 54% identified themselves as females. The sample included students who identified as Asian (1%), African American (13%), Caucasian (36%), and Hispanic (49%). Another 2% indicated that their race/ethnicity was different from the categories provided. Using a Chi-square statistic, there were no statistically significant differences in the distribution of students across conditions by race/ethnicity or gender. All parents of the students gave their informed consent and subjects gave their assent for inclusion before they participated in the study. Students who did not give assent or whose parents did not provide informed consent still engaged in the learning activities, but their data were not retained. The study was conducted in accordance with the Declaration of Helsinki, and the protocol was approved by the Ethics Committee of Northern Illinois University.
2.3. Measures
The focal outcome measures included students’ knowledge of ecology after the instruction, their comprehension of the readings, and the extent to which their predictions incorporated key ideas from the background readings. These measures were acquired at different times during the learning tasks, which made it possible to track students’ learning through the sequence of activities. We also measured ecology knowledge and reading fluency prior to the manipulation (i.e., pretest) in order to use as covariates.
Test of General Ecology Knowledge. A measure of general ecology knowledge was developed during a prior summative evaluation of the program [55]. This assessment is comprised of publicly released state test questions in ecology that mimic the kinds of performance expected of students on standards-based state exams. The assessment contained 14 multiple-choice questions and one constructed response task. The assessment was administered as a pretest and posttest. Students’ responses were scaled using Rasch modeling. The scale ranges from 0 to 25 points. Using latent variable modeling, the reliability was determined to be 0.87.
Percent of Articles Read. In order to control for the amount of content that students were exposed to, we estimated the percent of the total available readings that students read. During the reading activities, the online environment tracked how long students spent reading the background materials. We computed an estimate of the percent of each article that was read by multiplying a students’ reading fluency (words per minute) times the number of minutes spent reading each article divided by the number of words in each article. We averaged the percent read for all five articles across each of the two species. As a measure of initial reading fluency, we used two middle-school MAZE assessments. Each form takes around 3-min. MAZE assessments have a reliability of 0.80 and show correlations over 0.70 with longer reading test forms [56].
Reading Notes. While reading, students were encouraged to take notes using a notetaking template that contained rows for each of the limiting factors the students were reading about. Students could organize their notetaking by the writing about each limiting factor in the appropriate row. The reading notes were scored for the presence of key ideas from each of the readings and divided by the total number of key ideas possible. The Reading Notes score for each species was averaged to create an overall score.
Reading Summaries. After the students finished reading and taking notes on the first day, we asked them to summarize the main limiting factors that affect the population. Students could use their notes to create answers. At the beginning of the second day for each species, we asked students to again summarize the main limiting factors that affect the species. They could use their notes for their response. The summaries were scored for the presence of key ideas about each limiting factor and divided by the total number of key ideas possible. The Reading Summary Scores were averaged across the two scores for each species and across the two species.
Prediction Justifications. After the students drew their initial prediction about what will happen to each species after a hurricane (see Figure 3), they provided a justification of how the limiting factors influence the population changes over time. After the students tested their prediction, we asked them to develop hypotheses about how the limiting factors shape the population after a hurricane. The responses were scored for the extent to which the students’ explanations of the influence of each limiting factor was consistent with the directionality of the graph. The students’ prediction score and hypothesis score were averaged within a species and then averaged across species.
Modeling Explanations. After students completed their prediction, they engaged in modeling of the influence of the limiting factors on the population of each species (see Figure 4). We did not score the students’ final explanations from the modeling tasks. A review of the student responses revealed a floor effect in the quality of responses that would not have provided sufficient variation for statistical analysis. The quality of student responses to the modeling task will be discussed in the discussion section.
2.4. Data Preparation
Scoring of Student Responses. While reading, predicting, and modeling, students took notes and responded to academic prompts. We developed an outline of the key idea units related to each limiting factor as they are described in the background readings. We scored the prevalence of key ideas in the notes students took, summaries of the readings, and justification for their predictions. Two independent scorers coded for the presence or absence of idea units related to each limiting factor for each species. Coding discrepancies were identified and discussed with a third rater to reach consensus. The overall inter-rater reliability of the two independent ratings prior to discussion was 92% agreement and 0.82 using Kohen’s Kappa, which adjusts for chance agreement. We computed the percentage of limiting factors that were referenced and then averaged the percentages across the limiting factors to come up with an overall score for the notes, summaries, and predictions.
Missing Data. Studies in educational settings almost always have missing data. A frequent source of missing data is student absence on the day that assessments or surveys are administered. A straightforward, intuitive approach to analyzing datasets with missing data is to delete students with missing data and only analyze students from whom the researchers have a complete dataset [57]. However, this approach can be problematic if the source of missing data is correlated with outcome variables, as is often the case with absences and outcome measures. Instead, Baraldi & Enders [57] advocate for a more robust approach using multiple imputation. For missing data within a day that students were present, we employed a multiple imputation technique to estimate values for missing data on process and outcome variables. The analyses in the results section represent pooled outcomes based on the results of five versions of multiply imputed data. Table 2 provides the pooled descriptive statistics of the multiply imputed data for the variables that will be included in the regression models.
Table 2.
Descriptive statistics for the variables used in the regression models.
3. Results
In order to investigate the extent to which the role which students adopted affected the quality of their responses to the learning tasks and their knowledge of ecology, we developed a series of models to first test the increase in ecology from pretest to posttest and then test the experimental manipulation on the quality of responses to the academic prompts and the posttest. The average pretest score was 13.2 out of 25 and the average posttest score was 13.5 for an increase of three-tenths of a point. We used a one-tailed, paired t-test to determine that this increase was statistically significant (t (162) = 1.89, p = 0.03) with a small effect size of 0.07, adjusted for the correlation between the pretest and posttest.
In the next set of models presented in Table 3, we used multiple regression to investigate the extent to which a students’ role predicted the quality of students’ notes, reading summaries, and predictions as well as posttest outcomes. We also investigated the extent to which the quality of student responses to a task predicted the quality of responses to subsequent tasks. All four models controlled for prior ecology knowledge and content exposure, expressed as the estimation for the percent of content that students read in the background readings. All of the independent variables were centered around the overall average. Table 3 shows the results of these regression models. All four models were statistically significant. In the first model, the student role did not directly predict student posttest scores. After controlling for prior knowledge and exposure to content, the only factor that predicted posttest scores was the quality of student notes. In the second model, we examined the quality of students’ justification of their prediction as an outcome measure. The student role did not directly predict the quality of students’ justification of their prediction. After controlling for prior knowledge and exposure to content, the only factor that predicted quality of students’ justification of their prediction was the quality of their summary of the readings. In the third model, both the student role and quality of notetaking predicted the quality of reading summaries, after controlling for prior knowledge and exposure to content. Students who were assigned to the role of scientist had slightly higher quality reading summaries. In the fourth model, the student role predicted the quality of notetaking, after controlling for prior knowledge and exposure to content.
Table 3.
Regression results for four models examining the direct and indirect influence of student role on the quality of responses to academic prompts and posttest outcomes. The reported coefficients are unstandardized with standard errors in parentheses. Statistically significant coefficients are presented in bold.
4. Discussion
The results indicate that taking on a scientist role did not have a direct correlation with the two primary outcome measures of this study—posttest scores and quality of justification of prediction. However, taking on a scientist role had an indirect effect on those outcomes through the direct effect of role on the quality of student notetaking and the quality of student summaries of the readings. Figure 5 shows a summary of these regression results. Over the course of a short 4-day intervention, the average performance on the posttest increased a small amount (0.3) over the average performance on the pretest. It is important to bear in mind that the assessment addresses content that is usually covered over a 4-week period in a typical middle school life science classroom. Therefore, even a small statistically significant effect from such as short intervention is an important outcome. In order to place the indirect effect of the scientist role on posttest outcomes in context, we estimated the indirect effect by multiplying the 0.03 increase in notetaking score due to scientist role by the 4.68 coefficient for the influence of notetaking on posttest performance. The combined effect of scientist role and quality of notetaking is 0.14, which is equivalent to 47% of the pretest to posttest increase in general ecology content. These results run counter to the results of prior research [28,29,30]. In those studies, students who took on a concrete role were less likely to transfer their understanding to a different context. These results suggest that students who take on the authentic role of a scientist, which is congruent with the task of explaining a complex phenomenon, were more likely to transfer their understanding to the abstract context of a standards-based assessment. These results are particularly noteworthy since the only manipulation was the manner in which the tasks were introduced. The students in each condition still engaged in the same set of activities. In reality, typical standards-based instruction does not involve investigations of a coherent phenomenon. Instead, it typically involves studies of disconnected phenomena. These results suggest that there may be an even greater disparity in outcomes between an authentic, coherent experience like Journey to El Yunque and the typical disconnected set of experiences in a standards-based approach.
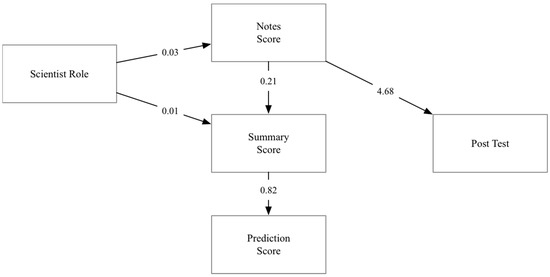
Figure 5.
Causal diagram of the direct effect of scientist role on the quality of student notetaking and reading summaries and the subsequent indirect effects on posttest outcomes and quality of justification of student predictions. The relationships between the variables are represented by the unstandardized regression coefficients.
An important part of the Journey to El Yunque experience is the use of models of population dynamics as evidence to explain the response of particular species to the changed environment after a hurricane disturbance. While the students were routinely able to set the starting conditions for the model parameters to achieve a model output that approximated the actual data, the quality of their use of these input parameters as evidence for an explanation was low overall. The literature on modeling and argumentation in education provides recommendations on potential future scaffolds that could benefit students in a future implementation of Journey to El Yunque. First, students need to be able to record evidence in a manner that will guide them to developing their explanation. In the case of Journey to El Yunque, students record their evidence from the readings in a table organized by limiting factors. However, this representation may not be sufficient for supporting students to see the connections between the factors. Alternative ways of representing evidence may be beneficial. For example, causal model diagrams have been used successfully in the past to organize evidence [58,59,60]. Second, more support needs to be provided around the development of the scientific practice of explanation and argumentation. For example, there have been a wide variety of instructional supports developed to support the evaluation of scientific arguments e.g., [9]. Third, evidence-based modeling and scientific argumentation are not tasks that can be successfully accomplished by following a recipe. Students need to develop a task model to understand the reason why they are engaged in a particular task and how that task will contribute to the primary goal of explanation e.g., [61,62]. The task model is important for helping students carry important information from one task to the next. It is important to present task instructions to activate appropriate schema [17,63,64]. Providing explicit support for the development of the task model through task model framing would be an important future scaffold. In future research, we intend to explore how these additional scaffolds can improve the quality of students’ final explanation using the Journey to El Yunque models as evidence.
5. Conclusions
Hurricane disturbances are a common occurrence along the Atlantic and Caribbean coasts and territories in the United States. The research articles in this volume represent the cutting edge for the field’s understanding of the response of ecosystems to such disturbances. These articles are crucial for the general public to understand how to manage natural and human systems in the face of potentially increased frequency of severe hurricanes. The Journey to El Yunque program represents one approach for using the scientific results of research on hurricane disturbance as a context for engaging students in authentic inquiry about the impact of hurricane disturbance on ecosystems. The cognitive apprenticeship model guided the development of the program to engage students in the authentic practices of a community of practice such as the Luquillo ecologists. A key component of the cognitive apprenticeship model is taking on the explicit role of a scientist while developing explanations of species responses to a hurricane disturbance. The results of our research suggest that taking on an authentic role has benefits for identifying important content ideas from background readings and transferring that knowledge to an assessment of general knowledge of ecology as well as applying that knowledge as justification for a prediction of how a species might respond to a hurricane disturbance. Future research will expand on these results to enhance the way in which the Journey to El Yunque program supports students in developing evidence-based explanations of the response of ecosystems to hurricane disturbances.
Author Contributions
Conceptualization, S.M., A.M.D., J.K.Z. and R.M.-T.; Data curation, J.D.; Formal analysis, S.M. and A.M.D.; Funding acquisition, S.M. and A.M.D.; Methodology, S.M., A.M.D., R.M.-T. and J.D.; Project administration, S.M. and R.M.-T.; Resources, S.M.; Software, J.K.Z.; Supervision, S.M.; Validation, S.M., A.M.D. and J.D.; Visualization, S.M.; Writing—original draft, S.M. and A.M.D.; Writing—review & editing, J.K.Z. and R.M.-T.
Funding
This research and development project on Journey to El Yunque was supported by grants DRL-9908438 from the National Science Foundation to the NASA Classroom of the Future, DRL-0535942, DRL-1813802 from the National Science Foundation to The Learning Partnership, and R305A110810 from the Institute of Education Sciences, U.S. Department of Education to The Learning Partnership. The development of Journey to El Yunque was also supported by grants BSR-8811902, DEB-9411973, DEB-OO8538, DEB-0218039 from the National Science Foundation to the Institute of Tropical Ecosystem Studies (IEET), University of Puerto Rico, and the International Institute of Tropical Forestry (IITF) as part of the Long-Term Ecological Research Program in the Luquillo Experimental Forest. Additional support was provided by the Forest Service (U.S. Department of Agriculture) and the University of Puerto Rico. Any opinions, findings, and conclusions or recommendations expressed in this material are those of the authors and do not necessarily reflect the views of the National Science Foundation, U.S. Department of Agriculture, the Institute of Education Sciences or the U.S. Department of Education.
Acknowledgments
The authors would like to thank Taylor White for her assistance in data collection, the teachers, students, and technology coordinators at participating schools, and FUSE IQ for their support in the development of the technology for the study. The authors would also like to thank Anne Britt for her advice on framing the use of argumentation and explanation in Journey to El Yunque.
Conflicts of Interest
The authors declare no conflict of interest. The funders had no role in the design of the study; in the collection, analyses, or interpretation of data; in the writing of the manuscript, or in the decision to publish the results.
References
- Resnick, B.; Barclay, E. What Every American Needs to Know about Puerto Rico’s Hurricane Disaster. Available online: https://www.vox.com/science-and-health/2017/9/26/16365994/hurricane-maria-2017-puerto-rico-san-juan-humanitarian-disaster-electricty-fuel-flights-facts (accessed on 17 October 2017).
- Ferré-Sadurní, L. Another Victim of Hurricane Maria: Puerto Rico’s Treasured Rainforest, The New York Times. Available online: https://www.nytimes.com/2017/10/11/us/another-victim-of-hurricane-maria-puerto-ricos-treasured-rainforest.html (accessed on 11 October 2017).
- Brokaw, N.; Crowl, T.; Lugo, A.E.; Mcdowell, W.; Scatena, F.N.; Waide, R.B.; Willig, M. A Caribbean Forestry Tapestry; Oxford University Press: Oxford, UK, 2012. [Google Scholar]
- Jacobson, M.J.; Wilensky, U. Complex Systems in Education: Scientific and Educational Importance and Implications for the Learning Sciences. J. Learn. Sci. 2006, 15, 11–34. [Google Scholar] [CrossRef]
- Liu, L.; Hmelo-Silver, C.E. Promoting complex systems learning through the use of conceptual representations in hypermedia. J. Res. Sci. Teach. 2009, 46, 1023–1040. [Google Scholar] [CrossRef]
- Chambliss, M.J.; Murphy, P.K. Fourth and fifth graders representing the argument structure in written texts. Discourse Process. 2002, 34, 91–115. [Google Scholar] [CrossRef]
- Kuhn, D. The skills of Argument; Cambridge University Press: Cambridge, UK, 1991. [Google Scholar]
- Larson, A.A.; Britt, M.A.; Kurby, C.A. Improving Students’ Evaluation of Informal Arguments. J. Exp. Educ. 2009, 77, 339–366. [Google Scholar] [CrossRef] [PubMed]
- Newell, G.E.; Beach, R.; Smith, J.; Vanderheide, J. Teaching and learning argumentative reading and writing: A review of research. Read. Res. Q. 2011, 46, 273–304. [Google Scholar]
- Duschl, R.; Osborne, J. Supporting and promoting argumentation discourse in science education. Stud. Sci. Educ. 2002, 38, 39–72. [Google Scholar] [CrossRef]
- Goldman, S.R.; Britt, M.; Brown, W.; Cribb, G.; George, M.; Greenleaf, C.; Shanahan, C.; Project READI. A conceptual framework for disciplinary literacy. Educ. Psychol. 2016, 51, 219–246. [Google Scholar] [CrossRef]
- Hughes, S.; Hastings, P.; Britt, M.A.; Wallace, P.; Blaum, D. Machine Learning for Holistic Evaluation of Scientific Essays. In Artificial Intelligence in Education; Springer: Berlin, Germany, 2015; pp. 165–175. [Google Scholar]
- Kelly, G.J.; Druker, S.; Chen, C. Students’ reasoning about electricity: Combining performance assessments with argumentation analysis. Int. J. Sci. Educ. 1998, 20, 849–871. [Google Scholar] [CrossRef]
- Osborne, J.; Erduran, S.; Simon, S. Enhancing the quality of argumentation in science classrooms. J. Res. Sci. Teach. 2004, 41, 994–1020. [Google Scholar] [CrossRef]
- Griffin, T.D.; Wiley, J.; Britt, M.A.; Salas, C. The role of CLEAR thinking in learning science from multiple-document inquiry tasks. Int. Electron. J. Elem. Educ. 2012, 5, 63–78. [Google Scholar]
- Hastings, P.; Hughes, S.; Blaum, D.; Wallace, P.; Britt, M.A. Stratified learning for reducing training set size. In Intelligent Tutoring Systems; Springer International Publishing: Berlin, Germany, 2016; pp. 341–346. [Google Scholar]
- Wiley, J.; Britt, M.A.; Griffin, T.D.; Steffens, B.; Project READi. Approaching reading for understanding from multiple sources in history and science: Initial studies. Presented at the symposium titles: A Framework for Conceptualizing Reading for Understanding: Evidence-Based Argumentation in History, Science, and Literature at the AERA conference, Vancouver, BC, Canada, 27 April–1 June 2012. [Google Scholar]
- McGee, S.; Zimmerman, J.K. Taking students on a Journey to El Yunque. Int. J. Des. Learn. 2016, 7, 86–106. [Google Scholar] [CrossRef]
- Britt, M.A.; Richter, T.; Rouet, J.-F. Scientific Literacy: The role of goal-directed reading and evaluation in understanding scientific information. Educ. Psychol. 2014, 49, 104–122. [Google Scholar] [CrossRef]
- Osborne, J.F.; Patterson, A. Scientific argument and explanation: A necessary distinction? Sci. Educ. 2011, 95, 627–638. [Google Scholar] [CrossRef]
- Chinn, C.A.; Malhotra, B.A. Epistemologically authentic inquiry in schools: A theoretical framework for evaluating inquiry tasks. Sci. Educ. 2002, 86, 175–218. [Google Scholar] [CrossRef]
- Osborne, J. Science without literacy: A ship without a sail? Camb. J. Educ. 2002, 32, 203–218. [Google Scholar] [CrossRef]
- Yager, R.E. Science is not written, but it can be written about. In Crossing Borders in Literacy and Science Instruction; Saul, E.W., Ed.; International Reading Association: Arlington, VA, USA, 2004; pp. 95–108. [Google Scholar]
- McNeill, K.L.; Krajcik, J. Supporting Grade 5–8 Students in Constructing Explanations in Science: The Claim, Evidence, and Reasoning Framework for Talk and Writing; Pearson: Boston, MA, USA, 2012. [Google Scholar]
- Bricker, L.A.; Bell, P. Conceptualizations of argumentation from science studies and the learning sciences and their implications for the practices of science education. Sci. Educ. 2008, 92, 473–498. [Google Scholar] [CrossRef]
- Ryu, S.; Sandoval, W.A. Improvements to elementary children’s epistemic understanding from sustained argumentation. Sci. Educ. 2012, 96, 488–526. [Google Scholar] [CrossRef]
- Hung, W.; Jonassen, D.H.; Liu, R. Problem-based learning. Handb. Res. Educ. Commun. Technol. 2008, 3, 485–506. [Google Scholar]
- Son, J.Y.; Goldstone, R.L. Contextualization in Perspective. Cogn. Instruct. 2009, 27, 51–89. [Google Scholar] [CrossRef]
- Garner, R.; Gillingham, M.G.; White, C.S. Effects of “Seductive Details” on Macroprocessing and Microprocessing in Adults and Children. Cogn. Instruct. 1989, 6, 41–57. [Google Scholar] [CrossRef]
- Goldstone, R.L.; Sakamotob, Y. The transfer of abstract principles governing complex adaptive systems. Cogn. Psychol. 2003, 46, 414–466. [Google Scholar] [CrossRef]
- Koedinger, K.R.; Booth, J.L.; Klahr, D. Instructional complexity and the science to constrain it. Science 2013, 342, 935–937. [Google Scholar] [CrossRef] [PubMed]
- Zimmerman, J.K.; Willig, M.R.; Walker, L.R.; Silver, W.L. Introduction: Disturbance and Caribbean Ecosystems. Biotropica 1996, 28, 414–423. [Google Scholar] [CrossRef]
- Hannon, B.; Ruth, M. Modeling Dynamic Biological Systems; Springer: New York, NY, USA, 1999. [Google Scholar]
- Dohaney, J.; Brogt, E.; Wilson, T.; Kennedy, B. Using Role-Play to Improve Students’ Confidence and Perceptions of Communication in a Simulated Volcanic Crisis. In Observing the Volcano World; Springer: Berlin, Germany, 2017. [Google Scholar]
- Hales, T.; Cashman, K.V. Simulating social and political influences on hazard analysis through a classroom role playing exercise. J. Geosci. Educ. 2008, 56, 54–60. [Google Scholar] [CrossRef]
- Gee, J.P. What Video Games Have to Teach Us about Learning and Literacy; Palgrave Macmillan: New York, NY, USA, 2007. [Google Scholar]
- McGee, S. Looking Beyond Academic Achievement for Inspiring the Next Generation. Presented at the Annual Meeting of the American Educational Research Association, New York, NY, USA, 24–28 March 2008. [Google Scholar]
- McGee, S.; Witers, J. Project-Based Inquiry Science: 2005/2006 Summative Evaluation; The Learning Partnership: Western Springs, IL, USA, 2007. [Google Scholar]
- Bredderman, T. Effects of Activity-based Elementary Science on Student Outcomes: A Quantitative Synthesis. Rev. Educ. Res. 1983, 53, 499–518. [Google Scholar] [CrossRef]
- Collins, A.; Brown, J.S.; Newman, S. Cognitive apprenticeship: Teaching the crafts of reading, writing, and mathematics. In Knowing, Learning, and Instruction: Essays in Honor of Robert Glaser; Resnick, L., Ed.; Lawrence Erlbaum Associates: Hillsdale, NJ, USA, 1989; pp. 453–494. [Google Scholar]
- Dennen, V.P.; Burner, K.J. The cognitive apprenticeship model in educational practice. Handb. Res. Educ. Commun. Technol. 2008, 3, 425–439. [Google Scholar]
- National Research Council. National Science Education Standards; National Academies Press: Washington, DC, USA, 1996. [Google Scholar]
- Quintana, C.; Reiser, B.J.; Davis, E.A.; Krajcik, J.; Fretz, E.; Duncan, R.G.; Soloway, E. A Scaffolding Design Framework for Software to Support Science Inquiry. J. Learn. Sci. 2004, 13, 337–386. [Google Scholar] [CrossRef]
- Vygotsky, L. Thought and Language, 8th ed.; MIT Press: Boston, MA, USA, 1994. [Google Scholar]
- Gallimore, R.; Tharp, R. Teaching mind in society: Teaching, schooling, and literate discourse. In Vygotsky and Education: Instructional Implications and Applications of Socio-Historical Psychology; Moll, L.C., Ed.; Cambridge Press: New York, NY, USA, 1990. [Google Scholar]
- Dennen, V.P. Cognitive Apprenticeship in Educational Practice: Research on Scaffolding, Modeling, Mentoring, and Coaching As Instructional Strategies. In Handbook of Research on Educational Communications and Technology, 2nd ed.; Jonassen, D.H., Ed.; Lawrence Erlbaum Associates: Mahwah, NJ, USA, 2004; pp. 813–828. [Google Scholar]
- Collins, A.; Stevens, A.L. Goals and Strategies of Inquiry Teachers. In Advances in Instructional Psychology; Glaser, R., Ed.; Erlbaum: Hillsdale, NJ, USA, 1982; Volume 2. [Google Scholar]
- Collins, A.; Stevens, A.L. A Cognitive Theory of Interactive Teaching. In Instructional Design Theories and Models: An Overview; Reigeluth, C.M., Ed.; Erlbaum: Hillsdale, NJ, USA, 1983. [Google Scholar]
- Dewey, J. Democracy and Education; Macmillan Company: New York, NY, USA, 1916. [Google Scholar]
- Anderson, J.R.; Simon, H.A.; Reder, L.M. Situated learning and education. Educ. Res. 1996, 25, 5–11. [Google Scholar] [CrossRef]
- Malone, T.W.; Lepper, M.R. Making learning fun: A taxonomy of intrinsic motivations for learning. In Aptitude, Learning, and Instruction; Snow, R.E., Farr, M.J., Eds.; Lawrence Earlbaum Publishers: Mahwah, NJ, USA, 1987; Volume 3, pp. 223–253. [Google Scholar]
- Loewenstein, G. The Psychology of Curiosity: A Review and Reinterpretation. Psychol. Bull. 1994, 116, 75–98. [Google Scholar] [CrossRef]
- NGSS Lead States. Next Generation Science Standards: For States, By States; The National Academies Press: Washington, DC, USA, 2013. [Google Scholar]
- NCES. The Nation’s Report Card: 2015 Science at Grades 4, 8 and 12; National Center for Educational Statistics: Washington, DC, USA, 2016. Available online: https://www.nationsreportcard.gov/science_2015/ (accessed on 11 October 2018).
- DeBarger, A.H.; Haertel, G. Evaluation of Journey to El Yunque; Final Report; SRI International: Menlo Park, CA, USA, 2006; Available online: http://www.lponline.net/papers.html (accessed on 21 October 2018).
- Espin, C.; Wallace, T.; Lembke, E.; Campbell, H.; Long, J.D. Creating a Progress-Monitoring System in Reading for Middle-School Students: Tracking Progress toward Meeting High-Stakes Standards. Learn. Disabil. Res. Pract. 2010, 25, 60–75. [Google Scholar] [CrossRef]
- Baraldi, A.N.; Enders, C.K. An introduction to modern missing data analyses. J. Sch. Psychol. 2010, 48, 5–37. [Google Scholar] [CrossRef] [PubMed]
- Lehrer, R.; Schauble, L. Cultivating Model-Based Reasoning in Science Education; Cambridge University Press: Cambridge, UK, 2006. [Google Scholar]
- McCrudden, M.T.; Schraw, G.; Lehman, S.; Poliquin, A. The effect of causal diagrams on text learning. Contemp. Educ. Psychol. 2007, 32, 367–388. [Google Scholar] [CrossRef]
- van Loon, M.H.; de Bruin, A.B.; van Gog, T.; van Merriënboer, J.J.; Dunlosky, J. Can students evaluate their understanding of cause-and-effect relations? The effects of diagram completion on monitoring accuracy. Acta Psychol. 2014, 151, 143–154. [Google Scholar] [CrossRef] [PubMed]
- Jaeger, A.; Griffin, T.D.; Britt, M.A.; Wiley, J. Making connections: Improving student learning about climate change. Presented at the 25th Annual Meeting of the Society for Text and Discourse, Minneapolis, MN, USA, 6–8 July 2015. [Google Scholar]
- Goldman, S.R.; Greenleaf, C.; Yukhymenko-Lescroart, M.; with Brown, W.; Ko, M.; Emig, J.; George, M.; Wallace, P.; Blum, D.; Britt, M.A.; et al. Explanatory Modeling in Science through Text-Based Investigation: Testing the Efficacy of the READI Intervention Approach. Project READI Technical Report #27. Available online: www.projectreadi.org (accessed on 21 October 2018).
- Kopp, K. Selecting and Using Information from Multiple Documents for Argumentation. Ph.D. Thesis, Northern Illinois University, DeKalb, IL, USA, 2013. [Google Scholar]
- Watson, J.R.; Swain, J.R.L.; McRobbie, C. Students’ discussions in practical scientific inquiries. Int. J. Sci. Educ. 2004, 26, 25–45. [Google Scholar] [CrossRef]
© 2018 by the authors. Licensee MDPI, Basel, Switzerland. This article is an open access article distributed under the terms and conditions of the Creative Commons Attribution (CC BY) license (http://creativecommons.org/licenses/by/4.0/).