Article

Soil Degradation and the Decline of Available Nitrogen and Phosphorus in Soils of the Main Forest Types in the Qinling Mountains of China

1
College of Forestry, Northwest A&F University, Yangling 712100, China
2
School of Natural Resources, University of Missouri, Columbia, MO 65211, USA
3
Qinling National Forest Ecosystem Research Station, Huoditang, Ningshan 711600, China
*
Author to whom correspondence should be addressed.
These authors contributed equally to this work.
Forests 2017, 8(11), 460; https://doi.org/10.3390/f8110460
Submission received: 6 November 2017 / Revised: 15 November 2017 / Accepted: 20 November 2017 / Published: 21 November 2017
(This article belongs to the Special Issue Carbon, Nitrogen and Phosphorus Cycling in Forest Soils)

Abstract

:
Soil degradation has been reported worldwide. To better understand this degradation, we selected Pinus armandii and Quercus aliena var. acuteserrata forests, and a mixed forest of Q. aliena var. acuteserrata and P. armandii in the Qinling Mountains in China for our permanent plots and conducted three investigations over a 20-year period. We determined the amounts of available nitrogen (N) and phosphorus (P) in the soil to track the trajectory of soil quality and compared these with stand characteristics, topographic and climatic attributes to analyze the strength of each factor in influencing the available N and P in the soil. We found that the soil experienced a severe drop in quality, and that degradation is continuing. Temperature is the most critical factor controlling the soil available N, and species composition is the main factor regulating the soil available P. Given the huge gap in content and the increasing rate of nutrients loss, this reduction in soil quality will likely negatively affect ecosystem sustainability.

1. Introduction

Soil degradation is a global threat to land ecosystems [1]. The Qinling Mountains in China are not immune to this global trend [2,3], with an average soil loss of about 42 Mg/ha/y for crop lands and as high as 300 Mg/ha/y for individual fields [4]. The pressure from changing climate and biota population, together with other abiotic, biotic, and political factors, have already resulted in severe soil degradation, which appears to be worsening [5,6,7]. In a forest ecosystem, soil degradation causes trees, shrubs, and herbs to be more vulnerable. Soil degradation may alter the stability of the forest ecosystem due to the progression in vegetation cover, and changes in community diversity and density [8]. Increasing knowledge of soil degradation in forest ecosystems is critical for maintaining these ecosystems.
Soil degradation is defined as the decline in soil quality. Soil nitrogen (N) and phosphorus (P), especially the amounts available for plant uptake, are essential indicators of soil nutrient status [9]. N and P are present in many forms, including inorganic, organic, and particulate forms. Atmospheric N is the main reservoir for N and phosphate is the main reservoir for P, and the majority of these elements are unavailable to most plants. N and P are available to plants as ammonium, nitrate, and phosphate ions, but N and P also exist in complex organic forms and the residue requires several years in soil before N and P are available for plant use [10]. The abundance of soil available N and P can be the determining limitation to plant growth and productivity.
Analyzing the abundance of soil available N and P in forest ecosystems is used to determine plant N and P limitation. N limitation has been reported in many ecosystems, such as grasslands, freshwater systems, and in forest systems [11,12,13]. P limitation and N–P coupled limitation have been repeatedly reported [14,15]. A wide variety of ecosystems have demonstrated the importance of N and P limitation to plants. In forest ecosystems without human interference, changing climate and community population are the most important factors, which affect the soil available N and P. Generally, an increase in temperature will accelerate the decay of soil organic matter, accumulating more soil available nutrients [16]. However, in some regions, with global warming, the available nutrients for plant uptake continue to decrease [17]. The aim of this work was to determine how the soil available N and P are influenced by different factors.
The major objective of this work was to investigate the changes in soil available N and P over time. The Qinling Mountains are a natural boundary between North and South China and support a wide variety of plant and animal life, some of which is found nowhere else on earth. The selected forest plots in the Qinling Mountains can be an ideal choice for study. The goals of this study were to (i) investigate the abundance of soil available N and P in the Qinling Mountains forest system; (ii) to determine the status of the former reported soil degradation in the Qinling Mountains forest system; and (iii) to explore the factors influencing the abundance of soil available N and P.

2. Materials and Methods

2.1. Site Description

This was a long-term, local-scale study, and the experimental platform was based on the Qinling National Forest Ecosystem Research Station and on the Huoditang Experimental Forest of Northwest Agriculture and Forestry University, Shaanxi Province, China, with a total area of 2037 ha. The study area is located at 33°18′–33°28′ N and 108°21′–108°39′ E. The altitude is 800–2500 m, with a mean annual precipitation of 900–1200 mm, and a mean annual temperature of 8–10 °C. The frost-free period is 170 days, and the climate is categorized as warm temperate. The topography mainly consists of granite and gneiss, with a 35° mean slope. The soils of the region are acidic and the soil units are Cambisols, Umbrisols and Podzols. Most forests are secondary natural forests with a mean age of 60 years comprising several age classes. The study forests underwent intensive selective logging in the 1960s and 1970s, but since then, no significant anthropogenic disturbances have occurred, except for lacquer tree tapping and occasional illegal tree felling. Since a natural forest protection project was initiated in 1998, anthropogenic disturbances of any kind have been absent in the region.
Pinus armandii and Quercus aliena var. acuteserrata are the most widely distributed and dominant tree species in the study area. A total of 18 forest plots were chosen with characteristics shown in Table 1, cited from Yuan [18]. Six were P. armandii and Q. aliena var. acutiserrata mixed species-dominated forest sample plots, and six were pure single species-dominated forest sample plots of each of these two species. In this study, the investigated forests were natural secondary forests, all 40 years old in 1996. The P. armandii forest was dominated by P. armandii, with a forest canopy density of 65%. The mean stand height and diameter at breast height (DBH) were 14 m and 21 cm, respectively. The Q. aliena var. acuteserrata forest was dominated by Q. aliena var. acuteserrata, with a forest canopy density of 75%. The mean stand height and DBH were 12 m and 18 cm, respectively. In the shrub layer, height varied from 45 cm to 650 cm, and the percent cover was 25%. The mixed forest was dominated by Q. aliena var. acuteserrata (40% of the trees) and P. armandii (50% of the trees), with a forest canopy density of 70%. The mean stand height was 14 m, and mean DBH was 20 cm.

2.2. Sampling Work

In the summer of 1996, we selected P. armandii, Q. aliena var. acuteserrata forests, and a mixed forest of Q. aliena var. acuteserrata and P. armandii for our permanent plots, and randomly established six sample plots with an area of 60 m × 60 m in each of the forest types. To reduce disturbance, these sample plots were protected by an enclosure. Each sample plot was located at least 50 m from the forest edge and was separated from other plots by a buffer strip of at least 100 m. We assumed that the annual average precipitation was the same in these sample plots. The annual average temperature and precipitation were sourced from the unpublished Qinling long-term ecological monitoring database and were measured using a HMP45C weather station (Vaisala, Helsinki, Finland) located 1612 m above sea level in this region at 33°20′16″ N and 108°26′45″ E. The 2017 mean annual climate data were calculated by combining those of 2016 and the existing record of 2017. We also assumed a standard lapse rate of 0.7 °C in this forest area [18], and estimated the annual average temperatures in these sample plots.
We dug soil pits and then sampled the soil with a soil corer (Φ50.46 × 50 mm). Five profiles were sampled at fixed depths (0–10, 10–20, 20–40, and 40–60 cm) in each plot, and every sample was weighed immediately on site to calculate the soil water content. Each subsample contained the same amount of soil taken from these four fixed depths. We pooled the five subsamples to form one composite sample per plot. The samples were crushed, after separating the stones and root fragments that had been mistakenly collected. A 2-mm sieve was used for further sieving. Soil available N and P was analyzed following the methods described by Liu [19]. Plot characteristics and soil nutrient measurements were initially conducted in July of 1996. Two other soil nutrient measurements were conducted in July 2012, and July 2017, providing a total of three measurements during this 20-year study.

2.3. Data Analysis

R Studio version 3.2.3 and Origin 9.0 were used to perform the data analysis and to construct the figures. The significant differences over time were tested using one-way ANOVA with SAS 8.0 software (SAS Inc., Cary, NC, USA). All soil nutrient variables, referring to the abundance of soil available N and P at each site along the time scale, were displayed by box plot with standard errors. Stand density (SD); stand types (ST, referring to tree species), mean annual temperature (MAT); mean annual total precipitation (MAP); and topography status (TG), including aspect, slope, and elevation were considered as factors influencing the abundance of soil available N and P. When analyzing the effect of each of these factors on the abundance of soil available N and P, partial methods of redundancy analysis (RDA), relying on the R function “Vegan”, were used to remove the effect of conditioning or background variables before completing RDA. We used an RDA model (X ~ Y + Z) to extract components of variance and calculate the attributes of factor Y, cleansed of the effect of Z. By dividing the total inertia value by the constrained inertia value of Y, we obtained the explanatory influence of Y expressed as a percentage.

3. Results

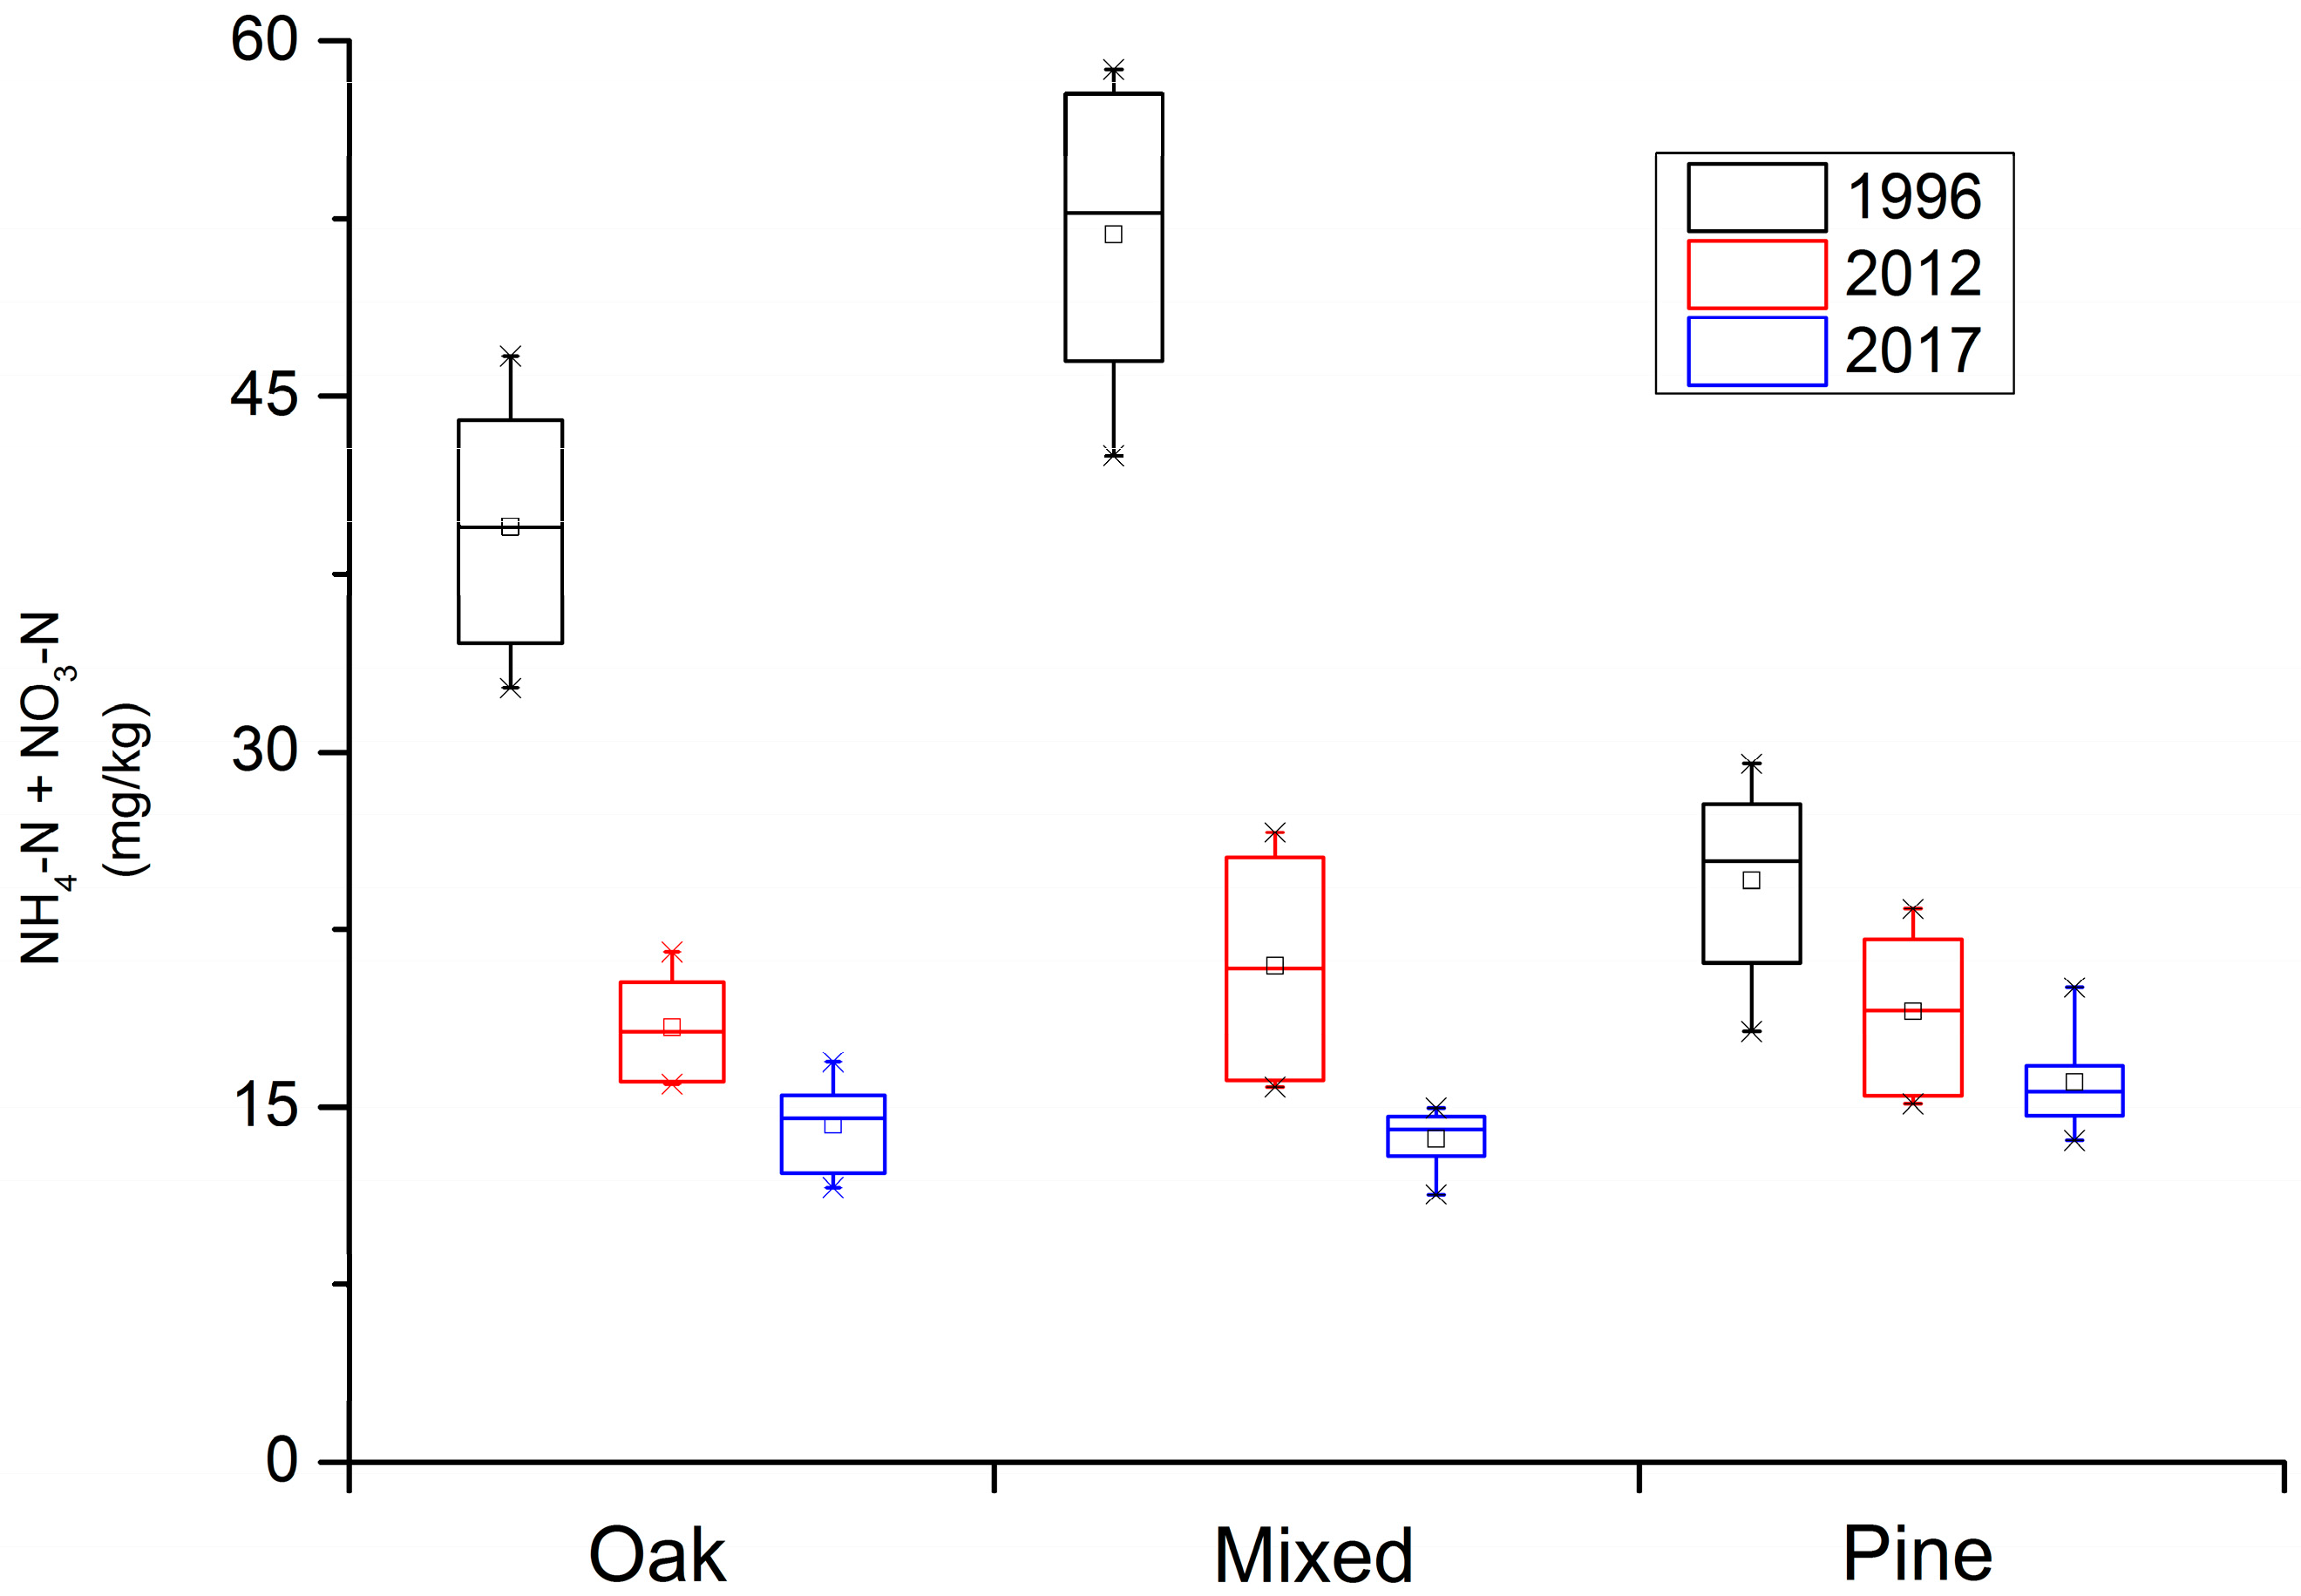
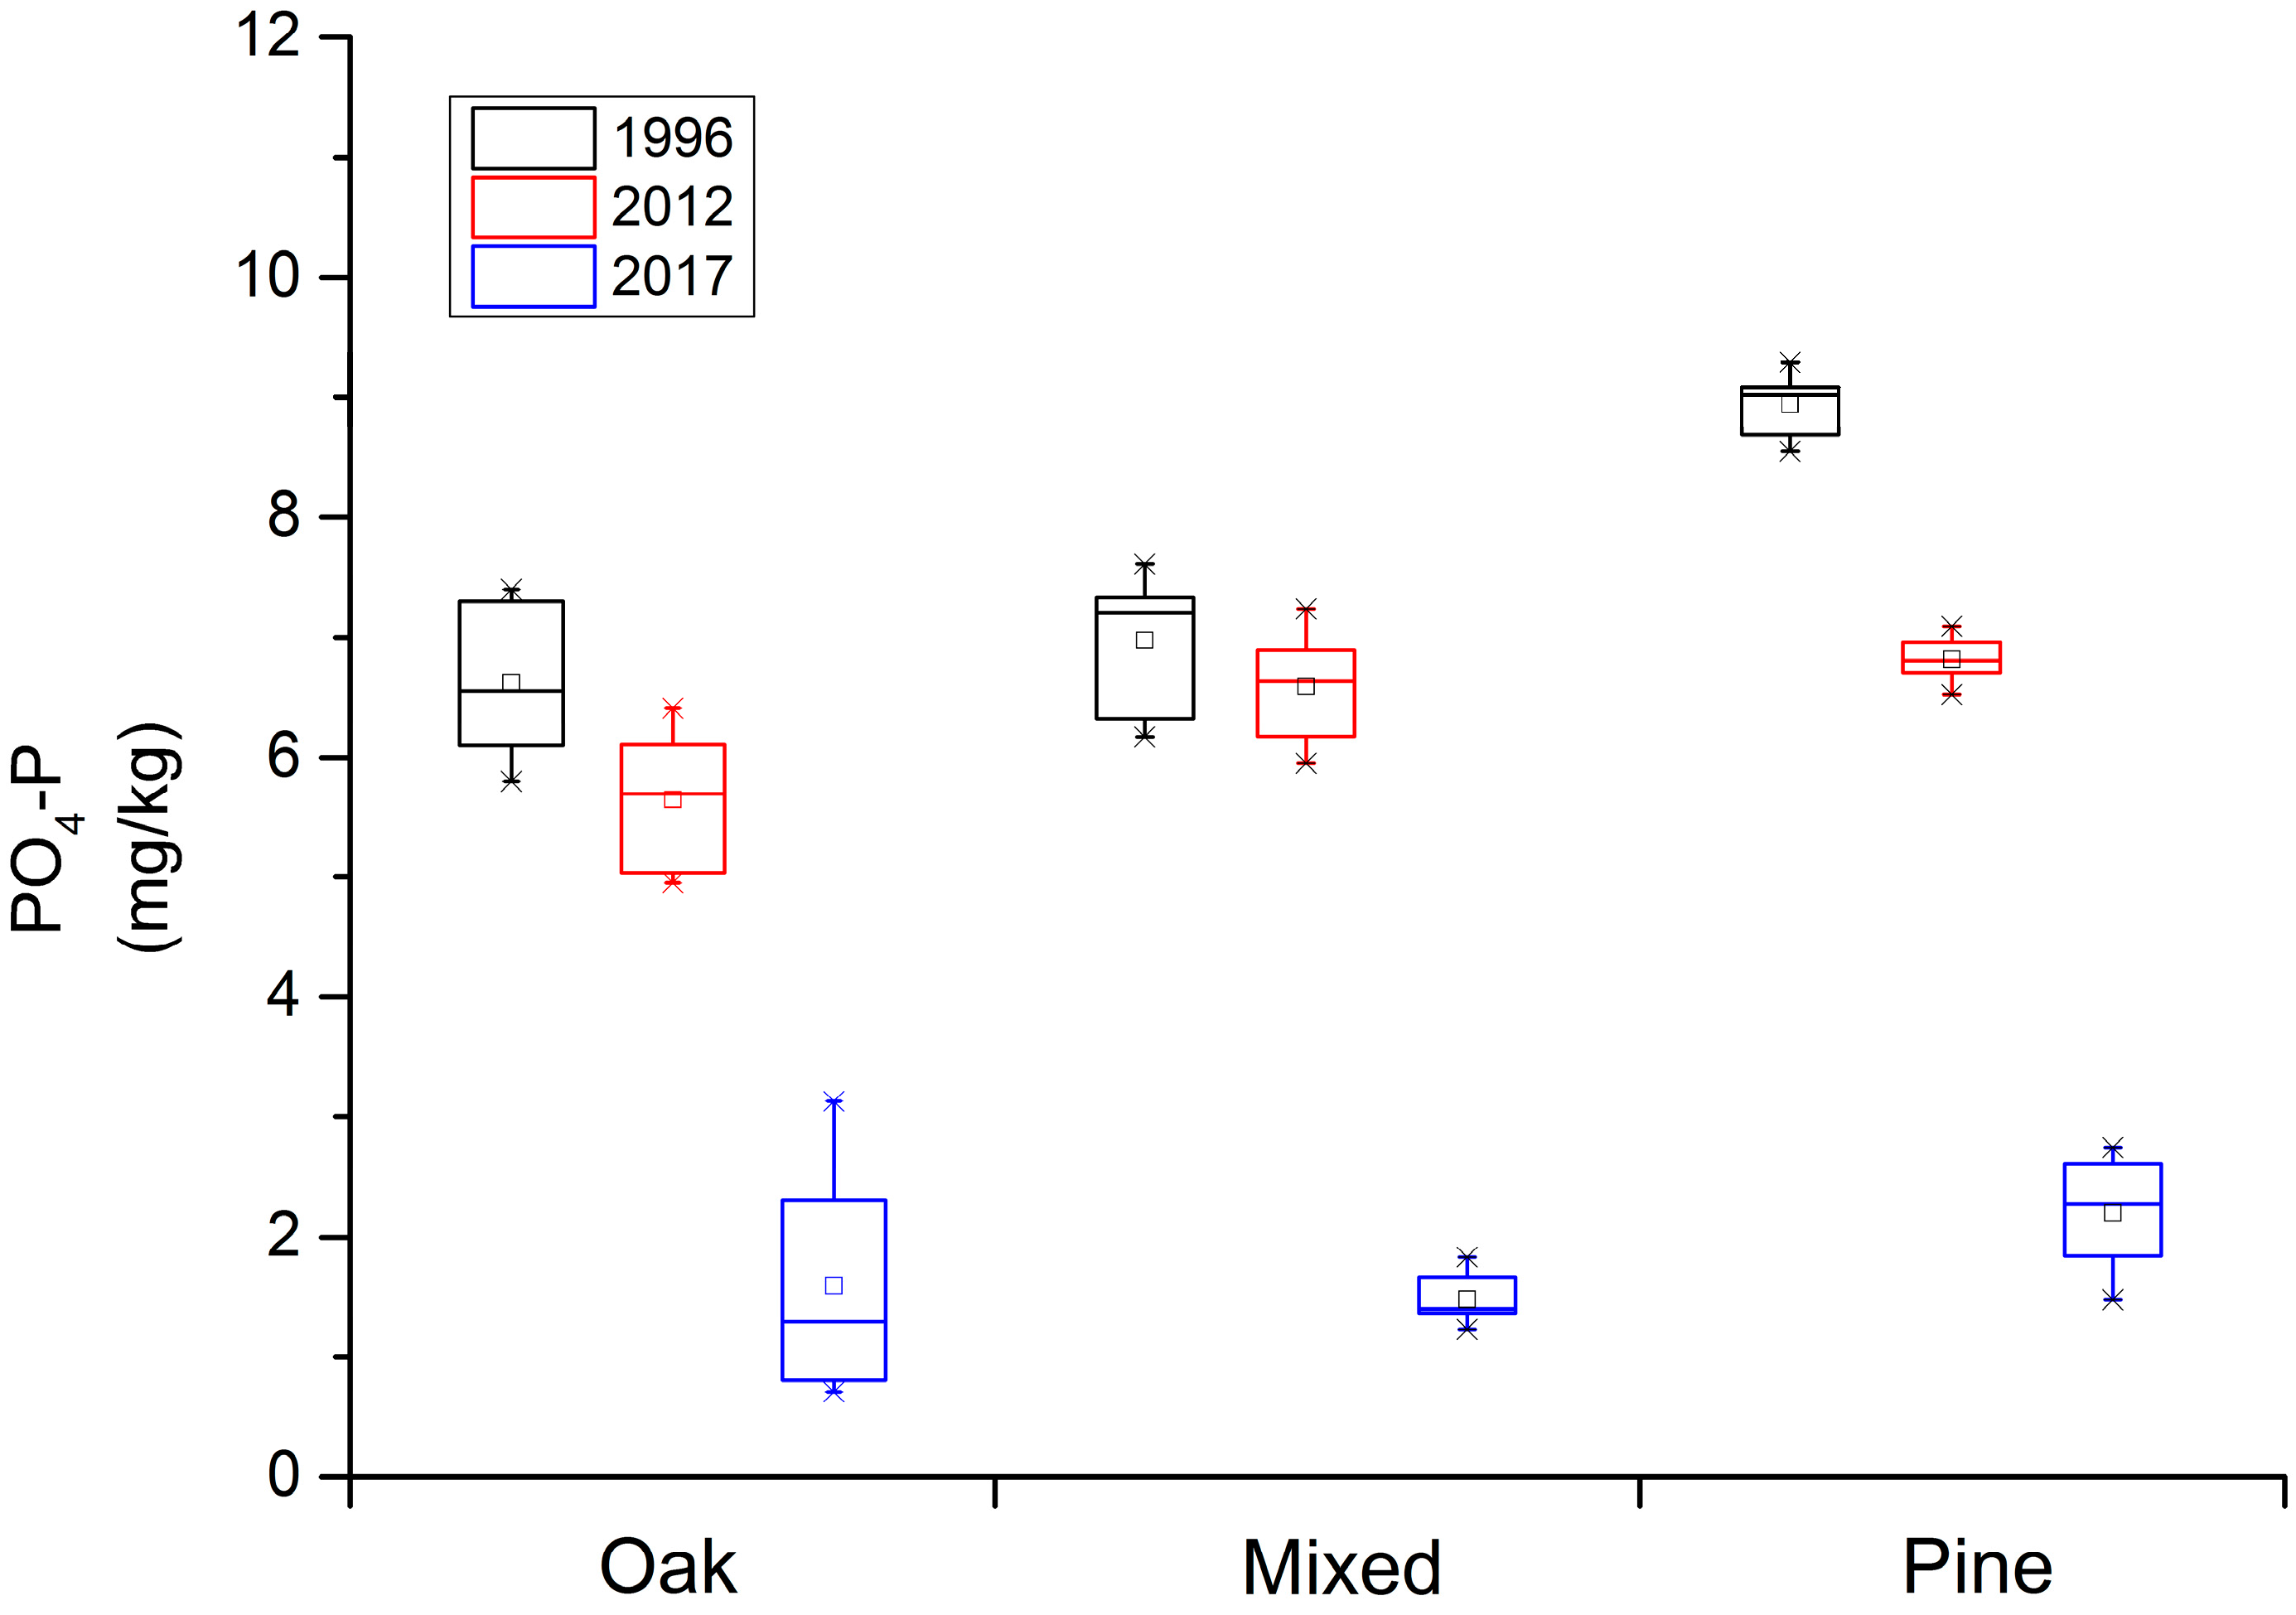
3.1. Change in Soil Available N and P over Time

In the Qinling Mountains forest ecosystem, the abundance of soil available N has significantly decreased over time, especially in the Q. var. acuteserrata related forest (Figure 1). The soil available N in the Q. var. acuteserrata and mixed forest, between Q. var. acuteserrata and P. armandii, ranged from 34 mg/kg to 58 mg/kg in 1996, from 16 mg/kg to 26 mg/kg in 2012, and finally from 11 mg/kg to 17 mg/kg in 2017. The soil available N in the P. armandii forest ranged 18 mg/kg to 30 mg/kg, 15 mg/kg to 24 mg/kg, and 13 mg/kg to 20 mg/kg at the same sampling points in time, respectively. The soil available N loss in the Q. var. acuteserrata related forest was high between 1996 and 2012. An obvious decline in the concentration of soil available N can be seen in Figure 1. In the P. armandii forest, the decline in soil available N concentration is also clear.
When examining the amount of P available in the soil in the Qinling Mountains forest ecosystem (Figure 2), the Q. var. acuteserrata and the mixed Q. var. acuteserrata and P. armandii forest ranged from 5.8 mg/kg to 8.0 mg/kg in 1996, from 5.0 mg/kg to 7.2 mg/kg in 2012, and finally from 0.8 mg/kg to 3 mg/kg in 2017. The soil available P in the P. armandii forest ranged 8.5 mg/kg to 9.4 mg/kg, 6.5 mg/kg to 7.1 mg/kg, and 1.5 mg/kg to 2.8 mg/kg along this same time scale, respectively. Overall, a trend in soil nutrient degradation in the soil available P was also demonstrated. Numerically, the abundance loss is not that significant, but the decreasing scale is large. Notably, in the 5-year period from 2012 to 2017, more available P in the soil was lost than in the prior 15-year period, from 1996 to 2012.
The loss of soil available N and P over time is obvious. We can see large differences between the different sampling dates (Table 2). The one-way ANOVA results showed that time had a significant effect on the decline of soil available N and P in all the plots except the decline of soil available P over the first period from 1996 to 2012 in the mixed forest (capital letters in Table 2). In the next period, from 2012 to 2017, the abundance of soil available P in the mixed forest also experienced a significant decline and a huge loss of soil available P.

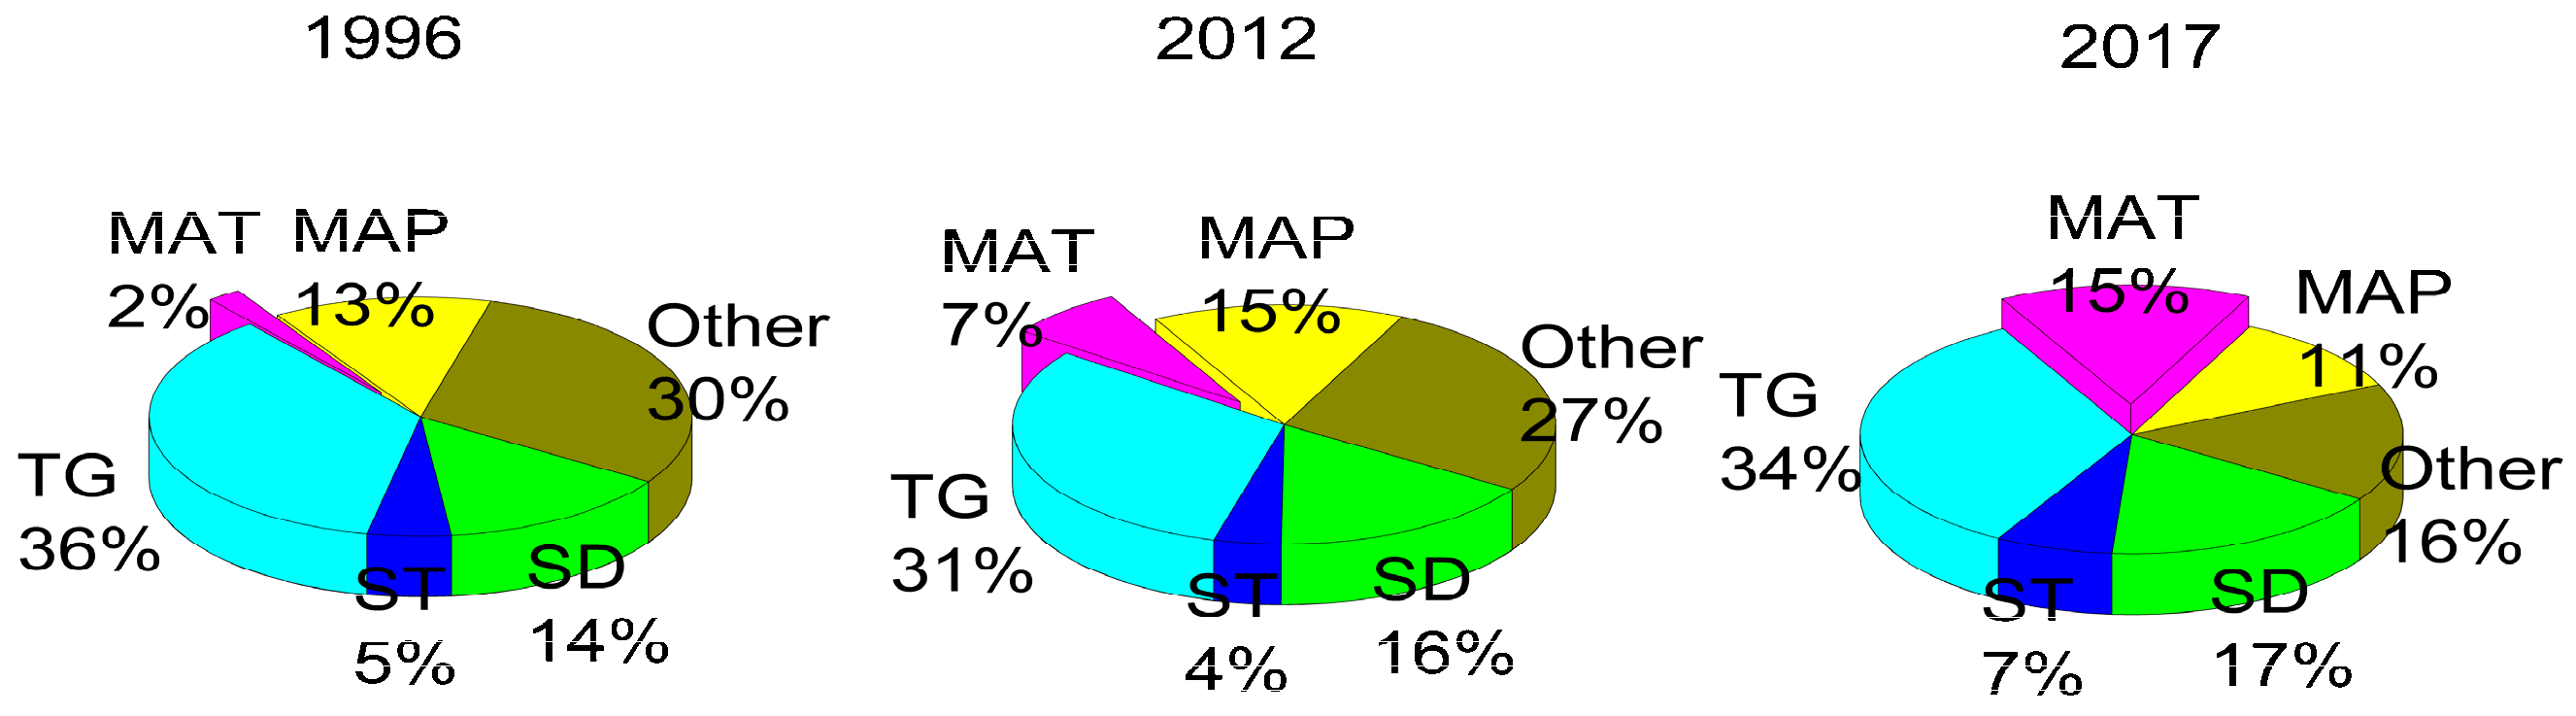
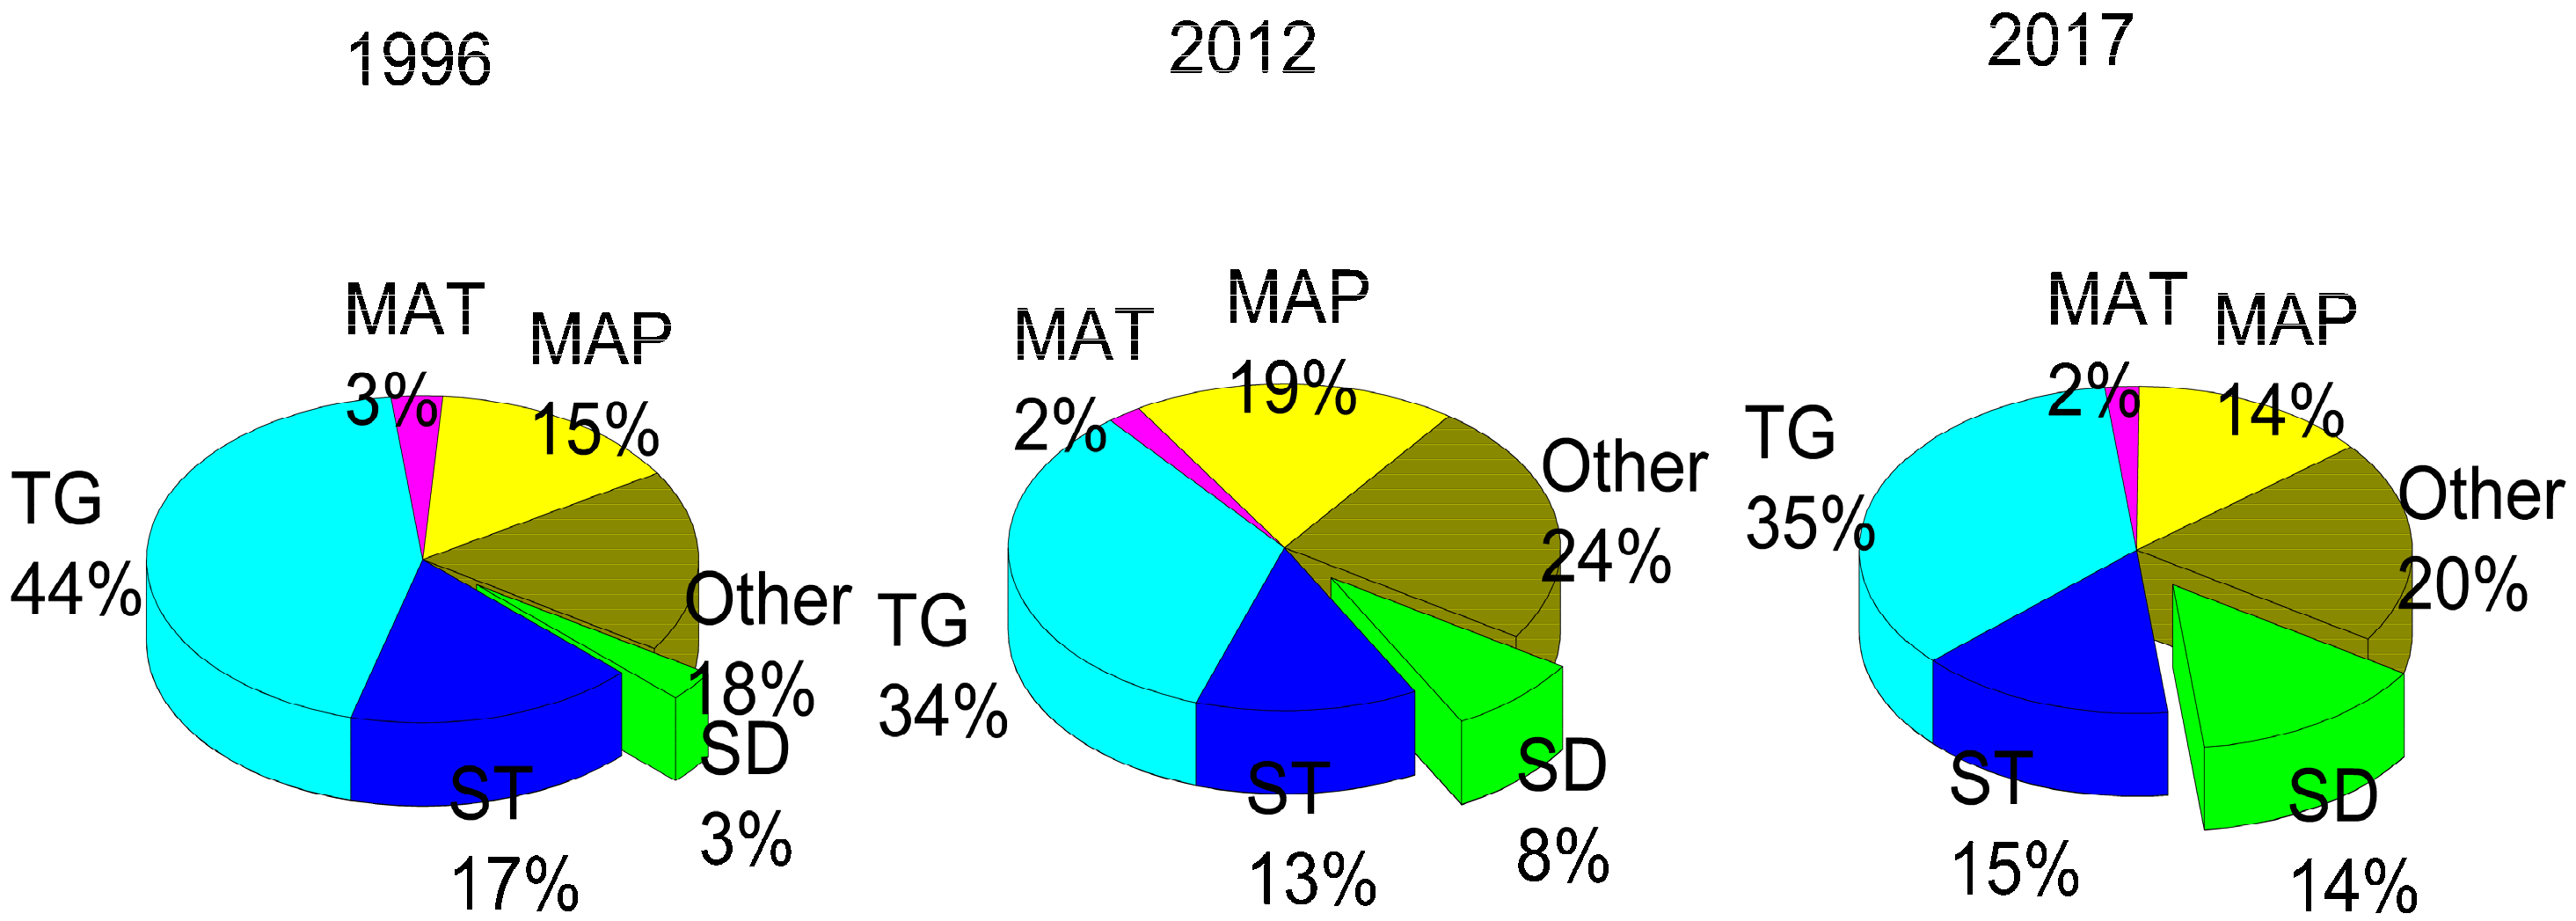
3.2. Factors Influencing the Abundance of Soil Available N and P

Good climate data records and topography information were available for all forest plots used in this study. We analyzed the strength of the TG, including plot elevation, slope, and aspect; climate factors, including MAP and MAT, together with the ST and SD, influencing the abundance of soil available N and P.
MAT has an influential role in soil available N loss (Figure 3). MAT explained 2% of the loss in soil available N in 1996, 5% in 2012, and 15% of the loss in 2017. The SD had a slightly increasing role in explaining the amount of soil available N, from 14% to 17%, over the study period. The TG, MAP, and ST did not show a uniform trend in affecting soil available N. The influence of all the unconstrained factors decreased gradually from 30% to 27%, and finally to 16% in 2017. We conclude that MAT was the main driver of the decline in soil available N concentrations, whereas the SD contributed minimally.
In explaining the concentrations of soil available P, the SD was the dominant factor (Figure 4). The effect of SD on soil available P was 3% in 1996, 5% in 2012 and 14% in 2017. All other factors, including the TG, MAP, ST and Other, did not show a uniform trend in affecting the soil available P content. The influential strength of all the unconstrained factors increased from 18% to 24% and then decreased to 20%. Although not strong, the influence of SD became more important with time, so we conclude that the changing SD is the main driver of soil available P loss.

4. Discussion

This study has two main advantages in understanding the change in concentrations of soil available N and P in forests of the Qinling Mountains. This work quantitatively demonstrated the change in abundance of soil available N and P during the 20-year period and demonstrated that the trend in soil degradation with respect to available N and P is continuing in the forests of the Qinling Mountains. We also calculated the strength of various factors influencing the abundance of soil available N and P. A longer study period would be more persuasive in describing the trajectory of the change in soil available N and P contents. The interactions of unknown factors, classified as “Other”, was ignored and might affect the veracity of the results when calculating the specific strength of the factors.
In our study, the mixed forests had more soil available N than the oak-dominated forest and had much higher amounts than in the pine-dominated forests. In terms of soil available P, the pine-dominated forests had the highest concentrations, while the mixed forests and oak-dominated forests had slightly lower amounts. Climate will have a profound effect on the decline of soil available N and P [20]. Temperature may enhance the soil microbial process and soil biochemical processes, such as denitrification, which are positively related to temperature [21]. Tree species can have a strong influence on soil properties [22]. Different vegetation types can have varying influence on the rate of soil N and P input, and these can affect the soil nutrient accumulation and loss [23,24].
Soil N and P use efficiency can vary among plant species, and the abundance of soil available N and P in this study was influenced by exploitation of soil nutrients by different species. This is consistent with our findings that the concentrations of soil available N and P were species-dependent. Discussions about the pros and cons of tree species richness for soil nutrients and other ecosystem aspects date back to the early 19th century [25,26], when higher levels of soil N were found in forests with more tree species [27]. The decomposition rate of soil N has been found to be directly affected by tree species [28], which may result in the difference in the abundance of soil available N in different areas. Our findings for the soil available N content are consistent with these findings. The soil available N content was positively correlated with the species richness.
Over the studied time period, the forest soil experienced a degradation in available nutrient concentrations. The decreasing amount of soil available N and P will limit the forest’s productivity, threatening the stability of the ecosystem. Global climate change has complicated effects on global N and P cycles [29]. Soil N can be lost through emissions of ammonia, nitrous oxide, and nitric oxide. Increases in soil enzyme activity, related to soil microbial metabolism, can leads to soil N loss. N-binding agents (especially tannins) have been reported as enzyme inhibitors, so we speculated that the influence of tannins from leaf litter of some species could inhibit mineralization of organic N [30]. Other factors like nitrification and subsequent leaching can be also responsible for soil available N loss [31]. Soil P loss is predominately caused by surface runoff. Overland flow and leaching contribute to the loss of soil P [32]. As a consequence of soil available P consumption (such as plant uptake), declines in sources of organic P and loss of soil available P are inevitable in these forests.
The losses of soil available N and P, which govern the N and P cycling patterns in forest systems, have a wide range of controlling factors, including climate factors, soil homeostasis, stand traits, and vegetation type [33,34]. The abundance of soil available N and P is probably dependent on all of these mentioned factors. In 1996, MAT was found to explain only 2% of the variation in soil available N. The influence increased over the 20-year period. When examining the trend in global warming, declines in soil available N and P may exhibit similar trends. Aspect and slope also regulate overland runoff, light availability and radiation. Temperature and precipitation are also related to elevation, which is why topographic factors have an important influence on the concentrations of available N and P. The decreasing influential effect of topographic factors over the study period implies they may continue to decline in the future. The advantages of higher N and P input and higher organic matter decomposition rate, caused by increasing temperature, may be offset by increasing uptake by the forest biomass. As a result, the increasing influence of stand density on available P concentration over time is understandable.

5. Conclusions

In the forests of the Qinling Mountains, the concentrations of soil available N and P are species-related and are positively related to species richness. The reduction in soil quality is concerning, especially given the large decrease in available N and P contents and the continuing decline over the study period. Mean annual temperature will be a critical factor regulating soil available N, and stand density will be the critical factor affecting soil available P in the Qinling Mountains forest system.

Acknowledgments

We are grateful to the Qinling National Forest Ecosystem Research Station for providing some data and the experimental equipment. We wish to thank our academic editor and two anonymous reviewers for improving this manuscript. Moreover, our appreciation goes to the guest editor, Robert G. Qualls, for exhaustive instructions. This research was funded by the project “Technical management system for increasing the capacity of carbon sink and water regulation of mountain forests in the Qinling Mountains” (201004036) of the State Forestry Administration of China.

Author Contributions

J.Y., X.Z. and S.Z. conceived and designed the experiments; X.Z., J.Y. and T.Z. performed the experiments; J.Y., X.Z. and S.Z. analyzed the data; X.Z., J.Y., T.Z. and F.H. contributed reagents/materials/analysis tools; J.Y., X.Z., S.Z. and S.J. wrote the paper.

Conflicts of Interest

The authors declare no conflict of interest.

References

  1. Oldeman, L.R.; Hakkeling, R.U.; Sombroek, W.G. World Map of the Status of Human-Induced Soil Degradation: An Explanatory Note; International Soil Reference and Information Centre: Wageningen, The Netherlands, 1991. [Google Scholar]
  2. Wang, T.; Yan, C.Z.; Song, X.; Li, S. Landsat images reveal trends in the Aeolian desertification in a source area for sand and dust storms in China’s Alashan plateau (1975–2007). Land Degrad. Dev. 2013, 24, 422–429. [Google Scholar] [CrossRef]
  3. Zhang, S.; Lei, R.; Liu, G.; Dang, K.; Shang, L.; Zhang, Y. Nutrient cycle in main types of forests at Huoditang Forest Region in the Qinling Mountains. J. Northwest For. Coll. 1996, 11, 115–120, (In Chinese with English Abstract). [Google Scholar]
  4. Hurni, H. Land degradation, famine, and land resource scenarios in Ethiopia. In World Soil Erosion and Conservation; Pimentel, D., Ed.; Cambridge University Press: Cambridge, UK, 1993; pp. 27–62. [Google Scholar]
  5. Shapiro, J. Environmental Degradation in China under Mao and Today: A Comparative Reflection. Glob. Environ. 2016, 9, 440–457. [Google Scholar] [CrossRef]
  6. Chen, J.; Chen, J.Z.; Tan, M.Z.; Gong, Z.T. Soil degradation: A global problem endangering sustainable development. J. Geogr. Sci. 2002, 12, 243–252. [Google Scholar]
  7. Smil, V. The Bad Earth. Environmental Degradation in China; ME Sharpe, Inc.: Armonk, NY, USA, 1984; Volume 9, pp. 332–333. [Google Scholar]
  8. Le Houérou, H.N. Climate change, drought and desertification. J. Arid Environ. 1996, 34, 133–185. [Google Scholar] [CrossRef]
  9. Schoenholtz, S.H.; Van Miegroet, H.; Burger, J.A. A review of chemical and physical properties as indicators of forest soil quality: Challenges and opportunities. For. Ecol. Manag. 2000, 138, 335–356. [Google Scholar] [CrossRef]
  10. Lemanceau, P.; Maron, P.A.; Mazurier, S.; Mougel, C.; Pivato, B.; Plassart, P.; Ranjard, L.; Revellin, C.; Tardy, V.; Wipf, D. Understanding and managing soil biodiversity: A major challenge in agroecology. Agron. Sustain. Dev. 2015, 35, 67–81. [Google Scholar] [CrossRef]
  11. Elser, J.J.; Andersen, T.; Baron, J.S.; Bergström, A.K.; Jansson, M.; Kyle, M.; Hessen, D.O. Shifts in lake N: P stoichiometry and nutrient limitation driven by atmospheric nitrogen deposition. Science 2009, 326, 835–837. [Google Scholar] [CrossRef] [PubMed]
  12. Reich, P.B.; Hobbie, S.E.; Lee, T.; Ellsworth, D.S.; West, J.B.; Tilman, D.; Trost, J. Nitrogen limitation constrains sustainability of ecosystem response to CO2. Nature 2006, 440, 922–925. [Google Scholar] [CrossRef] [PubMed]
  13. Hu, S.; Chapin, F.S.; Firestone, M.K.; Field, C.B.; Chiariello, N.R. Nitrogen limitation of microbial decomposition in a grassland under elevated CO2. Nature 2001, 409, 188–191. [Google Scholar] [CrossRef] [PubMed]
  14. Vitousek, P.M.; Porder, S.; Houlton, B.Z.; Chadwick, O.A. Terrestrial phosphorus limitation: Mechanisms, implications, and nitrogen–phosphorus interactions. Ecol. Appl. 2010, 20, 5–15. [Google Scholar] [CrossRef] [PubMed]
  15. Koerselman, W.; Meuleman, A.F. The vegetation N: P ratio: A new tool to detect the nature of nutrient limitation. J. Appl. Ecol. 1996, 33, 1441–1450. [Google Scholar] [CrossRef]
  16. Conant, R.T.; Ryan, M.G.; Ågren, G.I.; Birge, H.E.; Davidson, E.A.; Eliasson, P.E.; Hyvönen, R. Temperature and soil organic matter decomposition rates–synthesis of current knowledge and a way forward. Glob. Chang. Biol. 2011, 17, 3392–3404. [Google Scholar] [CrossRef]
  17. Durán, J.; Morse, J.L.; Groffman, P.M.; Campbell, J.L.; Christenson, L.M.; Driscoll, C.T.; Mitchell, M.J. Climate change decreases nitrogen pools and mineralization rates in northern hardwood forests. Ecosphere 2016, 7, e01251. [Google Scholar] [CrossRef]
  18. Yuan, J.; Jose, S.; Zheng, X.F.; Cheng, F.; Hou, L.; Li, J.X.; Zhang, S.X. Dynamics of Coarse Woody Debris Characteristics in the Qinling Mountain Forests in China. Forests 2017, 8, 403. [Google Scholar] [CrossRef]
  19. Liu, G.S.; Jiang, N.H.; Zhang, L.D.; Liu, Z.L. Soil Physical and Chemical Analysis and Description of Soil Profiles; China Standard Methods Press: Beijing, China, 1996; pp. 24–266, (In Chinese with English Abstract). [Google Scholar]
  20. Jeppesen, E.; Kronvang, B.; Olesen, J.E.; Audet, J.; Søndergaard, M.; Hoffmann, C.C.; Andersen, H.E.; Lauridsen, T.L.; Liboriussen, L.; Larsen, S.E.; et al. Climate change effects on nitrogen loading from cultivated catchments in Europe: Implications for nitrogen retention, ecological state of lakes and adaptation. Hydrobiologia 2011, 663, 1–21. [Google Scholar] [CrossRef]
  21. Veraart, A.J.; De Klein, J.J.; Scheffer, M. Warming can boost denitrification disproportionately due to altered oxygen dynamics. PLoS ONE 2011, 6, e18508. [Google Scholar] [CrossRef] [PubMed]
  22. Zheng, X.; Wei, X.; Zhang, S. Tree species diversity and identity effects on soil properties in the Huoditang area of the Qinling Mountains, China. Ecosphere 2017, 8, e01732. [Google Scholar] [CrossRef]
  23. Binkley, D.; Sollins, P.; Bell, R.; Sachs, D.; Myrold, D. Biogeochemistry of adjacent conifer and alder-conifer stands. Ecology 1992, 73, 2022–2033. [Google Scholar] [CrossRef]
  24. Lee, M.R.; Flory, S.L.; Phillips, R.P. Positive feedbacks to growth of an invasive grass through alteration of nitrogen cycling. Oecologia 2012, 170, 457–465. [Google Scholar] [CrossRef] [PubMed]
  25. Duffy, J.E.; Richardson, J.P.; Canuel, E.A. Grazer Diversity Effects on Ecosystem Functioning in Seagrass beds. Ecol. Lett. 2003, 6, 637–645. [Google Scholar] [CrossRef]
  26. Hector, A.; Bagchi, R. Biodiversity and ecosystem multifunctionality. Nature 2007, 448, 188–190. [Google Scholar] [CrossRef] [PubMed]
  27. Gamfeldt, L.; Snäll, T.; Bagchi, R.; Jonsson, M.; Gustafsson, L.; Kjellander, P.; Mikusiński, G. Higher levels of multiple ecosystem services are found in forests with more tree species. Nat. Commun. 2013, 4, 1340. [Google Scholar] [CrossRef] [PubMed] [Green Version]
  28. Hansson, K.; Fröberg, M.; Helmisaari, H.S.; Kleja, D.B.; Olsson, B.A.; Olsson, M.; Persson, T. Carbon and nitrogen pools and fluxes above and below ground in spruce, pine and birch stands in southern Sweden. For. Ecol. Manag. 2013, 309, 28–35. [Google Scholar] [CrossRef]
  29. Bouwman, L.; Goldewijk, K.K.; Van Der Hoek, K.W.; Beusen, A.H.; Van Vuuren, D.P.; Willems, J.; Rufino, M.C.; Stehfest, E. Exploring global changes in nitrogen and phosphorus cycles in agriculture induced by livestock production over the 1900–2050 period. Proc. Natl. Acad. Sci. USA 2013, 110, 20882–20887. [Google Scholar] [CrossRef] [PubMed]
  30. Adamczyk, B.; Karonen, M.; Adamczyk, S.; Engström, M.T.; Laakso, T.; Saranpää, P. Tannins can slow-down but also speed-up soil enzymatic activity in boreal forest. Soil Biol. Biochem. 2017, 107, 60–67. [Google Scholar] [CrossRef]
  31. Wang, J.; Zhu, B.; Zhang, J.; Mueller, C.; Cai, Z. Mechanisms of soil N dynamics following long-term application of organic fertilizers to subtropical rain-fed purple soil in China. Soil Biol. Biochem. 2015, 91, 222–231. [Google Scholar] [CrossRef]
  32. Bai, Z.; Li, H.; Yang, X.; Zhou, B.; Shi, X.; Wang, B.; Oenema, O. The critical soil P levels for crop yield, soil fertility and environmental safety in different soil types. Plant Soil 2013, 372, 27–37. [Google Scholar] [CrossRef]
  33. Niu, S.; Classen, A.T.; Dukes, J.S.; Kardol, P.; Liu, L.; Luo, Y.; Rustad, L.; Sun, J.; Tang, J.; Templer, P.H.; et al. Global patterns and substrate-based mechanisms of the terrestrial nitrogen cycle. Ecol. Lett. 2016, 19, 697–709. [Google Scholar] [CrossRef] [PubMed]
  34. Smyth, C.E.; Titus, B.; Trofymow, J.A.; Moore, T.R.; Preston, C.M.; Prescott, C.E.; CIDET Working Group. Patterns of carbon, nitrogen and phosphorus dynamics in decomposing wood blocks in Canadian forests. Plant Soil 2016, 409, 459–477. [Google Scholar] [CrossRef]
Figure 1. The loss in soil available nitrogen (N) along a 20-year time scale in the Qinling Mountains forest ecosystem. “AN” represents the soil available N at a given time, “Pinus” represents the P. armandii forest, “Mingled” represents the mixed Q. var. acuteserrata and P. armandii forest, and “Quercus” represents the Q. var. acuteserrata forest.
Forests 08 00460 g001
Figure 2. The loss of soil available phosphorus (P) along a 20-year time scale in the Qinling Mountains forest ecosystem. “AP” represents the soil available P, “Pinus” represents the P. armandii forest, “Mingled: represents the mixed Q. var. acuteserrata and P. armandii forest, and “Quercus” represents the Q. var. acuteserrata forest.
Forests 08 00460 g002
Figure 3. Influence of factors on soil available N throughout the sampling period. MAP represents mean annual precipitation, MAT represents mean annual temperature, TG represents topography indicators including aspect, slope and elevation. ST represents stand type, SD represents the stand density, “Other” represents all the unconstrained factors.
Forests 08 00460 g003
Figure 4. Influence of factors on soil available P throughout the 20-year time span, where “MAP” denotes mean annual precipitation, “MAT” represents mean annual temperature, and “TG” represents topography indicators including aspect, slope, and elevation. “ST” represents stand type, “SD” represents the stand density, and “Other” represents all the unconstrained factors.
Forests 08 00460 g004
Table 1. Plot characteristics in the main types of forests at the Huoditang Experimental Forest Farm in the Qinling Mountains, China.
Sample PlotLatitude and LongitudeAltitude (m)AspectSlopeStand Density (Trees/ha)
Q. aliena var. acuteserrata 1#33°20′55″ N 108°23′54″ E1597318°32°1183
Q. aliena var. acuteserrata 2#33°19′20″ N 108°25′48″ E164114°28°1482
Q. aliena var. acuteserrata 3#33°20′49″ N 108°25′58″ E1620277°26°1232
Q. aliena var. acuteserrata 4#33°19′10″ N 108°28′48″ E1640260°23°1024
Q. aliena var. acuteserrata 5#33°20′08″ N 108°28′12″ E1671240°30°1086
Q. aliena var. acuteserrata 6#33°20′42″ N 108°29′21″ E1534218°18°1584
P. armandii 1#33°19′26″ N 108°27′10″ E1410288°34°1628
P. armandii 2#33°19′30″ N 108°27′54″ E1460198°32°1486
P. armandii 3#33°22′54″ N 108°28′02″ E1483245°27°1712
P. armandii 4#33°23′10″ N 108°28′10″ E1532194°22°1426
P. armandii 5#33°21′10″ N 108°32′39″ E1540243°29°1267
P. armandii 6#33°22′01″ N 108°32′19″ E1983245°15°1834
Mixed forest 1#33°22′24″ N 108°27′10″ E1580257°22°1354
Mixed forest 2#33°19′01″ N 108°30′24″ E1481204°24°1288
Mixed forest 3#33°20′10″ N 108°30′42″ E1424255°32°1078
Mixed forest 4#33°21′05″ N 108°24′48″ E158273°26°1041
Mixed forest 5#33°21′20″ N 108°26′50″ E1798182°31°1121
Mixed forest 6#33°23′18″ N 108°25′40″ E1627202°21°1311
Table 2. The one-way ANOVA results of soil available N and P loss over time.
Nutrient ElementsForest TypesYear
199620122017
NQ. aliena var. acuteserrata39.50 (5.68) A18.36 (1.54) B14.21 (1.02) C
Mixed forest51.75 (6.82) A20.87 (5.34) B13.54 (1.34) C
P. armandii24.67 (4.44) A19.14 (1.78) B16.15 (1.23) C
PQ. aliena var. acuteserrata6.62 (0.64) A5.65 (0.58) B1.59 (0.95) C
Mixed forest6.95 (0.59) A6.57 (0.49) A1.46 (0.22) B
P. armandii8.94 (0.27) A6.81 (0.20) B2.20 (0.49) C
Standard errors are shown in parentheses, and different capital letters within the same row indicate significant differences among means (p < 0.05).

