
SOM and Biomass C Stocks in Degraded and Undisturbed Andean and Coastal Nothofagus Forests of Southwestern South America


Abstract
:1. Introduction
2. Materials and Methods
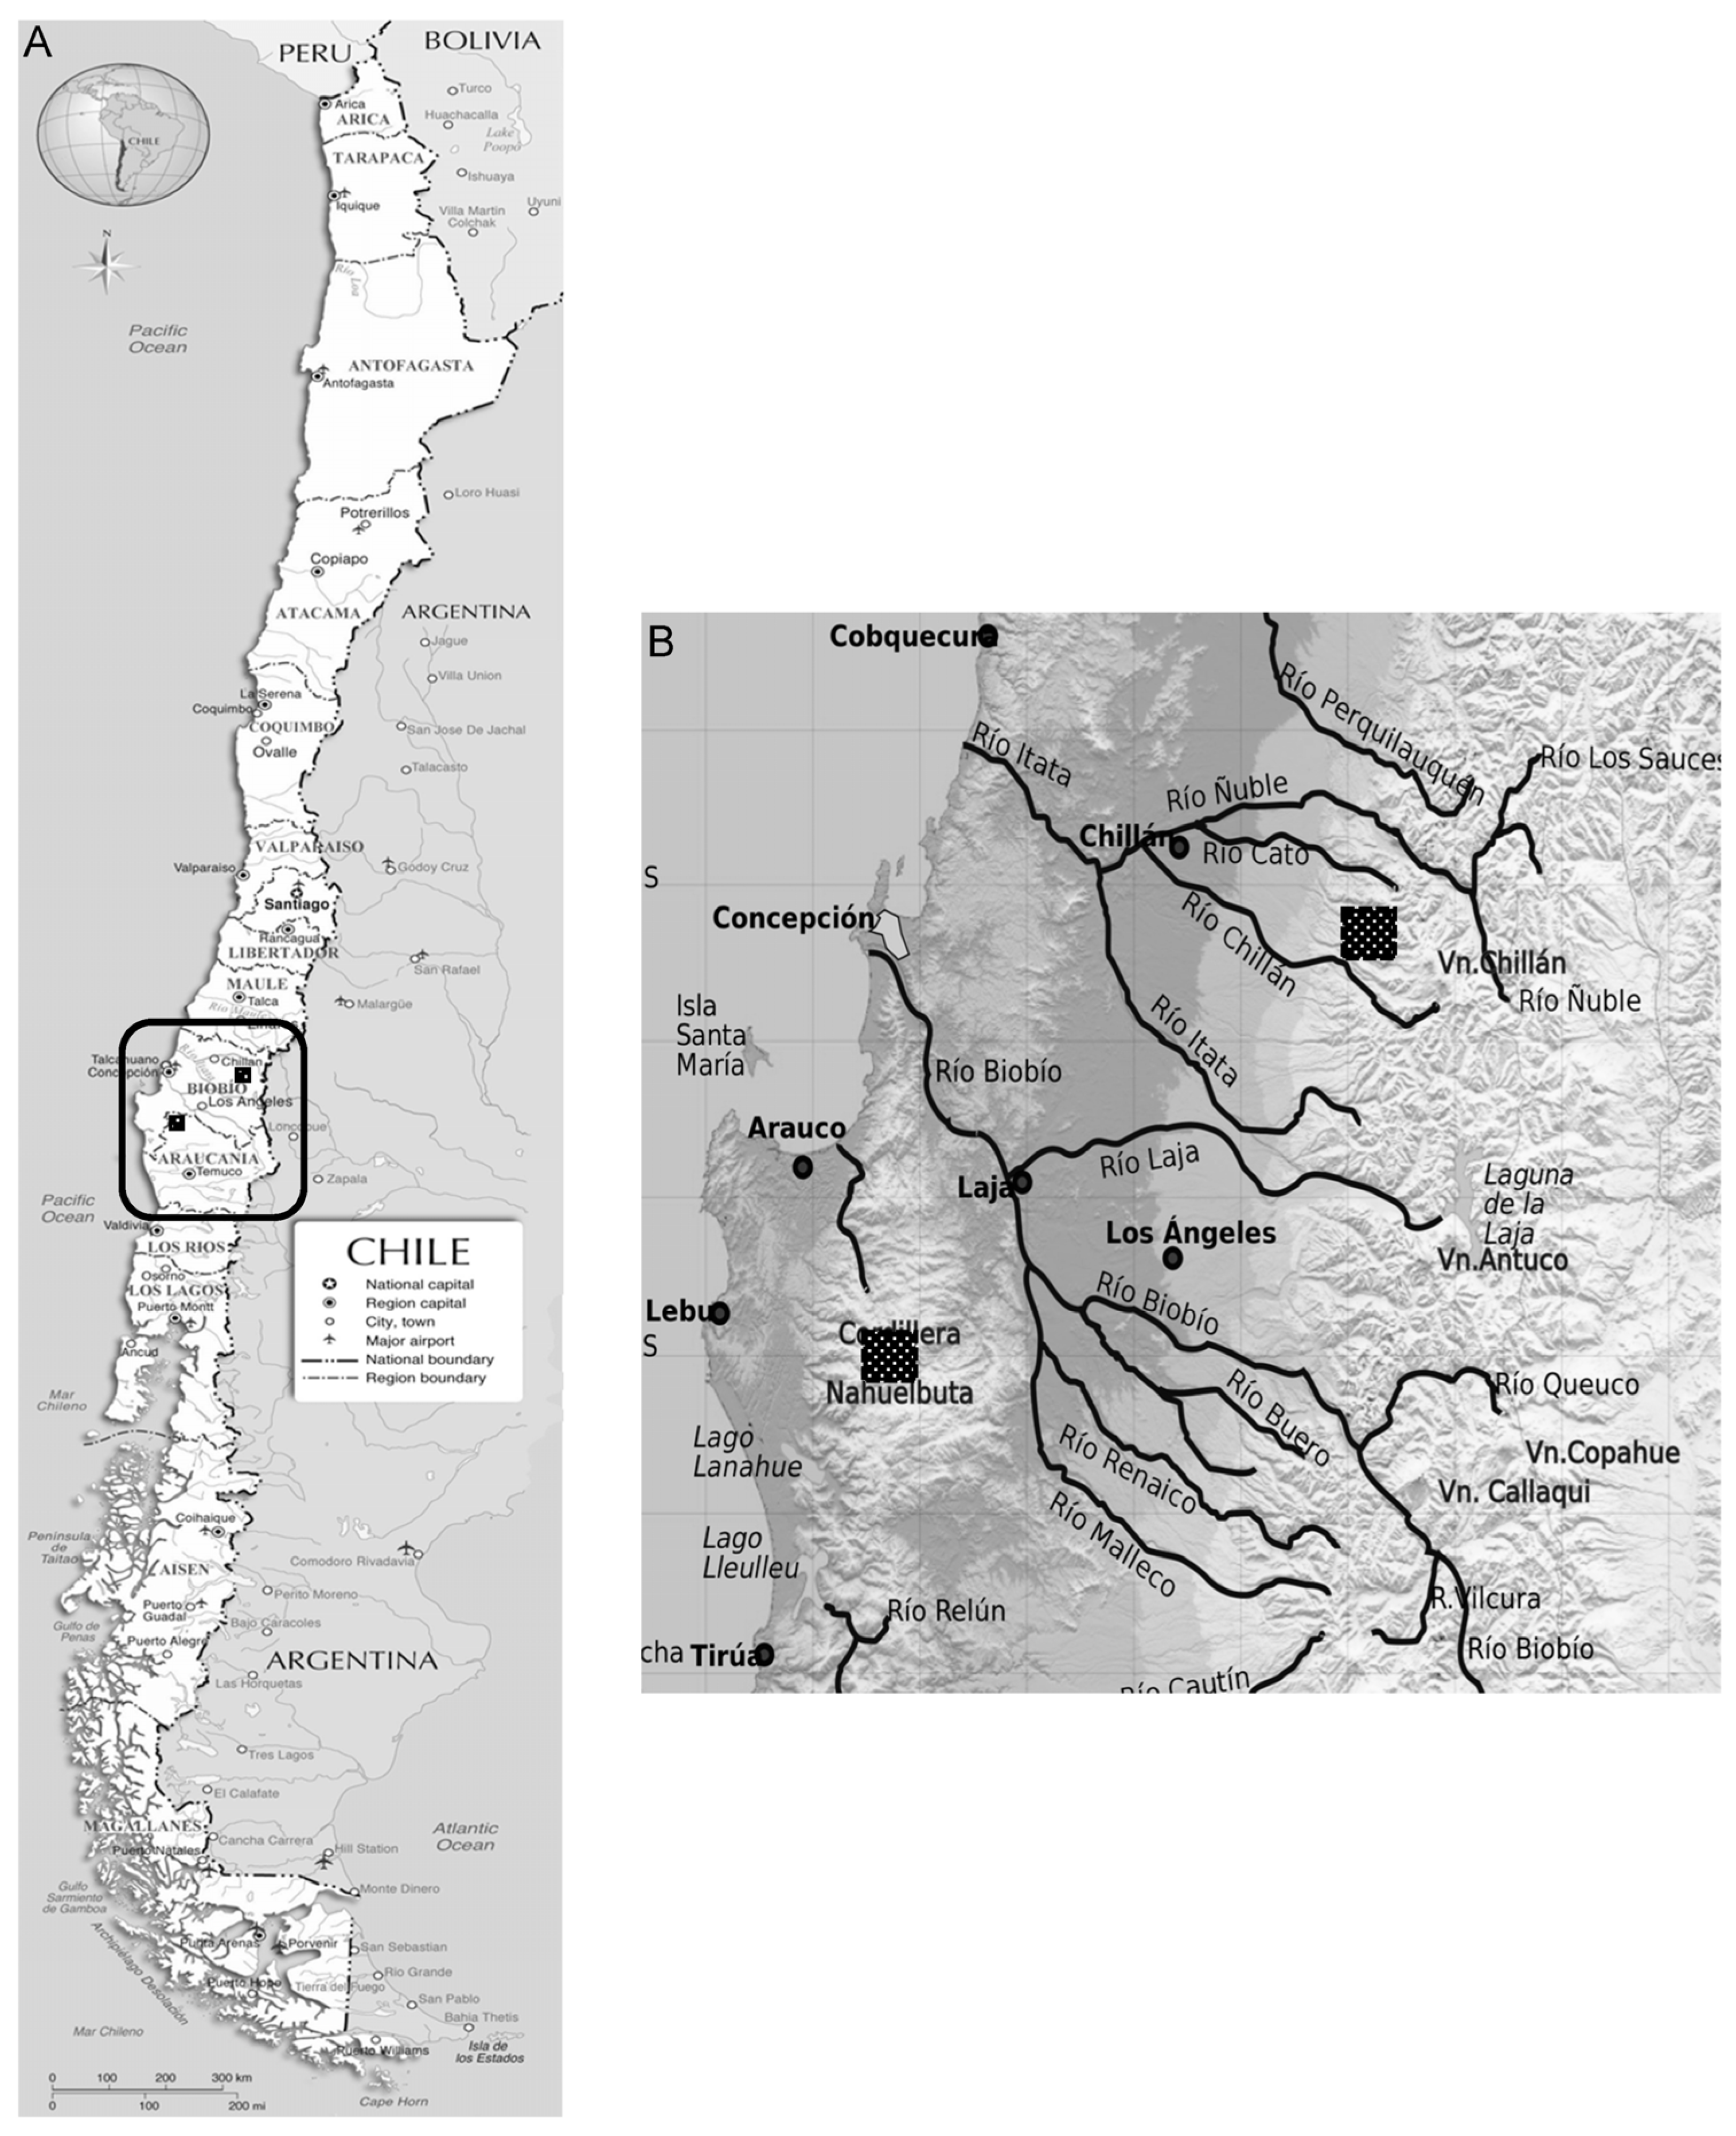
2.1. Site Description
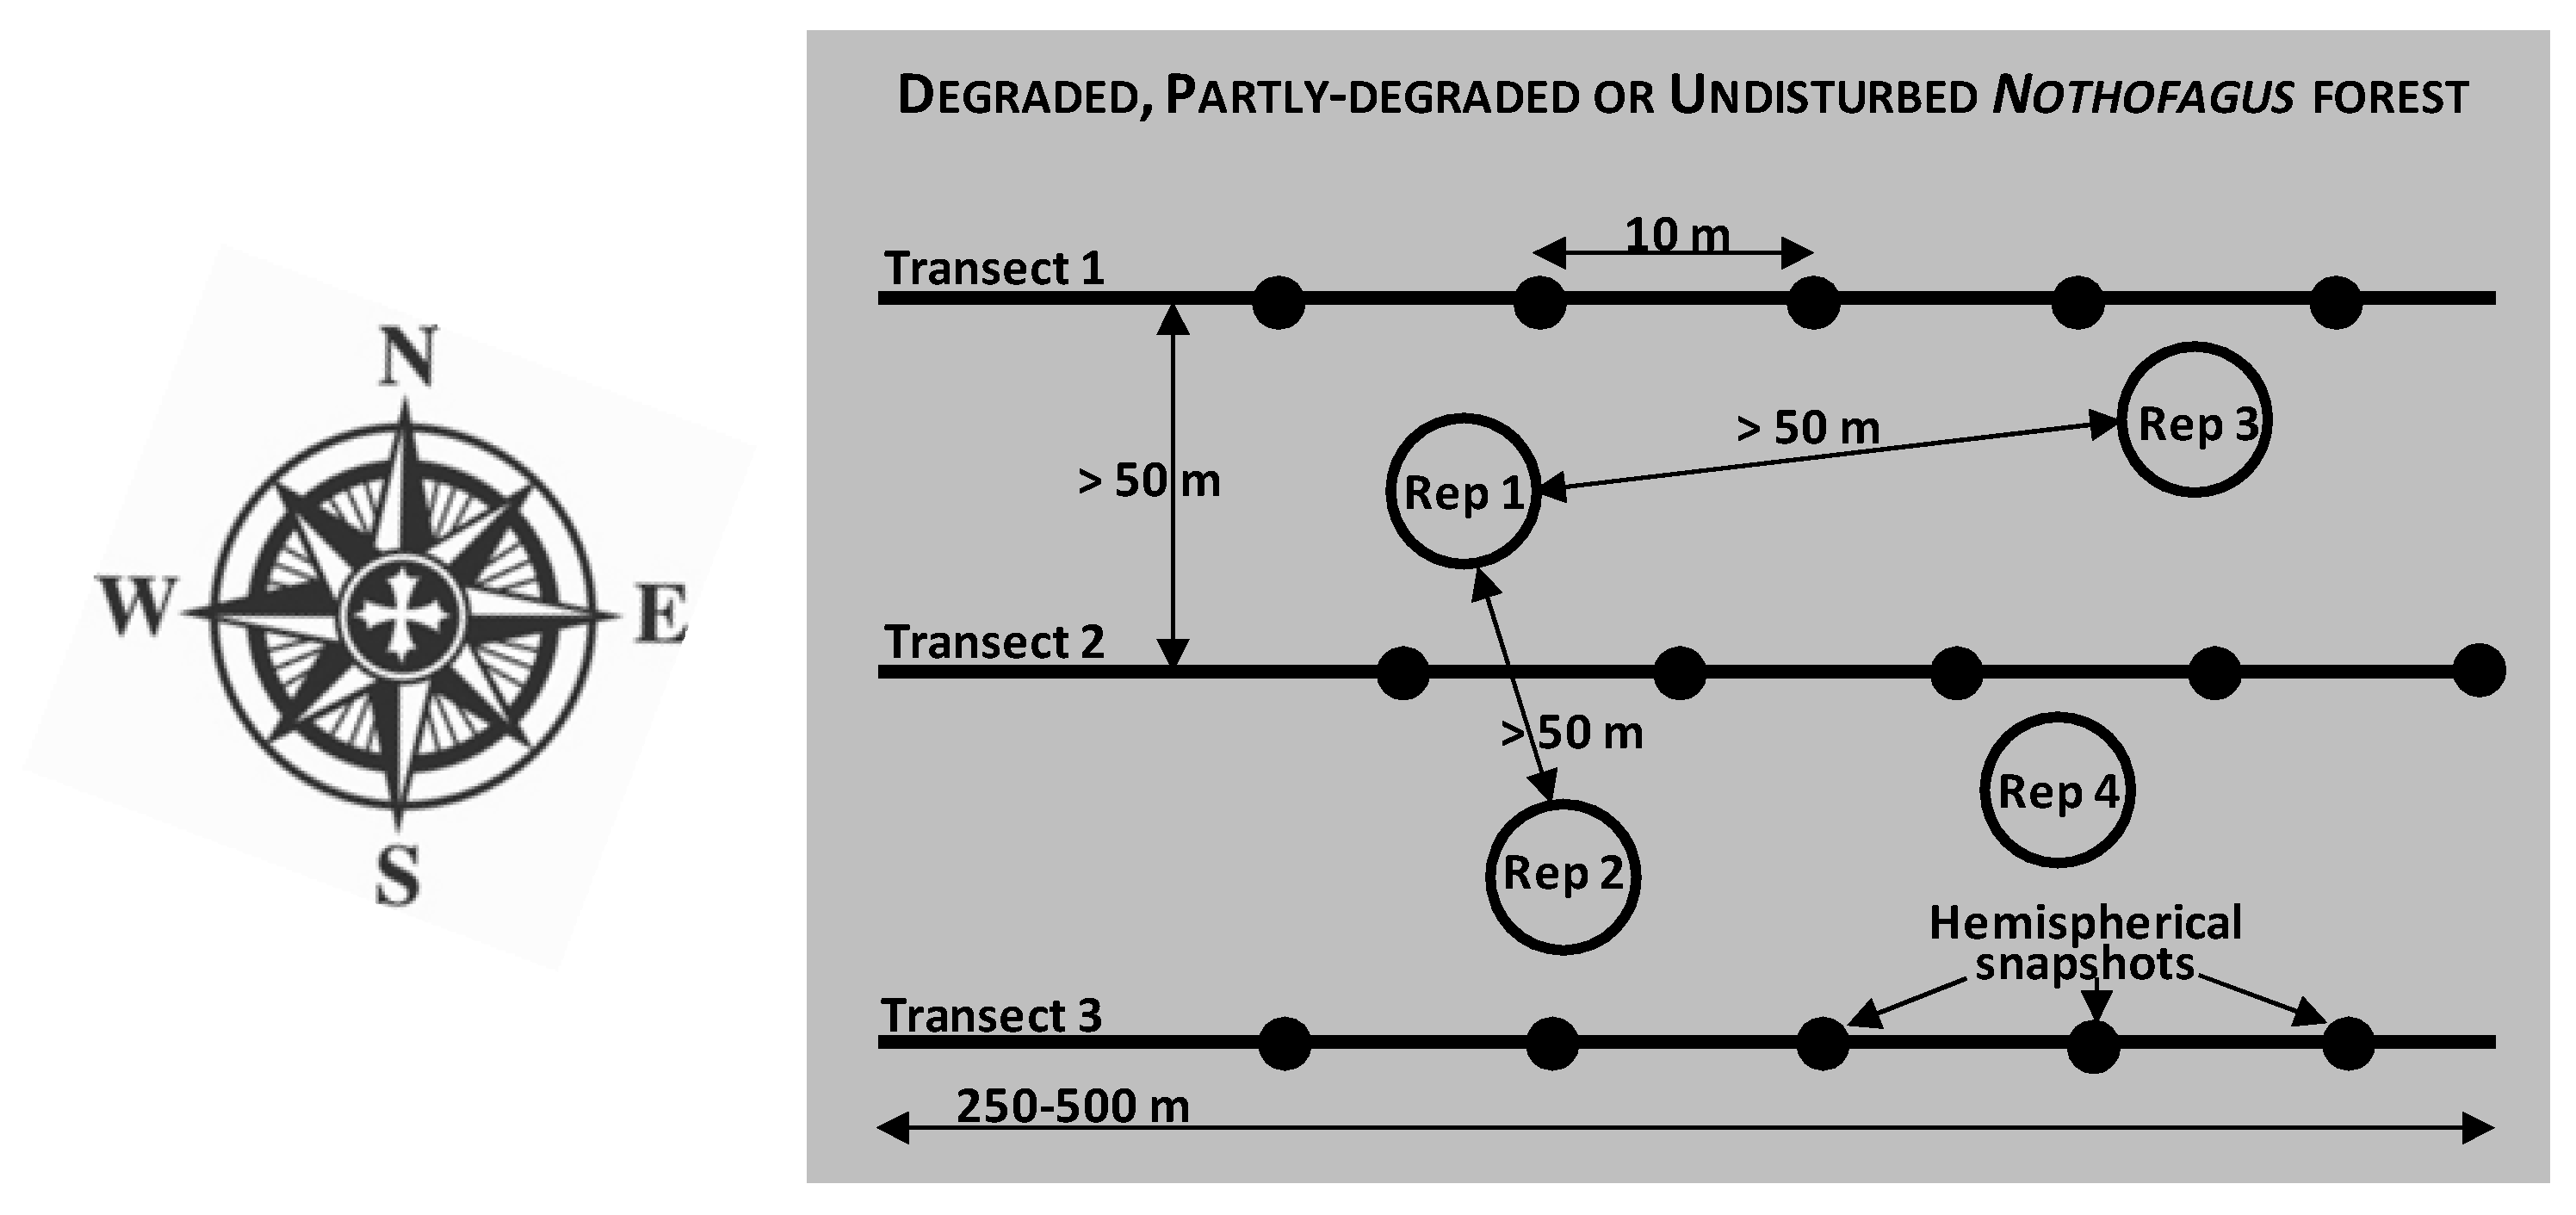
2.2. Sampling Strategy and Site Classification According to Degradation Status
2.3. Forest Biomass and Determination of C Stock
2.4. Soil Analysis
2.5. Physical Fractionation of Soil Organic Matter
2.6. Century Model Calibration
2.7. Statistical Analysis
3. Results
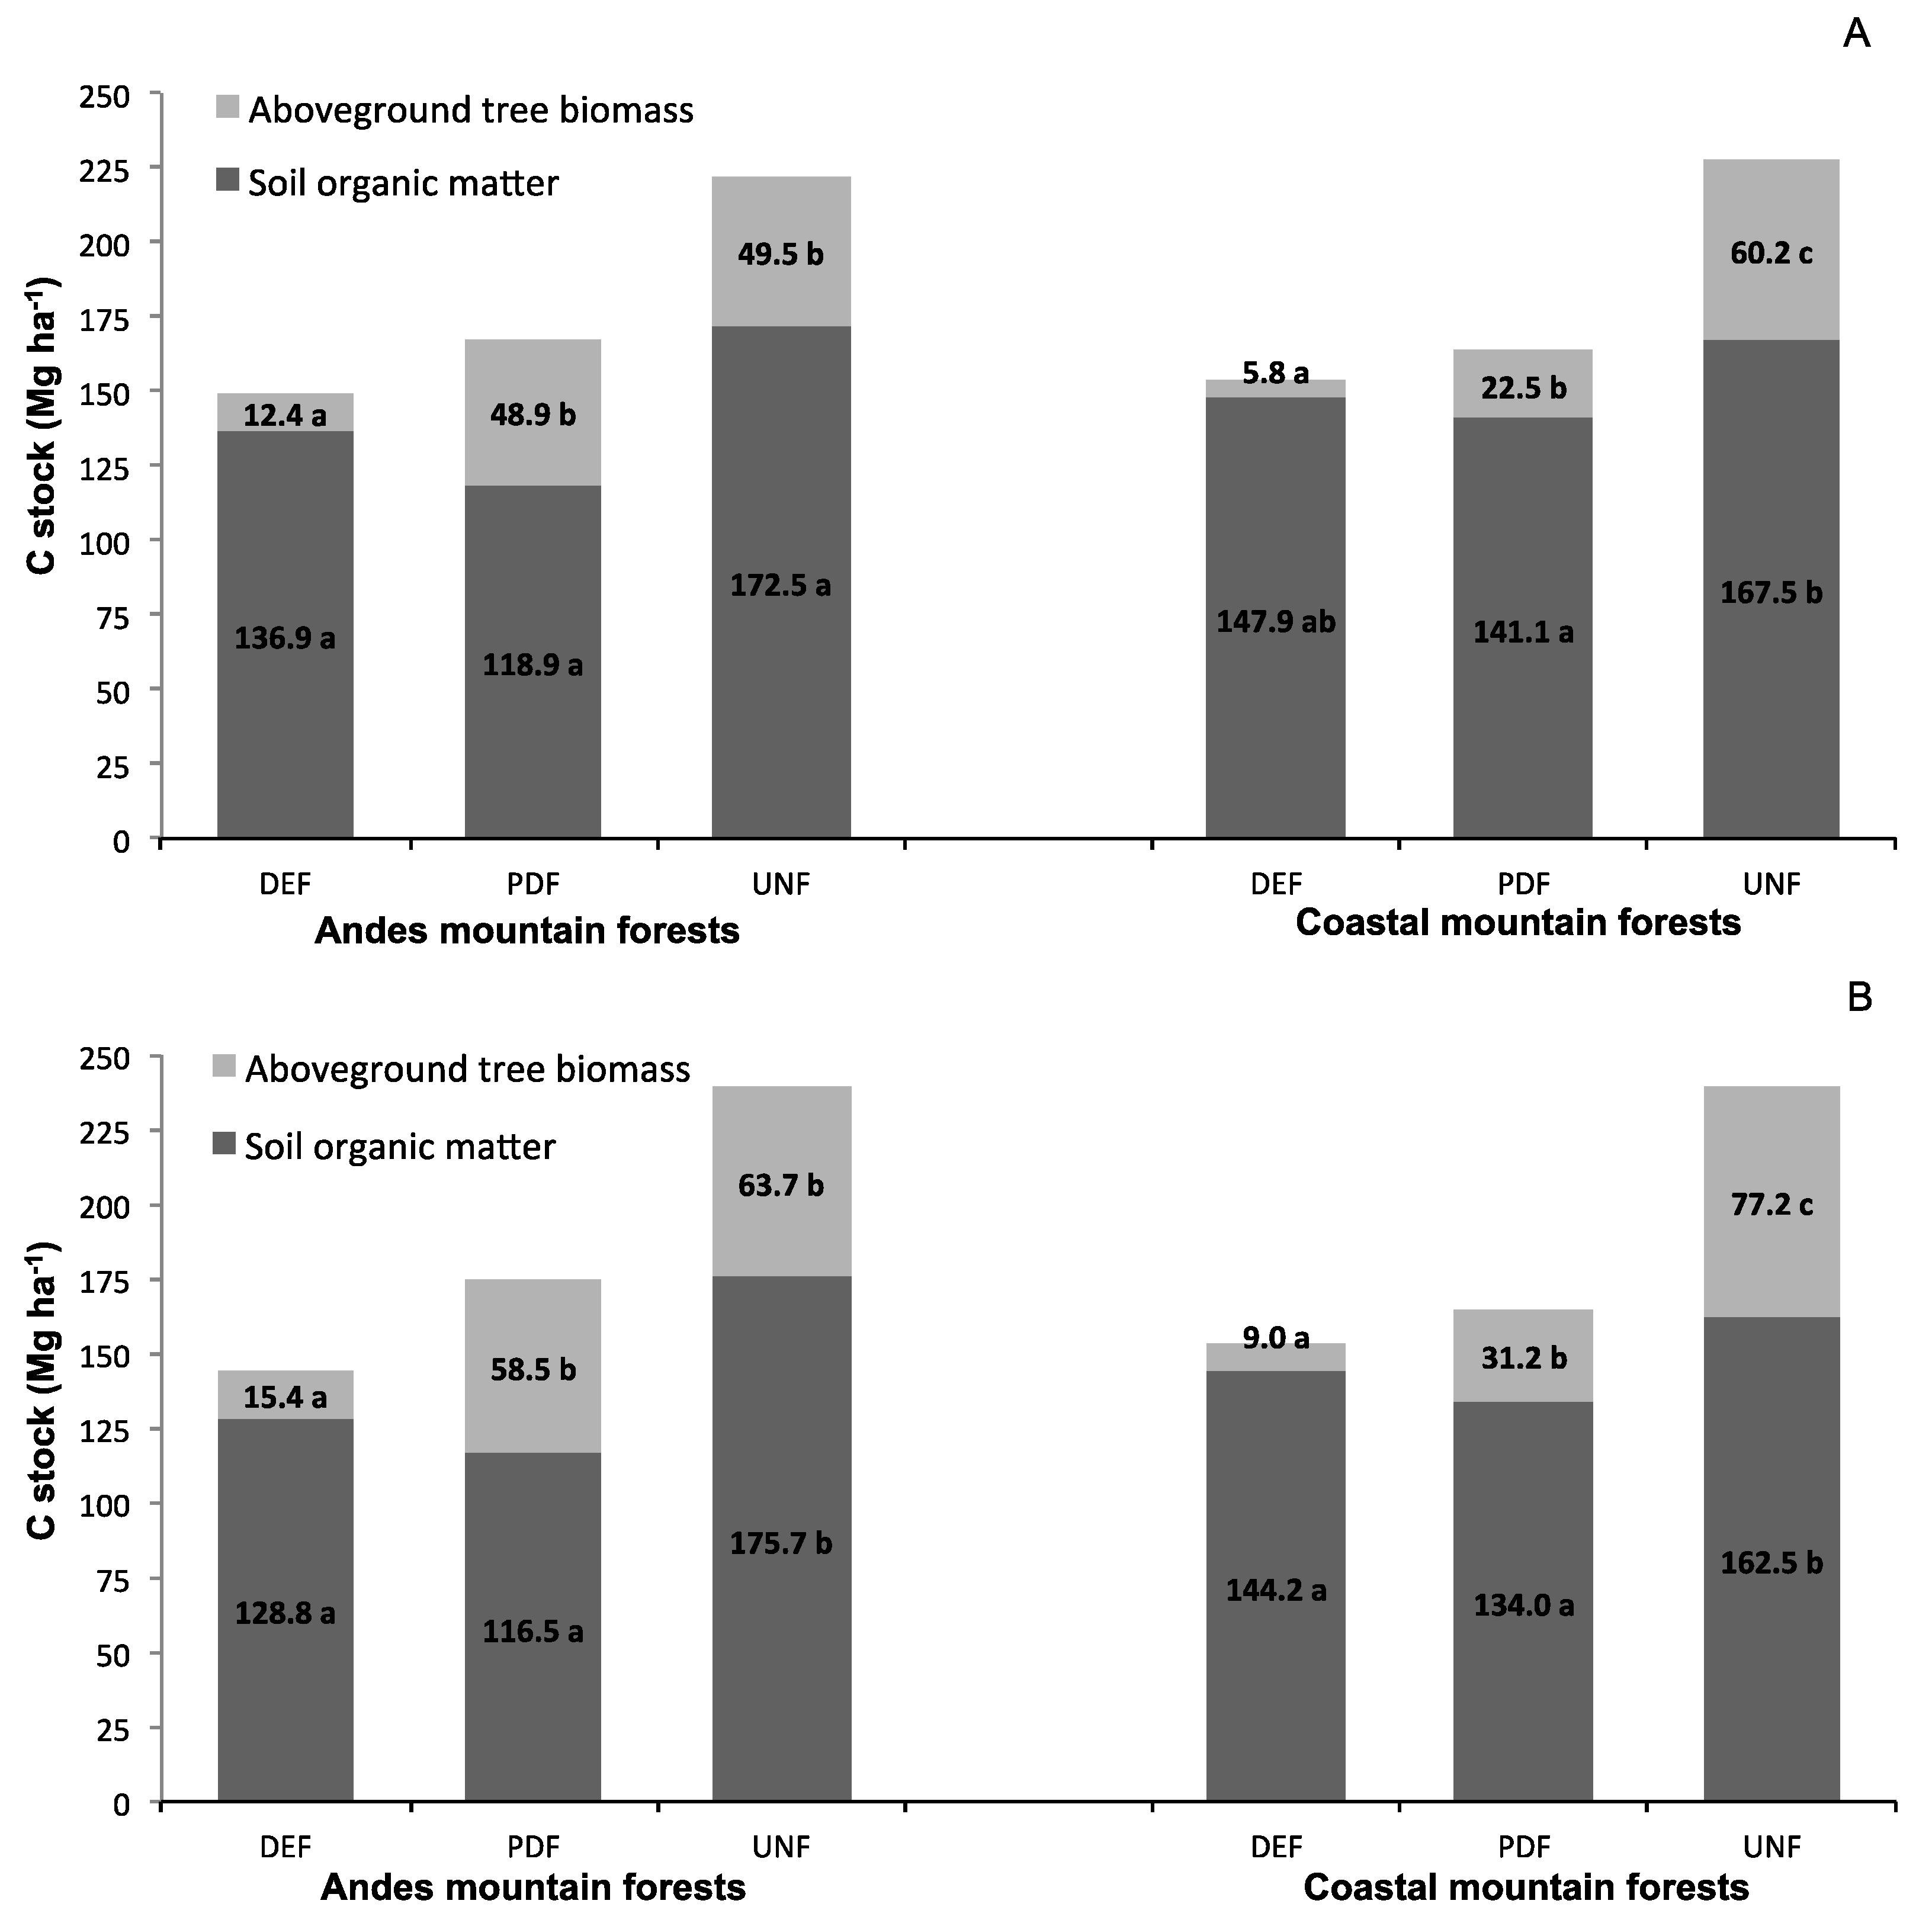
3.1. C Stocks in Tree Biomass and Soil
3.2. Soil Bulk Density
3.3. C concentrations in Soil Fractions
3.3.1. Andean Mountain Forests
3.3.2. Coastal Mountain Forests
3.4. Century Model Simulations
4. Discussion
4.1. C Stocks in Tree Biomass and Soil
4.2. Soil Bulk Density
4.3. C Concentrations in Soil Fractions
4.4. Century Model Simulations
5. Conclusions
Acknowledgments
Author Contributions
Conflicts of Interest
References
- Dube, F.; Espinosa, M.; Stolpe, N.; Zagal, E.; Thevathasan, N.V.; Gordon, A.M. Productivity and carbon storage in silvopastoral systems with Pinus ponderosa and Trifolium spp., plantations and pasture on an Andisol in Patagonia, Chile. Agrofor. Syst. 2012, 86, 113–128. [Google Scholar] [CrossRef]
- Krull, E.S.; Baldock, J.A.; Skjemstad, J.O. Importance of mechanism and processes of the stabilization of soil organic matter for modeling carbon turnover. Funct. Plant Biol. 2003, 30, 207–222. [Google Scholar] [CrossRef]
- Stolpe, N.; Muñoz, C.; Zagal, E.; Ovalle, C. Modeling soil carbon storage in the Espinal agroecosystem of central Chile. Arid Land Res. Manag. 2008, 22, 148–158. [Google Scholar] [CrossRef]
- Carter, M. Soil quality for sustainable land management: Organic matter and aggregation interactions that maintain soil functions. Agron. J. 2002, 94, 38–47. [Google Scholar] [CrossRef]
- Parton, W.J.; Schimel, D.S.; Cole, C.V.; Ojima, D.S. Analysis of factors controlling soil organic matter levels in Great Plains grasslands. Soil Sci. Soc. Am. J. 1987, 51, 1173–1179. [Google Scholar] [CrossRef]
- Del Pozo, A.; Del Canto, P. Áreas agro Climáticas Productivas en la VII y VIII Regiones; Instituto de Investigaciones Agropecuarias, CRI-Quilamapu, Ministerio de Agricultura: Santiago, Chile, 1999. [Google Scholar]
- Stolpe, N. Century simulated organic carbon content in soils of south central Chile with diverse ratios of 1500 kPa water to measured clay. Acta Agric. Scand. Sec. B Plant Soil Sci. 2013, 63, 11–18. [Google Scholar] [CrossRef]
- Instituto Forestal (INFOR). Desarrollo de Tecnología Silvícola Productiva como Apoyo para la Implementación de la Ley de Bosque Nativo. Anexo 6. Elaboración de Pautas Silvícolas de Manejo para Renovales; INNOVA/CORFO-09CN14-5854; INFOR: Valdivia, Chile, 2012; pp. 1–28. [Google Scholar]
- Dube, F.; Sotomayor, A.; Loewe, V.; Müller-Using, B.; Stolpe, N.; Zagal, E.; Doussoulin, M. Silvopastoral systems in temperate zones of Chile. In Silvopastoral Systems in Southern South America; Peri, P.L., Dube, F., Varella, A.C., Eds.; Springer: Dordrecht, The Netherlands, 2016; Volume 11, pp. 183–211. [Google Scholar]
- Müller-Using, B.; University of Concepción, Faculty of Forest Sciences, Concepción, VIII Region, Chile. Personal communication, 2012.
- Ortega, R.; Rodríguez, I. Manual de Gestión del Medio Ambiente; Mapfre: Santiago, Chile, 1994; pp. 1–343. [Google Scholar]
- Instituto Geográfico Militar (IGM). Atlas Geográfico de Chile; Instituto Geográfico Militar: Santiago, Chile, 2005; pp. 1–208. [Google Scholar]
- Nations Online Project. One World Nations Online—Countries in the World Satellite Maps. Available online: http://www.nationsonline.org/oneworld/map/chile-political-map.htm (accessed on 20 October 2016).
- Dirección General de Aeronáutica Civil (DGAC). Dirección Meteorológica de Chile; Dirección General de Aeronáutica Civil: Santiago, Chile; Available online: http://www.meteochile.gob.cl/climas/climas_octava_region.html (accessed on 1 March 2011).
- Centro de Informaciones de Recursos Naturales (CIREN). Descripciones de Suelos, Materiales, y Símbolos. Estudio Agrológico VIII Región de Chile; Centro de Informaciones de Recursos Naturales: Santiago, Chile, 1998.
- Stolpe, N. Descripción de los Principales Suelos de la VIII Región de Chile; Universidad de Concepción: Concepción, Chile, 2006. [Google Scholar]
- Soil Survey Staff. In Keys to Soil Taxonomy, 12th ed.Natural Resources Conservation Service, USDA: Washington, DC, USA, 2014.
- Bahamóndes, C.; Martin, M.; Müller-Using, S.; Rojas, J.; Vergara, G. Case Studies on Measuring and Assessing Forest Degradation—An Operational Approach to Forest Degradation; Forest Resources Assessment Working Paper No. 158; FAO: Roma, Italy, 2009; pp. 1–9. [Google Scholar]
- Annighöfer, P.; Beckschäfer, P.; Vor, T.; Ammer, C. Regeneration patterns of European oak species (Quercus petraea (Matt.) Liebl., Quercus robur L.) in dependence of environment and neighborhood. PLoS ONE 2015, 10, e0134935. [Google Scholar]
- Corporación Nacional Forestal (CONAF). Funciones Alométricas para la Determinación de Existencias de Carbono Forestal para la Especie Nothofagus Obliqua (Mirb.) Oerst; Ministerio de Agricultura: Santiago, Chile, 2013; pp. 1–41.
- Intergovernmental Panel on Climate Change (IPCC). Climate change 2001: The scientific basis. In Contribution of Working Group I to the Third Assessment Report of the Intergovernmental Panel on Climate Change; Houghton, J.T., Ding, Y., Griggs, D.J., Noguer, M., van der Linden, P.J., Dai, X., Mashell, K., Johnson, C.A., Eds.; Cambridge University Press: Cambridge, UK, 2001; pp. 1–881. [Google Scholar]
- Blake, G.R. Bulk density. In Methods of Soil Analysis, Part 1; Black, C.A., Ed.; American Society of Agronomy: Madison, WI, USA, 1965; pp. 374–390. [Google Scholar]
- Feller, C.; Burtin, G.; Gérard, B.; Balesdent, J. Utilisation des résines sodiques et des ultrasons dans le fractionnement granulométrique de la matière organique des sols: Intérêts et limites. Sciences du Sol 1991, 29, 77–94. [Google Scholar]
- Balesdent, J.; Pétraud, J.; Feller, C. Effect of ultrasound on the granulometric distribution of organic matter in soil. Science du Sol 1991, 29, 95–106. [Google Scholar]
- Dube, F.; Zagal, E.; Stolpe, N.; Espinosa, M. The influence of land use change on the organic carbon distribution and microbial respiration in a volcanic soil of the Chilean Patagonia. For. Ecol. Manag. 2009, 257, 1695–1704. [Google Scholar] [CrossRef]
- Stolpe, N.; Dube, F.; Zagal, E. Calibration of CO2FIX to native forest, pine plantation, and pasture on a volcanic soil of the Chilean Patagonia. Acta Agric. Scand. Sec. B Soil Plant Sci. 2010, 60, 235–244. [Google Scholar] [CrossRef]
- Wright, A.F.; Bailey, J.S. Organic carbon, total carbon, and total nitrogen determinations in soils of variable calcium carbonate contents using a LECO CN-2000 dry combustion analyzer. Commun. Soil Sci. Plant Anal. 2001, 32, 3243–3258. [Google Scholar] [CrossRef]
- Metherell, A.K.; Harding, L.A.; Cole, C.V.; Parton, W.J. Century Organic Matter Model Environment, Technical Documentation; Great Plains System Research Unit, Technical Report No 4; USDA-ARS: Fort Collins, CO, USA, 1993.
- DMC. Dirección Meteorológica de Chile. Meteorological Service of Chile, Santiago, Chile. 2015. Available online: www.meteochile.gob.cl (accessed on 1 March 2015).
- Godoy, R.; Paulino, L.; Oyarzún, C.; Boeckx, P. Atmospheric N deposition in central and southern Chile. An overview. Gayana Bot. 2003, 60, 47–53. [Google Scholar] [CrossRef]
- Kelly, R.H.; Parton, W.J.; Crocker, G.H.; Grace, P.R.; Klir, J.; Körschens, M.; Poulton, P.R.; Richter, D.D. Simulating trends in soil organic carbon in long-term experiments using the Century model. Geoderma 1997, 81, 75–90. [Google Scholar] [CrossRef]
- SAS Institute Inc. SAS User’s Guide: Statistics; SAS Institute Inc.: Cary, NC, USA, 2002. [Google Scholar]
- Stolpe, N.B.; Soils and Natural Resources Department, Faculty of Agronomy, University of Concepción, Vicente Méndez 595, Casilla 537, Chillan, Chile. Century model simulations in native forests of Chile. Unpublished data. 2016. [Google Scholar]
- Beckert, M.R.; Smith, P.; Lilly, A.; Chapman, S.J. Soil and tree biomass carbon sequestration potential of silvopastoral and woodland-pasture systems in North East Scotland. Agrofor. Syst. 2016, 90, 371–383. [Google Scholar] [CrossRef]
- Panichini, M.; Matus, F.; Mora, M.L.; Godoy, R.; Bolan, N.S.; Rumpel, C. Carbon distribution in top- and subsoil horizons of two contrasting Andisol under pasture or forest. Eur. J. Soil Sci. 2012, 63, 616–624. [Google Scholar] [CrossRef]
- Huygens, D.; Boeckx, P.; Van Cleemput, O.; Oyarzun, C.; Godoy, R. Aggregate and soil organic carbon dynamics in South Chilean Andisols. Biogeosciences 2005, 2, 159–174. [Google Scholar] [CrossRef]
- Zagal, E.; Rodríguez, N.; Vidal, I.; Flores, B. Soil light organic matter of a volcanic soil under different agronomic management as an indicator of changes in labile organic matter. Agric. Téc. 2002, 62, 284–296. [Google Scholar]
- Peichl, M.; Thevathasan, N.V.; Gordon, A.M.; Huss, J.; Abohassan, R. Carbon sequestration potentials in temperate tree-based intercropping systems, southern Ontario, Canada. Agrofor. Syst. 2006, 66, 243–257. [Google Scholar] [CrossRef]
- Dube, F.; Thevathasan, N.V.; Stolpe, N.; Espinosa, M.; Zagal, E.; Gordon, A.M. Selected carbon fluxes in Pinus ponderosa-based silvopastoral systems, exotic plantations and natural pastures on volcanic soils in the Chilean Patagonia. Agrofor. Syst. 2013, 87, 525–542. [Google Scholar] [CrossRef]
- Kirsten, M.; Kaaya, A.; Klinger, T.; Feger, K.-H. Stocks of soil organic carbon in forest ecosystems of the eastern Usambara mountains, Tanzania. Catena 2016, 137, 651–659. [Google Scholar] [CrossRef]
- Morales-Barquero, L.; Skutsch, M.; Jardel-Peláez, E.J.; Ghilardi, A.; Kleinn, C.; Healey, J.R. Operationalizing the definition of forest degradation for REDD+, with application to Mexico forests. Forests 2014, 5, 1653–1681. [Google Scholar] [CrossRef]
- Wen-Jie, W.; Ling, Q.; Yuan-Gang, J.; Dong-Xue, S.; Jing, A.; Hong-Yan, W.; Guan-Yu, Z.; Wei, S.; Xi-Quan, C. Changes in soil organic carbon, nitrogen, pH and bulk density with the development of larch (Larix gmelinii) plantations in China. Glob. Chang. Biol. 2011, 17, 2657–2676. [Google Scholar] [CrossRef]
- Candan, F.; Broquen, P. Aggregate stability and related properties in NW Patagonian Andisols. Geoderma 2009, 154, 42–47. [Google Scholar] [CrossRef]
- Dorner, J.; Sandoval, P.; Dec, D. The role of soil structure on the pore functionality of an Ultisol. J. Soil Sci. Plant Nutr. 2010, 10, 495–508. [Google Scholar] [CrossRef]
- Shoji, S.; Nanzyo, M.; Dahlgren, R. Volcanic Ash Soils, Genesis, Properties and Utilization; Elsevier: New York, NY, USA, 1993; pp. 1–288. [Google Scholar]
- Wäldchen, J.; Schulze, E.D.; Schöning, I.; Schrumpf, M.; Sierra, C. The influence of changes in forest management over the past 200 years on present soil organic carbon stocks. For. Ecol. Manag. 2013, 289, 243–254. [Google Scholar] [CrossRef]
- Zagal, E.; Córdova, C. Soil organic matter quality indicators in a cultivated Andisol. Agric. Téc. 2005, 65, 186–197. [Google Scholar]
- Dube, F.; Department of Silviculture, Faculty of Forest Sciences, University of Concepción, Concepción, Chile. Carbon loss and degradation indicators in Nothofagus forests of the Andes and Coastal range in Mediterranean Chile. Unpublished data. 2016. [Google Scholar]
- Lu, G.; Sakagami, K.; Tanaka, H.; Hamada, R. Role of soil organic matter in stabilization of water-stable aggregates in soils under different types of land uses. Soil Sci. Plant Nutr. 1998, 44, 147–155. [Google Scholar] [CrossRef]
- Dube, F.; Department of Silviculture, Faculty of Forest Sciences, University of Concepción, Concepción, Chile. Degradación de bosques de Nothofagus obliqua, su efecto en el suelo y su contribución al cambio climático. Unpublished data. 2016. [Google Scholar]
- Sohi, S.P.; Mahieu, N.; Arah, J.R.M.; Powlson, D.S.; Madari, B.; Gaunt, J.L. A procedure for isolating soil organic matter fractions suitable for modeling. Soil Sci. Soc. Am. J. 2001, 65, 1121–1128. [Google Scholar] [CrossRef]
- Smith, J.U.; Smith, P.; Monaghan, R.; MacDonald, A.J. When is a measured soil organic matter fraction equivalent to a model pool? Eur. J. Soil Sci. 2002, 53, 405–416. [Google Scholar] [CrossRef]
- Smith, P. Monitoring and verification of soil carbon changes under Article 3.4 of the Kyoto Protocol. Soil Use Manag. 2004, 20, 264–270. [Google Scholar] [CrossRef]
- Magrin, G.O.; Marengo, J.A.; Boulanger, J.-P.; Buckeridge, M.S.; Castellanos, E.; Poveda, G.; Scarano, F.R.; Vicuña, S. Central and South America. In Climate Change 2014: Impacts, Adaptation, and Vulnerability. Part B: Regional Aspects. Contribution of Working Group II to the Fifth Assessment Report of the Intergovernmental Panel on Climate Change; Barros, V.R., Field, C.B., Dokken, D.J., Mastrandrea, M.D., Mach, K.J., Bilir, T.E., Chatterjee, M., Ebi, K.L., Estrada, Y.O., Genova, R.C., et al., Eds.; Cambridge University Press: Cambridge, UK; New York, NY, USA, 2014; pp. 1499–1566. [Google Scholar]

| Site | Condition | Species | Stocking Density | Range of Diameters | Mean DBH (cm) | Basal Area (m2·ha−1) | Mean HT (m) | |||
|---|---|---|---|---|---|---|---|---|---|---|
| (Stems·ha−1) | (cm) | 2013 | 2015 | 2013 | 2015 | 2013 | 2015 | |||
| Andes | DEF | Nothofagus obliqua | 140 | 5–20, 25–35 | 20.5 | 21.6 | 4.8 | 5.3 | 15.7 | 17.9 |
| Nothofagus nervosa | 40–45, 50–55 | |||||||||
| Gevuina avellana | ||||||||||
| Laurelia sempervirens | ||||||||||
| Lomatia hirsuta | ||||||||||
| Nothofagus obliqua | 550 | 5–45, 50–55 | 21.6 | 22.5 | 19.8 | 21.3 | 14.5 | 16.4 | ||
| Nothofagus nervosa | ||||||||||
| Drimys winterii | ||||||||||
| Gevuina avellana | ||||||||||
| Laurelia sempervirens | ||||||||||
| Lomatia hirsuta | ||||||||||
| Persea lingue | ||||||||||
| Podocarpus saligna | ||||||||||
| UNF | Nothofagus obliqua | 440 | 5–70 | 21.9 | 23.5 | 16.3 | 18.8 | 17.9 | 20.5 | |
| Nothofagus nervosa | ||||||||||
| Nothofagus dombeyi | ||||||||||
| Aristotelia chilensis | ||||||||||
| Cryptocarya alba | ||||||||||
| Drimys winterii | ||||||||||
| Gevuina avellana | ||||||||||
| Laurelia sempervirens | ||||||||||
| Lomatia dentata | ||||||||||
| Luma apiculata | ||||||||||
| Persea lingue | ||||||||||
| Podocarpus saligna | ||||||||||
| Coast | DEF | Nothofagus obliqua | 440 | 5–20, 30–35 | 8.5 | 9.0 | 3.3 | 3.7 | 10.5 | 11.7 |
| Gevuina avellana | ||||||||||
| Lomatia hirsuta | ||||||||||
| Nothofagus obliqua | 770 | 5–30 | 13.5 | 14.1 | 7.8 | 8.6 | 11.4 | 13.2 | ||
| Gevuina avellana | ||||||||||
| Laurelia sempervirens | ||||||||||
| Lomatia dentata | ||||||||||
| Lomatia hirsuta | ||||||||||
| Persea lingue | ||||||||||
| UNF | Nothofagus obliqua | 840 | 5–45 | 17.4 | 18.4 | 19.8 | 22.0 | 15.8 | 18.4 | |
| Nothofagus nervosa | ||||||||||
| Nothofagus dombeyi | ||||||||||
| Aristotelia chilensis | ||||||||||
| Citronella mucronata | ||||||||||
| Cryptocarya alba | ||||||||||
| Drimys winterii | ||||||||||
| Gevuina avellana | ||||||||||
| Laurelia sempervirens | ||||||||||
| Lomatia dentata | ||||||||||
| Lomatia hirsuta | ||||||||||
| Luma apiculata | ||||||||||
| Persea lingue | ||||||||||
| Podocarpus saligna | ||||||||||
| Site | Condition | Depth | Bulk Density | Site | Condition | Depth | Bulk Density |
|---|---|---|---|---|---|---|---|
| (cm) | (g·cm−3) | (cm) | (g·cm−3) | ||||
| Andes | DEF | 0–5 | 0.96 ± 0.05 a A | Coast | DEF | 0–5 | 0.85 ± 0.08 a A |
| 5–20 | 0.84 ± 0.03 b AB | 5–20 | 1.02 ± 0.09 b A | ||||
| 20–40 | 0.80 ± 0.05 b A | 20–40 | 1.08 ± 0.03 b A | ||||
| 0–5 | 0.89 ± 0.12 a A | 0–5 | 1.13 ± 0.13 a B | ||||
| 5–20 | 0.98 ± 0.14 ab A | 5–20 | 1.02 ± 0.13 a A | ||||
| 20–40 | 1.22 ± 0.19 b B | 20–40 | 1.00 ± 0.11 a AB | ||||
| UNF | 0–5 | 0.70 ± 0.04 a B | UNF | 0–5 | 0.73 ± 0.03 a C | ||
| 5–20 | 0.80 ± 0.02 b B | 5–20 | 0.88 ± 0.24 ab A | ||||
| 20–40 | 0.86 ± 0.04 b A | 20–40 | 0.93 ± 0.09 b B |
| Year | Depth (cm) | Level of Degradation | Organic C (%) | |||
|---|---|---|---|---|---|---|
| Soil Fraction | ||||||
| Light Fraction (LF) | >212 μm | 212–53 μm | <53 μm | |||
| 2013 | 0–5 | DEF | 31.26 ± 0.34 a A a′ | 1.32 ± 0.06 a E a′ | 4.53 ± 0.28 a BCDE a′ | 7.48 ± 0.28 a B a′ |
| 33.37 ± 2.68 ab A a′ | 1.34 ± 0.70 ab B a′ | 5.15 ± 1.78 a B a′ | 6.92 ± 1.68 a B a′ | |||
| UNF | 37.19 ± 0.53 b A a′ | 2.95 ± 0.06 b F a′ | 6.73 ± 1.69 a CDE a′ | 8.27 ± 0.04 a C a′ | ||
| 5–20 | DEF | 33.56 ± 0.08 a A a′ | 1.40 ± 0.16 a E a′ | 2.94 ± 0.52 a CDE a′ | 6.14 ± 0.19 a BC a′ | |
| 32.43 ± 3.08 ab A a′ | 1.10 ± 0.85 a B a′ | 2.33 ± 1.31 a B a′ | 4.48 ± 3.20 ab B a′ | |||
| UNF | 35.83 ± 0.10 b A a′ | 2.43 ± 0.69 a F a′ | 4.66 ± 0.85 a DEF a′ | 7.20 ± 0.04 b CD a′ | ||
| 20–40 | DEF | 31.70 ± 2.91 a A a′ | 1.62 ± 0.80 a DE a′ | 2.49 ± 0.54 a CDE a′ | 5.17 ± 0.37 a BCD a′ | |
| 36.61 ± 4.25 a A a′ | 0.62 ± 0.75 a B a′ | 1.24 ± 1.40 a B a′ | 2.72 ± 3.12 a B a′ | |||
| UNF | 30.33 ± 0.18 a B a′ | 2.12 ± 1.49 a F a′ | 3.28 ± 1.31 a EF a′ | 5.07 ± 1.16 a CDEF a′ | ||
| 2015 | 0–5 | DEF | 31.29 ± 1.82 a A a′ | 0.73 ± 0.00 a D b′ | 5.19 ± 1.13 a BC a′ | 7.47 ± 1.32 a B a′ |
| 33.20 ± 2.11 a A a′ | 0.82 ± 0.28 a DE a′ | 5.43 ± 0.63 a BC a′ | 7.20 ± 0.69 a B a′ | |||
| UNF | 35.41 ± 2.35 a A a′ | 1.36 ± 0.18 b BC b′ | 8.79 ± 2.80 a B a′ | 8.10 ± 2.32 a BC a′ | ||
| 5–20 | DEF | 31.95 ± 1.29 a A a′ | 0.69 ± 0.04 a D b′ | 3.42 ± 0.40 a CD a′ | 5.86 ± 0.13 a BC a′ | |
| 30.93 ± 0.37 a A a′ | 0.45 ± 0.06 b E a′ | 1.98 ± 0.24 b CDE a′ | 4.13 ± 0.98 b BCD a′ | |||
| UNF | 33.78 ± 2.71 a A a′ | 1.26 ± 0.18 c BC b′ | 5.44 ± 1.21 c BC a′ | 6.75 ± 0.72 c BC a′ | ||
| 20–40 | DEF | 33.10 ± 1.58 a A a′ | 0.55 ± 0.10 ab D a′ | 2.42 ± 0.21 a CD a′ | 4.50 ± 0.04 a BC a′ | |
| 32.61 ± 1.18 a A a′ | 0.34 ± 0.07 a E a′ | 1.07 ± 0.53 a DE a′ | 2.71 ± 1.43 a CDE a′ | |||
| UNF | 33.70 ± 4.02 a A a′ | 0.95 ± 0.12 b C a′ | 3.39 ± 0.10 b BC a′ | 4.66 ± 0.24 a BC a′ | ||
| Year | Depth (cm) | Level of Degradation | Organic C (%) | |||
|---|---|---|---|---|---|---|
| Soil Fraction | ||||||
| Light Fraction (LF) | >212 μm | 212–53 μm | <53 μm | |||
| 2013 | 0–5 | DEF | 31.63 ± 2.72 a A a′ | 1.18 ± 0.26 a BC a′ | 5.70 ± 0.06 a BC a′ | 7.10 ± 0.18 a B a′ |
| 32.12 ± 2.64 a A a′ | 1.37 ± 0.06 a CD a′ | 5.16 ± 0.95 a BCD a′ | 7.26 ± 1.16 a B a′ | |||
| UNF | 37.29 ± 1.38 b A a′ | 1.26 ± 0.28 a D a′ | 7.29 ± 1.45 a B a′ | 8.32 ± 1.20 a B a′ | ||
| 5–20 | DEF | 29.91 ± 3.46 a A a′ | 1.52 ± 0.33 a BC a′ | 3.78 ± 0.41 a BC a′ | 6.34 ± 0.42 a BC a′ | |
| 31.24 ± 1.04 a A a′ | 1.15 ± 0.35 a CD a′ | 3.45 ± 1.82 a BCD a′ | 6.56 ± 1.95 a BC a′ | |||
| UNF | 37.23 ± 1.75 b A a′ | 1.40 ± 0.38 a D a′ | 4.71 ± 0.89 a BCD a′ | 7.31 ± 0.68 a B a′ | ||
| 20–40 | DEF | 35.35 ± 2.48 a A a′ | 0.76 ± 0.25 a C a′ | 1.99 ± 0.66 a BC a′ | 4.01 ± 0.70 a BC a′ | |
| 32.36 ± 0.08 a A a′ | 0.74 ± 0.40 a D a′ | 2.06 ± 1.21 a BCD a′ | 4.66 ± 1.83 ab BCD a′ | |||
| UNF | 36.57 ± 0.68 b A a′ | 0.93 ± 0.23 a D a′ | 3.22 ± 0.91 a CD a′ | 6.15 ± 0.99 b BC a′ | ||
| 2015 | 0–5 | DEF | 29.45 ± 1.73 a A a′ | 0.44 ± 0.05 a F b′ | 4.43 ± 0.02 a CD b′ | 7.95 ± 0.74 a B a′ |
| 31.78 ± 2.30 a A a′ | 0.83 ± 0.06 b DE b′ | 5.05 ± 1.49 a BCD a′ | 7.85 ± 1.15 a B a′ | |||
| UNF | 35.74 ± 0.58 b A a′ | 0.67 ± 0.13 ab BC b′ | 5.14 ± 1.97 a BC a′ | 7.95 ± 2.75 a B a′ | ||
| 5–20 | DEF | 30.54 ± 1.40 a A a′ | 0.60 ± 0.21 a EF b′ | 3.09 ± 0.43 a DEF a′ | 6.61 ± 0.48 a BC a′ | |
| 31.69 ± 1.08 a A a′ | 0.65 ± 0.04 a E b′ | 3.52 ± 0.65 a BCDE a′ | 6.77 ± 0.92 a BC a′ | |||
| UNF | 37.97 ± 1.36 b A a′ | 0.60 ± 0.12 a C b′ | 4.46 ± 2.17 a BC a′ | 7.48 ± 2.28 a BC a′ | ||
| 20–40 | DEF | 29.84 ± 1.26 a A b′ | 0.35 ± 0.04 a F b′ | 1.49 ± 0.14 a DEF a′ | 3.68 ± 0.63 a CDE a′ | |
| 33.28 ± 1.74 ab A a′ | 0.45 ± 0.18 a E a′ | 1.43 ± 0.08 a DE a′ | 3.48 ± 0.06 a CDE a′ | |||
| UNF | 35.74 ± 1.98 b A a′ | 0.54 ± 0.26 a C a′ | 3.15 ± 2.48 a BC a′ | 5.61 ± 2.63 a BC a′ | ||
| Site | Soil Order | Year | Century C (g·m−2, 0–20 cm Depth) | |||||
|---|---|---|---|---|---|---|---|---|
| Silvopastoral Management | Passive Pool | Slow Pool | Active Pool | Total C | (SOC) (%) | |||
| Andes | Andisol | 2016 | Traditional 1 | 3960 | 3227 | 238 | 7617 | (4.4) |
| 2066 | Improved 2 | 3979 | 3539 | 223 | 8119 | (4.7) | ||
| 2116 | Improved | 3986 | 3542 | 223 | 8130 | (4.7) | ||
| 2166 | Improved | 3991 | 3543 | 223 | 8136 | (4.7) | ||
| 2216 | Improved | 3997 | 3542 | 223 | 8142 | (4.7) | ||
| Coast | Ultisol | 2016 | Traditional 1 | 3938 | 4658 | 317 | 9225 | (4.7) |
| 2066 | Improved 2 | 3955 | 5487 | 325 | 10,179 | (5.2) | ||
| 2116 | Improved | 3990 | 5716 | 330 | 10,453 | (5.3) | ||
| 2166 | Improved | 4027 | 5750 | 331 | 10,533 | (5.4) | ||
| 2216 | Improved | 4060 | 5761 | 331 | 10,581 | (5.4) | ||
© 2016 by the authors; licensee MDPI, Basel, Switzerland. This article is an open access article distributed under the terms and conditions of the Creative Commons Attribution (CC-BY) license (http://creativecommons.org/licenses/by/4.0/).
Share and Cite
Dube, F.; Stolpe, N.B. SOM and Biomass C Stocks in Degraded and Undisturbed Andean and Coastal Nothofagus Forests of Southwestern South America. Forests 2016, 7, 320. https://doi.org/10.3390/f7120320
Dube F, Stolpe NB. SOM and Biomass C Stocks in Degraded and Undisturbed Andean and Coastal Nothofagus Forests of Southwestern South America. Forests. 2016; 7(12):320. https://doi.org/10.3390/f7120320
Chicago/Turabian StyleDube, Francis, and Neal B. Stolpe. 2016. "SOM and Biomass C Stocks in Degraded and Undisturbed Andean and Coastal Nothofagus Forests of Southwestern South America" Forests 7, no. 12: 320. https://doi.org/10.3390/f7120320
APA StyleDube, F., & Stolpe, N. B. (2016). SOM and Biomass C Stocks in Degraded and Undisturbed Andean and Coastal Nothofagus Forests of Southwestern South America. Forests, 7(12), 320. https://doi.org/10.3390/f7120320