
Available Nitrogen and Responses to Nitrogen Fertilizer in Brazilian Eucalypt Plantations on Soils of Contrasting Texture

 ,
, 
Abstract
:1. Introduction
2. Material and Methods
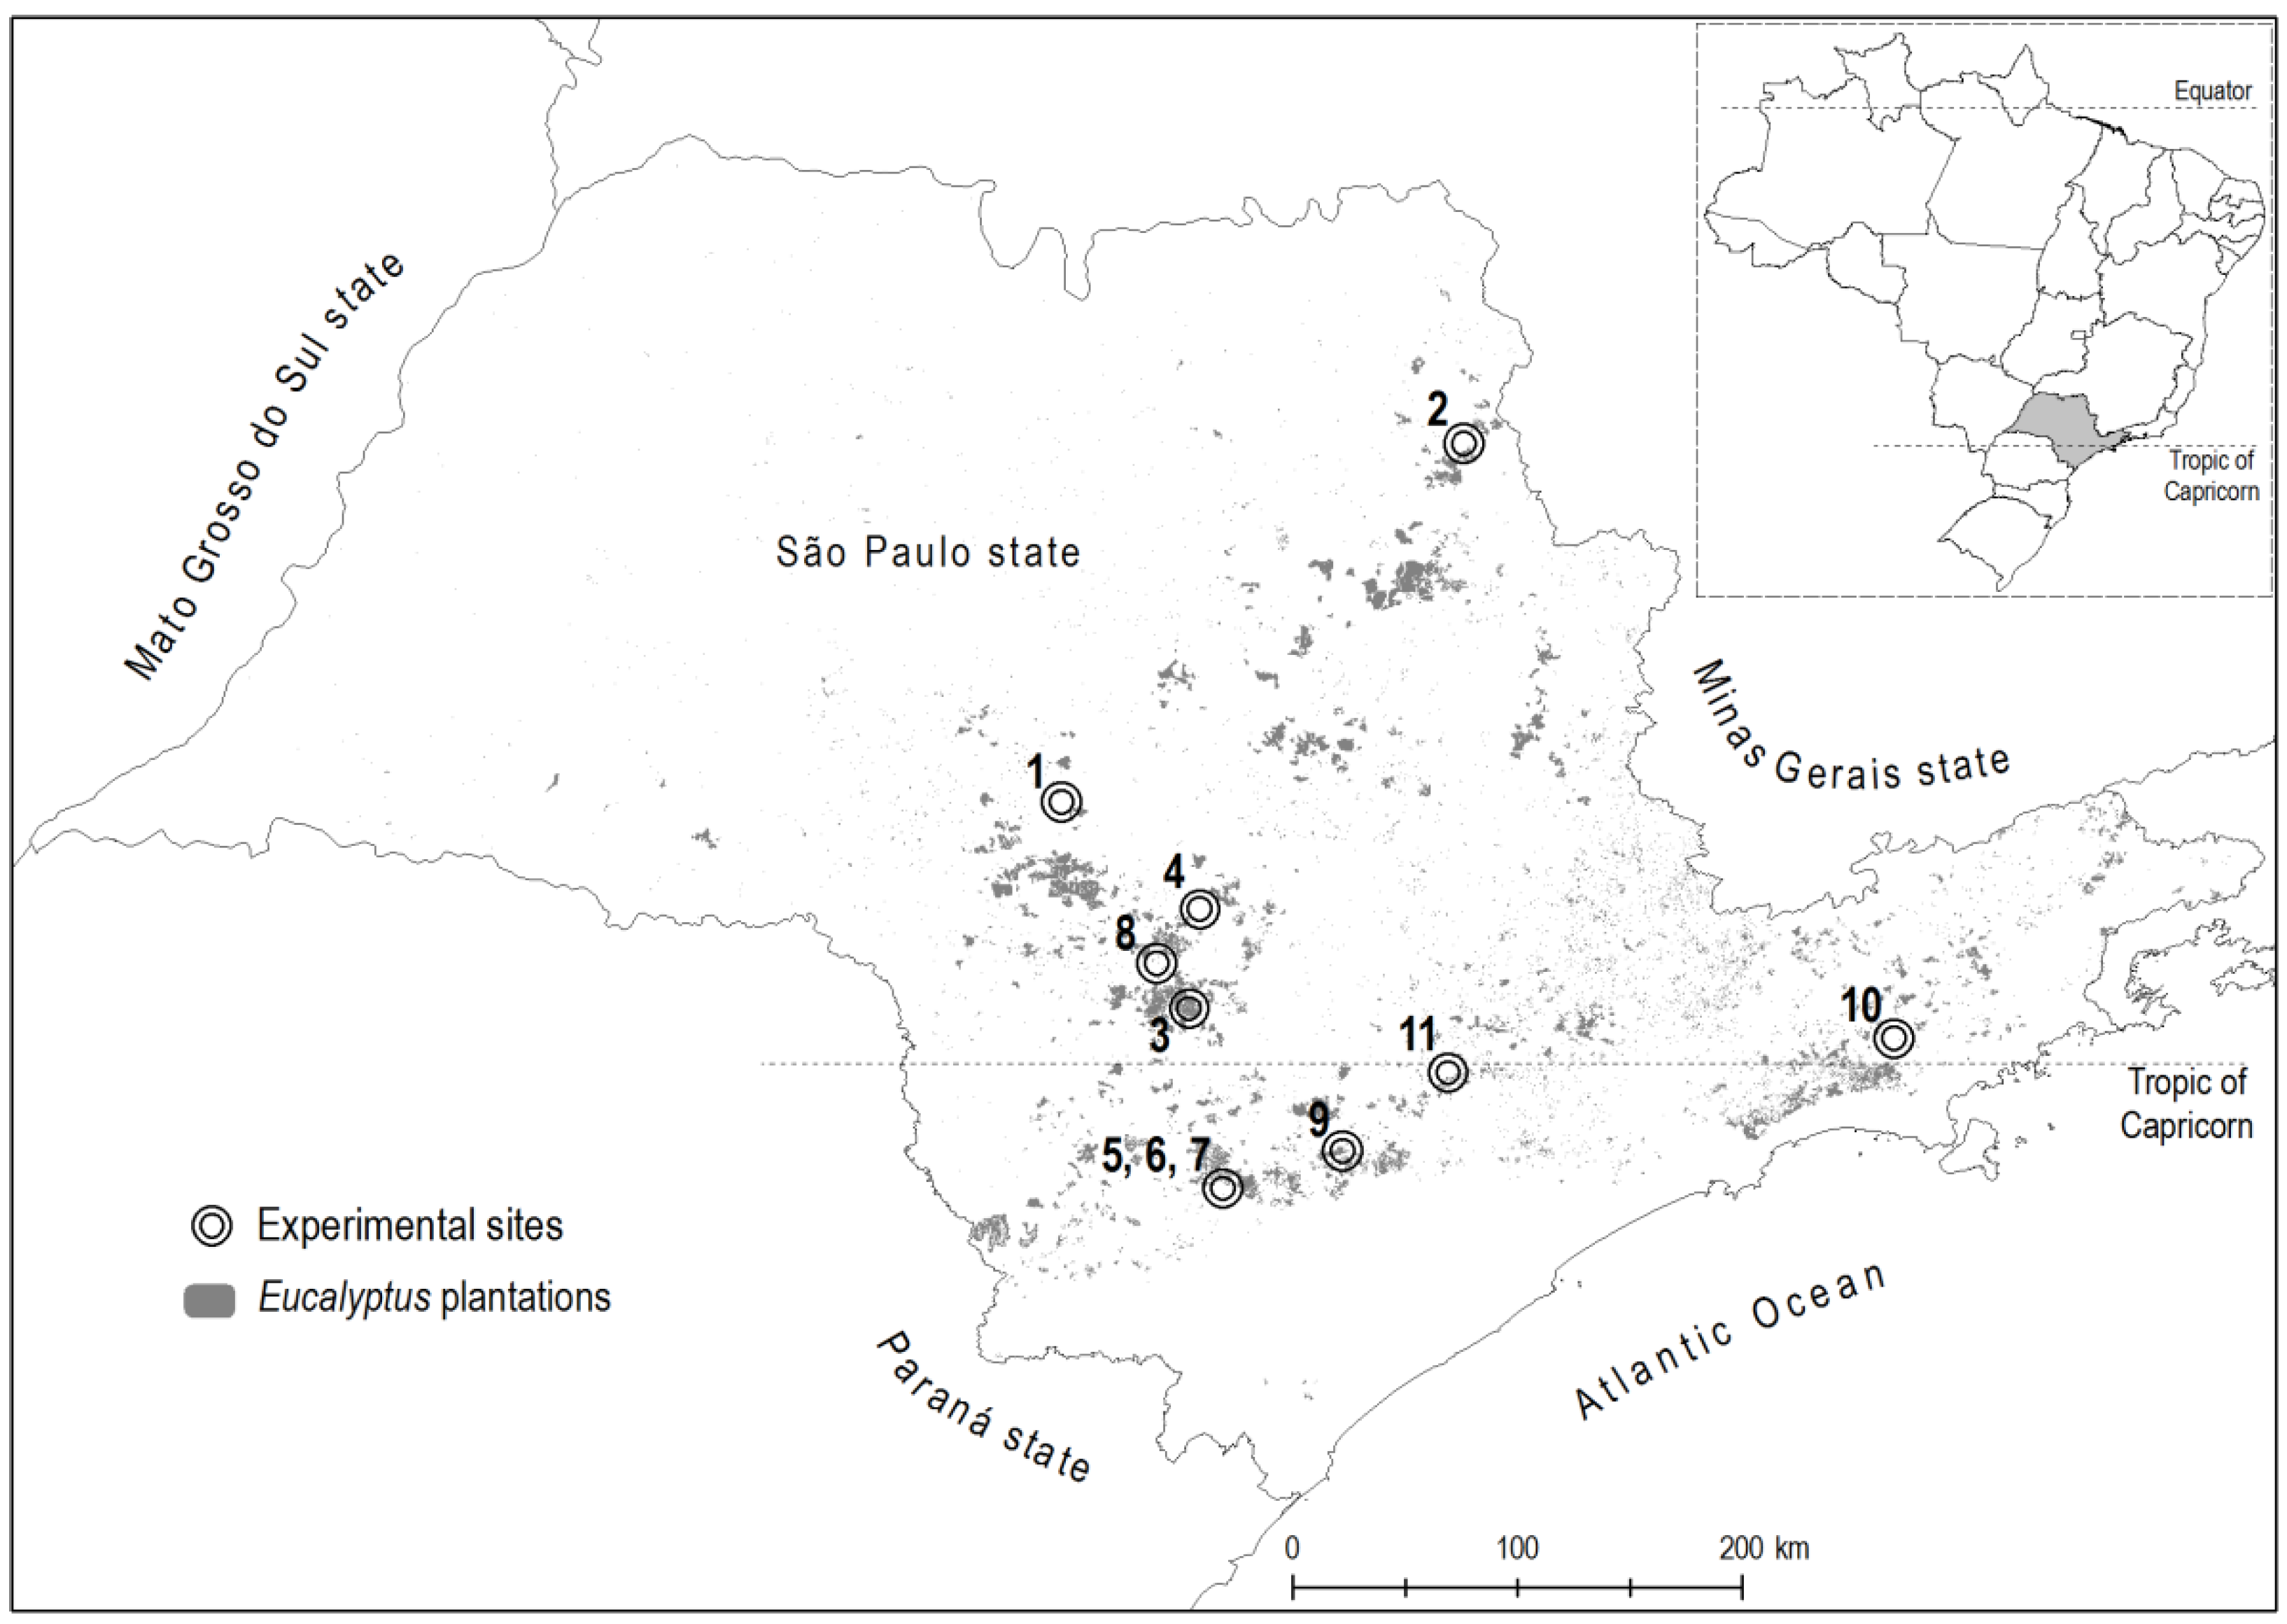
2.1. Site Description

| Municipality | Site Code | Lat | Long | Alt | T 3 | PP | Geology 4 | Genotype | Tree Spacing | Planting | |
|---|---|---|---|---|---|---|---|---|---|---|---|
| Formation or Group | Lithotype | ||||||||||
| S | W | m | °C | mm | m | ||||||
| Agudos | AGU | 22°28′ | 48°59′ | 580 | 20.6 | 1170 | Marília | Sandstone, sandy argillite and limestone | E.grandis 1 | 3.0 × 2.0 | Aug-2005 |
| Altinópolis | ALT | 21°01′ | 47°22′ | 889 | 19.4 | 1517 | Botucatu | Quartz-sandstone | E.grandis × urophylla 2 | 3.0 × 2.5 | May-2002 |
| Angatuba | ANG | 23°17′ | 48°28′ | 649 | 19.7 | 1262 | Pirambóia | Shale, thin sandstone and silty-clayey sandstone | E.grandis × urophylla 2 | 3.0 × 2.0 | Apr-2006 |
| Botucatu | BOT | 22°53′ | 48°26′ | 804 | 19.1 | 1302 | Marília | Sandstone, sandy argillite and limestone | E.grandis1 | 3.0 × 2.0 | Nov-2005 |
| Capão Bonito 1 | CB1 | 24°00′ | 48°20′ | 705 | 18.9 | 1210 | Itararé | Sandstone, diamictite and shale | E.grandis × urophylla 2 | 3.0 × 3.0 | Jun-1999 |
| Capão Bonito 2 | CB2 | 24°00′ | 48°20′ | 705 | 18.9 | 1210 | E.grandis × urophylla 2 | 3.0 × 2.0 | Feb-2007 | ||
| Capão Bonito 3 | CB3 | 24°00′ | 48°20′ | 705 | 18.9 | 1210 | E.grandis × urophylla 2 | 3.0 × 2.0 | Dec-2006 | ||
| Itatinga | ITA | 23°06′ | 48°36′ | 845 | 18.8 | 1308 | Marília | Sandstone, sandy argillite and limestone | E.grandis1 | 3.0 × 2.0 | Apr-2002 |
| São M. Arcanjo | SMA | 23°51′ | 47°51′ | 715 | 18.9 | 1174 | Itararé | Sandstone, diamictite and shale | E.grandis × urophylla 2 | 3.0 × 2.0 | Aug-2006 |
| Paraibuna | PAR | 23°23′ | 45°39′ | 634 | 19.2 | 1249 | Natividade da Serra | Monzogranite, biotite and granite | E.grandis1 | 3.0 × 2.5 | Mar-1997 |
| Votorantim | VOT | 23°32′ | 47°26′ | 570 | 19.8 | 1287 | Granite Sorocaba | Granite, Granodiorite, monzogranite and syenogranite | E.grandis × urophylla 2 | 3.0 × 2.0 | Oct-2006 |
| Site | Clay 1 | Silt 1 | Sand 1 | OM 2 | pH 3 | P-resin 4 | Cation Exchange 4 | ||||
|---|---|---|---|---|---|---|---|---|---|---|---|
| Coarse | Fine | K | Ca | Mg | Al | ||||||
| % | g kg−1 | mg kg−1 | mmolc kg−1 | ||||||||
| AGU | 16.7 | 2.7 | 30.7 | 49.9 | 15 | 3.9 | 2.3 | 0.6 | 1.0 | 0.6 | 8.3 |
| ALT | 6.7 | 1.3 | 38.7 | 53.3 | 13 | 4.3 | 4.4 | 0.8 | 4.8 | 1.9 | 3.7 |
| ANG | 10.0 | 1.0 | 29.3 | 59.7 | 16 | 4.0 | 8.5 | 0.5 | 5.3 | 1.5 | 7.6 |
| BOT | 10.0 | 3.0 | 32.0 | 55.0 | 11 | 4.0 | 4.8 | 0.3 | 3.0 | 3.7 | 4.1 |
| CB1 | 47.8 | 10.4 | 8.7 | 33.1 | 23 | 3.9 | 2.2 | 0.8 | 1.0 | 0.8 | 12.8 |
| CB2 | 65.3 | 15.3 | 5.3 | 14.1 | 29 | 4.4 | 3.6 | 1.6 | 4.4 | 4.8 | 13.7 |
| CB3 | 27.2 | 23.4 | 1.0 | 48.4 | 16 | 4.1 | 3.7 | 1.8 | 2.7 | 2.6 | 19.1 |
| ITA | 19.3 | 2.2 | 37.5 | 41.0 | 18 | 4,0 | 2.3 | 0.6 | 1.6 | 1.8 | 9.7 |
| SMA | 65.1 | 17.3 | 2.9 | 14.7 | 45 | 4.9 | 46.9 | 5.3 | 48.6 | 13.6 | 1.3 |
| PAR | 36.5 | 5.5 | 43.9 | 14.1 | 15 | 4.1 | 3.6 | 2.0 | 29.0 | 10.3 | 0.9 |
| VOT | 67.0 | 11.1 | 15.3 | 6.6 | 46 | 4.0 | 4.2 | 1.6 | 1.8 | 1.0 | 14.7 |
2.2. Growth Assessment
2.3. Soil Analysis
2.4. Assessment of N Mineralization
2.5. Data Analysis
3. Results
4. Discussion
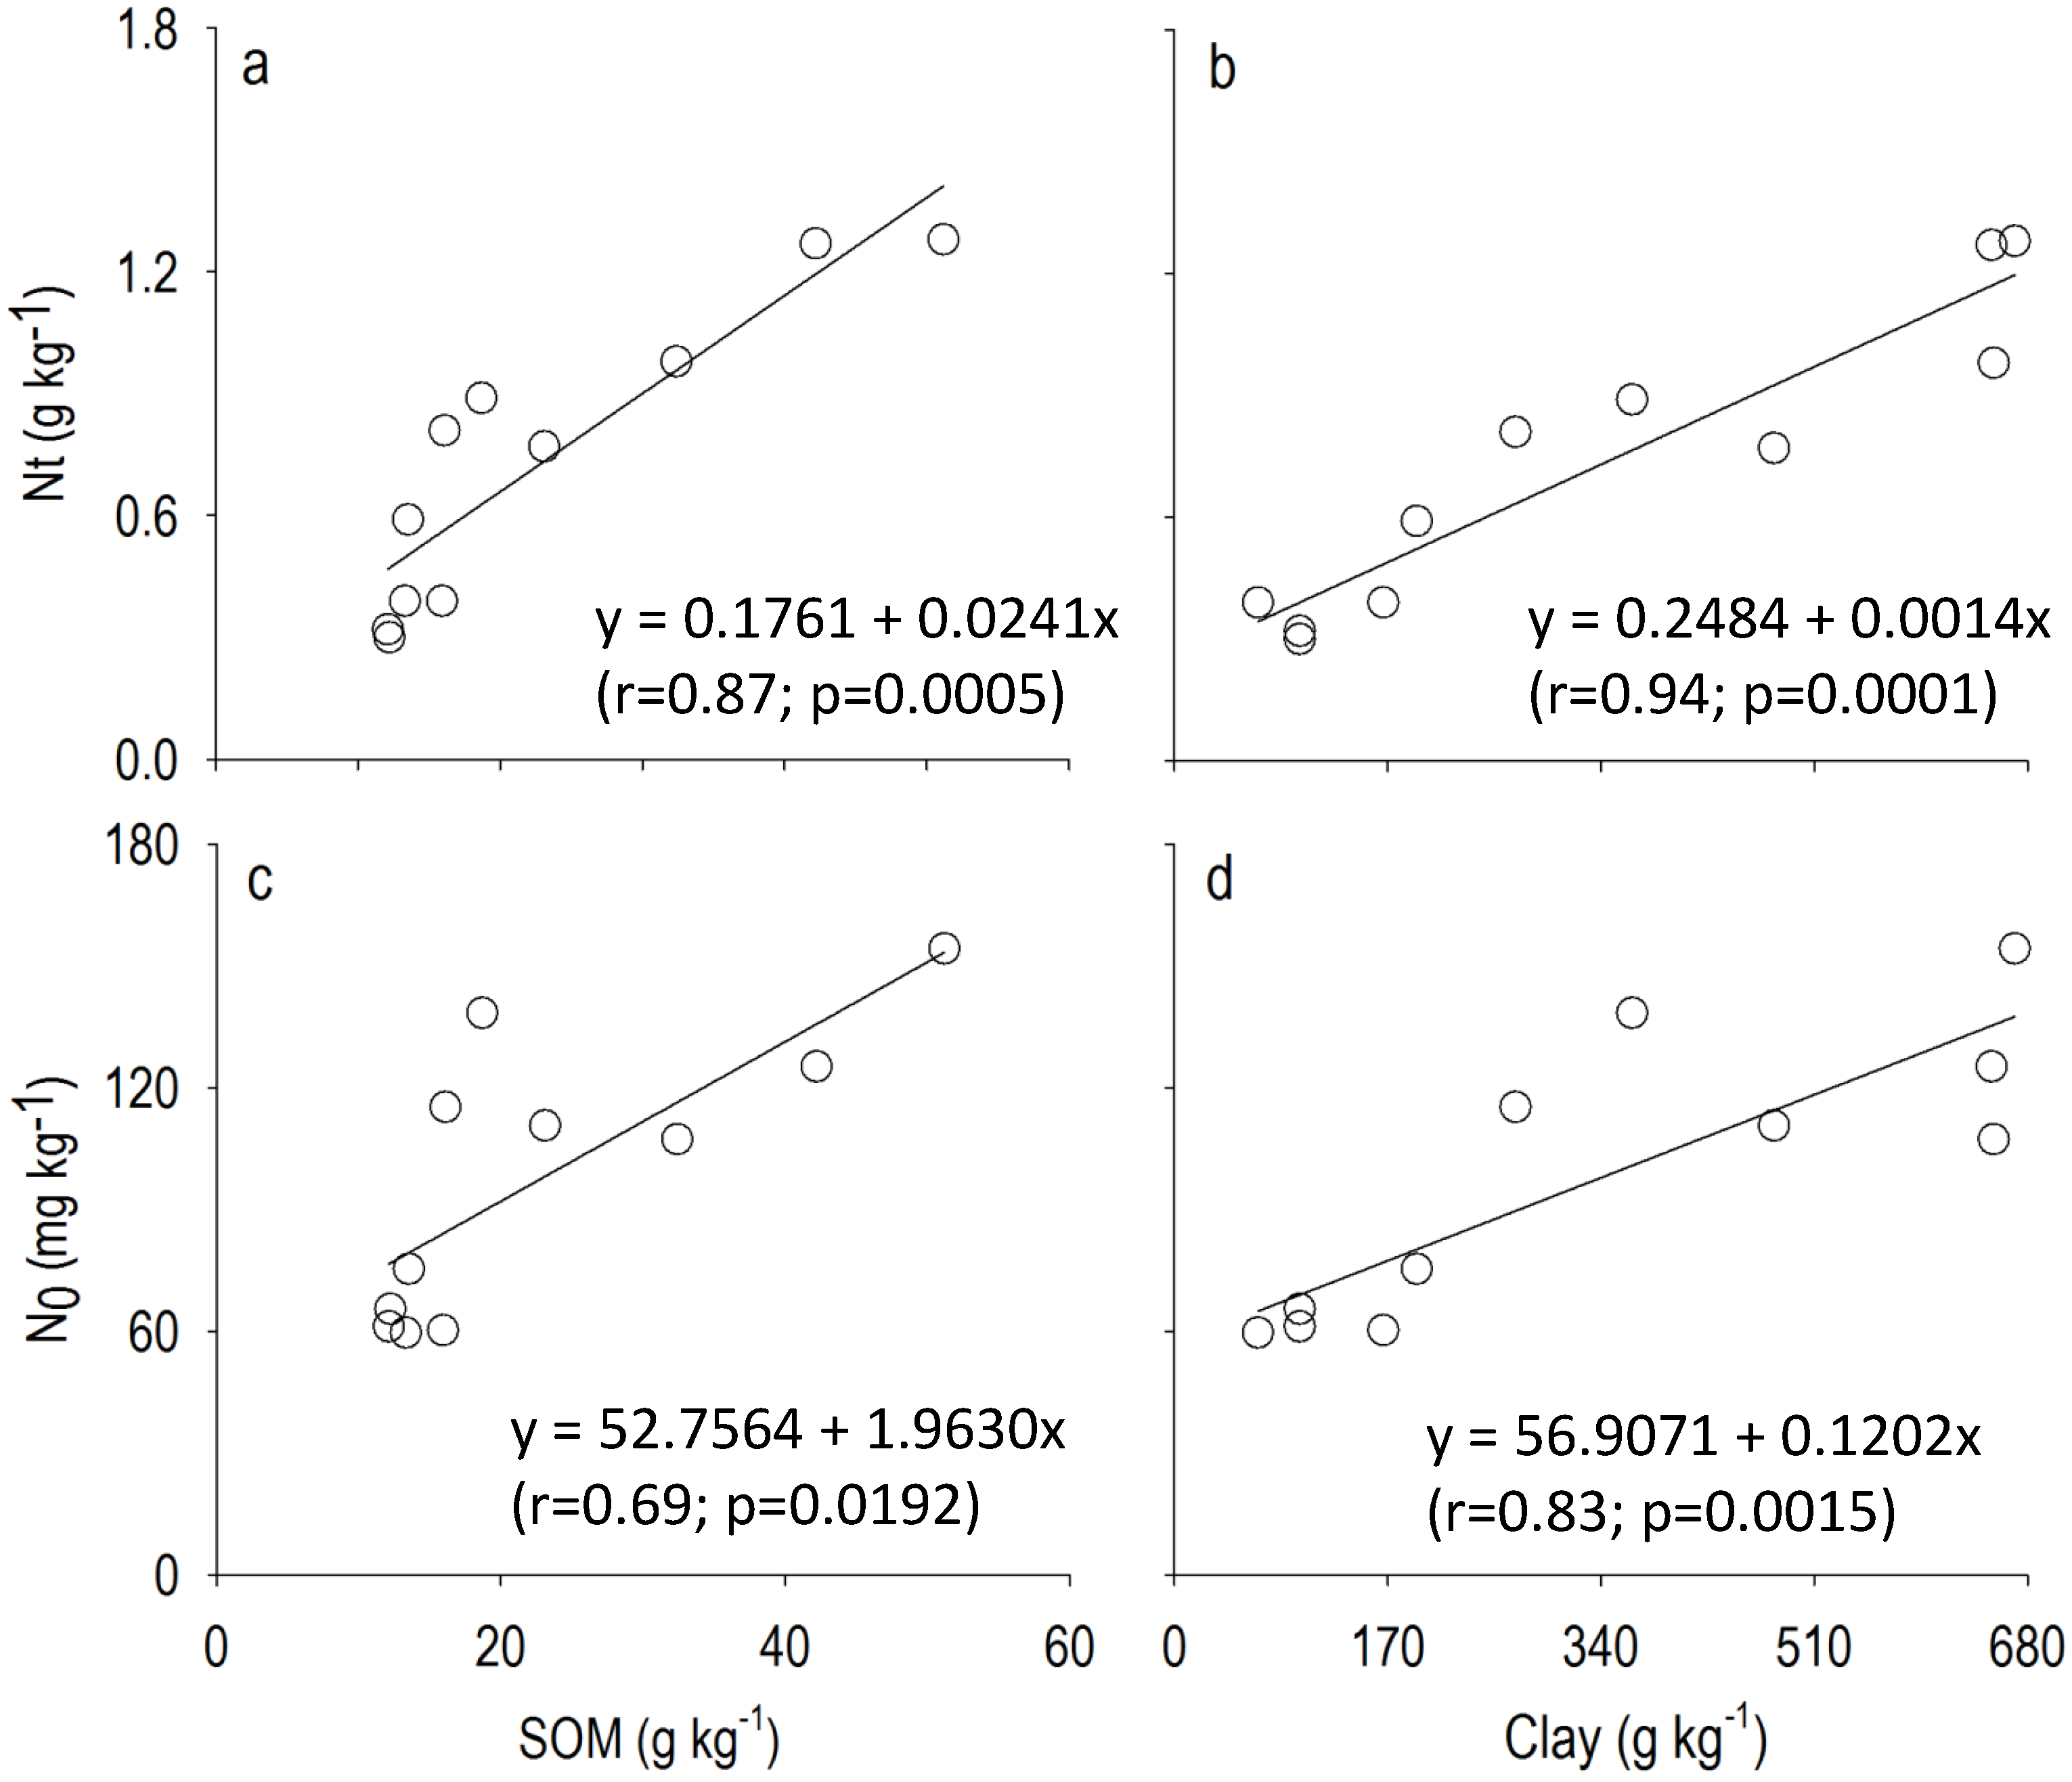
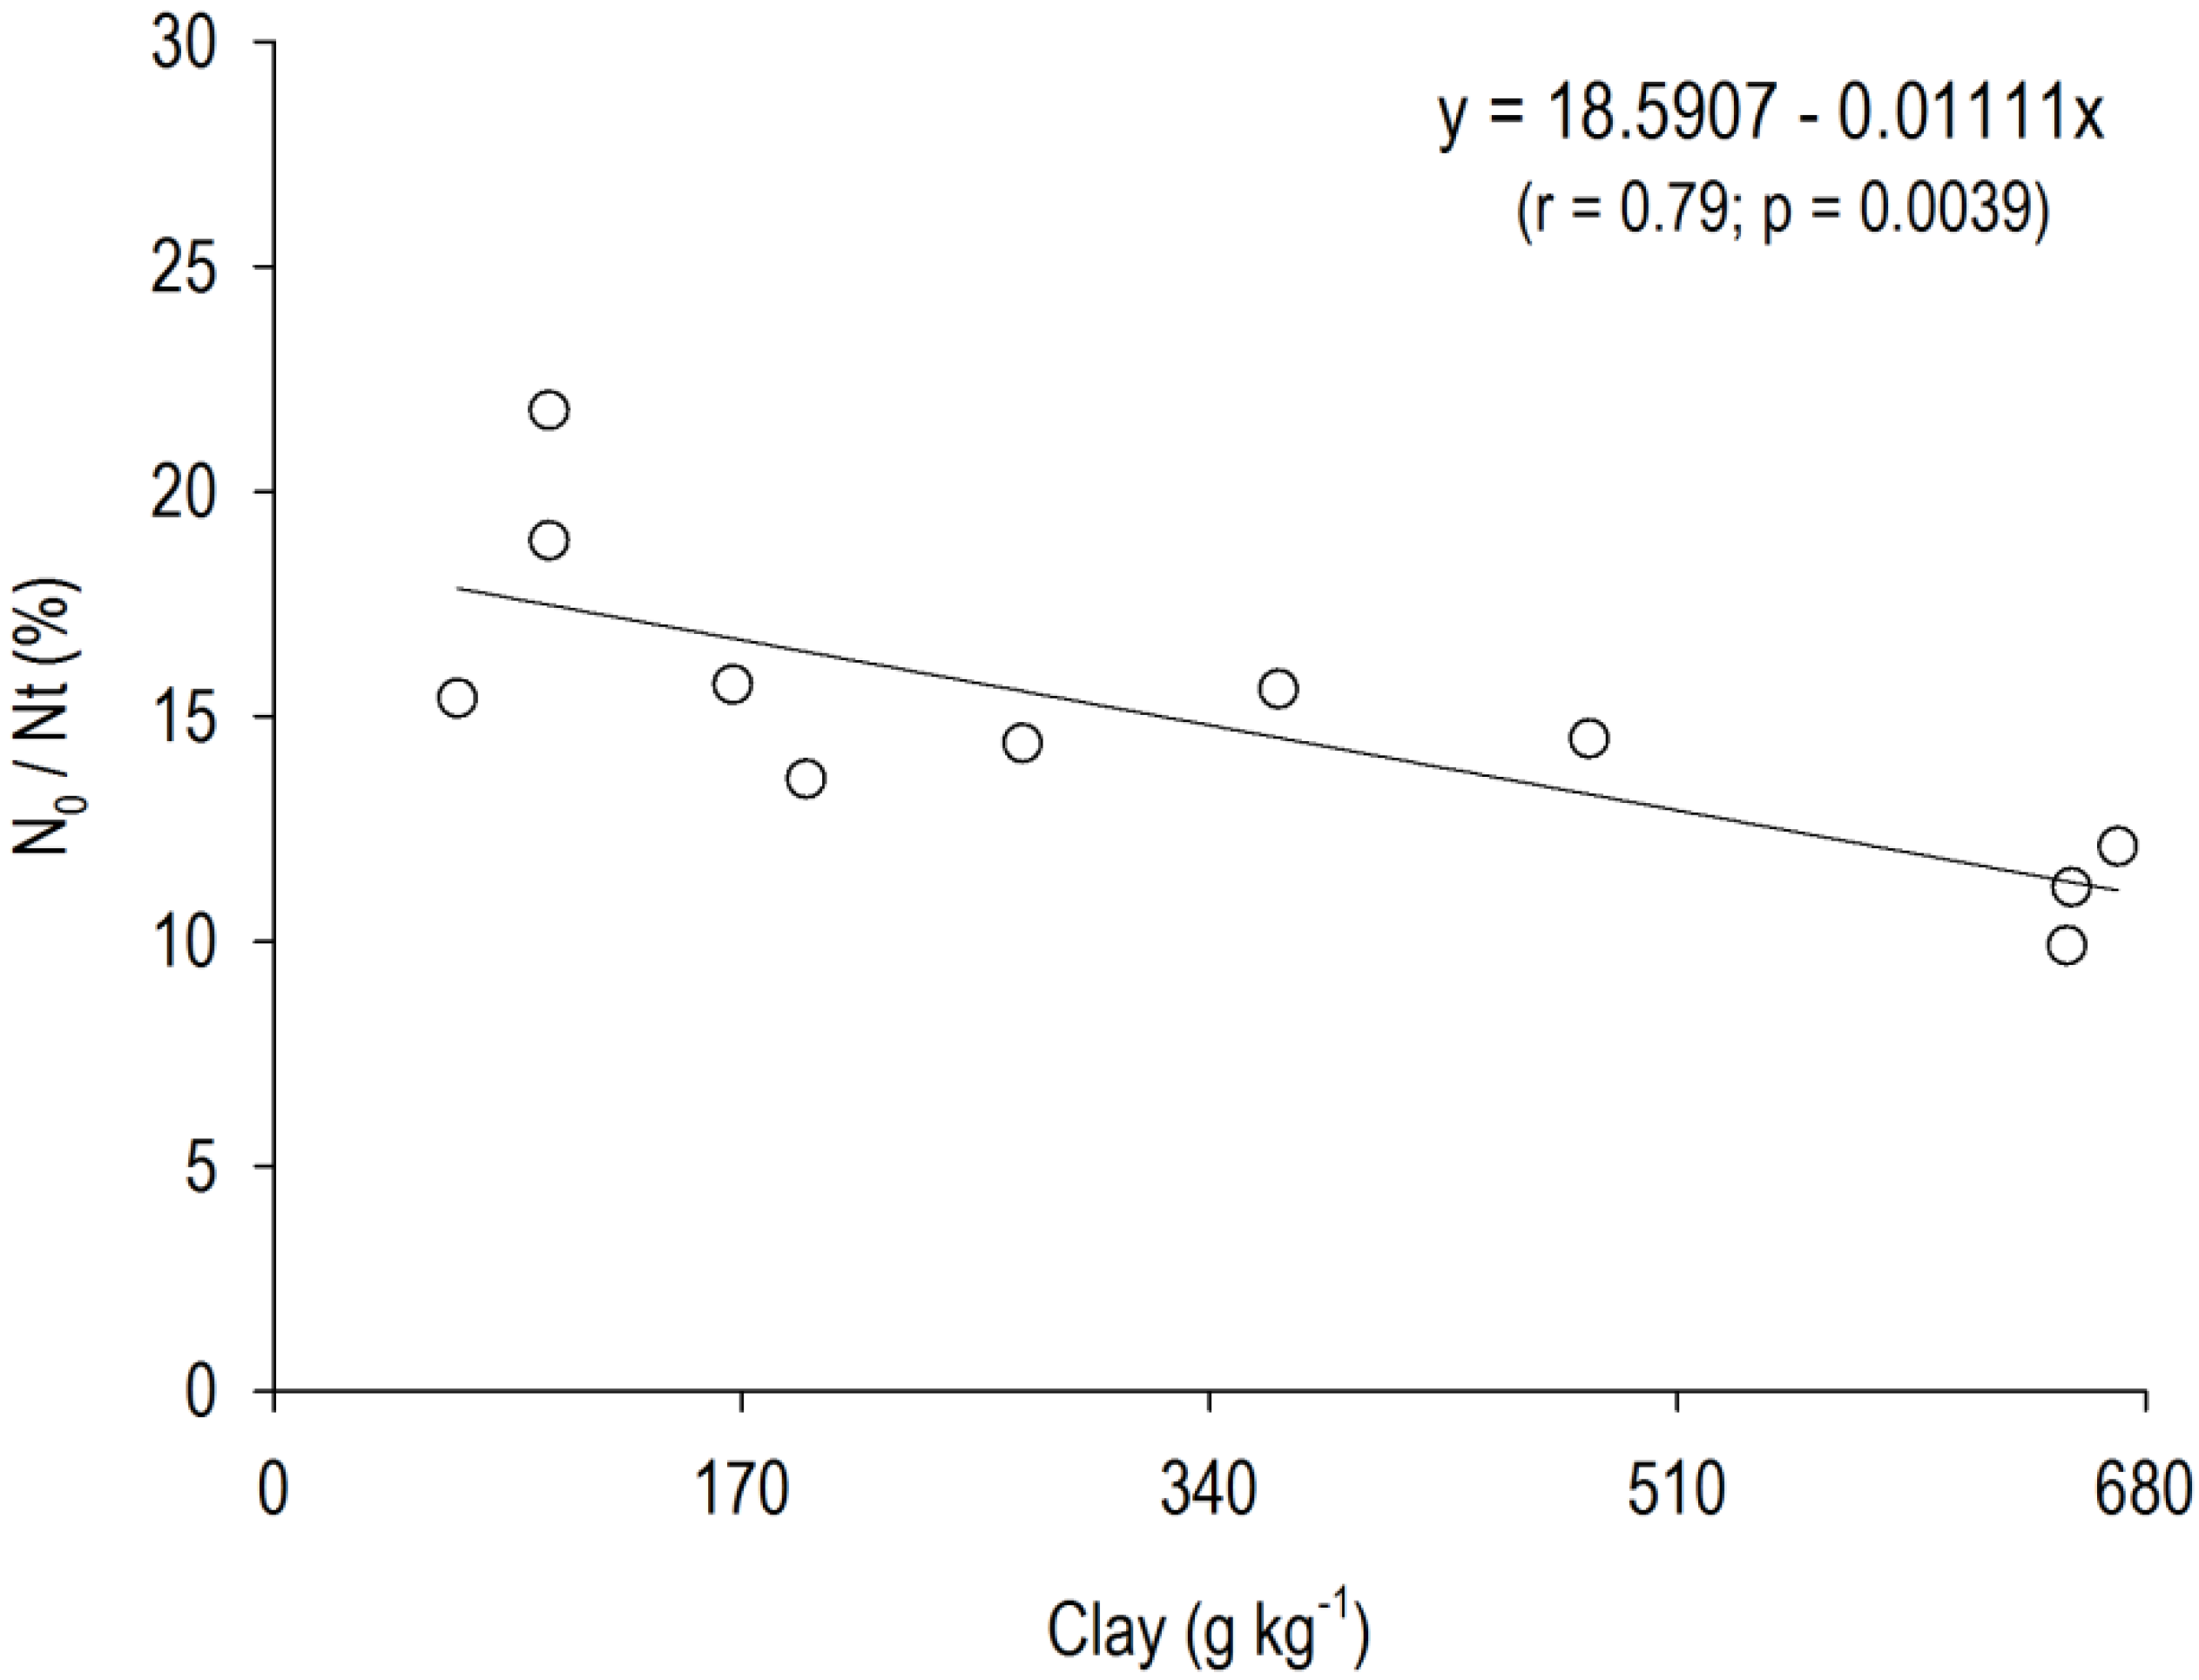
4.1. N mineralization

| Site | Summer | Fall | Winter | Spring | Yearly Total | |||||||||||||||
|---|---|---|---|---|---|---|---|---|---|---|---|---|---|---|---|---|---|---|---|---|
| N-NH4+ | N-NO3− | N-total | NH4+/NO3− | N-NH4+ | N-NO3− | N-total | NH4+/NO3− | N-NH4+ | N-NO3− | N-total | NH4+/NO3− | N-NH4+ | N-NO3− | N-total | NH4+/NO3− | N-NH4+ | N-NO3− | N-total | NH4+/NO3− | |
| kg ha−1 month−1 | kg ha−1 month−1 | kg ha−1 month−1 | kg ha−1 month−1 | kg ha−1 yr−1 | ||||||||||||||||
| Sandy Soils | ||||||||||||||||||||
| ALT | 5.7 | 8.0 | 13.7 | 0.7 | 4.6 | 4.1 | 8.7 | 1.1 | 6.6 | 2.6 | 9.2 | 2.6 | 10.1 | 4.8 | 15.0 | 2.1 | 81.2 | 58.6 | 139.8 | 1.4 |
| ANG | 8.6 | 3.8 | 12.4 | 2.3 | 3.3 | 1.6 | 4.8 | 2.1 | 4.3 | 1.3 | 5.5 | 3.4 | 8.0 | 5.1 | 13.1 | 1.6 | 72.4 | 35.2 | 107.6 | 2.1 |
| BOT | 5.6 | 7.6 | 13.2 | 0.7 | 6.9 | 4.5 | 11.5 | 1.5 | 4.1 | 3.7 | 7.8 | 1.1 | 9.1 | 1.5 | 10.6 | 6.1 | 77.0 | 52.0 | 129.0 | 1.5 |
| Mean | 6.6 | 6.5 | 13.1 | 1.2 | 4.9 | 3.4 | 8.3 | 1.6 | 5.0 | 2.5 | 7.5 | 2.4 | 9.1 | 3.8 | 12.9 | 3.3 | 76.9 | 48.6 | 125.5 | 1.6 |
| s 1 | 1.7 | 2.3 | 0.7 | 0.9 | 1.8 | 1.6 | 3.4 | 0.5 | 1.4 | 1.2 | 1.9 | 1.2 | 1.1 | 2.0 | 2.2 | 2.5 | 4.4 | 12.1 | 16.4 | 0.4 |
| Loamy Soils | ||||||||||||||||||||
| AGU | 11.2 | 6.5 | 17.6 | 1.7 | 9.0 | 4.2 | 13.2 | 2.2 | 6.1 | 3.2 | 9.3 | 1.9 | 11.3 | 3.2 | 14.5 | 3.5 | 113.0 | 51.1 | 164.0 | 2.2 |
| CB3 | 6.9 | 7.5 | 14.4 | 0.9 | 3.9 | 5.9 | 9.8 | 0.7 | 6.8 | 4.9 | 11.7 | 1.4 | 8.0 | 3.0 | 11.0 | 2.7 | 76.8 | 63.7 | 140.5 | 1.2 |
| ITA | 8.5 | 4.4 | 12.9 | 2.0 | 3.3 | 4.1 | 7.4 | 0.8 | 9.2 | 6.1 | 15.2 | 1.5 | 9.6 | 3.0 | 12.6 | 3.2 | 91.7 | 52.6 | 144.3 | 1.7 |
| Mean | 8.9 | 6.1 | 15.0 | 1.5 | 5.4 | 4.7 | 10.1 | 1.2 | 7.4 | 4.7 | 12.1 | 1.6 | 9.6 | 3.1 | 12.7 | 3.1 | 93.8 | 55.8 | 149.6 | 1.7 |
| s | 2.2 | 1.6 | 2.4 | 0.6 | 3.1 | 1.0 | 2.9 | 0.8 | 1.6 | 1.5 | 3.0 | 0.3 | 1.7 | 0.1 | 1.8 | 0.4 | 18.2 | 6.9 | 12.6 | 0.5 |
| Clayey Soils | ||||||||||||||||||||
| CB1 | 7.0 | 1.9 | 8.9 | 3.7 | 8.9 | 6.7 | 15.6 | 1.3 | 4.0 | 8.6 | 12.6 | 0.5 | 13.0 | 6.8 | 19.8 | 1.9 | 98.7 | 72.2 | 170.9 | 1.4 |
| CB2 | 11.2 | 4.9 | 16.0 | 2.3 | 3.6 | 2.3 | 5.9 | 1.5 | 3.8 | 7.0 | 10.9 | 0.5 | 11.8 | 5.3 | 17.1 | 2.2 | 91.1 | 58.7 | 149.8 | 1.6 |
| SMA | 6.0 | 3.4 | 9.4 | 1.8 | 6.5 | 1.2 | 7.7 | 5.4 | 3.4 | 1.9 | 5.2 | 1.8 | 9.7 | 4.7 | 14.4 | 2.1 | 76.9 | 33.5 | 110.4 | 2.3 |
| PAR | 14.3 | 7.8 | 22.1 | 1.8 | 12.7 | 6.5 | 19.1 | 1.9 | 1.1 | 2.6 | 3.6 | 0.4 | 17.7 | 6.6 | 24.3 | 2.7 | 137.2 | 70.2 | 207.4 | 2.0 |
| VOT | 13.4 | 6.9 | 20.4 | 1.9 | 6.4 | 2.6 | 9.0 | 2.5 | 7.5 | 1.9 | 9.4 | 3.9 | 10.2 | 3.5 | 13.8 | 2.9 | 112.5 | 45.0 | 157.5 | 2.5 |
| Mean | 10.4 | 5.0 | 15.4 | 2.3 | 7.6 | 3.9 | 11.5 | 2.5 | 3.9 | 4.4 | 8.3 | 1.4 | 12.5 | 5.4 | 17.9 | 2.4 | 103.3 | 55.9 | 159.2 | 1.9 |
| s | 3.7 | 2.4 | 6.1 | 0.8 | 3.4 | 2.6 | 5.6 | 1.7 | 2.3 | 3.2 | 3.8 | 1.5 | 3.2 | 1.4 | 4.3 | 0.4 | 22.9 | 16.6 | 35.1 | 0.5 |
| Site 1 | N0 | Ct 2 | Nt 3 | N0 4 | N0/Nt | C/N | |||||||
|---|---|---|---|---|---|---|---|---|---|---|---|---|---|
| Fall | Winter | Spring | Summer | Fall | Winter | Spring | Summer | ||||||
| mg kg−1 | kg ha−1 | mg kg−1 | % | ||||||||||
| Sandy Soils | |||||||||||||
| ALT | 26 | 20 | 47 | 60 | 82 | 63 | 149 | 190 | 7723 | 387 | 60 | 15 | 20 |
| ANG | 28 | 46 | 39 | 61 | 63 | 103 | 88 | 137 | 7025 | 323 | 61 | 19 | 22 |
| BOT | 53 | 31 | 56 | 66 | 142 | 83 | 150 | 177 | 7090 | 301 | 66 | 22 | 24 |
| Mean | 36 | 32 | 47 | 62 | 96 | 83 | 129 | 168 | 7279 | 337 | 62 | 19 | 22 |
| s 5 | 15.0 | 13.1 | 8.5 | 3.2 | 41.2 | 20.0 | 35.5 | 27.6 | 385.6 | 44.7 | 3.2 | 3.5 | 2.0 |
| Loamy Soils | |||||||||||||
| AGU | 30 | 42 | 73 | 60 | 84 | 118 | 205 | 169 | 9233 | 387 | 60 | 16 | 24 |
| CB3 | 104 | _ 6 | 95 | 115 | 279 | _ | 255 | 309 | 9342 | 810 | 115 | 14 | 12 |
| ITA | 71 | 43 | 73 | 75 | 149 | 90 | 153 | 158 | 7850 | 589 | 75 | 13 | 13 |
| Mean | 68 | 43 | 80 | 83 | 171 | 104 | 205 | 212 | 8808 | 595 | 83 | 14 | 16 |
| s | 37.1 | 0.7 | 12.7 | 28.4 | 99.3 | 19.8 | 51.0 | 84.2 | 831.7 | 211.6 | 28.4 | 1.5 | 6.7 |
| Clayey Soils | |||||||||||||
| CB1 | 56 | 69 | 91 | 111 | 139 | 171 | 226 | 275 | 13,403 | 774 | 111 | 14 | 17 |
| CB2 | 114 | _ | 112 | 107 | 276 | _ | 271 | 259 | 18,814 | 981 | 107 | 11 | 19 |
| SMA | 34 | 91 | 98 | 125 | 67 | 178 | 192 | 245 | 24,498 | 1267 | 125 | 10 | 19 |
| PAR | 125 | 83 | 108 | 138 | 361 | 240 | 312 | 398 | 10,837 | 893 | 138 | 15 | 12 |
| VOT | 158 | _ | 134 | 154 | 344 | _ | 292 | 336 | 29,724 | 1276 | 154 | 12 | 23 |
| Mean | 97 | 81 | 109 | 127 | 237 | 196 | 258 | 303 | 19,455 | 1038 | 127 | 13 | 18 |
| s | 51.1 | 11.1 | 16.4 | 19.4 | 129.3 | 38.0 | 49.0 | 63.6 | 7781.3 | 225.3 | 19.4 | 2.1 | 4.0 |
| Site | Treatment | SV | MAI | ||||||||||||||||||
|---|---|---|---|---|---|---|---|---|---|---|---|---|---|---|---|---|---|---|---|---|---|
| m3 ha−1 | m3 ha−1year−1 | ||||||||||||||||||||
| Sandy Soils | |||||||||||||||||||||
| Age (year) | 1.8 | 4.0 | 5.7 | 1.8 | 4.0 | 5.7 | |||||||||||||||
| ALT | Control | 45 | b 1 | 192 | a | 285 | a | 25 | b | 48 | a | 50 | a | ||||||||
| Usual dose | 55 | a | 198 | a | 285 | a | 31 | a | 50 | a | 50 | a | |||||||||
| Increased dose | 55 | a | 198 | a | 275 | a | 30 | a | 49 | a | 48 | a | |||||||||
| 2.0 | 3.0 | 5.5 | 2.0 | 3.0 | 5.5 | ||||||||||||||||
| ANG | Control | 96 | a | 175 | a | 352 | a | 48 | a | 58 | a | 64 | a | ||||||||
| Usual dose | 109 | a | 181 | a | 351 | a | 55 | a | 60 | a | 64 | a | |||||||||
| Increased dose | 108 | a | 183 | a | 356 | a | 54 | a | 61 | a | 65 | a | |||||||||
| 2.0 | 3.0 | 4.0 | 5.0 | 2.0 | 3.0 | 4.0 | 5.0 | ||||||||||||||
| BOT | Control | 40 | a | 172 | a | 209 | a | 267 | a | 20 | a | 57 | a | 52 | a | 53 | a | ||||
| Usual dose | 47 | a | 187 | a | 211 | a | 266 | a | 23 | a | 62 | a | 53 | a | 53 | a | |||||
| Increased dose | 42 | a | 176 | a | 197 | a | 260 | a | 21 | a | 59 | a | 49 | a | 52 | a | |||||
| Loamy soils | |||||||||||||||||||||
| Age (year) | 2.0 | 3.0 | 4.0 | 5.0 | 6.0 | 2.0 | 3.0 | 4.0 | 5.0 | 6.0 | |||||||||||
| AGU | Control | 52 | a | 132 | a | 186 | a | 257 | a | 313 | a | 26 | a | 44 | a | 47 | a | 51 | a | 52 | a |
| Usual dose | 52 | a | 133 | a | 190 | a | 274 | a | 323 | a | 26 | a | 44 | a | 47 | a | 55 | a | 54 | a | |
| Increased dose | 53 | a | 135 | a | 183 | a | 249 | a | 312 | a | 27 | a | 45 | a | 46 | a | 50 | a | 52 | a | |
| 1.1 | 2.0 | 1.1 | 2.0 | ||||||||||||||||||
| CB3 | Control | 14 | a | 88 | b | 13 | a | 44 | b | ||||||||||||
| Usual dose | 16 | a | 109 | a | 14 | a | 54 | a | |||||||||||||
| Increased dose | 16 | a | 111 | a | 14 | a | 55 | a | |||||||||||||
| 2.0 | 4.0 | 2.0 | 4.0 | ||||||||||||||||||
| ITA | Control | 50 | b | 159 | a | 25 | b | 40 | b | ||||||||||||
| Usual dose | 60 | a | 174 | a | 30 | a | 43 | a | |||||||||||||
| Increased dose | 61 | a | 174 | a | 30 | a | 44 | a | |||||||||||||
| Clayey Soils | |||||||||||||||||||||
| Age (year) | 2.0 | 4.0 | 9.0 | 2.0 | 4.0 | 9.0 | |||||||||||||||
| CB1 | Control | 28 | b | 168 | b | 452 | a | 14 | b | 42 | b | 50 | a | ||||||||
| Usual dose | 33 | ab | 184 | ab | 460 | a | 17 | ab | 46 | a | 51 | a | |||||||||
| Increased dose | 38 | a | 187 | a | 455 | a | 19 | a | 47 | a | 51 | a | |||||||||
| 1.0 | 2.0 | 4.7 | 1.0 | 2.0 | 4.7 | ||||||||||||||||
| CB2 | Control | 10 | a | 80 | b | 330 | a | 10 | a | 40 | b | 70 | a | ||||||||
| Usual dose | 11 | a | 92 | a | 332 | a | 11 | a | 46 | a | 71 | a | |||||||||
| Increased dose | 12 | a | 96 | a | 333 | a | 12 | a | 48 | a | 71 | a | |||||||||
| 1.5 | 2.5 | 1.5 | 2.5 | ||||||||||||||||||
| SMA | Control | 68 | a | 187 | a | 45 | a | 75 | a | ||||||||||||
| Usual dose | 73 | a | 185 | a | 49 | a | 74 | a | |||||||||||||
| Increased dose | 71 | a | 200 | a | 47 | a | 80 | a | |||||||||||||
| 2.2 | 4.0 | 11.4 | 2.2 | 4.0 | 11.4 | ||||||||||||||||
| PAR | Control | 33 | a | 146 | a | 439 | a | 15 | a | 36 | a | 39 | a | ||||||||
| Usual dose | 39 | a | 153 | a | 430 | a | 18 | a | 38 | a | 38 | a | |||||||||
| Increased dose | 42 | a | 153 | a | 430 | a | 19 | a | 38 | a | 38 | a | |||||||||
| 1.2 | 3.1 | 1.2 | 3.1 | ||||||||||||||||||
| VOT | Control | 21 | b | 177 | a | 18 | a | 57 | a | ||||||||||||
| Usual dose | 25 | a | 194 | a | 21 | a | 62 | a | |||||||||||||
| Increased dose | 23 | b | 184 | a | 19 | a | 59 | a | |||||||||||||

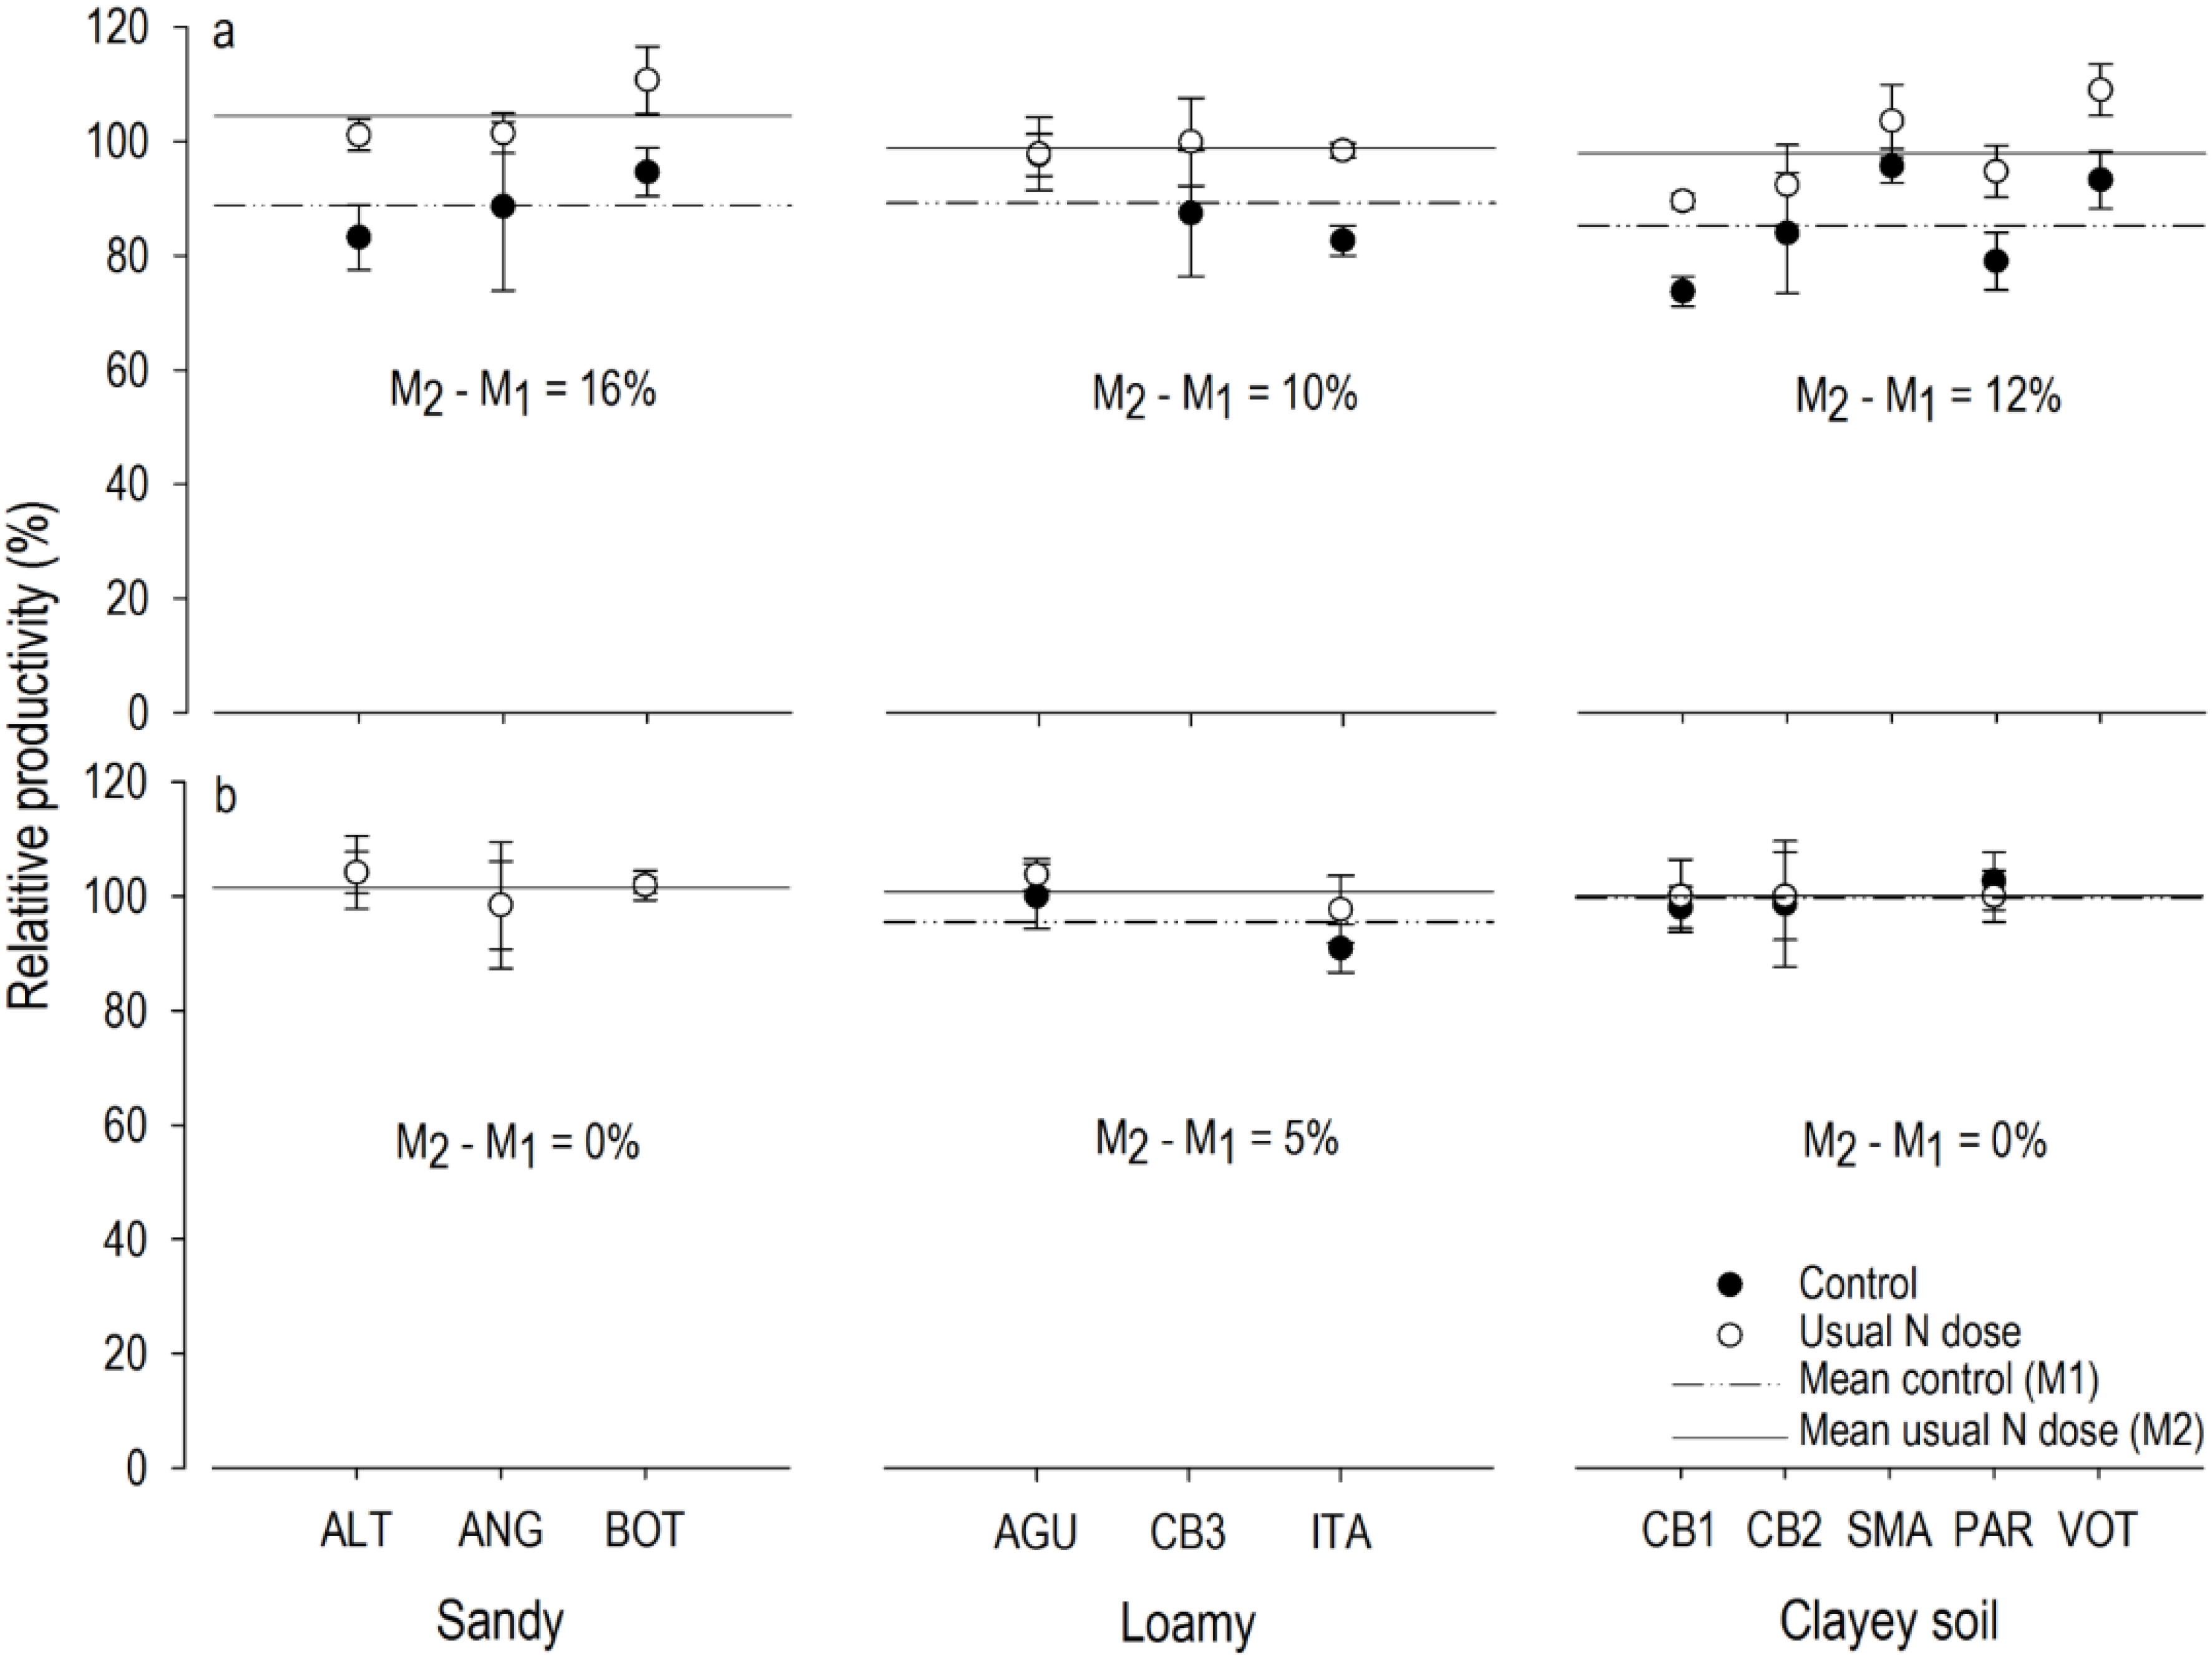
4.2. Nitrogen Fertilizer Application Response
Acknowledgments
Author Contributions
Conflicts of Interest
References
- Barros, N.F.; Novais, R.F.; Neves, J.C.L. Fertilização e correção do solo para o plantio de eucalipto. In Relação Solo- Eucalipto; Barros, N.F., Novais, R.F., Eds.; UFV: Viçosa, MG, Brazil, 1990; Volume 4, pp. 127–186. [Google Scholar]
- Gonçalves, J.L.M.; Alvares, C.A.; Higa, A.R.; Silva, L.D.; Alfenas, A.C.; Stahl, J.; Ferraz, S.F.B.; Lima, W.P.; Brancalion, P.H.S.; Hubner, A.; et al. Integrating genetic and silvicultural strategies to minimize abiotic and biotic constraints in Brazilian eucalypt plantations. For. Ecol. Manag. 2013, 301, 6–27. [Google Scholar] [CrossRef]
- Gonçalves, J.L.M.; Stape, J.L.; Laclau, J.P.; Bouillet, J.P.; Ranger, J. Assessing the effects of early silvicultural management on long-term site productivity of fast growing Eucalypt plantations: The Brazilian experience. South. For. 2008, 70, 105–118. [Google Scholar]
- Gonçalves, J.L.M.; Barros, N.F.; Nambiar, E.K.S.; Novais, R.F. Soil and stand management for short-rotation plantations. In Management of Soil, Nutrients and Water in Tropical Plantation Forests; Nambiar, S., Brown, A., Eds.; ACIAR Austrália/CSIRO Austrália/CIFOR Indonésia: Canberra, Australia, 1997; pp. 379–418. [Google Scholar]
- Herbert, M.A.; Schönau, A.P.G. Fertilizing commercial forest species in southern Africa: Research progress and problems (part 1). S. Afr. For. J. 1989, 151, 58–70. [Google Scholar]
- Reis, M.G.F.; Barros, N.F.; Kimmins, J.P. Acúmulo de nutrientes em uma sequência de idade de Eucalyptus grandis (ex-Maiden) plantado no cerrado, em duas áreas com diferentes produtividades, em Minas Gerais. Rev. Árvore 1987, 11, 1–15. [Google Scholar]
- Laclau, J.-P.; Ranger, J.; Goncalves, J.L.M.; Maquere, V.; Krusche, A.V.; M'Bou, A.T.; Nouvellon, Y.; Saint-Andre, L.; Bouillet, J.-P.; Piccolo, M.D.C.; et al. Biogeochemical cycles of nutrients in tropical Eucalyptus plantations Main features shown by intensive monitoring in Congo and Brazil. For. Ecol. Manag. 2010, 259, 1771–1785. [Google Scholar] [CrossRef]
- Dovey, S.B.; du Toit, B.; Clercq, W. Nutrient fluxes in Rainfall, Throughfall and Stemflow in Eucalyptus Stands on the Zululand Coastal Plain, South Africa. South. For. 2011, 73, 193–206. [Google Scholar]
- Sato, A.M.; Souza, A.A.; Coelho Netto, A.L. Spatial variability and temporal stability of throughfall in a eucalyptus plantation in the hilly lowlands of southeastern Brazil. Hydrol. Process. 2011, 25, 1910–1923. [Google Scholar] [CrossRef]
- Mayer, R.; Liess, S.; Lopes, M.I.M.S.; Kreutzer, K. Atmospheric pollution in a tropical rain forest: effects of deposition upon biosphere and hydrosphere II. Fluxes of chemicals and element budgets. Water Air Soil Pollut. 2000, 121, 79–92. [Google Scholar] [CrossRef]
- Gonçalves, J.L.M.; Mendes, K.C.F.S.; Sasaki, C.M. Mineralização de nitrogênio em ecossistemas florestais naturais e implantados do estado de São Paulo. Rev. Bras. Cienc Solo 2001, 25, 601–616. [Google Scholar] [CrossRef]
- Poggiani, F. Ciclagem de nutrientes em ecossistemas de plantações florestais de Eucalyptus e Pinus: Implicações silviculturais. In Tese (Livre Docência)—Escola Superior de Agricultura “Luiz de Queiroz”; Universidade de São Paulo: Piracicaba, Brazil, 1985. [Google Scholar]
- Godinho, V.P.C.; Barros, N.F.; Pereira, P.R.G.; Sediyama, C.S. Fluxo parcial de nitrogênio e potássio em solo arenoso de cerrado, sob povoamentos de Eucalyptus camaldulensis, influenciado pelo modo de aplicação de adubo nitrogenado e potássico. In Proceedings of the IUFRO Conference on silviculture and improvement of eucalyptus, Salvador, Brazil, 12–15 November 1997; pp. 125–133.
- Smethurst, P.; Baillie, C.; Cherry, M.; Holz, G. Fertilizer effects on LAI and growth of four Eucalyptus nitens plantations. For. Ecol. Manag. 2003, 176, 531–542. [Google Scholar] [CrossRef]
- Laclau, J.P.; Ranger, J.; Deleporte, P.; Nouvellon, Y.; Saint-André, L.; Marlet, S.; Bouillet, J.P. Nutrient cycling in a clonal stand of Eucalyptus and an adjacent savanna ecosystem in Congo. 3. Input-output budgets and consequences for the sustainability of the plantations. For. Ecol. Manag. 2005, 210, 375–391. [Google Scholar] [CrossRef]
- Cantarella, H.; Van Raij, B. Adubação nitrogenada no Estado de São Paulo. In Reunião brasileira de fertilidade do solo; SBCS: Ilhéus, Brazil, 1986; pp. 47–79. [Google Scholar]
- Larcher, W. Ecofisiologia vegetal; Rima: São Carlos, Brazil, 2004; p. 531. [Google Scholar]
- Gianello, C.; Bremner, J.M. A simple chemical method of assessing potentially available organic nitrogen in soil. Commun. Soil Sci. Plant Anal. 1986, 17, 195–214. [Google Scholar] [CrossRef]
- Hopmans, P.; Flinn, D.W.; Farrel, P.W. Nitrogen mineralization in a sandy soil under native Eucalypt forest and exotic Pine plantations in relation to moisture content. Commun. Soil Sci. Plant Anal. 1980, 1, 71–79. [Google Scholar] [CrossRef]
- Keeney, D.R.; Bremner, J.M. Comparison and evaluation of laboratory methods of obtaining an index of soil nitrogen availability. Agron. J. 1966, 58, 498–503. [Google Scholar] [CrossRef]
- Corbeels, M.; Mc Murtrie, R.E.; Pepper, D.A.; Mendham, D.S.; Grove, T.S.; O’Connell, A.M. Long-term changes in productivity of eucalypt plantations under different harvest residue and nitrogen management practices: A modelling analysis. For. Ecol. Manag. 2005, 217, 1–18. [Google Scholar] [CrossRef]
- Alvares, C.A.; Stape, J.L.; Sentelhas, P.C.; Gonçalves, J.L.M.; Sparovek, G. Köppen’s climate classification map for Brazil. Meteorologische Zeitschrift 2013, 22, 711–728. [Google Scholar] [CrossRef]
- Embrapa. Sistema Brasileiro de Classificação de Solos, 3rd ed.; Embrapa: Brasília, Brazil, 2013; p. 353. [Google Scholar]
- Gonçalves, J.L.M.; Alvares, C.A.; Gonçalves, T.D.; Moreira, R.M.; Mendes, J.C.T.; Gava, J.L. Mapeamento de solos e da produtividade de plantações de Eucalyptus grandis em Itatinga, SP, com uso de sistema de informação geográfica. Sci. For. 2012, 94, 187–201. [Google Scholar]
- Alvares, C.A.; Gonçalves, J.L.M.; Vieira, S.R.; Silva, C.R.; Franciscatte, W. Spatial variability of physical and chemical attributes of some forest soils in southeastern of Brazil. Sci. Agri. 2011, 68, 697–705. [Google Scholar] [CrossRef]
- Alvares, C.A.; Stape, J.L.; Sentelhas, P.C.; Gonçalves, J.L.M. Modeling monthly mean air temperature for Brazil. Theor. Appl. Climatol. 2013, 113, 407–427. [Google Scholar] [CrossRef]
- IPT—Instituto de Pesquisas Tecnológicas do Estado de São Paulo. In Mapa geológico do Estado de São Paulo; escale 1:500.000; Secretaria da Indústria, Comércio, Ciência e Tecnologia: São Paulo, Brazil, 1981.
- EMBRAPA. Manual de métodos de análise de solo; Embrapa: Rio de Janeiro, Brazil, 1999; p. 212. [Google Scholar]
- Van Raij, B.; Andrade, J.C.; Cantarella, H.; Quaggio, J.A. Análise química para avaliação da fertilidade de solos tropicais; Instituto Agronômico: Campinas, Brazil, 2001; p. 285. [Google Scholar]
- Bremner, J.M. Organic nitrogen in soils. In Soil Nitrogen; Bartholomew, W.V., Clark, F.E., Eds.; American Society of Agronomy: Madson, WI, USA, 1965; pp. 93–149. [Google Scholar]
- Raison, R.J.; Connell, M.J.; Khanna, P.K. Methodology for studying fluxes of soil mineral-N in situ. Soil Biol. Biochem. 1987, 19, 521–530. [Google Scholar] [CrossRef]
- Arnold, J.; Corre, M.D.; Veldkamp, E. Cold storage and laboratory incubation of intact soil cores do not reflect in-situ nitrogen cycling rates of tropical Forest soils. Soil Biol. Biochem. 2008, 40, 2480–2483. [Google Scholar] [CrossRef]
- Kamogawa, M.Y.; Teixeira, M.A. Auto-amostrador de baixo custo para análise por injeção em fluxo. Quim. Nova 2009, 32, 1644–1646. [Google Scholar] [CrossRef]
- Jenkinson, D.S.; Ladd, J.N. Microbial biomass in soil: Measuremente and turnover. In Soil Biochemistry; Paul, E.A., Ladd, J.N., Eds.; Marcel Deker: New York, NY, USA, 1981; pp. 425–471. [Google Scholar]
- Van Veen, J.A.; Ladd, J.N.; Martin, J.K.; Amato, M. Turnover of carbon, nitrogen and phosphorus through the microbial biomass in soils incubated with 14C-, 15N- and 32-P-labelled bacterial cells. Soil Biol. Biochem. 1987, 19, 559–565. [Google Scholar] [CrossRef]
- Eaton, W.D. Microbial and nutrient activity in soils from three different subtropical forest habitats in Belize, Central America, before and during the transition from dry to wet season. Appl. Soil Ecol. 2001, 16, 219–227. [Google Scholar] [CrossRef]
- Carlyle, J.C. Nitrogen cycling in forested ecosystems. For. Abstr. 1986, 47, 307–336. [Google Scholar]
- Smethurst, P.J.; Nambiar, E.K. Distribution of carbon and nutrients and fluxes of mineral nitrogen after-clearfelling a Pinus radiata plantation. Can. J. For. Res. 1990, 20, 1490–1497. [Google Scholar] [CrossRef]
- Gonçalves, J.L.M.; Carlyle, J.C. Modelling the influence of moisture and temperature on net nitrogen mineralization in a forested sandy soil. Soil Biol. Biochem. 1994, 26, 1557–1564. [Google Scholar] [CrossRef]
- Garnett, T.P.; Shabala, S.N.; Smethurst, P.J.; Newman, I.A. Kinetics of ammonium and nitrate uptake by eucalypt roots and associated proton fluxes measured using ion selective microelectrodes. Funct. Plant Biol. 2003, 30, 1165–1176. [Google Scholar] [CrossRef]
- Vale, F.R.; Novais, R.F.; Barros, N.F. Efeito do alumínio sobre a cinética de absorção de amônio e nitrato em raízes intactas de Eucalyptus alba. Rev. Árvore 1984, 8, 123–132. [Google Scholar]
- Adams, M.A.; Attiwill, P.M. Nutrient cycling and nitrogen mineralization in eucalypt forests of souther-eastern Australia- II. Indices of nitrogen mineralization. Plant Soil 1986, 92, 341–362. [Google Scholar] [CrossRef]
- Khanna, P.K. Measurement of changes in the nitrogen status of forest soils due to management practices. In Proceedings of the International Symposium on Forest Soils, Harbin, China, 22–27 July 1990; p. 10.
- Theodorou, C.; Bowen, G.D. Nitrogen transformations in first- and second-rotation Pinus radiata forest soil. Austral. For. Res. 1983, 13, 103–112. [Google Scholar]
- Theodorou, C.; Bowen, G.D. Effects of temperature, moisture and litter on nitrogen mineralization in Pinus radiata forest soils. Austral. For. Res. 1983, 13, 113–119. [Google Scholar]
- Pottker, D.; Tedesco, M.J. Efeito do tipo e tempo de incubação sobre a mineralização da matéria orgânica e nitrogênio total em solos do Rio Grande do Sul. Rev. Bras. Cienc Solo 1979, 3, 20–24. [Google Scholar]
- Noble, A.D.; Herbert, M.A. Influence of soil organic matter content on the responsiveness of Eucalyptus grandis to nitrogen fertiliser. S. Afr. For. J. 1991, 156, 23–27. [Google Scholar]
- Maquere, V.; Laclau, J.P.; Bernoux, M.; Saint-Andre, L.; Gonçalves, J.L.M.; Cerri, C.C.; Piccolo, M.C.; Ranger, J. Influence of land use (savanna, pasture, Eucalyptus plantations) on soil carbon and nitrogen stocks in Brazil. Eur. J. Soil Sci. 2008, 59, 863–877. [Google Scholar] [CrossRef]
- Montero, L.L. Carbono em solos de cerrado: efeitos do uso florestal. In Tese (Doutorado em Ciências, na área de Ecologia)—Instituto de Biociências; Universidade de São Paulo: São Paulo, Brazil, 2008. [Google Scholar]
- Lima, A.M.N.; Silva, I.R.; Neves, J.C.L.; Novais, R.F.; Barros, N.F.; Mendonça, E.D.; Smyth, T.J.; Moreira, M.S.; Leite, F.P. Soil organic carbon dynamics following afforestation of degraded pastures with eucalyptus in southeastern Brazil. For. Ecol. Manag. 2006, 235, 219–231. [Google Scholar] [CrossRef]
- Vitousek, P.M. Litterfall, nutrient cycling and nutrient limitation in tropical forest. Ecology 1984, 65, 285–298. [Google Scholar] [CrossRef]
- Attiwill, P.M.; Leeper, G.W. Forest Soils and Nutrient Cycles; Melbourne University: Carlton, Australia, 1987; p. 202. [Google Scholar]
- Smethurst, P.J.; Nambiar, E.K.S. Changes in soil carbon and nitrogen during the establishment of a second crop of Pinus radiata. For. Ecol. Manag. 1995, 73, 145–155. [Google Scholar] [CrossRef]
- Barros, N.F.; Neves, J.C.L.; Novais, R.F. Recomendação de fertilizantes minerais em plantios de eucalipto. In Nutrição e fertilização florestal; Gonçalves, J.L.M., Benedetti, V., Eds.; IPEF: Piracicaba, Brazil, 2000; pp. 269–286. [Google Scholar]
- Ryan, M.G.; Stape, J.L.; Binkley, D.; Fonseca, S.; Loos, R.A.; Takahashi, E.N.; Silva, C.R.; Silva, S.R.; Hakamada, R.E.; Ferreira, J.M.; et al. Factors controlling Eucalyptus productivity: How water availability and stand structure alter production and carbon allocation. For. Ecol. Manag. 2010, 259, 1695–1703. [Google Scholar] [CrossRef]
© 2015 by the authors; licensee MDPI, Basel, Switzerland. This article is an open access article distributed under the terms and conditions of the Creative Commons Attribution license (http://creativecommons.org/licenses/by/4.0/).
Share and Cite
Pulito, A.P.; Leonardo de Moraes Gonçalves, J.; Smethurst, P.J.; Junior, J.C.A.; Alcarde Alvares, C.; Henrique Tertulino Rocha, J.; Hübner, A.; Fabiano de Moraes, L.; Miranda, A.C.; Kamogawa, M.Y.; et al. Available Nitrogen and Responses to Nitrogen Fertilizer in Brazilian Eucalypt Plantations on Soils of Contrasting Texture. Forests 2015, 6, 973-991. https://doi.org/10.3390/f6040973
Pulito AP, Leonardo de Moraes Gonçalves J, Smethurst PJ, Junior JCA, Alcarde Alvares C, Henrique Tertulino Rocha J, Hübner A, Fabiano de Moraes L, Miranda AC, Kamogawa MY, et al. Available Nitrogen and Responses to Nitrogen Fertilizer in Brazilian Eucalypt Plantations on Soils of Contrasting Texture. Forests. 2015; 6(4):973-991. https://doi.org/10.3390/f6040973
Chicago/Turabian StylePulito, Ana Paula, José Leonardo de Moraes Gonçalves, Philip J. Smethurst, José Carlos Arthur Junior, Clayton Alcarde Alvares, José Henrique Tertulino Rocha, Ayeska Hübner, Luiz Fabiano de Moraes, Aline Cristina Miranda, Marcos Yassuo Kamogawa, and et al. 2015. "Available Nitrogen and Responses to Nitrogen Fertilizer in Brazilian Eucalypt Plantations on Soils of Contrasting Texture" Forests 6, no. 4: 973-991. https://doi.org/10.3390/f6040973
APA StylePulito, A. P., Leonardo de Moraes Gonçalves, J., Smethurst, P. J., Junior, J. C. A., Alcarde Alvares, C., Henrique Tertulino Rocha, J., Hübner, A., Fabiano de Moraes, L., Miranda, A. C., Kamogawa, M. Y., Gava, J. L., Chaves, R., & Silva, C. R. (2015). Available Nitrogen and Responses to Nitrogen Fertilizer in Brazilian Eucalypt Plantations on Soils of Contrasting Texture. Forests, 6(4), 973-991. https://doi.org/10.3390/f6040973