Article

Plot-Scale Deadwood Volume and Litter Depth as Correlates of Scots Pine (Pinus sylvestris L.) Regeneration in Semi-Arid Forests


by
Yavuz Kocademir
1 and
Osman Topaçoğlu
2,*
1
General Directorate of Forestry, Yenimahalle, Ankara 06560, Türkiye
2
Department of Forest Engineering, Faculty of Forestry, Kastamonu University, Kastamonu 37150, Türkiye
*
Author to whom correspondence should be addressed.
Forests 2026, 17(8), 951; https://doi.org/10.3390/f17080951
Submission received: 7 July 2026 / Revised: 5 August 2026 / Accepted: 7 August 2026 / Published: 11 August 2026

Abstract

Deadwood is widely recognized as an important structural component of forest ecosystems, yet its relationship with natural regeneration remains highly context-dependent, particularly in semi-arid forests. This study evaluated associations of plot-scale downed deadwood volume, litter depth, and stand basal area with Scots pine (Pinus sylvestris L.) seedling and sapling abundance in central Türkiye. Field measurements were conducted in 60 circular plots distributed across five naturally regenerated stands. Relationships were explored using Spearman rank correlations and evaluated using four unified zero-inflated negative binomial generalized linear mixed models (ZINB-GLMMs) that accounted for stand differences and paired seedling–sapling observations within plots. Downed deadwood was spatially heterogeneous and dominated by coarse woody debris, whereas fine woody debris contributed little to the total volume. Neither coarse woody debris, fine woody debris, total downed deadwood volume, nor basal area was significantly correlated with seedling or sapling abundance. In a supplementary unadjusted comparison, regeneration abundance did not differ between plots with and without deadwood (Wilcoxon tests, p > 0.05). Spearman correlations showed opposite associations between litter depth and seedlings (ρ = −0.312, p = 0.015) and saplings (ρ = 0.260, p = 0.045). However, AICc model comparison favored the baseline model containing the regeneration stage and stand identity (AICc = 517.26, Akaike weight = 0.672), and the unified model did not detect a significant regeneration stage × litter depth interaction (β = 0.138, p = 0.666). These findings indicate that contrasting bivariate litter-depth associations were not confirmed as a robust stage-dependent response after accounting for stand effects, zero inflation, and within-plot pairing. At the plot scale, total deadwood volume alone did not explain Scots pine regeneration abundance in the studied semi-arid forests.

1. Introduction

Natural regeneration is a fundamental process governing the long-term stability, resilience, and continuity of forest ecosystems. Successful regeneration depends on complex interactions among forest structure, microsite conditions, climate, and disturbance history, which together determine seed germination, seedling establishment, and subsequent recruitment [1,2]. Understanding the ecological factors controlling regeneration is therefore essential for developing sustainable forest management strategies, particularly in forests where environmental constraints strongly limit regeneration success.
Among the structural components of forest ecosystems, deadwood is widely recognized as an important contributor to biodiversity, nutrient cycling, soil development, and habitat heterogeneity [3,4]. Deadwood is commonly classified into coarse woody debris (CWD) and fine woody debris (FWD) according to size. CWD generally comprises logs and large branches exceeding 10 cm in diameter, whereas FWD consists of smaller woody material. These components differ in both persistence and ecological function. CWD provides long-lasting structural complexity and potential regeneration microsites, whereas FWD decomposes more rapidly and primarily contributes to short-term nutrient cycling.
Numerous studies have shown that deadwood can facilitate tree regeneration by increasing soil moisture, moderating near-ground temperature fluctuations, reducing competition from ground vegetation, and providing elevated microsites for seed establishment [5,6]. These benefits are particularly evident on decaying logs, where improved moisture availability and reduced competition may increase seedling survival [7,8,9,10]. Consequently, deadwood retention has become a widely recommended practice in close-to-nature forestry and biodiversity-oriented forest management.
However, the influence of deadwood on regeneration is highly context-dependent. Positive effects have been reported primarily in cool, humid forests, where moisture availability limits seedling performance only intermittently. In contrast, under semi-arid conditions, persistent water limitation may reduce deadwood’s capacity to function as an effective regeneration substrate, while other forest-floor characteristics may become relatively more important. Furthermore, most studies have evaluated deadwood using total volume at the plot or stand scale, although regeneration responses frequently depend on much finer-scale microsite characteristics, including the spatial position of logs, the decomposition stage, soil contact, and local microclimatic conditions [8,9,10]. Consequently, the relationship between total deadwood volume and regeneration remains uncertain in water-limited forest ecosystems.
Forest floor conditions may also strongly influence regeneration independently of deadwood. Among these, litter depth is considered one of the most important factors regulating seed germination and early establishment. Thick litter layers may reduce seed-soil contact, limit light penetration, and create physical barriers that inhibit seedling emergence [11]. Conversely, litter can improve soil moisture retention, buffer temperature fluctuations, and increase nutrient availability, potentially enhancing the survival and growth of older regeneration stages [12]. These contrasting ecological functions suggest that litter may exert different effects during successive stages of regeneration.
Although both deadwood and litter have been studied extensively, relatively few studies have simultaneously evaluated their relative importance, particularly in semi-arid Scots pine (Pinus sylvestris L.) forests. Moreover, most previous studies have analyzed seedlings and saplings separately, making it difficult to determine whether regeneration responses differ significantly between developmental stages. Explicitly testing stage-dependent responses within a unified statistical framework may therefore provide a clearer understanding of regeneration dynamics than analyzing life stages in isolation.
The present study evaluated whether plot-scale downed deadwood volume, stand basal area, and litter depth were associated with the abundance of Scots pine regeneration in central Türkiye. Using a unified mixed-model framework, we formally tested whether litter-depth associations differed between seedlings and saplings while accounting for stand differences and paired observations within plots.

2. Materials and Methods

2.1. Study Area

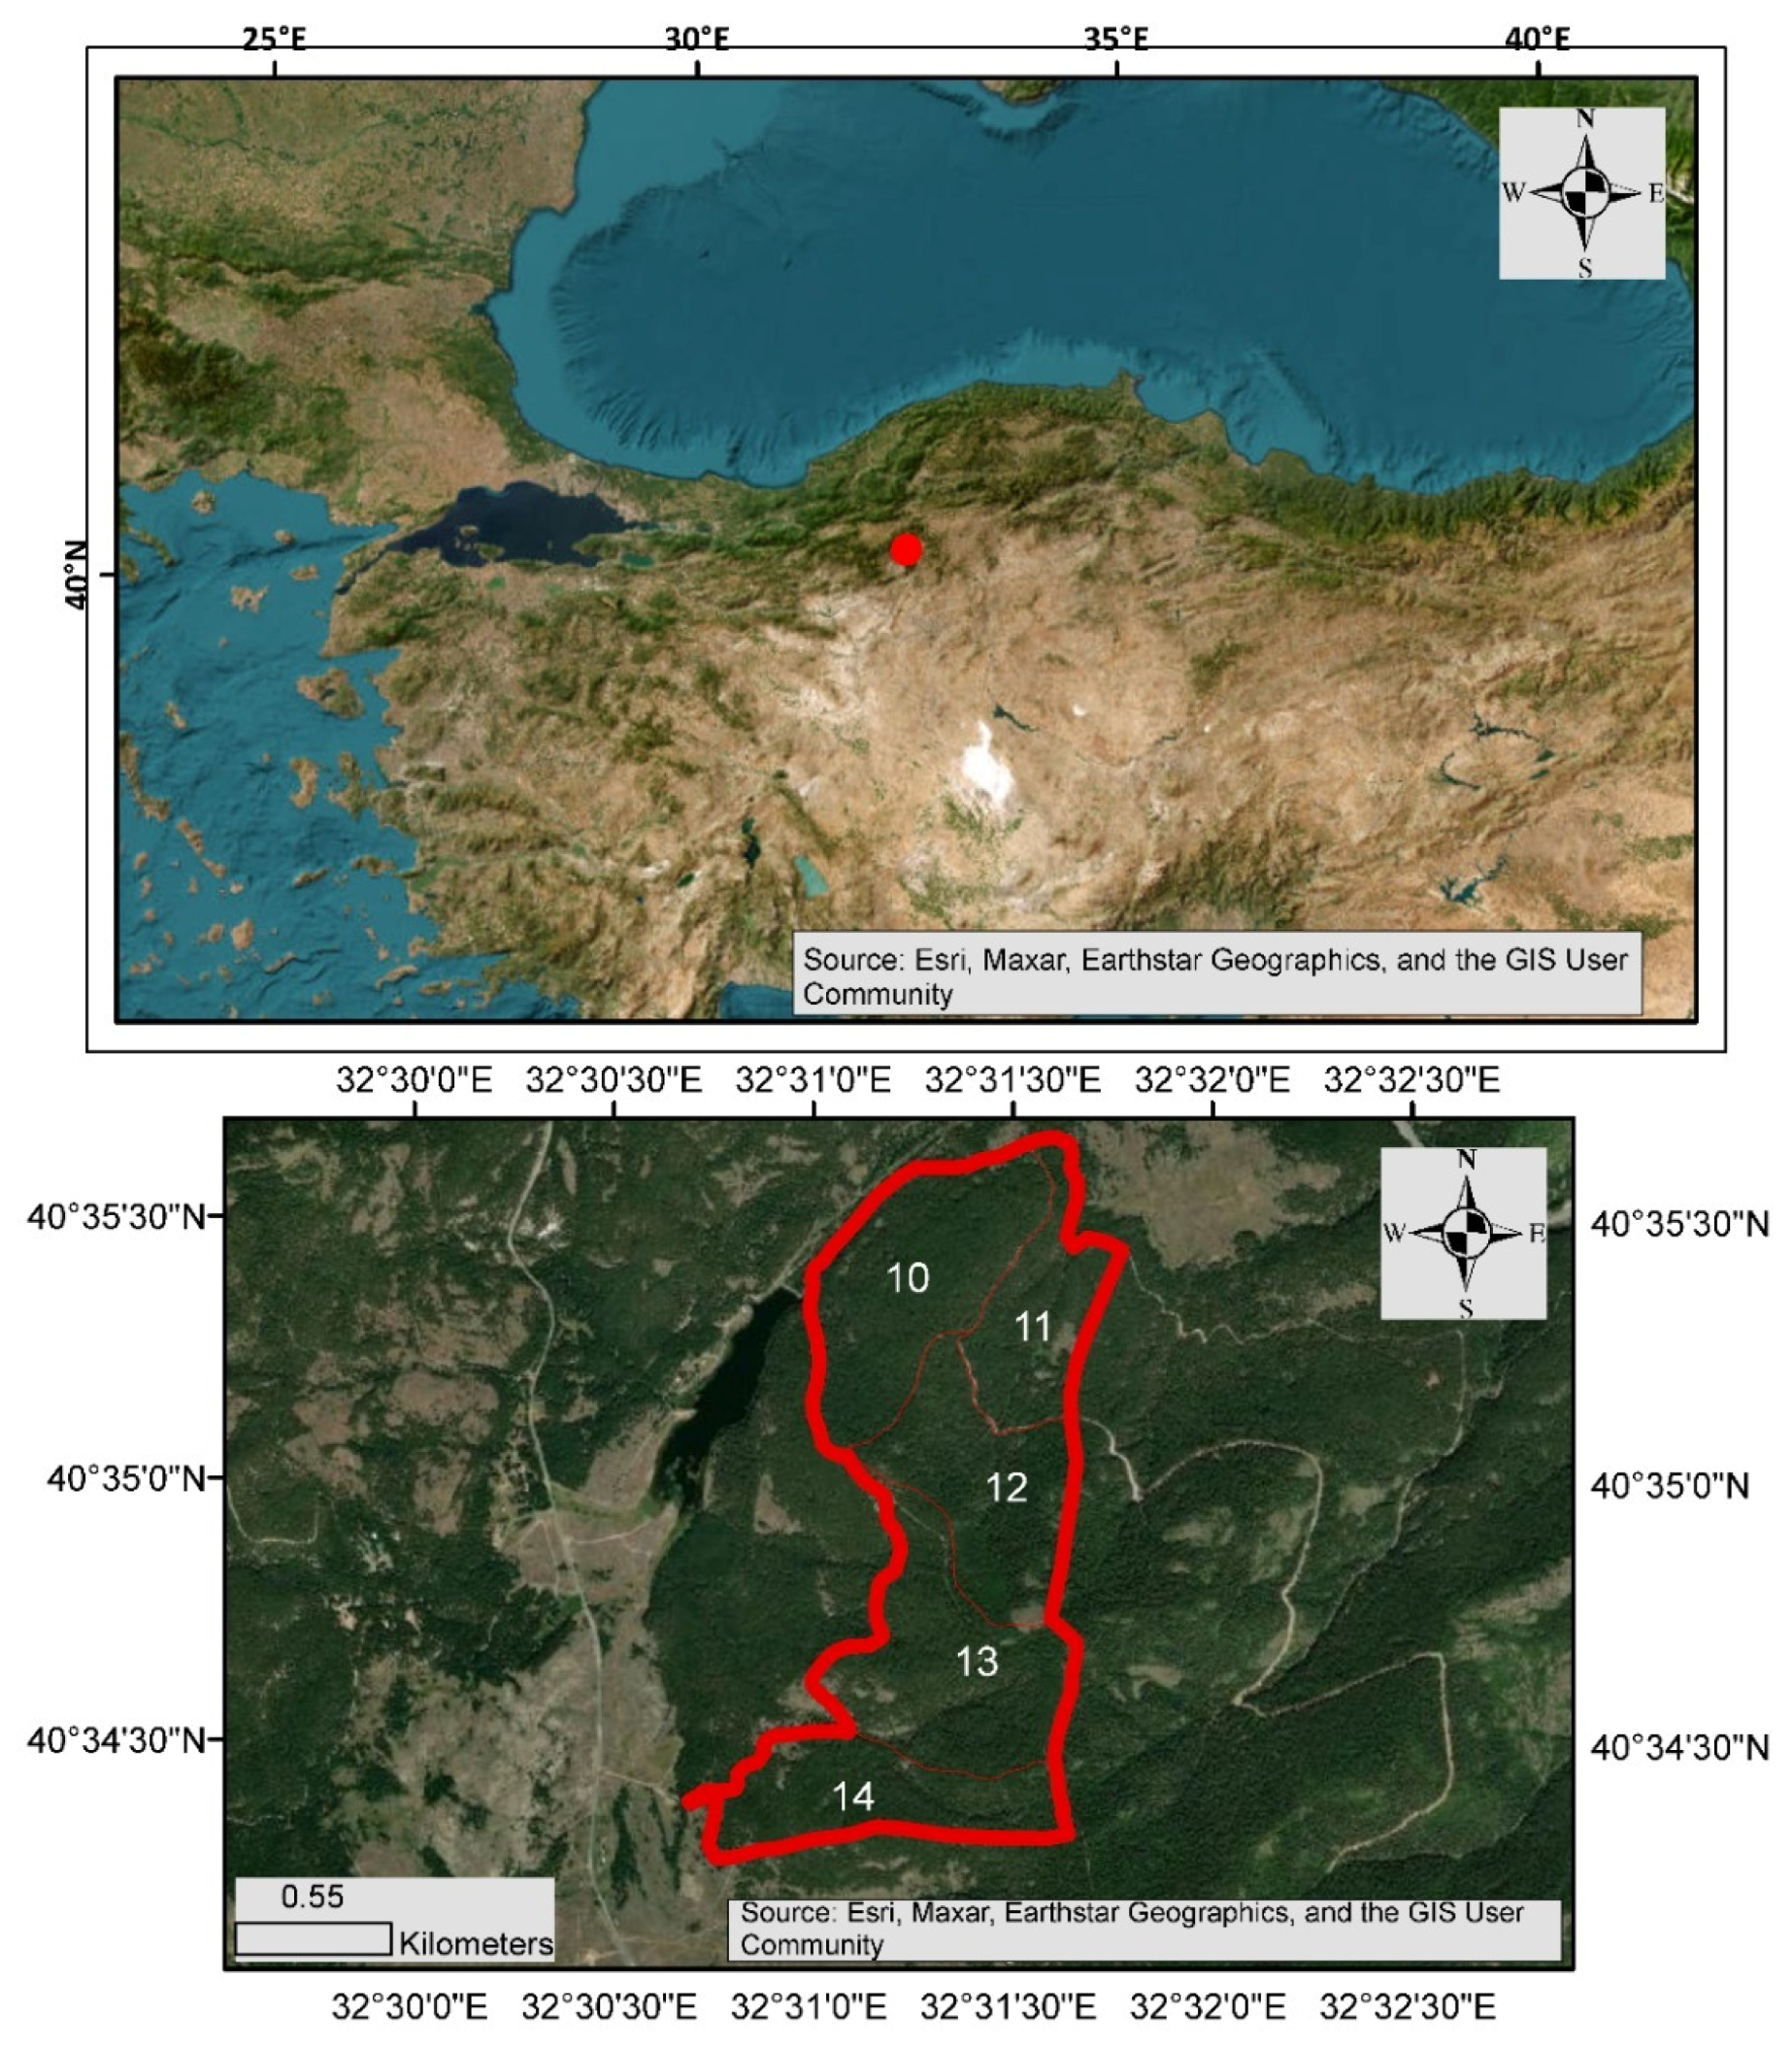
The study was conducted in the Çamkoru Dr. Fuat Adalı Research Forest located in Ankara Province, central Türkiye. The area lies within the Irano–Turanian phytogeographic region and represents the natural distribution range of Scots pine (Pinus sylvestris L.), black pine (Pinus nigra Arnold), and several Quercus species. The region has a continental climate with cold winters and dry summers. According to meteorological observations collected between 2014 and 2024 at a weather station located at 1400 m a.s.l., the mean annual precipitation was 482 mm, and the mean annual temperature was 9.9 °C. The vegetation period extends from May to September [13]. The study area is situated at an average elevation of approximately 1525 m a.s.l. Soils are predominantly moderately deep brown forest soils with depths ranging from 50 to 90 cm. Forest vegetation in the area is dominated by stands of Scots pine and black pine. Scots pine constitutes approximately 41.2% of the forested area, whereas black pine accounts for 3.4%; mixed stands of these species cover nearly 55.5% of the forest area. The understory vegetation commonly includes Juniperus communis var. saxatilis Pall., Rubus idaeus L., Ilex aquifolium L., Rosa canina L., Thymus praecox Opiz, Artemisia vulgaris L., and Hedera helix L. [14]. The locations of the five sampled stands are presented in Figure 1.

2.2. Study Design and Measurements

A total of 60 circular sample plots (200 m2 each) were established in 2024 across five naturally regenerated Scots pine stands. The selected stands represented naturally regenerated Scots pine forests with contrasting amounts of downed deadwood while sharing similar climatic conditions, stand structure, site characteristics, and management history (Table 1). Within each stand, sample plots were established using a random sampling approach. The number of plots per stand was 20, 12, 7, 12, and 9, respectively. Although the number of plots varied among stands, all selected stands exhibited comparable stand characteristics, and all plots were established using the same random sampling protocol and measurement procedures to ensure methodological consistency throughout the study. Within each plot, downed deadwood, stand structure, litter depth, and natural regeneration were assessed.
Downed deadwood was classified into coarse woody debris (CWD; diameter > 10 cm) and fine woody debris (FWD; diameter ≤ 10 cm and ≥ 2 cm). Only woody pieces with a minimum length of 1 m were included in the inventory. The volume of each deadwood piece was calculated individually and expressed as m3 ha−1. Total downed deadwood volume was obtained by summing CWD and FWD. Each deadwood element was additionally assigned to one of seven decay classes (DC1–DC7) following [15]. Deadwood volume was calculated for the entire 200 m2 plot.
The volume of each CWD and FWD piece was calculated using the frustum of a cone formula:
V = π h 3   r 1 2 + r 1 · r 2 + r 2 2
where r1 and r2 are the radii of the two ends and h is the length of the piece.
All living trees with DBH > 10 cm inside each 200 m2 plot were measured to calculate stand basal area (m2 ha−1).
Natural regeneration was assessed using three randomly located 10 m2 subplots within each plot, resulting in a total sampled regeneration area of 30 m2 per plot. Only Scots pine (Pinus sylvestris L.) regeneration was included in the analyses.
Individuals shorter than 1 m were classified as seedlings, whereas individuals taller than 1 m with DBH < 10 cm were classified as saplings. Seedling and sapling counts from the three subplots were summed for each plot, and these integer counts were used directly as response variables in all statistical analyses.
Litter depth was measured to the nearest 0.1 cm at 10 randomly selected points within each 200 m2 plot, and the mean litter depth was calculated for each plot.

2.3. Statistical Analysis

All statistical analyses were performed in R version 4.3.2 [16]. Before analysis, the dataset was checked for completeness and consistency, and no missing values were found. Seedling and sapling abundances were analyzed as integer count data without transformation.
Stand-level descriptive statistics were calculated for downed deadwood volume, basal area, litter depth, and regeneration variables. Because deadwood volume exhibited a highly right-skewed distribution with numerous zeros, medians and interquartile ranges (IQRs) were used for descriptive summaries. Logarithmic transformation was applied only for graphical visualization. Boxplots were used to illustrate the distributions of coarse woody debris (CWD), fine woody debris (FWD), and deadwood volume across stands and decay classes.
Relationships between environmental variables and regeneration were evaluated using Spearman’s rank correlation coefficients (ρ) because several variables showed non-normal and zero-inflated distributions. Correlation coefficients and associated p-values were calculated for CWD, FWD, total downed deadwood volume, basal area, litter depth, seedling abundance, and sapling abundance. The relationship between basal area and litter depth was also examined to evaluate potential structural collinearity.
To evaluate whether environmental relationships differed between developmental stages, seedling and sapling observations were combined into a long-format dataset and analyzed using zero-inflated negative binomial generalized linear mixed models (ZINB-GLMMs) implemented in the glmmTMB package. Regeneration stage and stand identity were included as fixed effects, while plot identity was included as a random intercept to account for paired seedling and sapling observations originating from the same plot. Because excess zeros were concentrated in the sapling stage, the regeneration stage was included in the zero-inflation component. All models used a type 2 negative binomial distribution with a log link.
Four unified candidate models were compared: (i) a baseline model including regeneration stage and stand identity; (ii) an additive model additionally including litter depth; (iii) an interaction model including regeneration stage, litter depth, and their interaction; and (iv) a full environmental model including regeneration stage interactions with CWD, FWD, basal area, and litter depth. Plot identity was retained as a random intercept in every model, and the zero-inflation component included the regeneration stage in every model. Model selection was based on the corrected Akaike Information Criterion (AICc). Models with ΔAICc < 2 were considered to have substantial empirical support, and Akaike weights were used to quantify relative model support. The regeneration stage × litter depth coefficient in the interaction model was used to formally test whether litter-depth responses differed between seedlings and saplings.
Wald standard errors and p-values were reported for fixed-effect coefficients. Model assumptions were evaluated using simulated residuals from the DHARMa package, including tests of residual uniformity, dispersion, and zero inflation. Only converged models with a positive-definite Hessian and identical observation counts were compared. Finally, as a supplementary unadjusted comparison, seedling and sapling abundances were compared between plots with and without downed deadwood using Wilcoxon rank-sum tests because regeneration counts were not normally distributed.
Because only five stands were sampled, a stand-level random effect would not provide a reliable estimate of among-stand variance. Stand identity was therefore included as a fixed blocking factor, whereas plot identity was included as a random intercept to account for paired seedling and sapling observations from the same plot. Consequently, stand-related coefficients should be interpreted only as adjustments for the five sampled stands.
During the preparation of this manuscript, the authors used the web-based version of ChatGPT (OpenAI, San Francisco, CA, USA; accessed July–August 2026) to assist with English-language editing, manuscript structuring, and preparation of R scripts and the web-based version of DeepL Translator (DeepL SE, Cologne, Germany; accessed July–August 2026) for language editing. All AI-assisted outputs were critically reviewed, verified, and revised by the authors. All statistical analyses, model implementation, interpretation of results, and scientific conclusions were performed independently by the authors, who assume full responsibility for the manuscript’s final content.

3. Results

3.1. Stand Structure and Deadwood Distribution

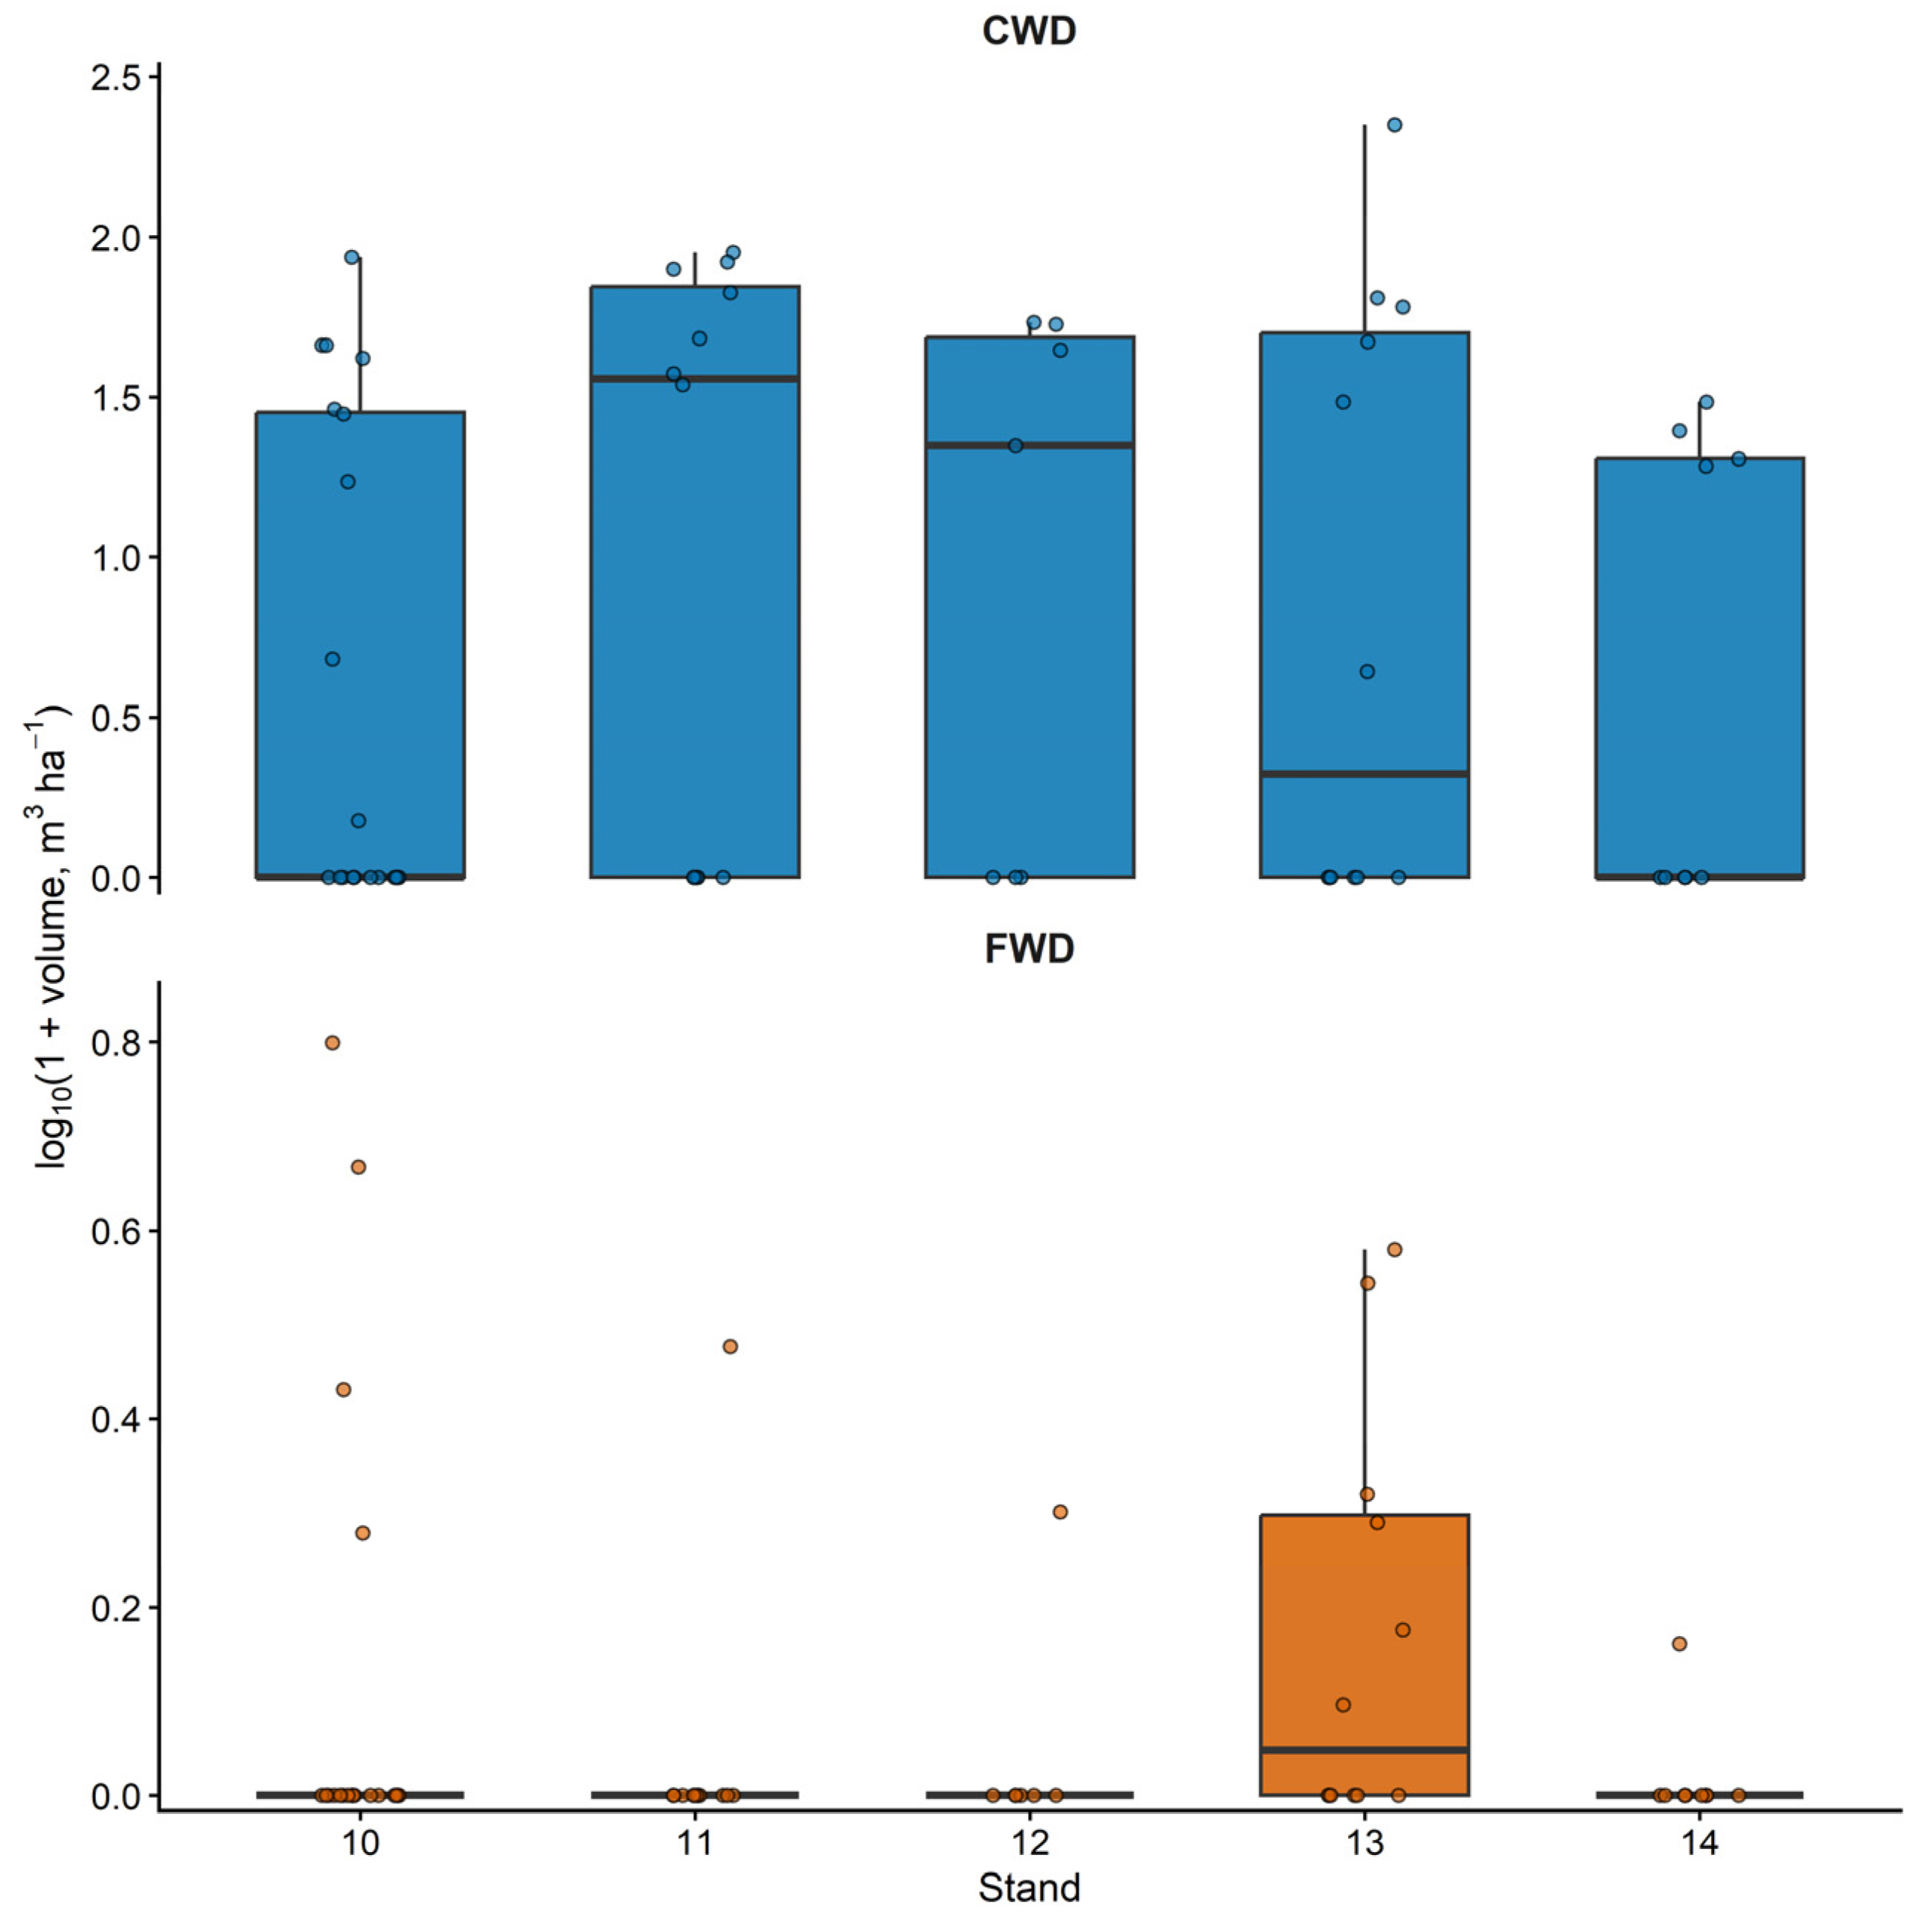
A total of 60 circular sample plots were established across five naturally regenerated Scots pine stands in central Türkiye. The number of plots sampled in stands 10, 11, 12, 13, and 14 was 20, 12, 7, 12, and 9, respectively. Downed deadwood exhibited pronounced spatial heterogeneity among plots (Table 2). Half of the sampled plots (n = 30) contained no downed deadwood, whereas the remaining plots contained varying amounts of coarse woody debris (CWD) and fine woody debris (FWD). Deadwood volume varied by more than two orders of magnitude among plots, indicating a highly heterogeneous distribution of woody material across the study area. Across all stands, coarse woody debris consistently represented the dominant component of total downed deadwood, whereas fine woody debris remained negligible in most plots (Table 2). The highly skewed distribution of deadwood volume among stands is illustrated in Figure 2.
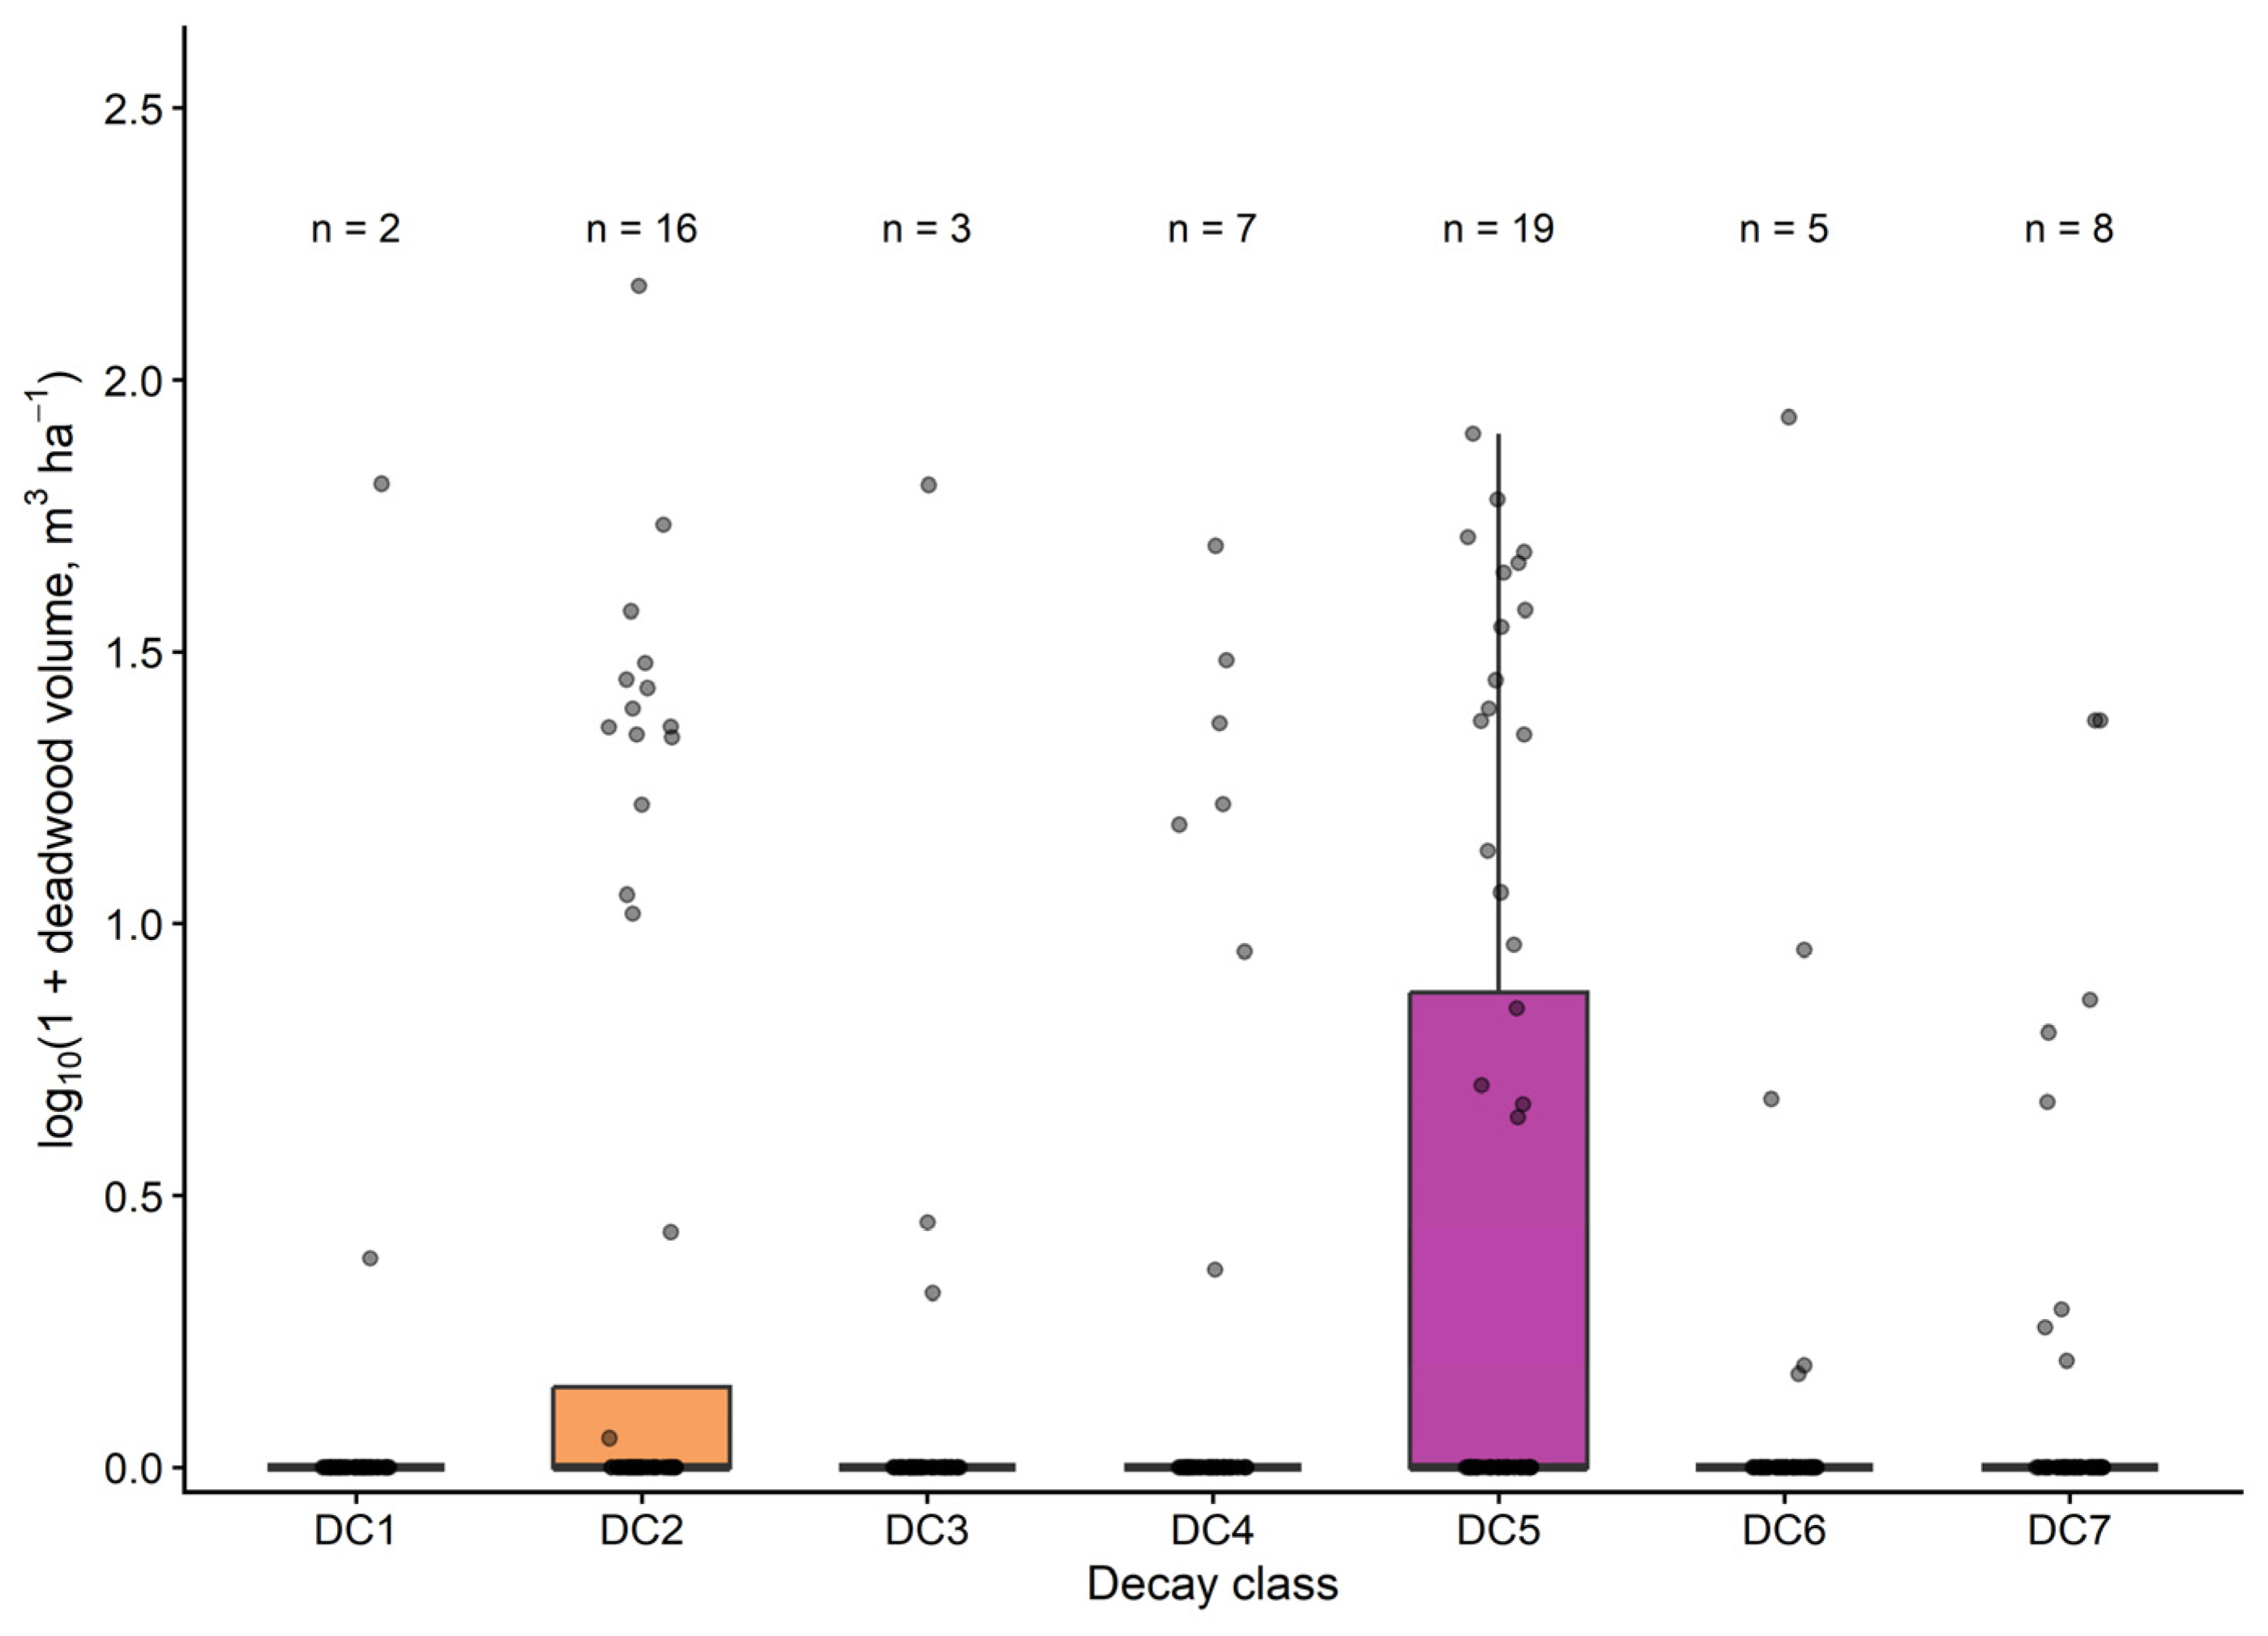
Deadwood was not evenly distributed among decomposition classes. Intermediate decay classes (DC2, DC4, and DC5) accounted for the largest proportion of downed deadwood volume, whereas recently fallen (DC1) and highly decomposed material (DC6–DC7) contributed comparatively little (Figure 3).
Compared with deadwood variables, stand basal area and litter depth showed relatively limited variation among stands (Table 2). Seedling abundance varied considerably among plots, whereas sapling abundance remained generally low, with many plots containing no saplings, consistent with the excess-zero structure accommodated in the subsequent models.

3.2. Relationships Between Environmental Variables and Regeneration

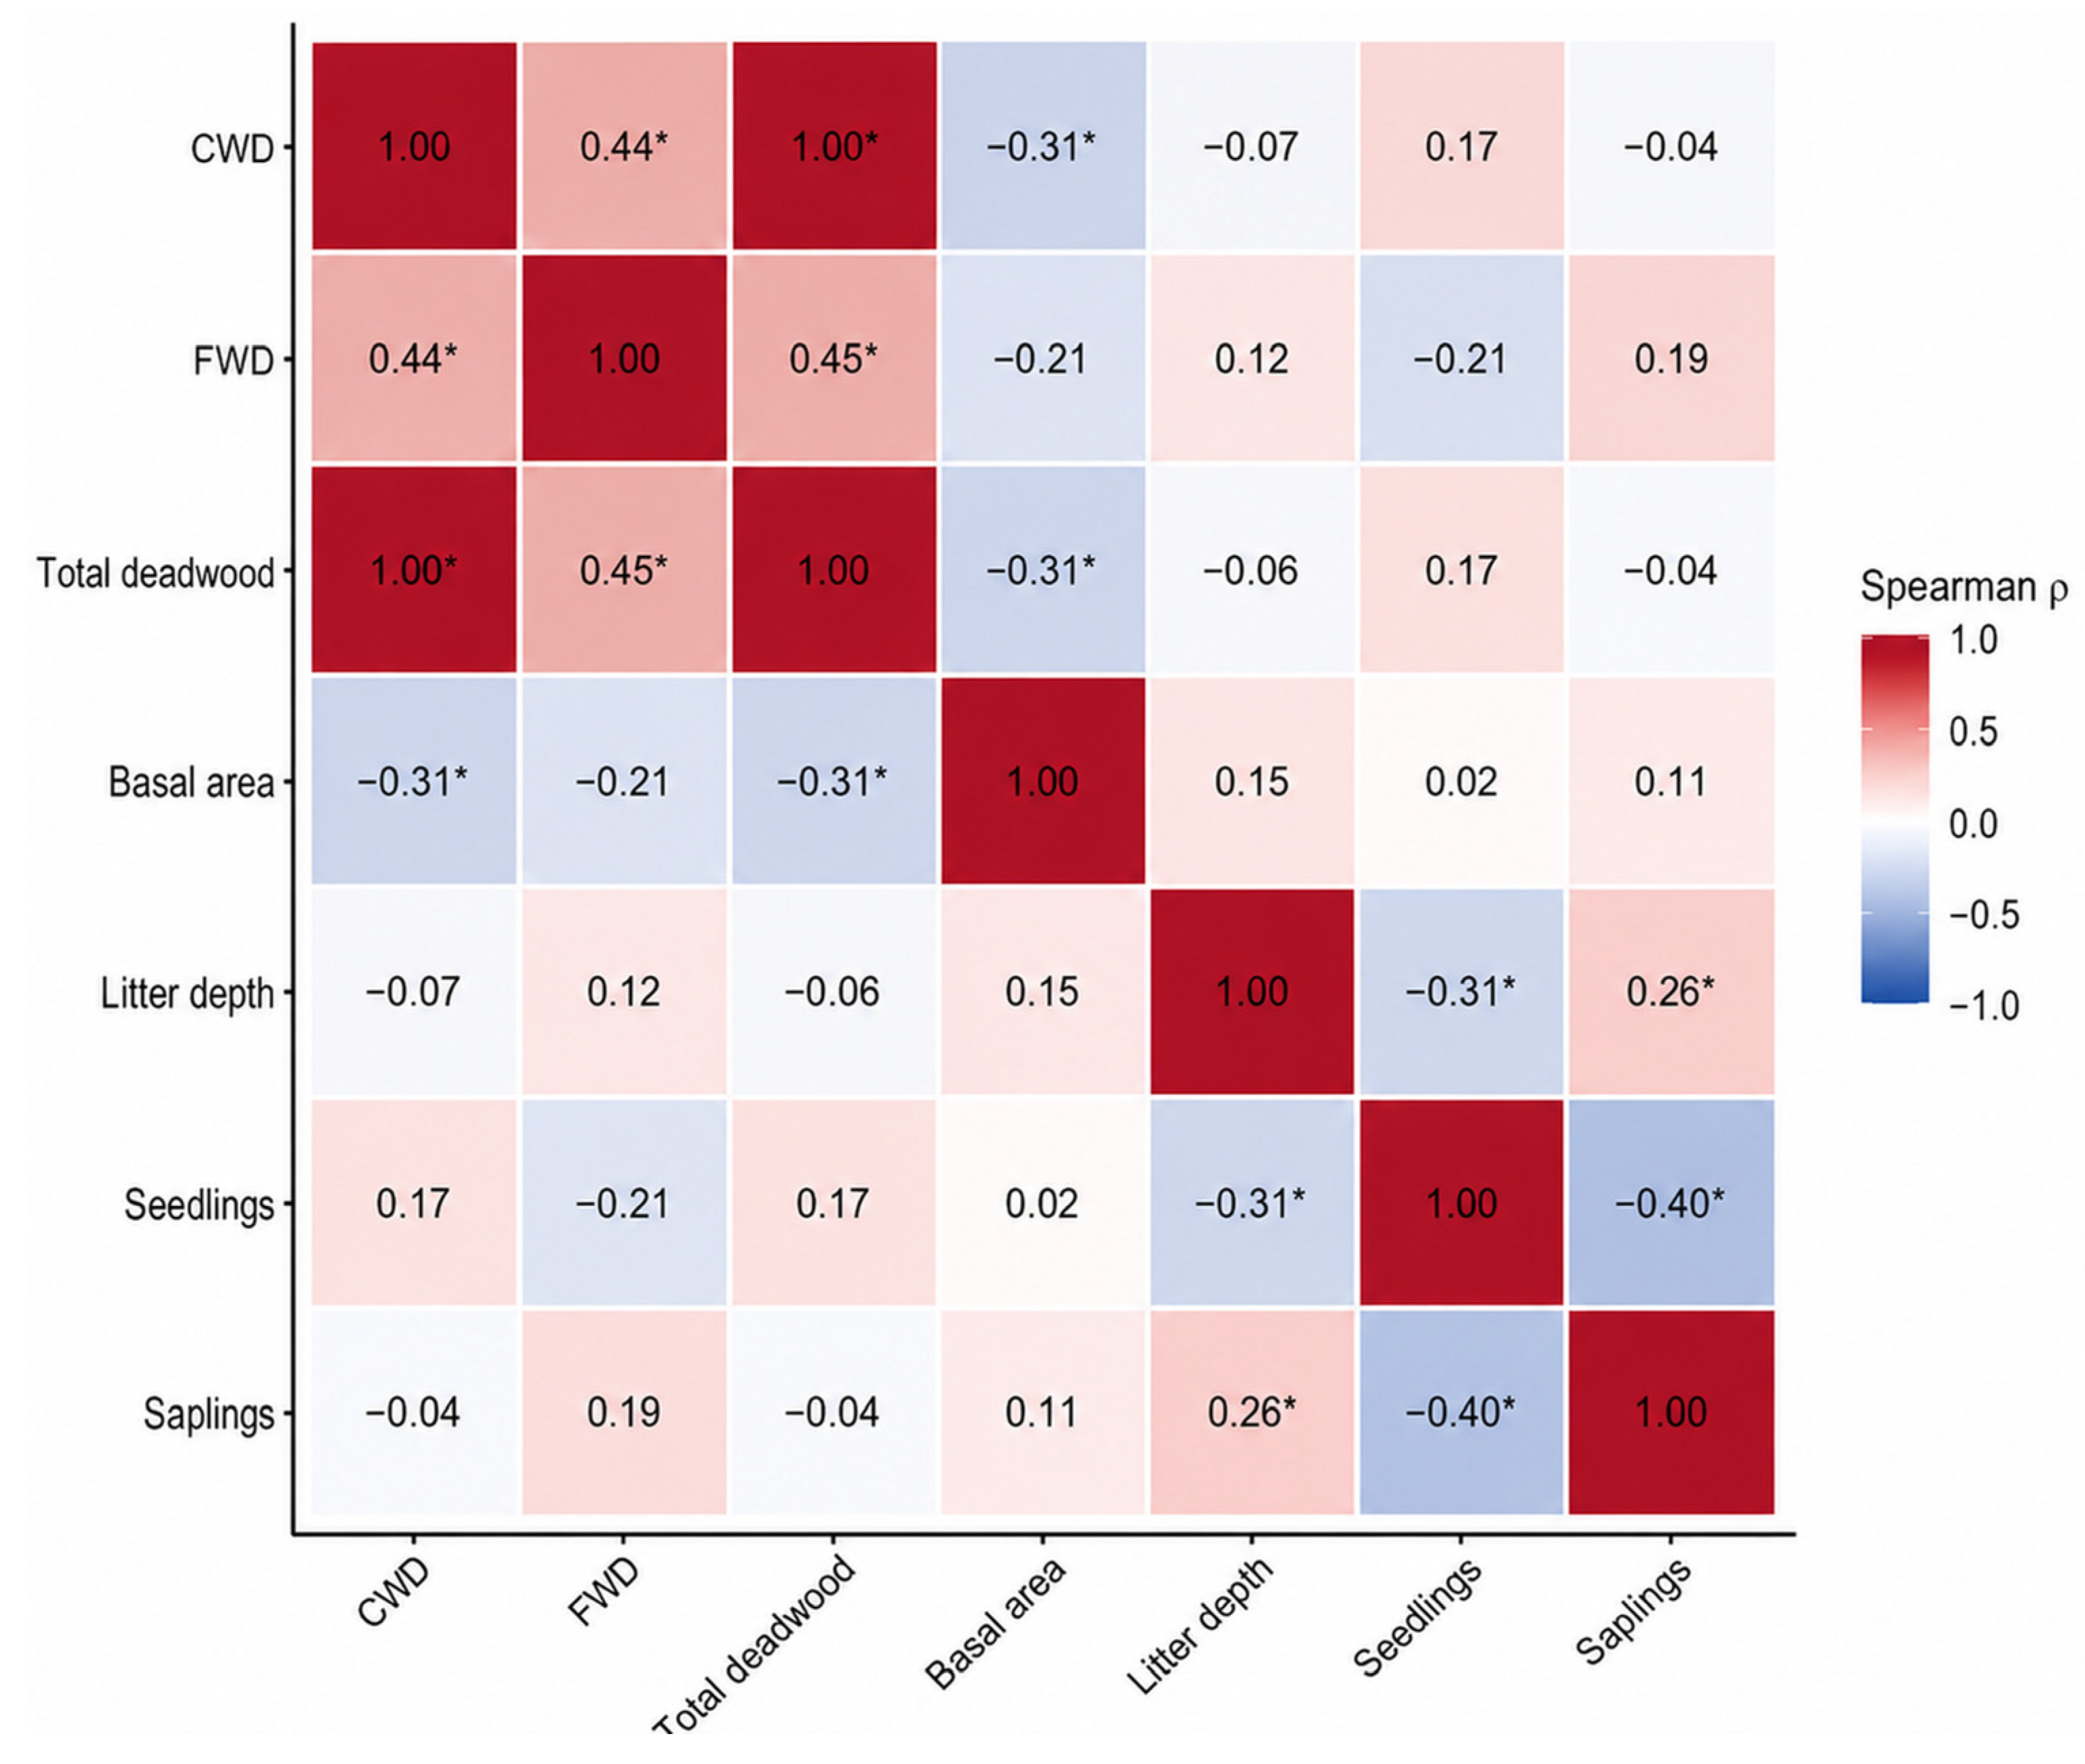
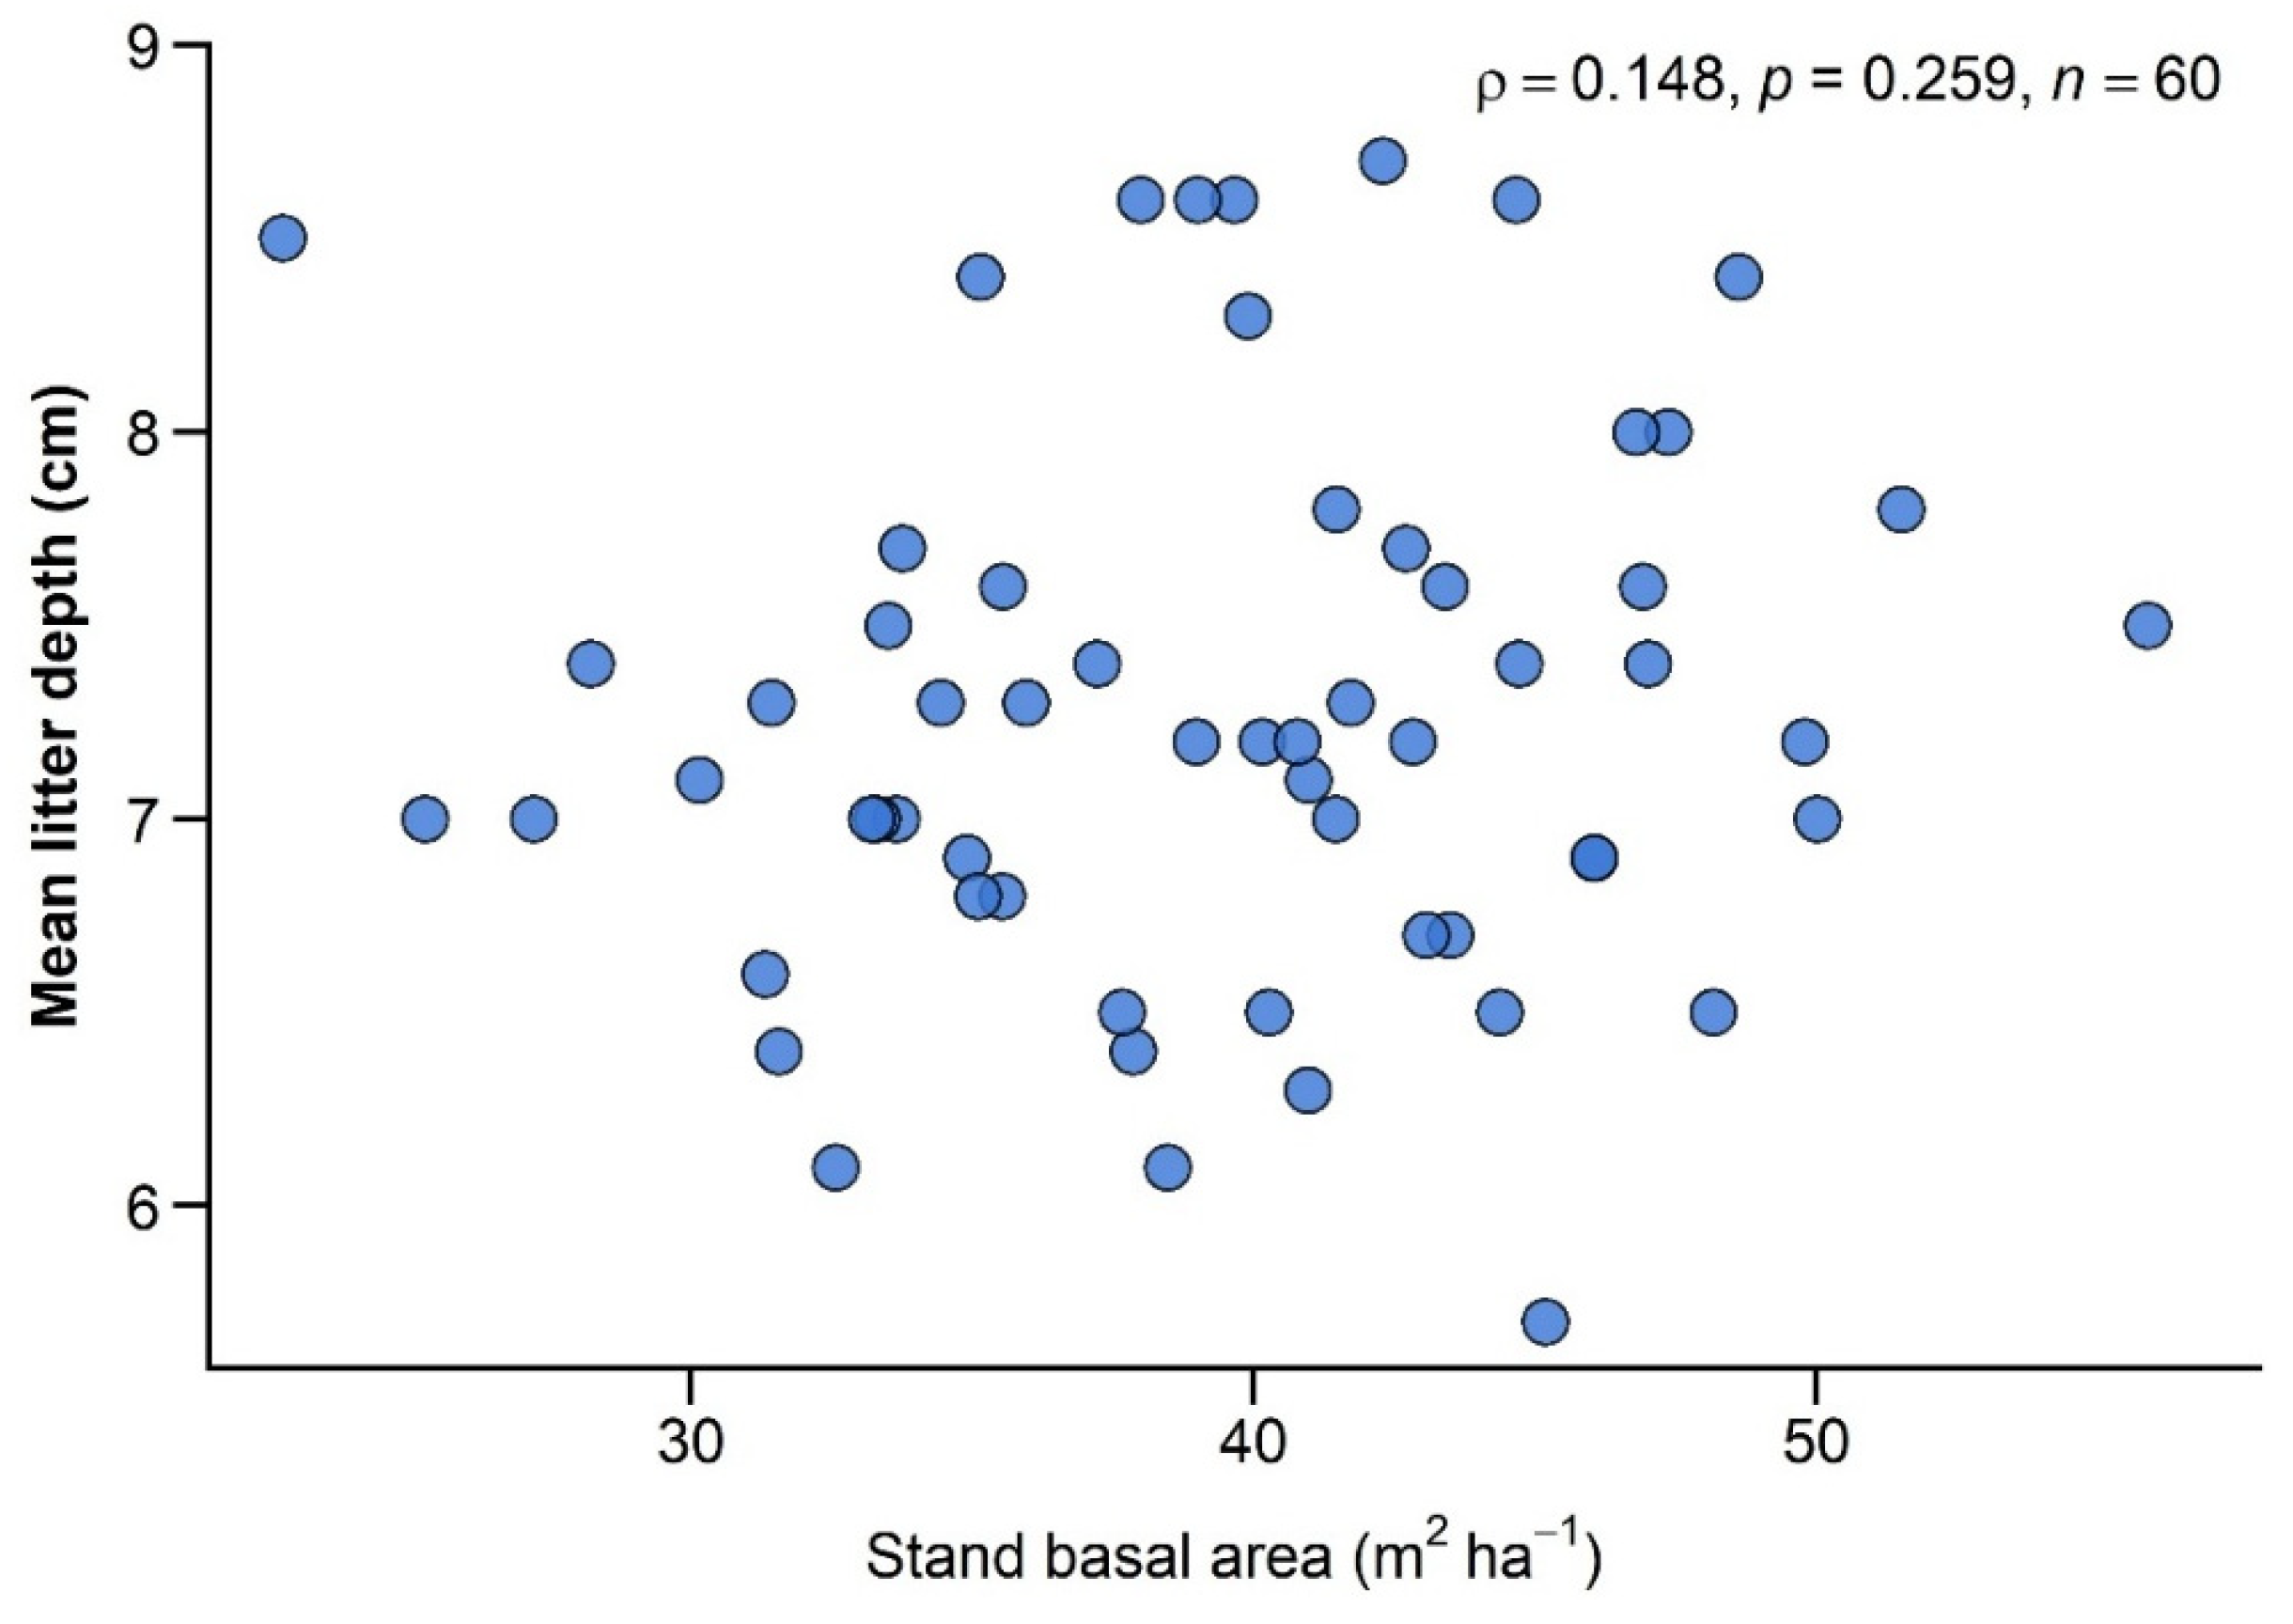
Spearman’s rank correlation coefficients among environmental and regeneration variables are visualized in Figure 4. Litter depth showed a negative bivariate association with seedling abundance (ρ = −0.312, p = 0.015) and a positive bivariate association with sapling abundance (ρ = 0.260, p = 0.045). CWD, FWD, total downed deadwood volume, and basal area were not significantly correlated with either regeneration stage. Spearman’s rank correlation analysis revealed no significant association between stand basal area and mean litter depth (ρ = 0.148, p = 0.259; Figure 5).

3.3. Unified Model Comparison and Test of Stage-Dependent Responses

All four unified ZINB-GLMMs used the same 120 observations and converged with positive-definite Hessians. DHARMa residual diagnostics for the best-supported baseline model showed no significant deviation from residual uniformity (p = 0.098), no evidence of overdispersion or underdispersion (p = 0.802), and no evidence of excess zero inflation relative to model expectations (p = 1.000). AICc model comparison favored the baseline model that included the regeneration stage and stand identity (AICc = 517.26, Akaike weight = 0.672; Table 3). Although the baseline model received the greatest support, the additive litter-depth model remained competitive (ΔAICc = 1.99, Akaike weight = 0.248), indicating some model-selection uncertainty. The interaction model received substantially less support (ΔAICc = 4.28, Akaike weight = 0.079), whereas the full environmental model was poorly supported (ΔAICc = 16.17, Akaike weight < 0.001).
In the interaction model, the regeneration stage x litter depth interaction was not statistically significant (β = 0.138, SE = 0.318, z = 0.432, p = 0.666). The litter-depth coefficient for the seedling reference stage was also not significant (β = −0.066, SE = 0.090, z = −0.730, p = 0.466). Thus, although the bivariate correlations were in opposite directions, the unified analysis did not provide evidence that litter-depth responses differed significantly between seedlings and saplings after accounting for stand identity, zero inflation, and paired observations within plots.

3.4. Regeneration Differences Between Plots with and Without Deadwood

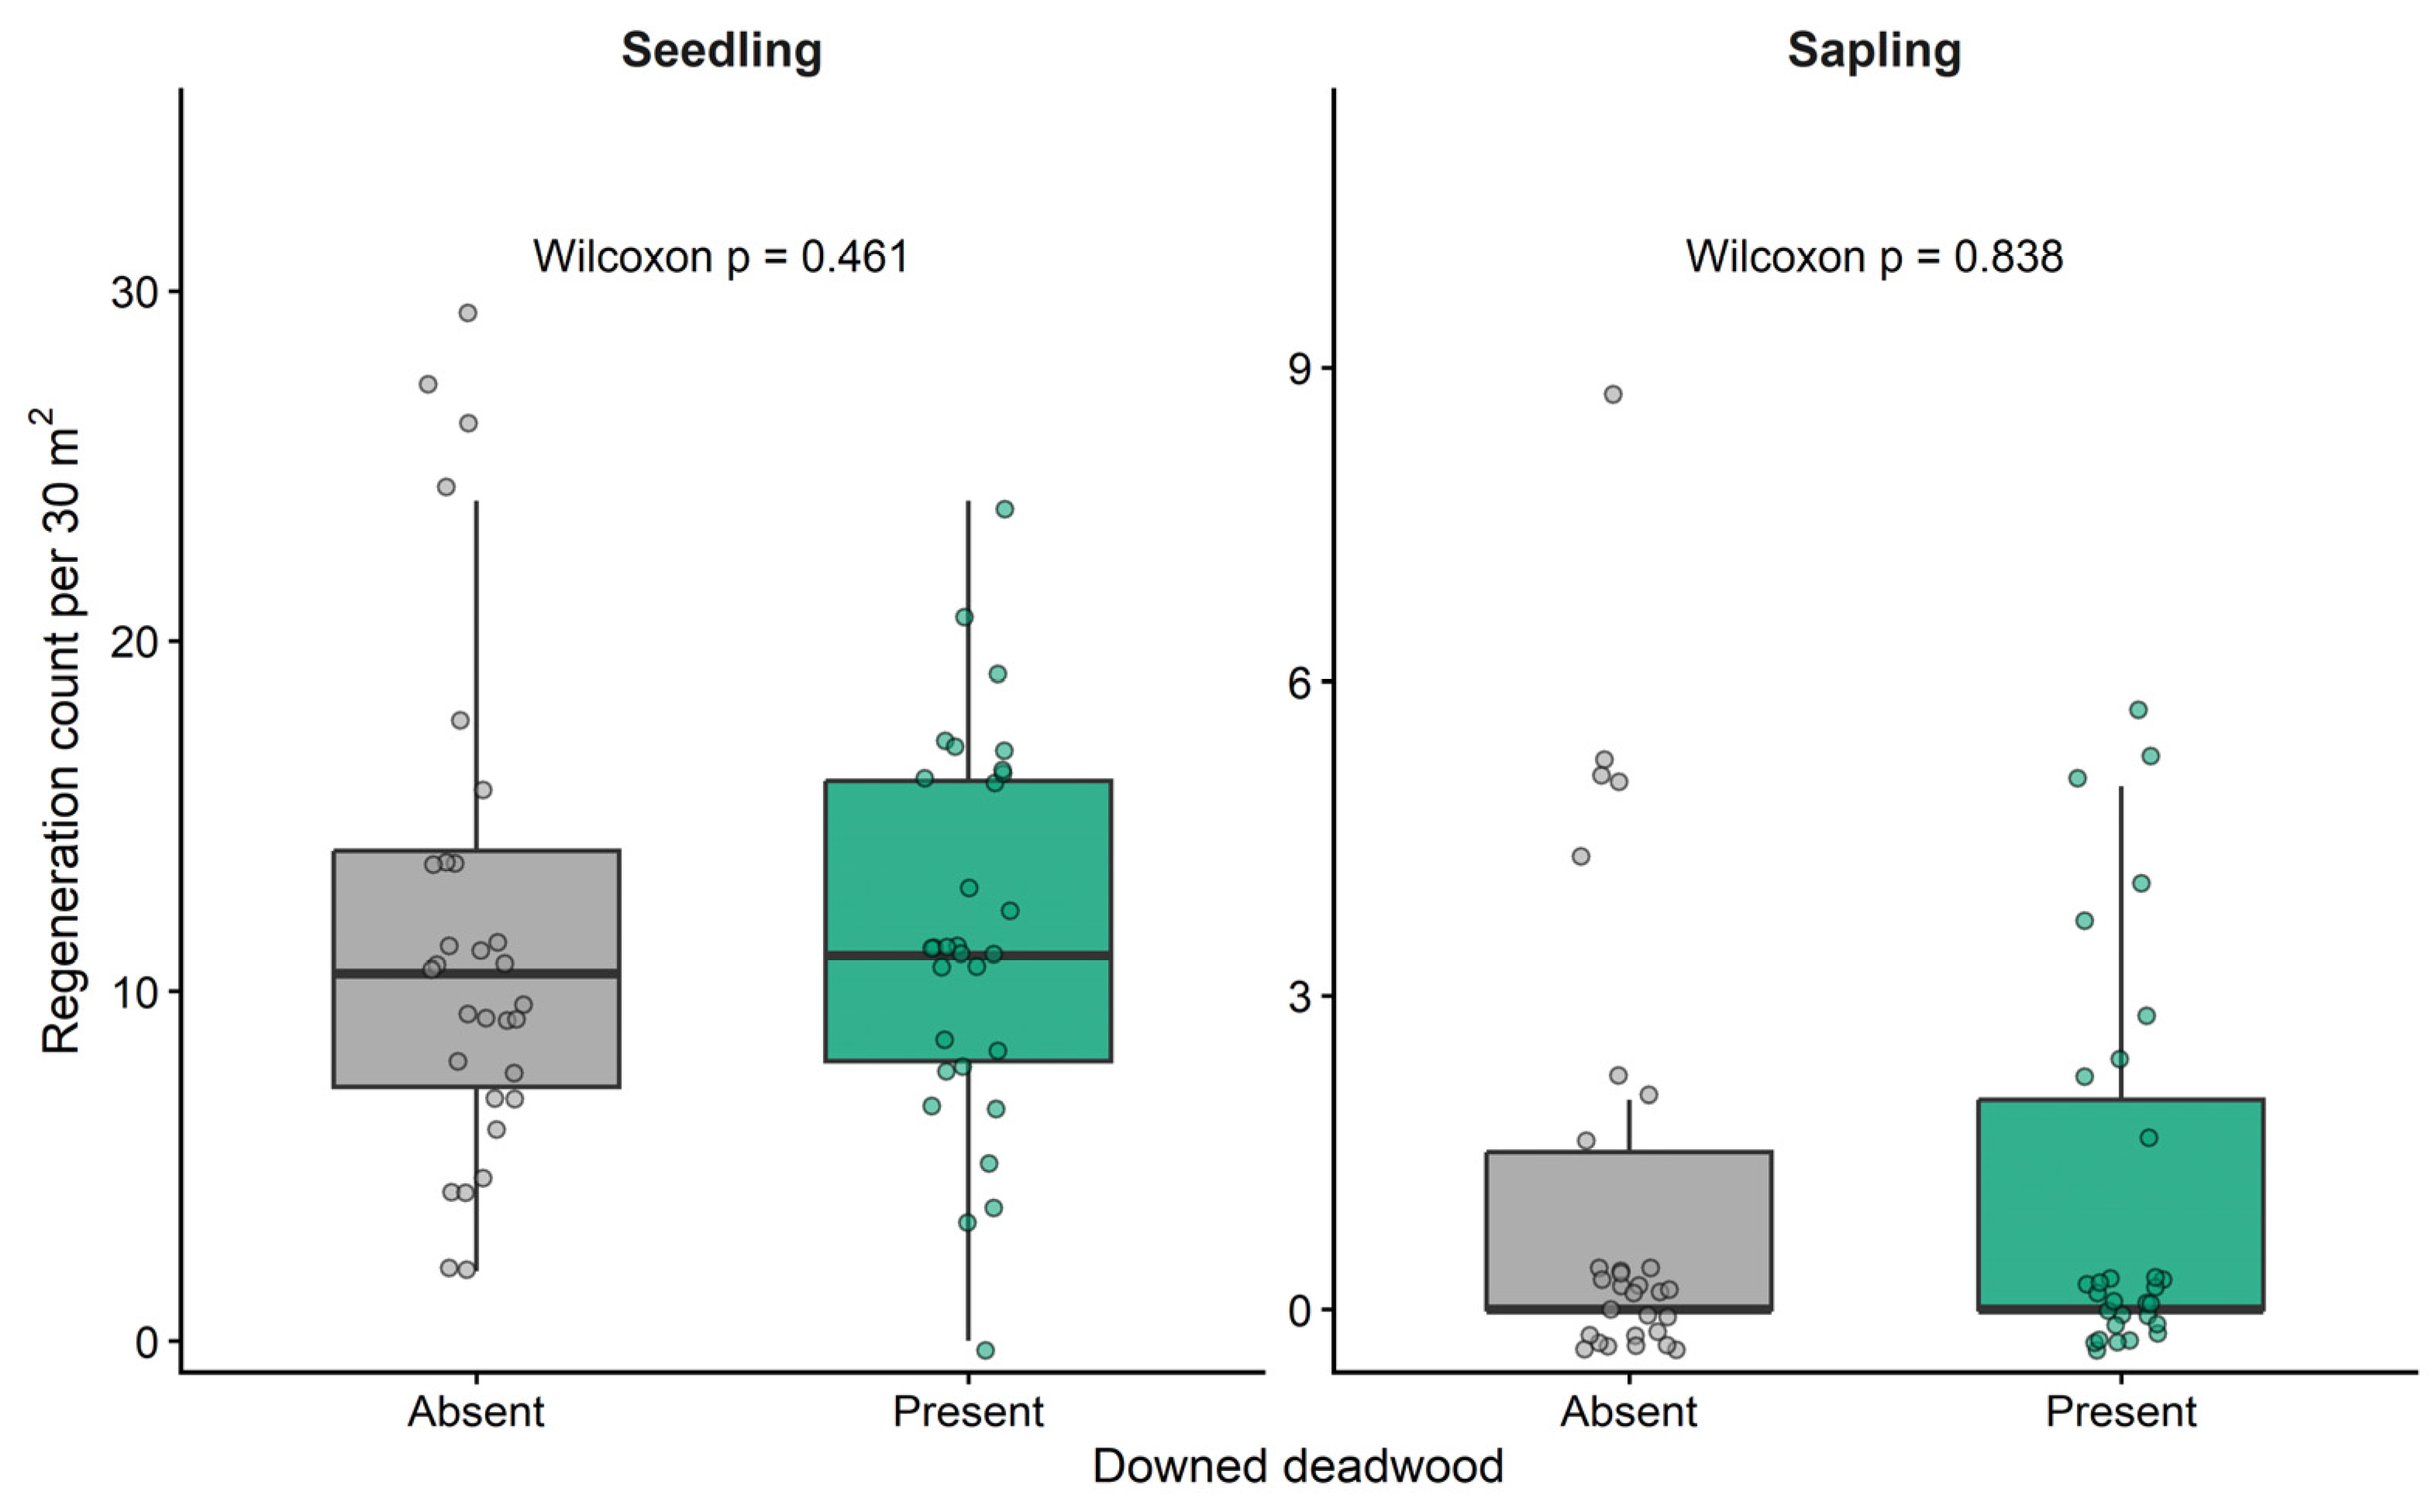
In the supplementary unadjusted comparison, seedling and sapling abundance did not differ significantly between plots with and without downed deadwood (Figure 6). Wilcoxon rank-sum tests detected no significant differences in seedling abundance (W = 400, p = 0.461) or sapling abundance (W = 438.5, p = 0.838). Median values and interquartile ranges broadly overlapped between deadwood-present and deadwood-absent plots.
These findings indicate that, at the plot scale, the presence of downed deadwood was not associated with significant differences in Scots pine regeneration abundance. This result should not be interpreted as evidence that deadwood is ecologically unimportant, but rather that total plot-scale deadwood volume and a simple presence-absence classification did not explain regeneration abundance in the present dataset.

4. Discussion

4.1. Plot-Scale Deadwood Volume Was Not a Significant Driver of Regeneration

The present study found no evidence that plot-scale deadwood volume was associated with the abundance of Scots pine regeneration. CWD, FWD, and total downed deadwood volume were unrelated to seedling and sapling abundance in the bivariate analyses, received little support in the full unified model, and did not distinguish plots with and without deadwood. These results indicate that total plot-scale volume was a poor predictor of regeneration under the studied conditions. Variation in woody-debris stocks among forest types and successional conditions further indicates that total volume may reflect stand history and forest development as much as local regeneration-microsite availability [17].
Previous studies have documented positive effects of coarse woody debris on conifer regeneration because individual logs and other woody elements can provide elevated establishment substrates, reduce competition from ground vegetation, modify near-ground temperature and moisture, and offer physical protection to establishing individuals [3,8,9,10,18,19]. These benefits have generally been demonstrated at the scale of individual logs, stumps, windthrown elements, or immediately adjacent microsites, rather than at the scale of total deadwood volume averaged across entire plots [3,9,10,18,19].
Our results, therefore, do not contradict studies demonstrating the presence of beneficial microsites on or beside individual deadwood elements. Instead, they indicate that such localized effects were not detectable when deadwood was summarized as total volume over 200 m2 plots. Regeneration responses may depend more strongly on log position, soil contact, decomposition stage, local moisture conditions, and understory competition than on the overall quantity of woody material within a plot [9,10,18]. Evidence from windthrow and post-fire systems also shows that retained woody elements can alter browsing exposure, moisture stress, and other microsite conditions affecting establishment [19,20,21,22]. Accordingly, our inference is restricted to deadwood volume measured at the 200 m2 plot scale and should not be extended to the ecological functions of individual logs or deadwood microsites.
Moreover, the decomposition stage was described descriptively and not incorporated into the final statistical models because several decay classes had few observations, limiting statistical power. Substrate quality and suitability for establishment can change substantially during wood decomposition [3,8,9,10]. Future studies using larger datasets should therefore test whether particular decay stages provide regeneration microsites whose effects are obscured when deadwood is summarized as total volume only.

4.2. Contrasting Bivariate Litter Associations Were Not Confirmed by the Unified Model

Spearman correlations indicated opposite litter-depth associations between the two regeneration stages: seedling abundance declined with increasing litter depth, whereas sapling abundance increased with it. However, the unified ZINB-GLMM did not detect a statistically significant interaction between regeneration stage and litter depth. Moreover, the baseline model received the greatest AICc support, whereas the interaction model had a ΔAICc of 4.28 and a low Akaike weight.
This discrepancy is important. Separate bivariate correlations describe the direction of association for each response but do not directly test whether the two slopes differ. After accounting for stand identity, zero inflation, and paired observations within plots, the estimated difference between stages was small and highly uncertain (β = 0.138, p = 0.666). The data therefore support contrasting descriptive correlations, but not a robust stage-dependent response.
The negative seedling correlation is ecologically consistent with experimental and synthetic evidence showing that increasing litter quantity can reduce germination and early establishment by limiting seed–soil contact, intercepting light, and creating a physical barrier to emergence [11,12]. A positive association at later stages could hypothetically reflect improved moisture conditions or temperature buffering, as reported for some dry and post-disturbance regeneration microsites [20,21,22,23]. However, litter effects are context dependent: studies in former pine plantations have shown that litter and other land-use legacies can have neutral, limiting, or temporally changing effects on vegetation recovery and soil seed-bank development [24,25]. These mechanisms were not measured in the present study, and the unified model did not demonstrate that litter exerted different effects on the two stages. They should therefore be treated as hypotheses for future experimental work rather than as mechanisms established by this study.

4.3. Model-Selection Uncertainty and Unexplained Variation

The model-selection results indicate that the measured environmental variables explained only a limited proportion of variation in Scots pine regeneration abundance. Although the baseline model received the greatest support, the additive litter-depth model remained competitive (ΔAICc = 1.99, Akaike weight = 0.248), indicating some uncertainty regarding the contribution of litter depth. However, the litter-depth coefficient in the additive model was not statistically significant, and the interaction model received substantially less support. Thus, the available evidence does not establish litter depth as a consistent predictor of regeneration abundance.
The full environmental model, which included CWD, FWD, basal area, litter depth, and their interactions with regeneration stage, was poorly supported (ΔAICc = 16.17, Akaike weight < 0.001). Increasing model complexity, therefore, did not improve the explanation of regeneration patterns. Substantial variation remained unexplained by the plot-scale variables measured in this study. Seed availability and microsite conditions such as soil moisture, light, and understory competition are known to influence establishment and recruitment [6,18,23,26,27]. The position of woody elements, browsing protection, and disturbance or post-disturbance management legacies can also modify regeneration outcomes [18,19,20,21,22]. Evidence from pine-dominated systems further shows that advance regeneration may vary among stand types [28], that early survival can be strongly constrained along elevation and climatic gradients [29], and that land-use and seed-bank legacies can shape post-disturbance recovery trajectories [24,25]. These unmeasured factors may have contributed more strongly to differences among plots than the variables included in the candidate models.

4.4. Implications for Forest Management

The results support a cautious interpretation of management. The present results do not provide evidence that retaining greater total deadwood volume alone would increase regeneration abundance at the plot scale. This does not argue against deadwood retention, as deadwood contributes to biodiversity conservation and habitat provision [4,7,30] and supports structural complexity, carbon storage, nutrient cycling, and nutrient retention [8,31].
Regeneration-oriented management should therefore avoid assuming a simple volume-based deadwood effect and should consider fine-scale microsite conditions. The observed litter correlations may help identify hypotheses for field trials, but they do not justify litter manipulation without experimental evidence. Management should maintain deadwood’s broader ecological functions while experimentally testing whether exposed mineral soil, strategically retained woody elements, or other favorable microsites improve establishment [18,19,20,21,22,26]. Under suitable stand conditions, naturally established advance regeneration may also contribute to passive restoration in pine plantations [28].
Importantly, because this study was observational, the detected relationships should be interpreted as ecological associations rather than direct causal effects. Experimental manipulation of litter depth, substrate exposure, and deadwood characteristics would be necessary to establish causal mechanisms, as illustrated by manipulative, fire-related, and post-disturbance studies of regeneration microsites [18,20,21,22,26].

4.5. Limitations and Future Research

First, the study included only five stands. This small number of higher-level sampling units provides limited power to estimate stand-level variance and prevents reliable generalization of stand effects to the broader Scots pine forest population. Stand identity was therefore treated as a fixed blocking factor rather than as a random effect. Although this approach accounts for systematic differences among the sampled stands, it does not eliminate the limitation associated with restricted stand-level replication. Stand-related coefficients should consequently be interpreted only as adjustments for the five sampled stands and not as estimates of general stand-level ecological effects. Future studies should include a substantially larger number of independently sampled stands to quantify among-stand variability and to separate plot-scale relationships from differences in stand history, management, structure, and site conditions.
Second, deadwood was quantified as total plot-level volume without explicitly characterizing microsite attributes such as log position, orientation, soil contact, decay-specific substrate conditions, moisture status, or direct establishment on woody debris. Studies of log-based, windthrow, and coarse woody debris microsites show that these fine-scale properties can determine whether deadwood functions as a favorable regeneration substrate [3,9,10,18,19]. Post-fire studies likewise indicate that the ecological effect of retained wood depends on its local influence on microsite conditions rather than on volume alone [20,21,22].
Third, environmental variables that may influence regeneration—including soil moisture, light availability, temperature, seed availability, understory competition, herbivory, and microsite humidity—were not measured. Previous studies demonstrate that these factors can strongly shape establishment in dry forests and Scots pine systems [6,18,23,26,27], while woody elements may further modify browsing exposure and local microsite conditions [19]. These omissions constrain causal interpretation and may explain why the bivariate relationships were not retained in the unified model. Future studies could complement abundance counts with size- or biomass-based responses, for which species-specific allometric equations are available for early Scots pine regeneration [32].
Finally, this study represents a single growing season in one semi-arid Scots pine ecosystem. Recruitment responses can vary with climatic conditions, fire severity, residual vegetation, soil legacies, and other disturbance effects [23,26,27], as well as with post-fire wood management and the resulting microsite conditions [20,21,22]. Long-term monitoring and experimental manipulation across broader environmental gradients are therefore required to determine whether the contrasting bivariate litter associations recur consistently and under what conditions deadwood microsites facilitate regeneration.

5. Conclusions

This study evaluated whether plot-scale deadwood volume, litter depth, and stand basal area were associated with natural regeneration in semi-arid Scots pine forests of central Türkiye. The baseline model, which included the regeneration stage and stand identity, received the greatest AICc support, although the additive litter-depth model remained competitive, indicating some model-selection uncertainty. The regeneration stage × litter depth interaction was not significant, and the full environmental model received little support. Therefore, the contrasting bivariate associations observed for seedlings and saplings were not confirmed as a robust stage-dependent response. Overall, the measured plot-scale variables explained only a limited amount of variation in regeneration abundance. Future studies should focus on fine-scale deadwood microsites, seed availability, soil moisture, light conditions, and temporal recruitment dynamics to identify the processes governing Scots pine regeneration.

Author Contributions

Y.K.: Conceptualization, Methodology, Investigation, Data curation, Formal analysis, Writing—original draft, Writing—review and editing, Visualization. O.T.: Conceptualization, Methodology, Supervision, Investigation, Data Curation, Formal Analysis, Writing—Original Draft Preparation, Writing—Review and Editing, Visualization. All authors have read and agreed to the published version of the manuscript.

Funding

This research received no external funding. The APC was funded by the authors.

Data Availability Statement

The field observations analyzed in this study were originally collected as part of Yavuz Kocademir’s master’s thesis submitted to Kastamonu University in 2025 [33]. The thesis presented a broad, exploratory assessment of deadwood and natural regeneration, primarily through descriptive summaries, graphical evaluations, and bivariate correlation analyses. The present manuscript addresses a revised, more specific research question and presents a complete statistical reanalysis of the plot-level dataset. Specifically, seedling and sapling counts were jointly analyzed using zero-inflated negative binomial generalized linear mixed models; stand identity was included as a fixed blocking factor, whereas plot identity was included as a random intercept; candidate models were compared using AICc; and model diagnostics were evaluated. This framework and the resulting conclusions were not presented in the thesis and have not been published previously in a peer-reviewed journal. Consequently, some conclusions differ from those reported in the thesis because the present analysis formally accounts for stand differences, within-plot pairing, excess zeros, and model-selection uncertainty within a unified analytical framework. The data are available from the corresponding author upon reasonable request.

Acknowledgments

The authors acknowledge the use of the web-based version of ChatGPT (OpenAI, San Francisco, CA, USA; accessed July–August 2026 for assistance with English-language editing, manuscript organization, and preparation of R code, and the web-based version of DeepL Translator (DeepL SE, Cologne, Germany; accessed July–August 2026) for language editing. All AI-assisted output was carefully reviewed, verified, and approved by the authors, who take full responsibility for the content of the manuscript.

Conflicts of Interest

The authors declare no conflicts of interest.

References

  1. Oliver, C.D.; Larson, B.C. Forest Stand Dynamics; John Wiley & Sons: New York, NY, USA, 1996. [Google Scholar]
  2. Franklin, J.F.; Mitchell, R.J.; Palik, B.J. Natural Disturbance and Stand Development Principles for Ecological Forestry; USDA Forest Service: Newtown Square, PA, USA, 2007.
  3. Harmon, M.E.; Franklin, J.F. Tree seedlings on logs in Picea–Tsuga forests of Oregon and Washington. Ecology 1989, 70, 48–59. [Google Scholar] [CrossRef] [Scilit]
  4. Stokland, J.N.; Tomter, S.M.; Söderberg, U. Dead wood indicators for biodiversity monitoring. In Monitoring and Indicators of Forest Biodiversity in Europe; Marchetti, M., Ed.; EFI Proceedings; European Forest Institute: Joensuu, Finland, 2004; Volume 51, pp. 207–226. [Google Scholar]
  5. Zimmerman, J.K.; Pulliam, W.M.; Lodge, D.J.; Quiñones-Orfila, V.; Fetcher, N.; Guzmán-Grajales, S.; Parrotta, J.A.; Asbury, C.E.; Walker, L.R.; Waide, R.B. Nitrogen immobilization and forest recovery. Oikos 1995, 72, 314–322. [Google Scholar] [CrossRef] [Scilit]
  6. Bailey, T.G.; Davidson, N.J.; Close, D.C. Understanding the regeneration niche: Microsite attributes and recruitment of eucalypts in dry forests. For. Ecol. Manag. 2012, 269, 229–238. [Google Scholar] [CrossRef] [Scilit]
  7. Kuuluvainen, T.; Lindberg, H.; Vanha-Majamaa, I.; Keto-Tokoi, P.; Punttila, P. Low-level retention forestry and biodiversity: Case Finland. Ecol. Process. 2019, 8, 1–13. [Google Scholar] [CrossRef] [Scilit]
  8. Harmon, M.E.; Franklin, J.F.; Swanson, F.J.; Sollins, P.; Gregory, S.V.; Lattin, J.D.; Anderson, N.H.; Cline, S.P.; Aumen, N.G.; Sedell, J.R.; et al. Ecology of coarse woody debris in temperate ecosystems. Adv. Ecol. Res. 1986, 15, 133–302. [Google Scholar] [CrossRef] [Scilit]
  9. Kuuluvainen, T.; Kalmari, R. Regeneration microsites of Picea abies seedlings in a windthrow area of a boreal old-growth forest in Southern Finland. Ann. Bot. Fenn. 2003, 40, 401–413. [Google Scholar]
  10. Macek, M.; Wild, J.; Kopecký, M.; Červenka, J.; Svoboda, M.; Zenáhlíková, J.; Brůna, J.; Mosandl, R.; Fischer, A. Life and death of Picea abies after bark-beetle outbreak: Ecological processes driving seedling recruitment. Ecol. Appl. 2017, 27, 156–167. [Google Scholar] [CrossRef] [Scilit] [PubMed]
  11. Xiong, S.; Nilsson, C. The effects of plant litter on vegetation: A meta-analysis. J. Ecol. 1999, 87, 984–994. [Google Scholar] [CrossRef] [Scilit]
  12. Facelli, J.M.; Pickett, S.T.A. Plant litter: Light interception and effects on an old-field plant community. Ecology 1991, 72, 1024–1031. [Google Scholar] [CrossRef] [Scilit] [PubMed]
  13. Kayar, B.; Çakır, M. Inventory, ecology, and habitat of Formica rufa Nests in the Çamkoru Dr. Fuat Adalı Research Forest. Bartın Orman Fak. Derg. 2026, 28, 55–67. [Google Scholar]
  14. Bozakman, M. Çamkoru Ormanı’nın Jeolojik Yapısı Ve Topoğrafik Özellikleri; Teknik Bülten; Orman Genel Müdürlüğü Ormancılık Araştırma Enstitüsü Yayınları: Ankara, Türkiye, 1969; Volume 37, 47p. (In Turkish) [Google Scholar]
  15. Ulyshen, M.D.; Horn, S.; Pokswinski, S.; McHugh, J.V.; Hiers, J.K. A comparison of coarse woody debris volume and variety between old-growth and secondary longleaf pine forests in the southeastern United States. For. Ecol. Manag. 2018, 429, 124–132. [Google Scholar] [CrossRef] [Scilit]
  16. R Core Team. R: A Language and Environment for Statistical Computing; R Foundation for Statistical Computing: Vienna, Austria, 2023; Available online: https://www.r-project.org/ (accessed on 5 August 2026).
  17. Yang, L.P.; Liu, W.Y.; Ma, W.Z. Woody debris stocks in different secondary and primary forests in the subtropical Ailao Mountains, southwest China. Ecol. Res. 2008, 23, 805–812. [Google Scholar] [CrossRef] [Scilit]
  18. Heinemann, K.; Kitzberger, T. Effects of position, understorey vegetation and coarse woody debris on tree regeneration in two environmentally contrasting forests of north-western Patagonia: A manipulative approach. J. Biogeogr. 2006, 33, 1357–1367. [Google Scholar] [CrossRef] [Scilit]
  19. Marangon, D.; Marchi, N.; Lingua, E. Windthrown elements: A key point improving microsite amelioration and browsing protection to transplanted seedlings. For. Ecol. Manag. 2022, 508, 120050. [Google Scholar] [CrossRef] [Scilit]
  20. Castro, J.; Allen, C.D.; Molina-Morales, M.; Marañón-Jiménez, S.; Sánchez-Miranda, Á.; Zamora, R. Salvage logging versus the use of burnt wood as a nurse object to promote post-fire tree seedling establishment. Restor. Ecol. 2011, 19, 537–544. [Google Scholar] [CrossRef] [Scilit]
  21. Marañón-Jiménez, S.; Castro, J.; Querejeta, J.I.; Fernández-Ondoño, E.; Allen, C.D. Post-fire wood management alters water stress, growth, and performance of pine regeneration in a Mediterranean ecosystem. For. Ecol. Manag. 2013, 308, 231–239. [Google Scholar] [CrossRef] [Scilit]
  22. Marcolin, E.; Marzano, R.; Vitali, A.; Garbarino, M.; Lingua, E. Post-Fire management impact on natural forest regeneration through altered microsite conditions. Forests 2019, 10, 1014. [Google Scholar] [CrossRef] [Scilit]
  23. Castro, J.; Zamora, R.; Hódar, J.A.; Gómez, J.M. Seedling establishment of a boreal tree species (Pinus sylvestris) at its southernmost distribution limit: Consequences of being in a marginal Mediterranean habitat. J. Ecol. 2004, 92, 266–277. [Google Scholar] [CrossRef] [Scilit]
  24. Szitár, K.; Ónodi, G.; Somay, L.; Pándi, I.; Kucs, P.; Kröel-Dulay, G. Contrasting effects of land-use legacies on grassland restoration in burnt pine plantations. Biol. Conserv. 2016, 201, 356–362. [Google Scholar] [CrossRef] [Scilit]
  25. Basto, S.; Roa-Fuentes, L.; Moreno, A.C.; Barrera-Cataño, J.I. Seed bank responses after clearcutting Pinus patula plantations in Andean high-montane areas. Univ. Sci. 2020, 25, 517–543. [Google Scholar] [CrossRef] [Scilit]
  26. Hille, M.; Den Ouden, J. Improved recruitment and early growth of Scots pine (Pinus sylvestris L.) seedlings after fire and soil scarification. Eur. J. For. Res. 2004, 123, 213–218. [Google Scholar] [CrossRef] [Scilit]
  27. Vacchiano, G.; Stanchi, S.; Marinari, G.; Ascoli, D.; Zanini, E.; Motta, R. Fire severity, residuals and soil legacies affect regeneration of Scots pine in the Southern Alps. Sci. Total Environ. 2014, 472, 778–788. [Google Scholar] [CrossRef] [Scilit] [PubMed]
  28. Kremer, K.; Promis, A.; Bauhus, J. Natural advance regeneration of native tree species in Pinus radiata plantations of south-central Chile suggests potential for a passive restoration approach. Ecosystems 2022, 25, 1096–1116. [Google Scholar] [CrossRef] [Scilit]
  29. Lucas-Borja, M.E.; Jing, X.; Candel-Pérez, D.; Parhizkar, M.; Rocha, F.; Heydari, M.; Muñoz-Rojas, M.; Zema, D.A. Afforestation with Pinus nigra Arn. ssp. salzmannii along an elevation gradient: Controlling factors and implications for climate change adaptation. Trees 2022, 36, 93–102. [Google Scholar] [CrossRef] [Scilit]
  30. Grodsky, S.M.; Moorman, C.E.; Fritts, S.R.; Campbell, J.W.; Sorenson, C.E.; Bertone, M.A.; Wigley, T.B. Invertebrate community response to coarse woody debris removal for bioenergy production from intensively managed forests. Ecol. Appl. 2018, 28, 135–148. [Google Scholar] [CrossRef] [Scilit] [PubMed]
  31. Klockow, P.; D’Amato, A.; Bradford, J.; Fraver, S. Nutrient concentrations in coarse and fine woody debris of Populus tremuloides Michx.-dominated forests, northern Minnesota, USA. Silva Fenn. 2014, 48, 962. [Google Scholar] [CrossRef] [Scilit]
  32. Geudens, G.; Staelens, J.; Kint, V.; Goris, R.; Lust, N. Allometric biomass equations for Scots pine (Pinus sylvestris L.) seedlings during the first years of establishment in dense natural regeneration. Ann. For. Sci. 2004, 61, 653–659. [Google Scholar] [CrossRef] [Scilit] [PubMed]
  33. Kocademir, Y. Influence of Coarse Woody Debris on Scots Pine Natural Regeneration. Master’s Thesis, Department of Forest Engineering, Institute of Science, Kastamonu University, Kastamonu, Türkiye, 2025. (In Turkish) [Google Scholar]
Figure 1. Location of the study area in Türkiye (upper panel) and distribution of the five naturally regenerated Scots pine stands (lower panel). Numbers 10–14 indicate the individual stand identification numbers, and the red boundary delineates the study area.
Forests 17 00951 g001
Figure 2. Distribution of coarse woody debris (CWD) and fine woody debris (FWD) among the five Scots pine stands. Volumes are presented as log10(1 + volume, m3 ha−1) because of their highly right-skewed distributions. Boxes represent the median and interquartile range, whiskers extend to 1.5 × the interquartile range, and points represent individual plots.
Forests 17 00951 g002
Figure 3. Distribution of downed deadwood volume among the seven decay classes (DC1–DC7). Deadwood volume is expressed as log10(1 + volume, m3 ha−1) to accommodate the highly right-skewed distribution while retaining zero values. Boxes represent the median and interquartile range, whiskers extend to 1.5 × the interquartile range, and points indicate individual observations. Labels above boxes indicate the number of plots containing deadwood in each decay class.
Forests 17 00951 g003
Figure 4. Spearman rank correlation matrix among coarse woody debris (CWD), fine woody debris (FWD), total downed deadwood, basal area, litter depth, seedling abundance, and sapling abundance. Cell values represent Spearman’s rank correlation coefficients (ρ). Asterisks indicate statistically significant correlations (p < 0.05).
Forests 17 00951 g004
Figure 5. Relationship between stand basal area and mean litter depth across the 60 sampled plots. Points represent individual sample plots. Spearman’s rank correlation indicated no significant association between stand basal area and mean litter depth (ρ = 0.148, p = 0.259).
Forests 17 00951 g005
Figure 6. Supplementary unadjusted comparison of Scots pine seedling and sapling abundance between plots with and without downed deadwood. Boxplots show the median and interquartile range (IQR); whiskers extend to 1.5 × IQR, and circles represent individual plots. Wilcoxon rank-sum tests indicated no significant differences between deadwood-present and deadwood-absent plots for either seedlings (W = 400, p = 0.461) or saplings (W = 438.5, p = 0.838).
Forests 17 00951 g006
Table 1. Characteristics of the five sampled stands.
StandPlotsElevation (m a.s.l.)AspectSlope (%)Management
10201440NW20Unmanaged
11121450NE30Unmanaged
1271540N30Unmanaged
13121590W20–30Unmanaged
1491570S20–30Unmanaged
Table 2. Stand-level descriptive statistics of stand structure, deadwood, litter depth, and Scots pine regeneration. Values are presented as median [interquartile range (IQR)].
StandnCWD
(m3 ha−1)
FWD
(m3 ha−1)
Total Downed Deadwood
(m3 ha−1)
Basal Area
(m2 ha−1)
Litter Depth
(cm)
Seedlings
(Count/30 m2)
Saplings
(Count/30 m2)
10200.00 [0.00–27.28]0.00 [0.00–0.00]0.00 [0.00–28.15]35.02 [32.32–40.18]7.0 [6.5–7.2]12.0 [10.5–18.0]0.0 [0.0–0.0]
111235.03 [0.00–69.12]0.00 [0.00–0.00]35.03 [0.00–70.62]41.12 [36.80–45.05]7.2 [6.9–7.4]14.0 [10.8–17.0]0.0 [0.0–0.0]
12721.25 [0.00–47.80]0.00 [0.00–0.00]21.25 [0.00–48.30]40.96 [37.47–43.93]6.9 [6.6–7.2]11.0 [8.5–13.5]0.0 [0.0–3.5]
13121.70 [0.00–49.45]0.12 [0.00–0.98]2.25 [0.00–51.45]40.67 [37.70–43.28]7.9 [7.6–8.5]7.0 [5.0–11.0]0.0 [0.0–4.0]
1490.00 [0.00–19.30]0.00 [0.00–0.00]0.00 [0.00–19.30]43.39 [42.30–47.01]7.6 [7.0–8.4]6.0 [4.0–11.0]2.0 [0.0–2.0]
Note: CWD, coarse woody debris; FWD, fine woody debris. Regeneration values are summed integer counts from three 10 m2 subplots (30 m2 per plot).
Table 3. AICc-based comparison of the four unified zero-inflated negative binomial generalized linear mixed models (ZINB-GLMMs) fitted to Scots pine regeneration abundance.
Candidate ModelConditional Fixed EffectsdflogLikAICcΔAICcAkaike Weight
BaselineStage + Stand10−247.62517.260.000.672
AdditiveStage + litter depth + Stand11−247.40519.251.990.248
InteractionStage × litter depth + Stand12−247.31521.544.280.079
FullStage × (litter depth + CWD + FWD + basal area) + Stand18−245.33533.4416.17<0.001
Note: All models used a type 2 negative binomial distribution with a log link. Stand identity was included as a fixed blocking factor, plot identity as a random intercept, and the regeneration stage in the zero-inflation component. Models were ranked by AICc; those with ΔAICc < 2 were considered to have substantial empirical support.
Disclaimer/Publisher’s Note: The statements, opinions and data contained in all publications are solely those of the individual author(s) and contributor(s) and not of MDPI and/or the editor(s). MDPI and/or the editor(s) disclaim responsibility for any injury to people or property resulting from any ideas, methods, instructions or products referred to in the content.