Article

Dual Effects and Driving Mechanisms of Urban Expansion on Aboveground and Belowground Biomass in China from 2000 to 2020


1
College of Geographical and Remote Sciences, Xinjiang University, Urumqi 830017, China
2
EcoNetLab, German Centre for Integrative Biodiversity Research (iDiv) HalleJena-Leipzig, 04103 Leipzig, Germany
*
Author to whom correspondence should be addressed.
Forests 2026, 17(8), 890; https://doi.org/10.3390/f17080890
Submission received: 25 June 2026 / Revised: 28 July 2026 / Accepted: 28 July 2026 / Published: 30 July 2026
(This article belongs to the Section Urban Forestry)

Abstract

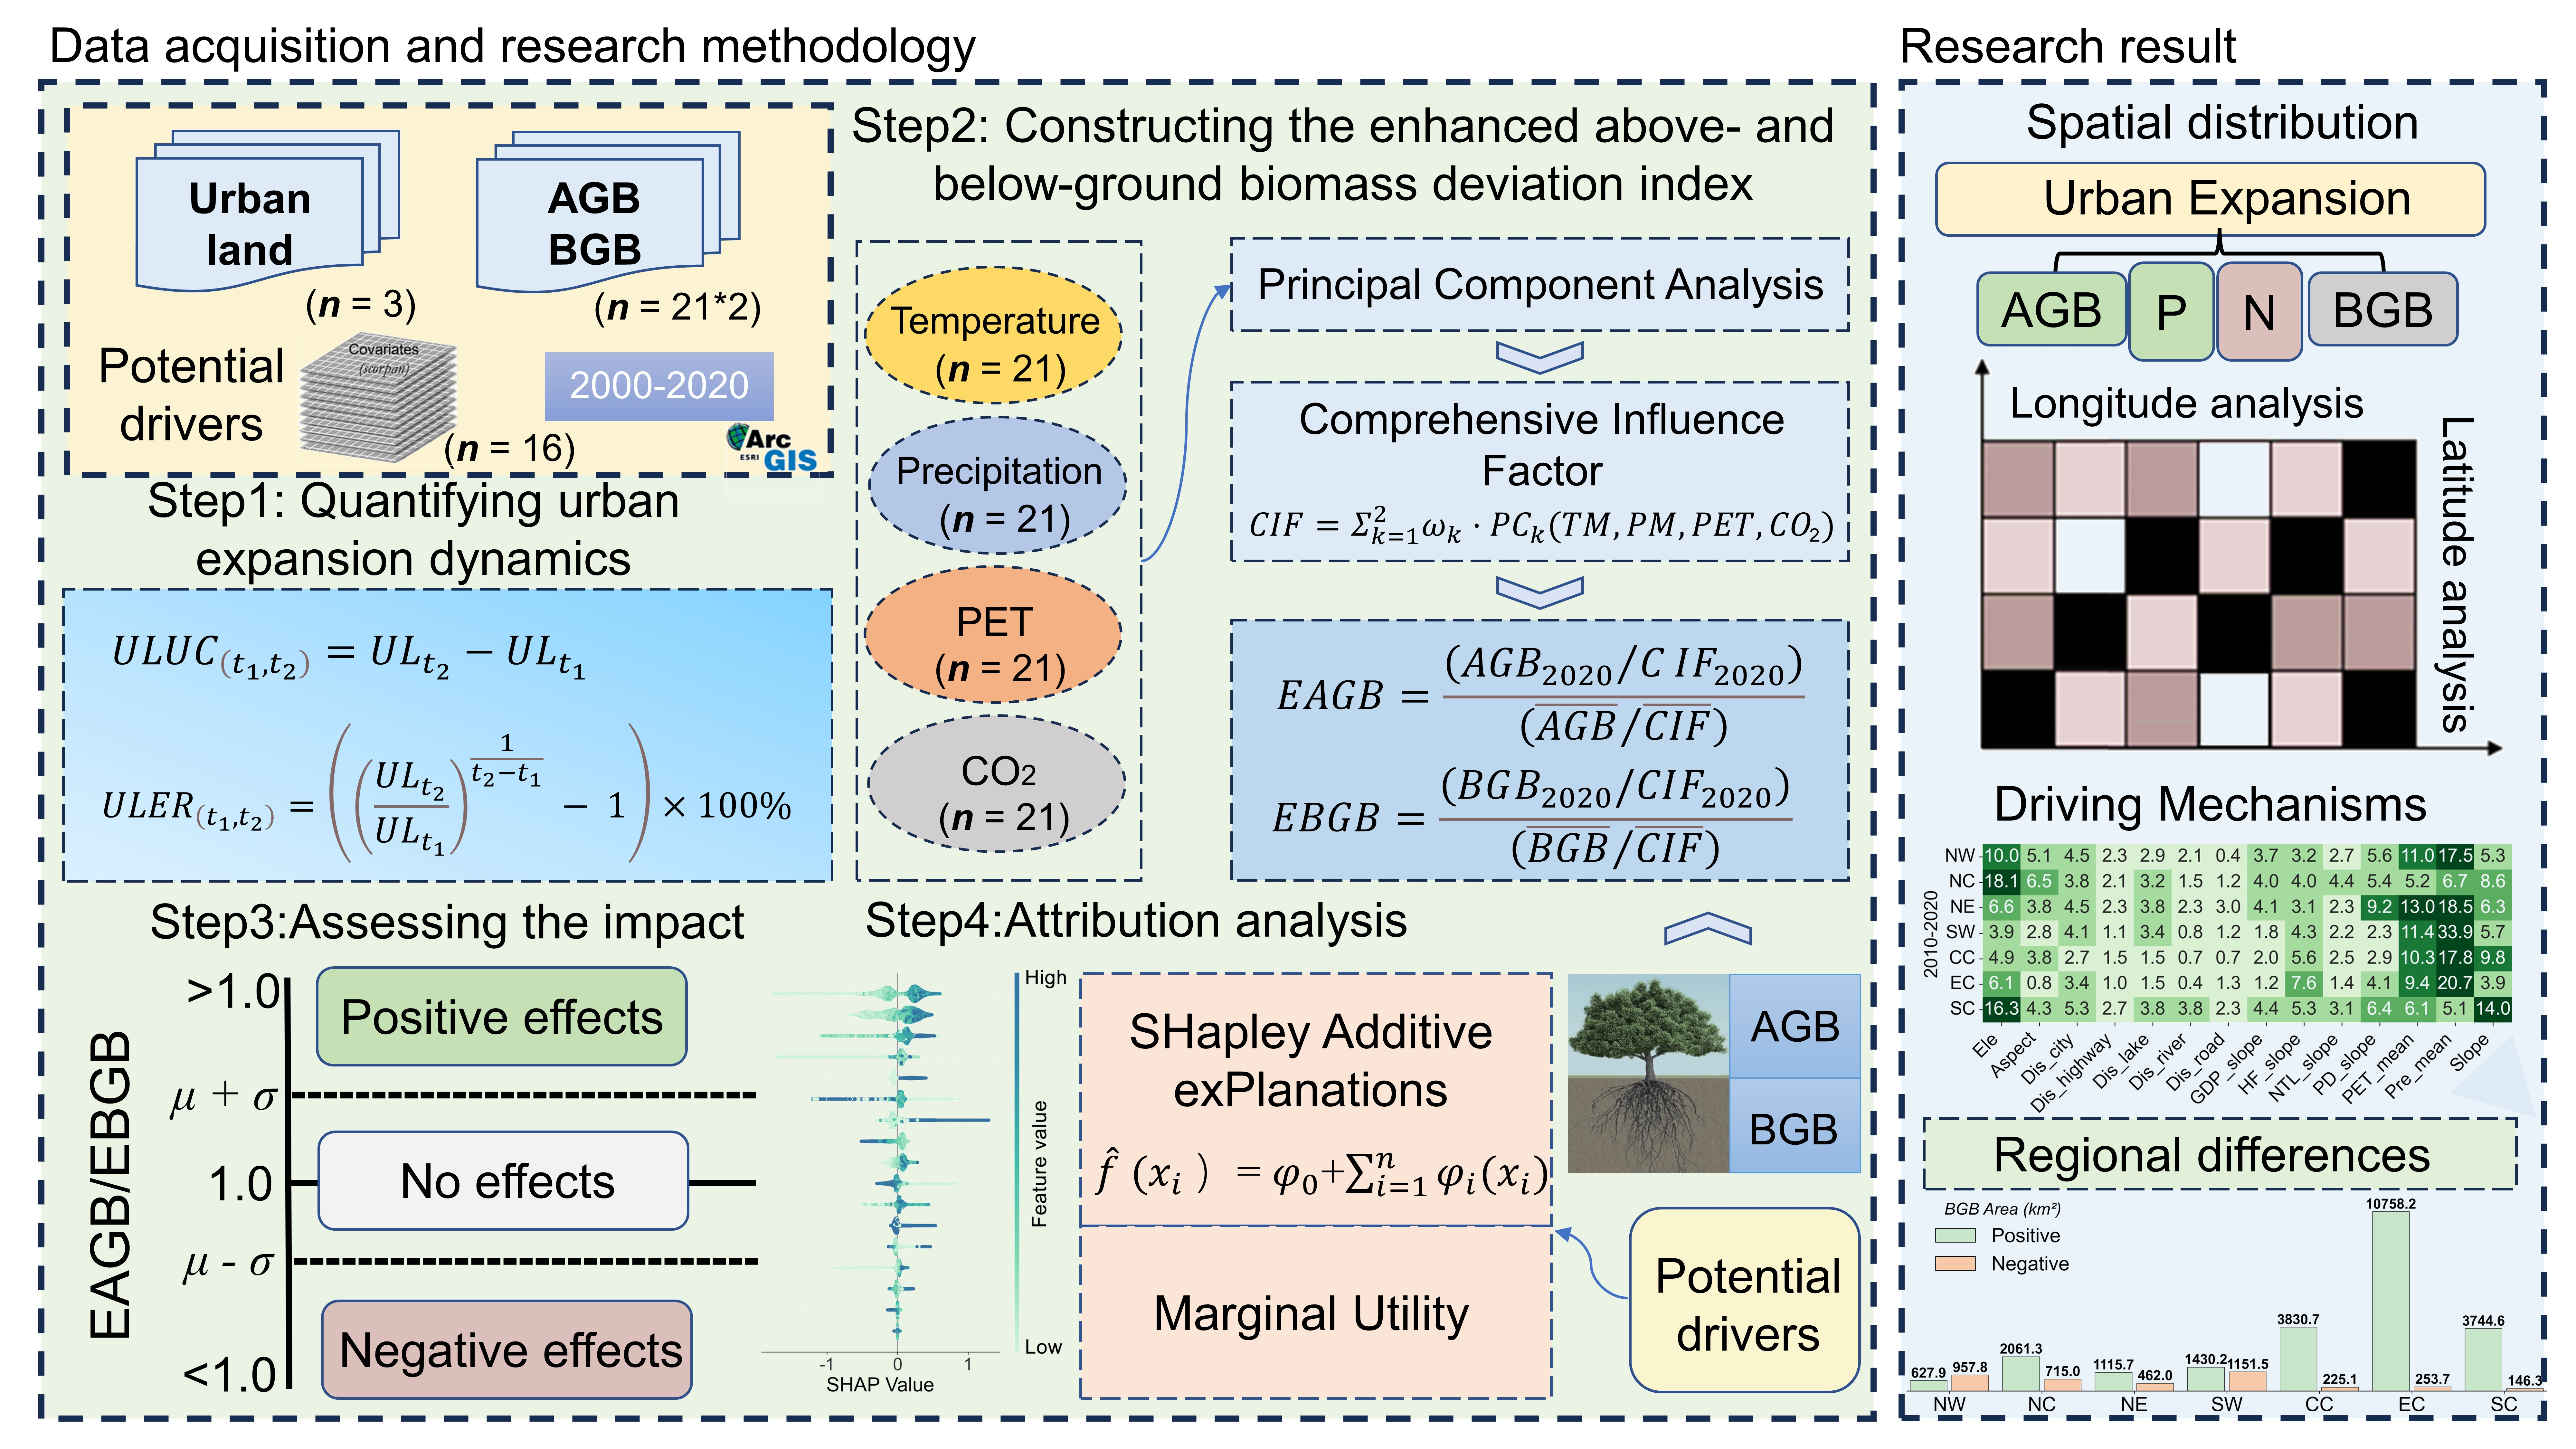
Urban expansion has profoundly altered ecosystem carbon dynamics, yet its associations with changes in aboveground biomass (AGB) and belowground biomass (BGB) remain insufficiently understood at the national scale. This study investigated urban expansion areas in 352 Chinese cities from 2000 to 2020 using 1-km-resolution AGB and BGB datasets. By integrating temperature, precipitation, potential evapotranspiration, and atmospheric CO2 concentration, we developed the Enhanced Aboveground Biomass Deviation Index (EAGB) and Enhanced Belowground Biomass Deviation Index (EBGB) to identify areas showing positive and negative biomass responses during urban expansion and to explore their spatial patterns and driving mechanisms. Between 2000 and 2020, China’s urban land expanded by 52,635 km2, corresponding to an average annual expansion rate of 4.1%. Areas showing positive biomass responses during urban expansion accounted for 22,376 km2 (42.5%) for AGB and 23,569 km2 (44.8%) for BGB, mainly concentrated in East and Central China. In contrast, areas showing negative biomass responses covered 5233 km2 (9.9%) for AGB and 3911 km2 (7.4%) for BGB, primarily distributed in Northwest and Southwest China. During urban expansion, biomass declines were more frequently observed in rapidly expanding small- and medium-sized cities in Northwest and North China, whereas larger cities generally exhibited more widespread biomass gains. Climatic factors, particularly precipitation and atmospheric CO2 concentration, together with human activities, were the dominant drivers of the observed spatial heterogeneity. Moreover, the dominant driving mechanisms shifted from the combined influence of climatic factors and human activities during 2000–2010 to the combined influence of climatic and topographic factors during 2010–2020. These findings provide a new framework for assessing biomass responses during urban expansion and offer scientific support for urban land-use optimization and ecological conservation.

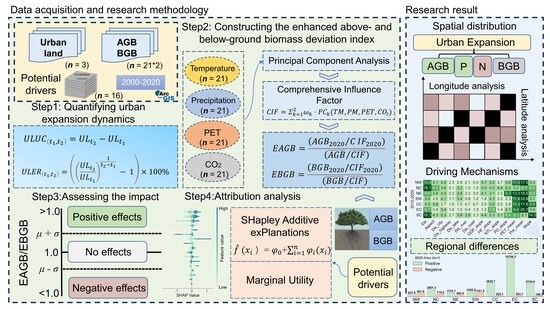
Graphical Abstract

1. Introduction

Urbanization has become one of the major driving forces of global land-use change and ecosystem evolution. Over the past four decades, China has experienced one of the most remarkable processes of economic growth and urbanization worldwide, with more than 65% of its population currently residing in urban areas [1,2]. Rapid urban expansion has not only altered land cover patterns but has also reshaped the growing environment of urban ecosystems through the urban heat island effect, greenhouse gas emissions, and changes in soil conditions [3,4]. These changes may simultaneously result in both the loss and recovery of vegetation biomass. As important components of the terrestrial ecosystem carbon pool, aboveground biomass (AGB) and belowground biomass (BGB) directly reflect vegetation carbon stocks and their dynamics, playing a crucial role in evaluating the carbon sequestration capacity of urban ecosystems, understanding ecological responses to urbanization, and supporting sustainable urban development [5]. On the one hand, urban expansion converts cropland and natural vegetation habitats into built-up land, leading to the direct loss of vegetation biomass [6]. On the other hand, human interventions associated with urban development, such as urban greening and ecological restoration, may promote ecosystem recovery and enhance carbon sequestration within urban expansion areas under specific policy and management conditions [7]. Moreover, the urban heat island effect and increased carbon emissions may also stimulate biomass accumulation in certain local areas [8]. Nevertheless, the spatial patterns of AGB and BGB changes and their driving mechanisms during urban expansion in China remain poorly understood at the national scale.
At present, remote sensing approaches are the primary methods used to assess the impacts of urban expansion on vegetation [9]. Existing studies have mainly employed three types of indicators, including vegetation indices, ecosystem productivity metrics, and vegetation biomass. Vegetation indices (e.g., NDVI and EVI) can effectively characterize vegetation growth dynamics and have been widely applied to identify vegetation greening or degradation patterns during urban expansion [10]. Ecosystem productivity indicators (e.g., GPP, NPP, and NEP) are primarily used to evaluate changes in ecosystem carbon fixation capacity and carbon sink functions under urbanization [11,12]. In recent years, vegetation biomass has increasingly been recognized as an important indicator for assessing the ecological effects of urban expansion because it directly reflects changes in vegetation carbon stocks. Meanwhile, integrated index approaches have received growing attention for more accurately identifying the impacts of human activities on vegetation dynamics. For example, Qi et al. [9] developed the Enhanced Vegetation Disturbance Index (EVDI), which effectively revealed the dual impacts of urban expansion on vegetation in arid regions and provided a new approach for separating the effects of anthropogenic activities from those of natural environmental factors.
Despite the substantial progress made in assessing the ecological effects of urban expansion, several limitations remain. Climatic factors, including precipitation, temperature, potential evapotranspiration, and atmospheric CO2 concentration, can significantly influence vegetation growth and carbon cycling [13]. Consequently, conventional vegetation indices, ecosystem productivity indicators, and biomass indicators are all susceptible to climatic variability, making it difficult to accurately distinguish the relative contributions of urban expansion and natural environmental changes to vegetation dynamics. In addition, vegetation indices are easily affected by soil background, atmospheric conditions, solar illumination angle, building shadows, and the reflectance of impervious surfaces, and they are prone to saturation in areas with high biomass [14,15]. Moreover, urban green spaces, as essential components of urban ecosystems, play a crucial role in reducing carbon emissions and enhancing carbon sequestration [16]. Vegetation indices mainly characterize the two-dimensional spectral properties of the vegetation canopy and therefore cannot directly represent vegetation carbon stocks or capture changes in belowground biomass [17]. In contrast, AGB and BGB provide a more direct representation of changes in urban vegetation carbon stocks and represent the aboveground and belowground carbon pools, respectively, making them more suitable for comprehensively evaluating the ecological effects of urban expansion [18]. Nevertheless, a unified analytical framework capable of simultaneously assessing the responses of both AGB and BGB while effectively reducing the interference of climatic background variability is still lacking. Therefore, it is necessary to comprehensively evaluate the dual effects of urban expansion on aboveground and belowground biomass, which arise from the combined effects of biomass loss caused by land-use conversion and the potential biomass gains resulting from urban greening and ecological restoration within urban expansion areas. These dual effects are reflected not only in the direction of biomass change but also in the interactions among different driving mechanisms. To address this gap, this study proposes an improved integrated index framework based on AGB and BGB by extending the methodology of Qi et al. [9]. Specifically, we developed the Enhanced Aboveground Biomass Deviation Index (EAGB) and the Enhanced Belowground Biomass Deviation Index (EBGB). These indices incorporate four climatic factors that influence vegetation growth—temperature, precipitation, potential evapotranspiration, and atmospheric CO2 concentration—into a unified analytical framework, thereby reducing the interference of natural background variability and enabling a more accurate assessment of the impacts of urban expansion on AGB and BGB. Consequently, EAGB and EBGB are better suited for characterizing changes in ecosystem carbon stocks under urbanization.
In summary, this study focuses on urban expansion areas in China and aims to systematically assess the dual impacts of urban expansion on AGB and BGB at the national scale from 2000 to 2020, based on the EAGB and EBGB frameworks. First, the study identifies urban expansion areas and quantifies their dynamic characteristics. Then, by comparing current biomass with long-term baselines and incorporating climatic factors, it constructs the EAGB and EBGB indices to identify both positive and negative impacts of urban expansion on biomass and analyze their spatial heterogeneity patterns.
Building upon this framework, this study further investigates the potential mechanisms underlying the effects of urban expansion on AGB and BGB across different regions and periods, as well as their spatiotemporal evolution characteristics. This analysis aims to reveal regional differences in the responses of aboveground and belowground vegetation biomass to urban expansion and to elucidate the mechanisms driving these variations. The findings provide theoretical support for understanding and managing ecosystem carbon dynamics under urban expansion and offer scientific references for sustainable urban development and land-use management strategies.

2. Materials and Methods

2.1. Study Area

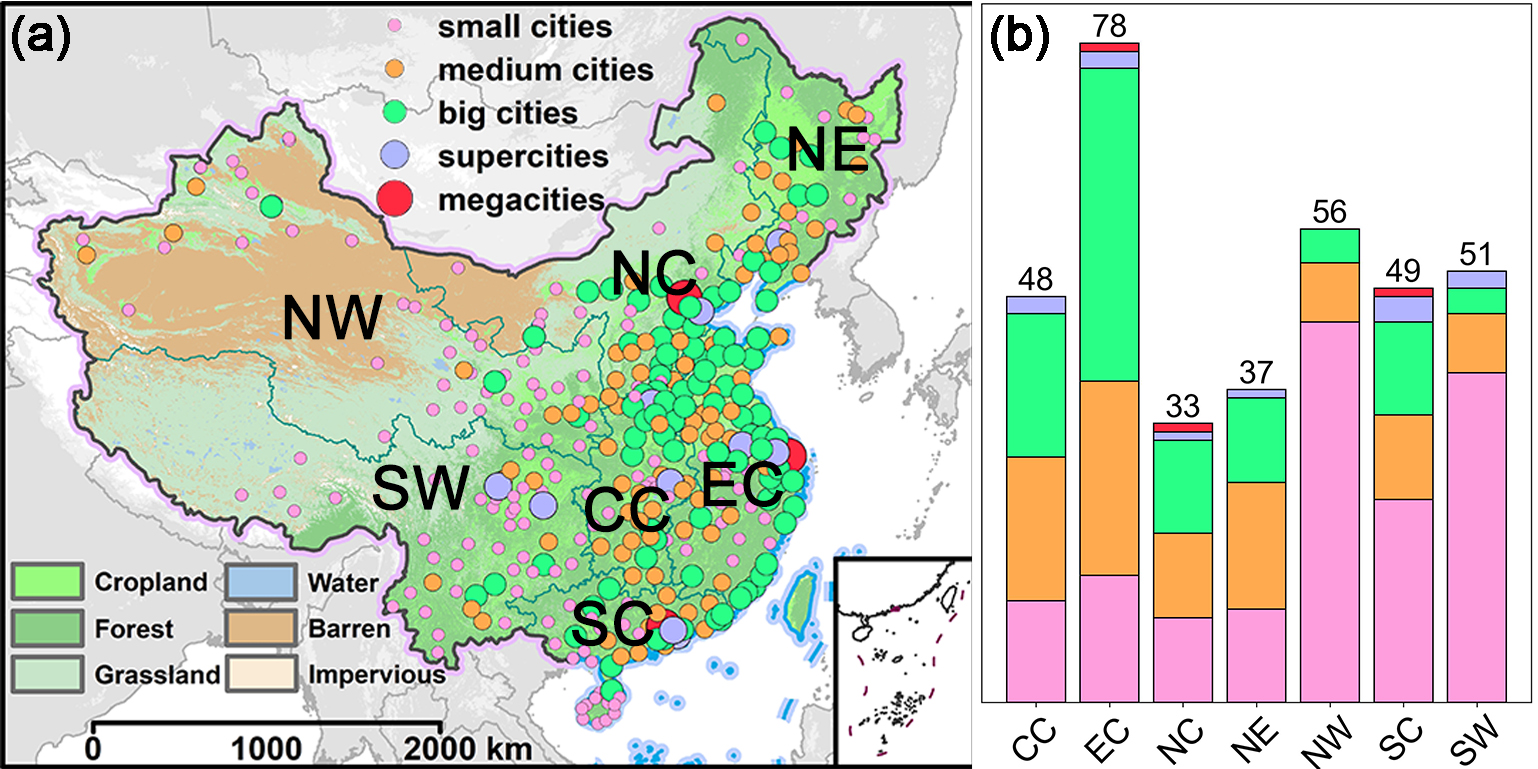
This study identified urban expansion areas in China using the Global Urban Expansion and Land Cover Change Dataset [19], from which the urban expansion areas of 352 cities between 2000 and 2020 were delineated as the study area (Figure 1). This dataset was generated by integrating multi-source remote sensing observations with socioeconomic statistics and provides land-cover information for three benchmark years (2000, 2010, and 2020) at a spatial resolution of 250 m. Urban land in the dataset is defined as areas containing impervious surfaces, urban green spaces, water bodies, and other urban land-cover types, providing the fundamental data for identifying urban expansion. To analyze land-use transitions during urban expansion and validate the identified urban expansion areas, two additional land-cover datasets were employed. The MODIS MCD12Q1 (Version 6.1) annual land-cover product (500 m) for 2001–2020 was used to analyze temporal land-cover dynamics and evaluate the consistency of urban expansion identification. In addition, the China Land Cover Dataset (CLCD) (30 m) covering 1985–2025 [20] was used for fine-scale validation of urban expansion areas, thereby improving the spatial accuracy and reliability of the identified urban expansion boundaries. Considering the pronounced climatic heterogeneity and uneven socioeconomic development across China [21], cities were further grouped into seven geographical regions to facilitate the analysis of AGB and BGB responses under different urban expansion patterns and climatic conditions. These regions include NE (Northeast), NC (North China), NW (Northwest), SW (Southwest), SC (South China), EC (East China), and CC (Central China) (Figure 1). Following the classification scheme proposed by Qi and Deng [22], the 352 cities were further categorized into five groups according to their urban population in 2020 (Figure 1). Detailed statistics for each city category are provided in Table S1.

2.2. Biomass Data and Auxiliary Environmental Covariates

The AGB and BGB data for 2000–2020 were obtained from the spatiotemporal biomass dataset for China developed by Zhu et al. [23], with a spatial resolution of 1 km. The dataset was generated by integrating field observations, machine learning, and multi-source remote sensing data to reconstruct the continuous spatiotemporal distributions of AGB and BGB across China from 2000 to 2020. Biomass is expressed in units of kg C m−2. The dataset has been extensively validated across forest, grassland, and cropland ecosystems, demonstrating high accuracy and reliability, and is therefore suitable for quantifying large-scale spatiotemporal variations in biomass and evaluating the ecological impacts of urban expansion.
In urban expansion areas, climate, human activities, topography, and location factors jointly influence the growth and distribution of vegetation [24,25]. These factors are the key drivers contributing to the dual positive and negative impacts on AGB and BGB. This study collected a total of 17 driving factors covering these four categories as potential drivers for attribution analysis, with detailed information provided in Table S2. Simultaneously, climatic factors such as temperature, precipitation, potential evapotranspiration, and CO2 concentration are integrated into a comprehensive influence factor (CIF) capturing the characteristics of multiple climate variables through principal component analysis, serving as a key component in constructing the Enhanced Above- and Below-ground Biomass Deviation Indices. To ensure spatial and methodological consistency, all raster data were uniformly projected into the WGS_1984 coordinate system, and the spatial resolution was resampled to 1 km. The aforementioned operations were implemented using ArcGIS v.10.8.1 software (Esri, Redlands, CA, USA). Although this process may introduce certain uncertainties in highly heterogeneous areas, such as urban fringe zones, it represents a commonly adopted data-processing strategy in large-scale ecological studies.

2.3. Quantifying Urban Expansion Dynamics

The study employs the change in urban land area to reflect the scale of urban expansion and uses the rate of urban land expansion to measure the speed of the expansion process. Based on these two key indicators, a quantitative analysis of urban expansion dynamics from 2000 to 2020 was conducted for the entire country of China as well as for different geographical divisions. The formulas for calculating these two indicators are provided in Supplementary Note S1.

2.4. Constructing the Enhanced Above- and Below-Ground Biomass Deviation Index

Drawing on the methodologies of Ma [26] and Qi et al. [9], this study extends their application to biomass change monitoring by combining AGB and BGB data. It integrates key climatic factors influencing vegetation growth—including precipitation, temperature, potential evapotranspiration, and CO2 concentration—to construct EAGB and EBGB. These indices identify pixels that significantly deviate from long-term mean baselines by comparing the biomass of the current year with a multi-year average biomass reference baseline, thereby reflecting the impact of urban expansion on vegetation biomass while controlling for climatic influences. The formulas for calculating EAGB and EBGB are as follows:
E A G B = ( A G B 2020 / C I F 2020 ) ( A G B ¯ / C I F ¯ )
E B G B = ( B G B 2020 / C I F 2020 ) ( B G B ¯ / C I F ¯ )
In the formula, AGB2020 and BGB2020 represent the above-ground and below-ground biomass for the year 2020, respectively; A G B ¯ and B G B ¯ denote the multi-year average of the corresponding biomass over the period 2000–2019; CIF2020 is the comprehensive climatic influence factor for 2020, and C I F ¯ is its multi-year average. EAGB and EBGB indicate the degree of deviation of current vegetation biomass relative to its long-term average level. Higher values signify a more pronounced increase in vegetation biomass, suggesting that urban expansion has exerted a positive effect on vegetation growth. Conversely, lower values imply a weaker positive effect or even a negative impact.
To reduce information redundancy and computational complexity, the study employs Principal Component Analysis (PCA) [27] to process key climatic factors influencing vegetation growth (including temperature, precipitation, potential evapotranspiration, and CO2 concentration). While retaining the main climatic information, the CIF was constructed by weighted integration based on the explanatory capacity of each principal component for the variance of the original variables. The CIF replaced the single precipitation variable in the original model, thereby enhancing the characterization of the combined climatic effects on vegetation growth. The formula for calculating the CIF is as follows:
C I F = Σ k = 1 2 ω k · P C k ( T M , P M , P E T , C O 2 )
In the formula, PCk represents the score of the k-th principal component, ωk is the corresponding explanatory variance proportion weight, while TM, PM, PET, and CO2 represent temperature, precipitation, potential evapotranspiration, and CO2 concentration data, respectively. In this study, the CIF explained over 80% of the variance in the original climatic variables during the period 2000–2020 (Figure S1). Its spatial distribution characteristics are significantly influenced by climatic variables (Figure S2), making it fully capable of representing the main features of the original variables.

2.5. Assessing the Impact of Urban Expansion on AGB and BGB

Based on the calculated results of EAGB and EBGB, this study further investigates the dual effects of urban expansion on vegetation biomass in China from 2000 to 2020. The standard deviation threshold method can objectively define the natural range of variability based on the statistical dispersion of the data, and without requiring subjective empirical thresholds, it effectively identifies significant positive and negative deviations in vegetation biomass driven by urban expansion, making it suitable for large-scale spatial heterogeneity analysis [28]. Accordingly, this study uses EAGB and EBGB as the core indicators and applies the standard deviation threshold method. According to the degree of deviation of each pixel value from the natural variability range, the impacts of urban expansion on vegetation biomass for each pixel i are classified into three categories: positive, negative, and neutral. The specific classification rules are as follows:
E f f e c t A G B i = X i p o s = 0 ,     X i n e g = 1 ,           E A G B i < μ A σ A X i p o s = 0 ,     X i n e g = 0 ,           μ A σ A E A G B i μ A + σ A X i p o s = 1 ,     X i n e g = 0 ,           E A G B i > μ A + σ A
E f f e c t B G B i = X i p o s = 0 ,     X i n e g = 1 ,           E B G B i < μ B σ B X i p o s = 0 ,     X i n e g = 0 ,           μ B σ B E B G B i μ B + σ B X i p o s = 1 ,     X i n e g = 0 ,           E B G B i > μ B + σ B
In the formula, μA = 1.16, μB = 1.21 and σA = 0.26, σB = 0.32 represent the mean and standard deviation, respectively, of EAGB or EBGB for all pixels in China during the period 2000–2020.

2.6. Attribution Analysis

To uncover the dominant factors and underlying mechanisms driving both positive and negative impacts of urban expansion on vegetation biomass, this study constructed LightGBM models for different vegetation impacts and applied the SHapley Additive exPlanation (SHAP) algorithm [29] to interpret the outputs of the LightGBM models.
LightGBM is a gradient-boosting decision tree model [30]. It iteratively optimizes its parameters and structure to minimize prediction errors, thereby continuously improving predictive performance. It is highly efficient in handling large-scale datasets and high-dimensional features, making it particularly suitable for geospatial big data modeling and analysis [30,31]. When constructing LightGBM models for different vegetation impacts, we binarized the spatial distribution data of positive and negative impacts based on the presence or absence of the corresponding effect, using this as the response variable (1 indicates the presence of the target impact, 0 indicates its absence), and built four independent models for AGB and BGB across the national region. Human activities, climatic factors, locational factors, and topographic variables are generally considered the main drivers determining the differential impacts of urban expansion on vegetation. In this study, a total of 17 potential driving factors spanning these four categories were collected as explanatory variables; detailed information is provided in Table S2. For model performance optimization, we employed a grid-search method combined with ten-fold cross-validation to fine-tune key parameters, including learning_rate, n_estimators, num_leaves, and min_data_in_leaf. Based on the obtained optimal parameters, we trained the models and evaluated their accuracy using Accuracy and the Area Under the Curve (AUC). Detailed information is presented in Tables S3 and S4.
SHAP is a model interpretation method based on cooperative game theory. The SHAP algorithm calculates Shapley values for each sample point, generates SHAP swarm plots, and reveals the magnitude and direction of the influence of each potential driving factor on different effects [29]. By computing the mean absolute Shapley value for each driving factor, the study quantified the contribution of individual input features to the prediction results, highlighting the relative influence of each driving factor on the model’s predictions. This approach provides a comprehensive understanding of how driving factors lead to different impacts, thereby uncovering the underlying mechanisms of AGB and BGB changes within urban expansion areas [32]. Additionally, to identify region-specific driving mechanisms, we conducted separate modeling and SHAP analysis for each of the seven major geographical divisions in China, investigating the similarities and differences in urban expansion patterns and vegetation response mechanisms across different regions. The model construction and SHAP analysis were implemented in Python 3.11 using the lightgbm and shap packages, respectively.

3. Results

3.1. Dynamics of Urban Expansion in China

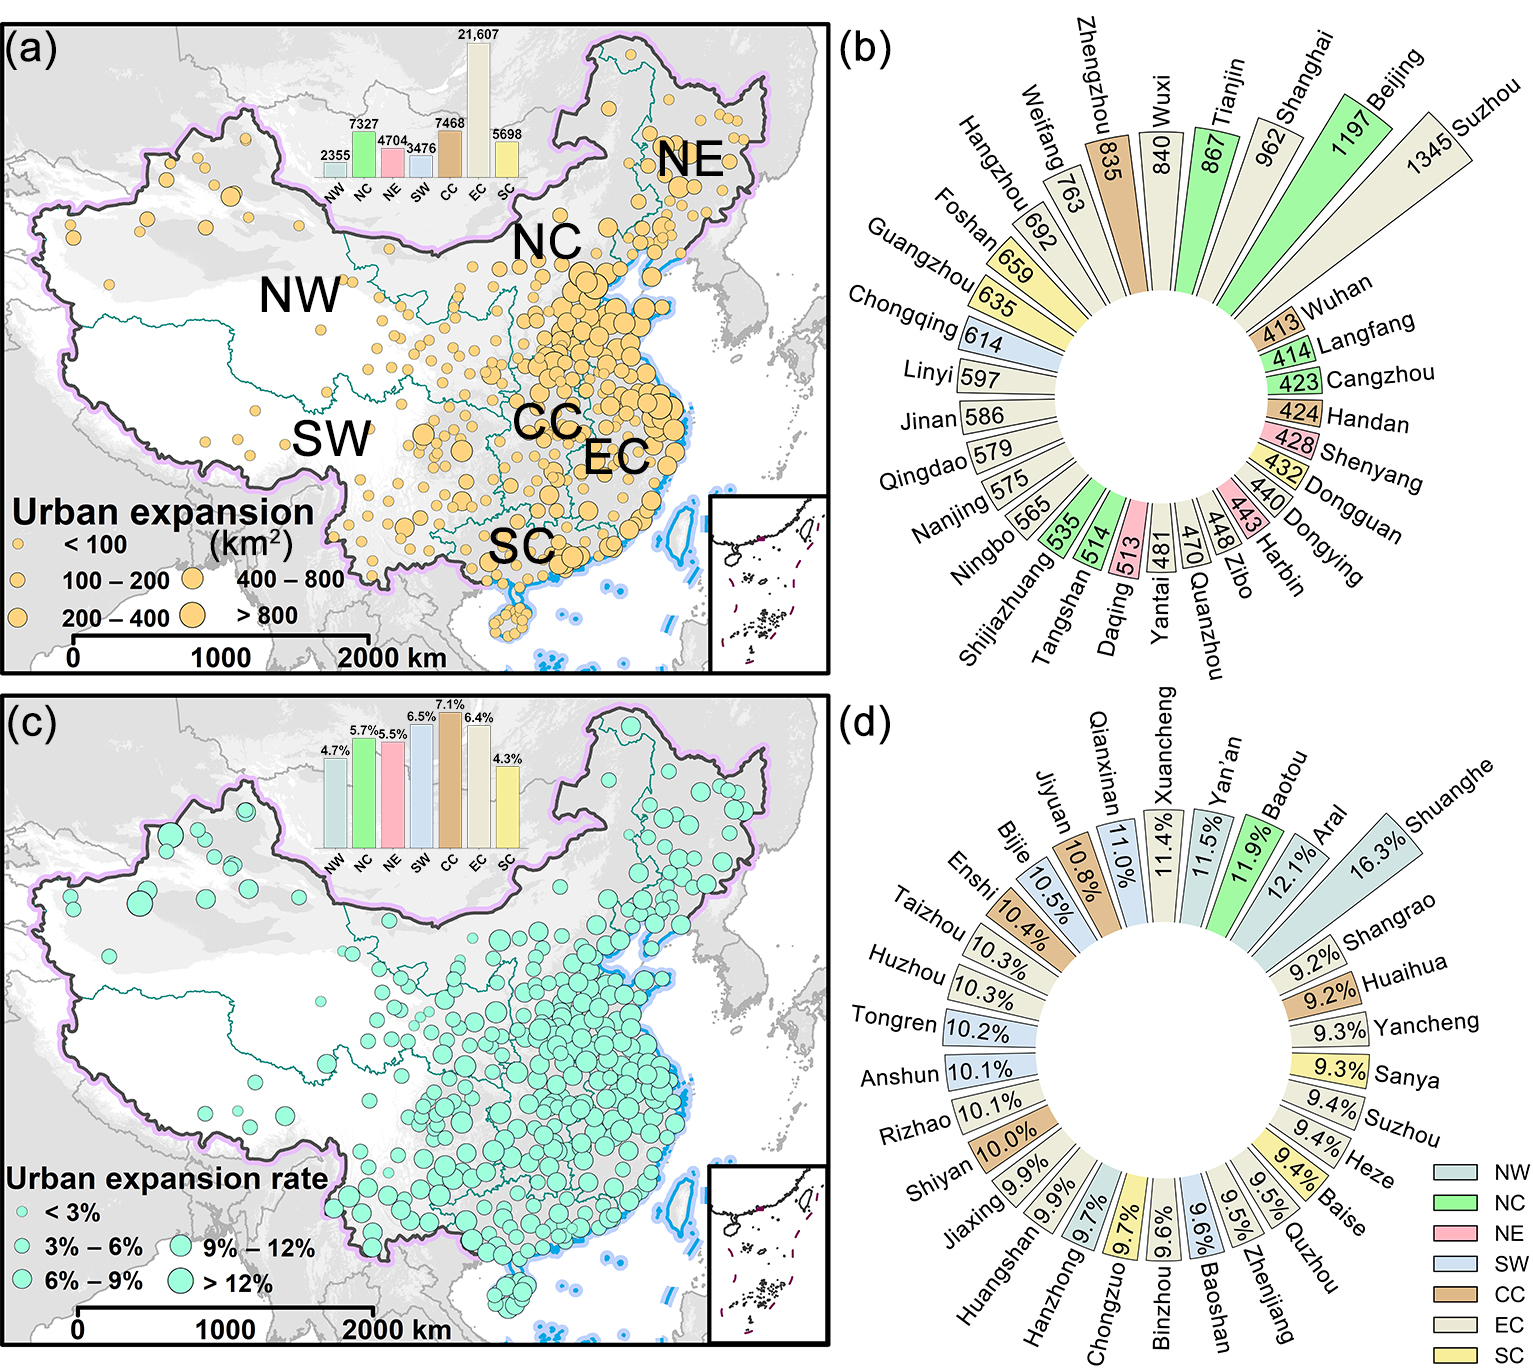
From 2000 to 2020, China experienced significant urban expansion, though with notable regional disparities (Figure 2). The total urban land area increased from 22,654 km2 in 2000 to 75,289 km2 in 2020, representing an overall expansion of 52,635 km2 and an annual expansion rate of 4.1%. The eastern region was characterized by large-scale expansion, with urban expansion reaching 21,607 km2 (Figure 2a), accounting for 41.1% of the total newly added urban area. Cities such as Suzhou, Shanghai, and Wuxi led the nation in terms of expansion area (Figure 2b). In contrast, the central, northwestern, and southwestern regions exhibited higher expansion rates. For example, cities such as Yan’an, Shuanghe, and Bijie recorded annual expansion rates exceeding 10% (Figure 2c,d). Notably, high expansion rates did not necessarily correspond to large expansion areas. Eastern cities generally maintained steady growth from a larger urban base, whereas cities in western and border regions, despite faster expansion rates, generally exhibited smaller expansion areas due to their smaller initial urban sizes (Figure 2a,c). Overall, urban expansion in China demonstrates a pattern dominated by large-scale expansion in eastern coastal cities, coupled with rapid development in central and western regions.

3.2. Positive Effects of AGB and BGB Caused by Urban Expansion in China

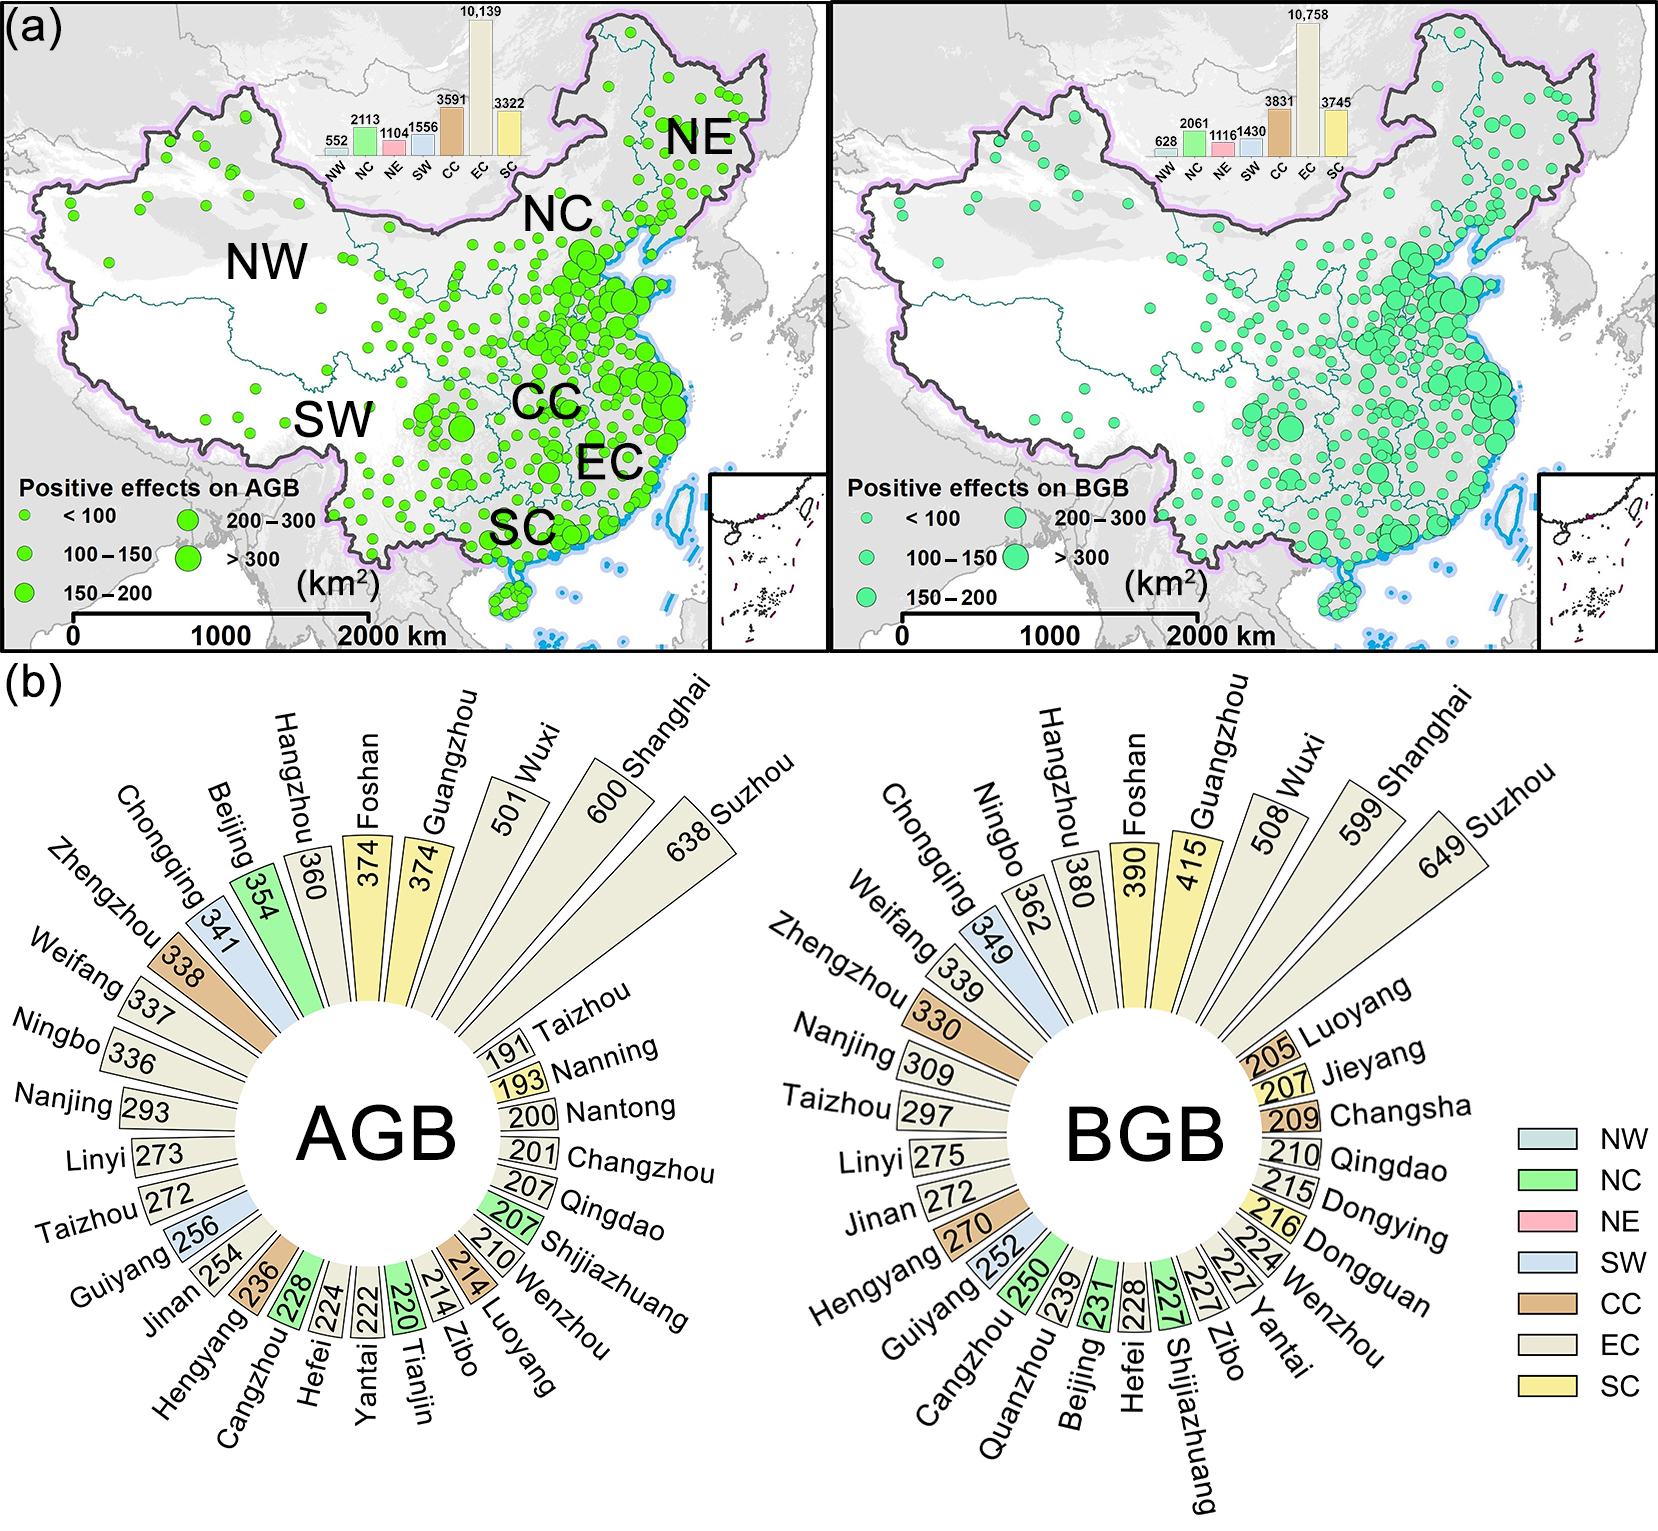
During the 2000–2020 period, urban expansion in China had a positive impact on 22,376 km2 of AGB and 23,569 km2 of BGB within the expanded areas, accounting for 42.5% and 44.8% of the total urban expansion area, respectively. The positively affected areas showed significant spatial heterogeneity (Figure 3). The most significant positive impacts on AGB and BGB were observed in the EC, CC, and SC regions, with cities such as Suzhou, Shanghai, Zhengzhou, and Guangdong having relatively large positively impacted areas (Figure 3a,b). In contrast, the impacts in the NC and SW regions were at a moderate level, but with significant internal variation, specifically manifested as prominent performance in core cities like Beijing and Chongqing, while most cities in Shanxi and Inner Mongolia had smaller impacted areas (Figure 3a,b). Compared to other regions, the NE and NW regions showed the weakest overall performance, with most urban expansion areas having insignificant impacts, indicating that urban expansion in these regions had extremely limited positive effects on biomass (Figure 3a). Urban expansion co-occurred with concurrent increases in AGB and BGB. Across most cities, the area exhibiting positive AGB changes was positively associated with that of BGB changes. However, a small number of cities showed significant divergence: for example, Beijing had a larger positively impacted area for AGB (354.00 km2) than for BGB (230.66 km2), while Shenzhen’s positively impacted area for AGB (79.44 km2) was significantly lower than that for BGB (101.74 km2).

3.3. Negative Effects of AGB and BGB Caused by Urban Expansion in China

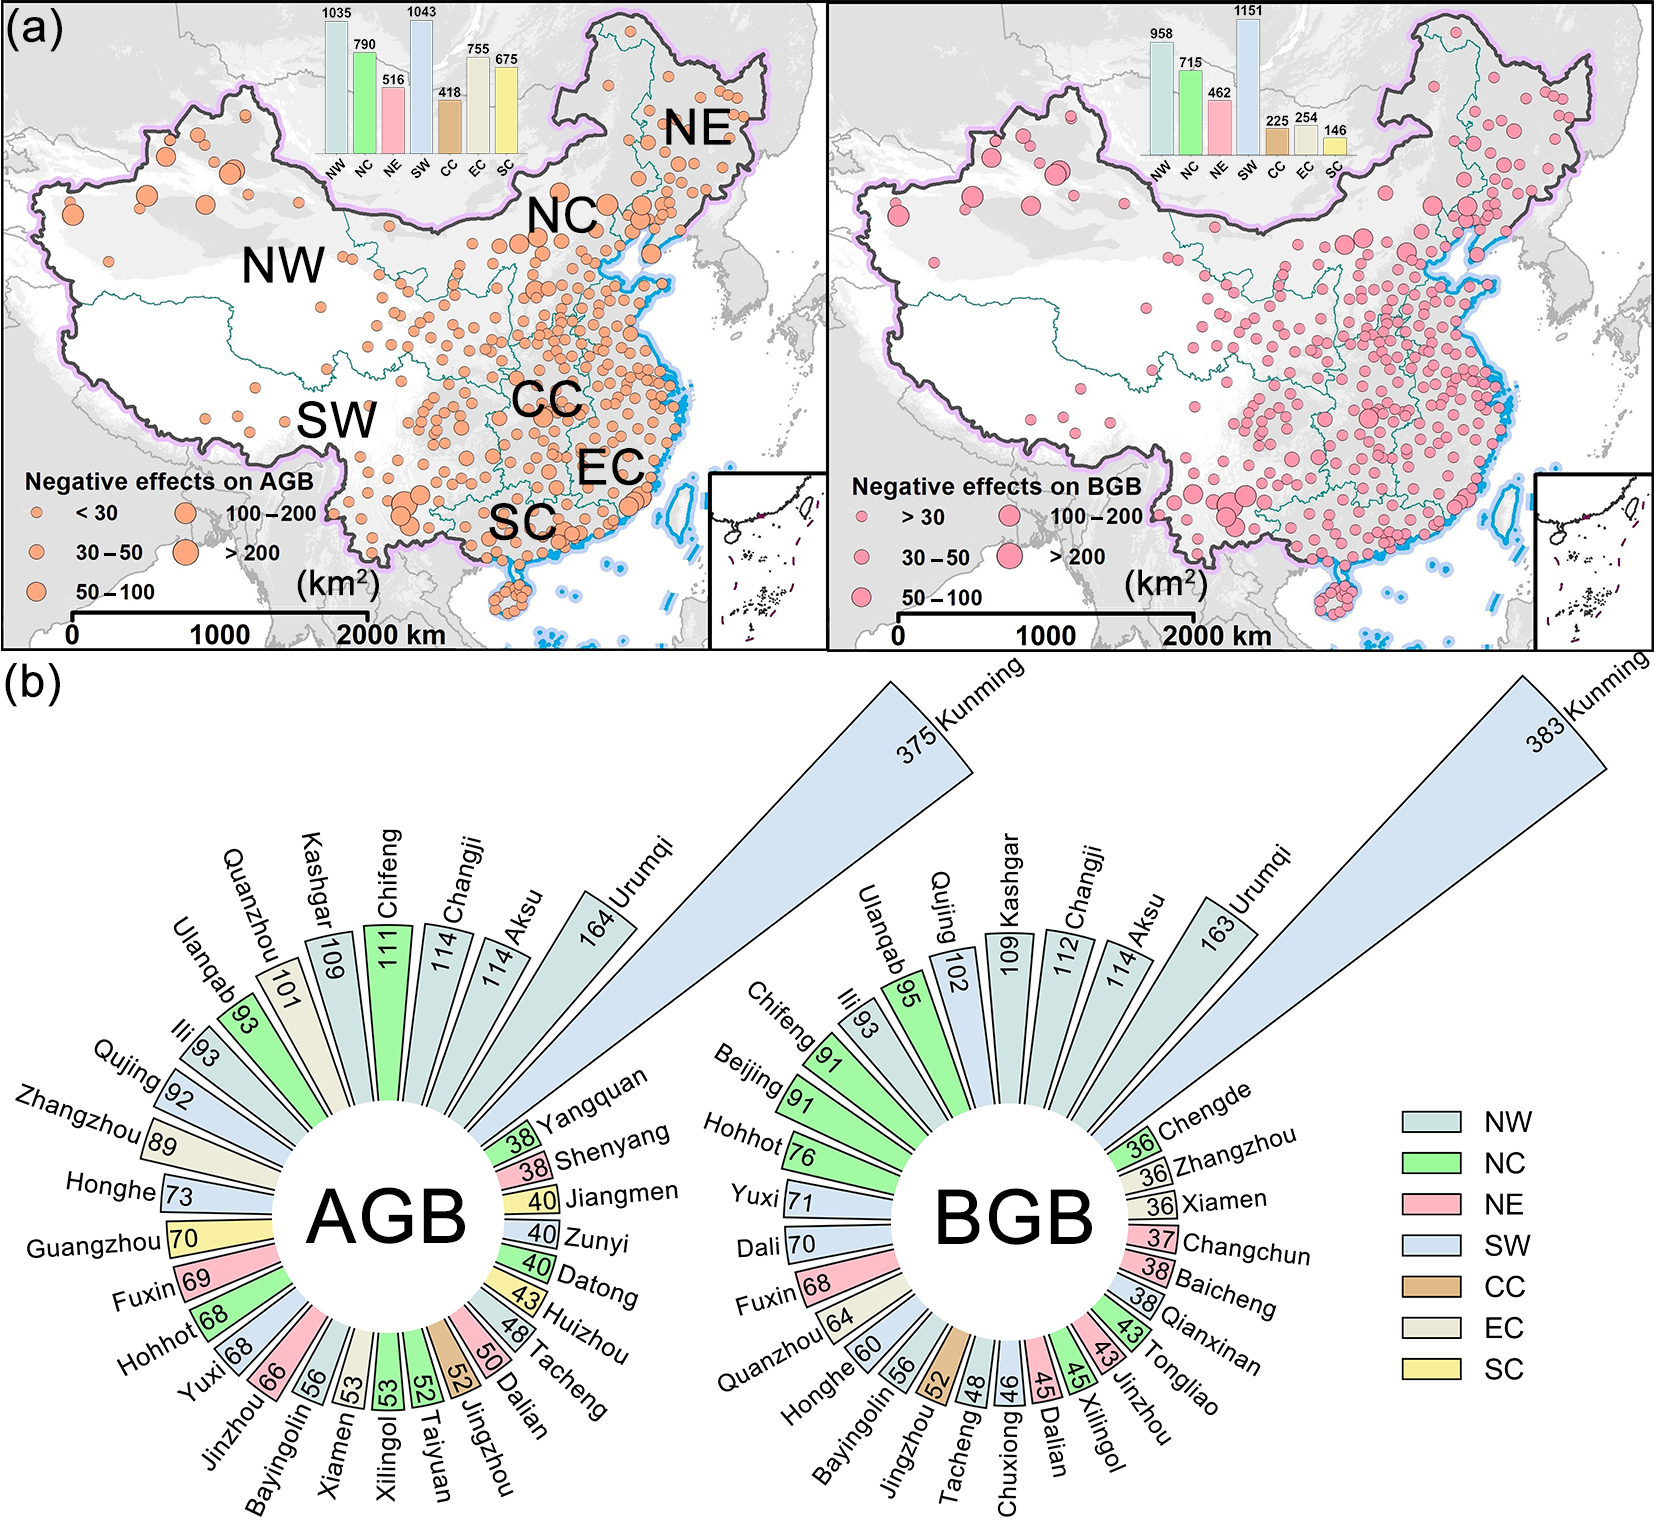
During the period from 2000 to 2020, urban expansion in Chinese cities resulted in negative impacts on 5233 km2 of AGB and 3911 km2 of BGB, accounting for 9.9% and 7.4% of the total urban expansion area, respectively. The negative vegetation impacts caused by urban expansion exhibited an uneven distribution across different geographical regions (Figure 4a). Specifically, the negative impacts were primarily concentrated in the SW and NW regions, with cities such as Kunming and Urumqi ranking at the top, and the affected areas far exceeding those in other regions. Negative impacts were greatest in arid and semi-arid regions (Figure 4a,b). The NC region showed significant internal variation, with cities like Chifeng and Ulanqab experiencing notable negative impacts, while relatively developed urban areas such as Taiyuan and Beijing exhibited lower levels of negative impact. In contrast, the CC and NE regions overall suffered less negative impact, with most urban expansion areas showing insignificant effects. The negative impacts of urban expansion on AGB and BGB across cities displayed complex synergistic and divergent relationships (Figure 4a). Overall, a significant positive correlation was observed between the negative impacts on AGB and BGB in most cities. This synergy was particularly evident in ecologically fragile areas, such as the SW and NW regions, where the magnitudes of negative impacts on AGB and BGB were similar in most cities, including Kunming and Aksu. In contrast, urban expansion in the SC and EC regions had a significantly greater negative impact on AGB than on BGB.

3.4. Driving Factors Leading to Different Impacts

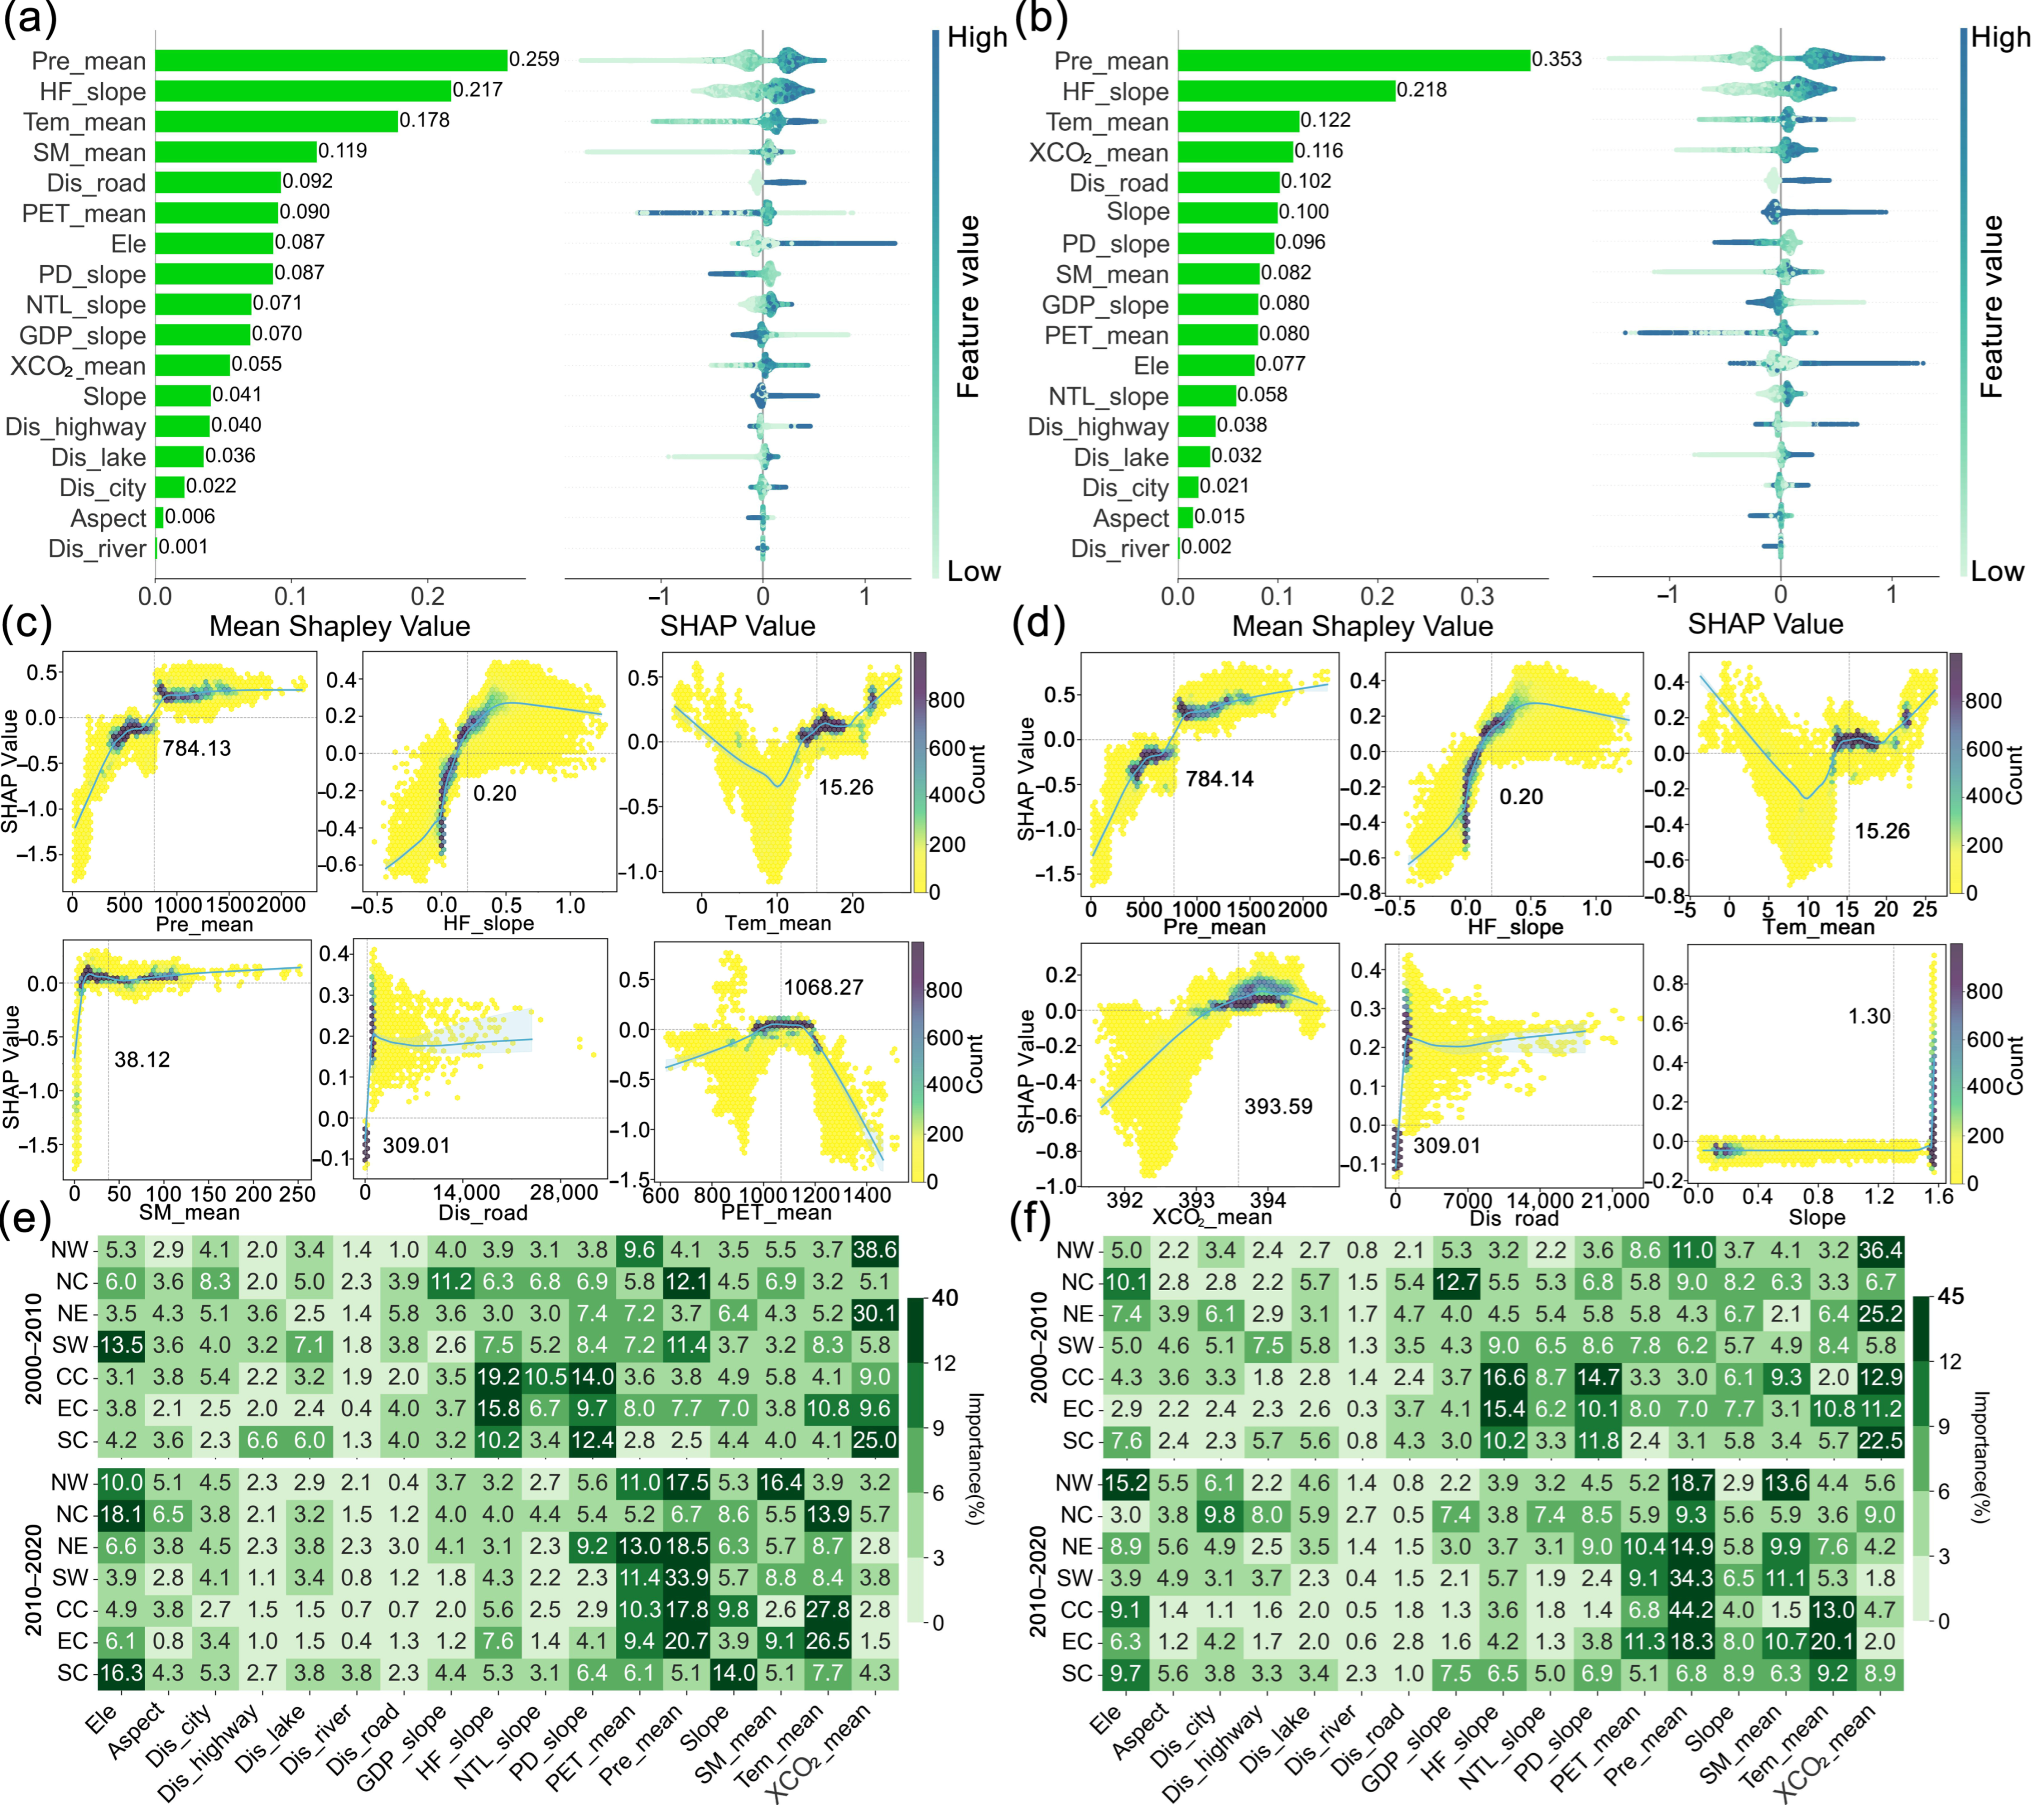
The SHAP attribution analysis results indicate that the positive impacts of urban expansion on AGB and BGB stem from the synergistic effects of climatic conditions, human activities, and topographic factors. Among these, climatic factors have the most prominent overall influence, with average precipitation being the most important driver explaining the spatial heterogeneity of positive impacts on AGB and BGB in urban expansion areas. Regions with higher average precipitation exhibited more pronounced positive effects (Figure 5). Simultaneously, other climatic factors such as temperature, soil moisture, and potential evapotranspiration also demonstrated strong explanatory power (Figure 5a,b). In addition, the influence of human activities is equally significant, with changes in the human footprint index being the most important and contributing positively to the positive impacts at higher levels. However, other human activity-related variables, such as increases in population density and GDP, tend to diminish the positive impacts (Figure 5c,d). In contrast, topographic and locational factors showed relatively weaker explanatory power, though some positive effects were observed in high-altitude areas and regions distant from urban built-up areas (Figure 5a,b). The drivers of positive impacts on AGB and BGB exhibit high synergy. Notably, the importance of CO2 concentration for positive impacts on BGB is significantly higher compared to AGB, with elevated CO2 levels contributing substantially to positive effects on BGB.
During the periods of 2000–2010 and 2010–2020, the key drivers of positive impacts on AGB and BGB showed clear temporal changes across different geographical regions in China. Overall, the dominant driving pattern shifted from a synergy between climatic factors and human activities to a synergy between climatic and topographic factors (Figure 5e,f). In the 2000–2010 period, CO2 concentration was the most important driver explaining positive impacts in the NW, NE, and SC regions (Figure 5e,f), while human activities were the core drivers in the NC, SW, CC, and EC regions (Figure 5e,f). In contrast, during the 2010–2020 period, the importance of human activity factors diminished, and climatic and topographic factors became dominant (Figure 5e,f). Specifically, the importance of topographic factors, such as elevation and slope, increased across most regions. Meanwhile, the promoting effect of CO2 concentration weakened, whereas precipitation and temperature remained consistently important climatic drivers (Figure 5e,f).
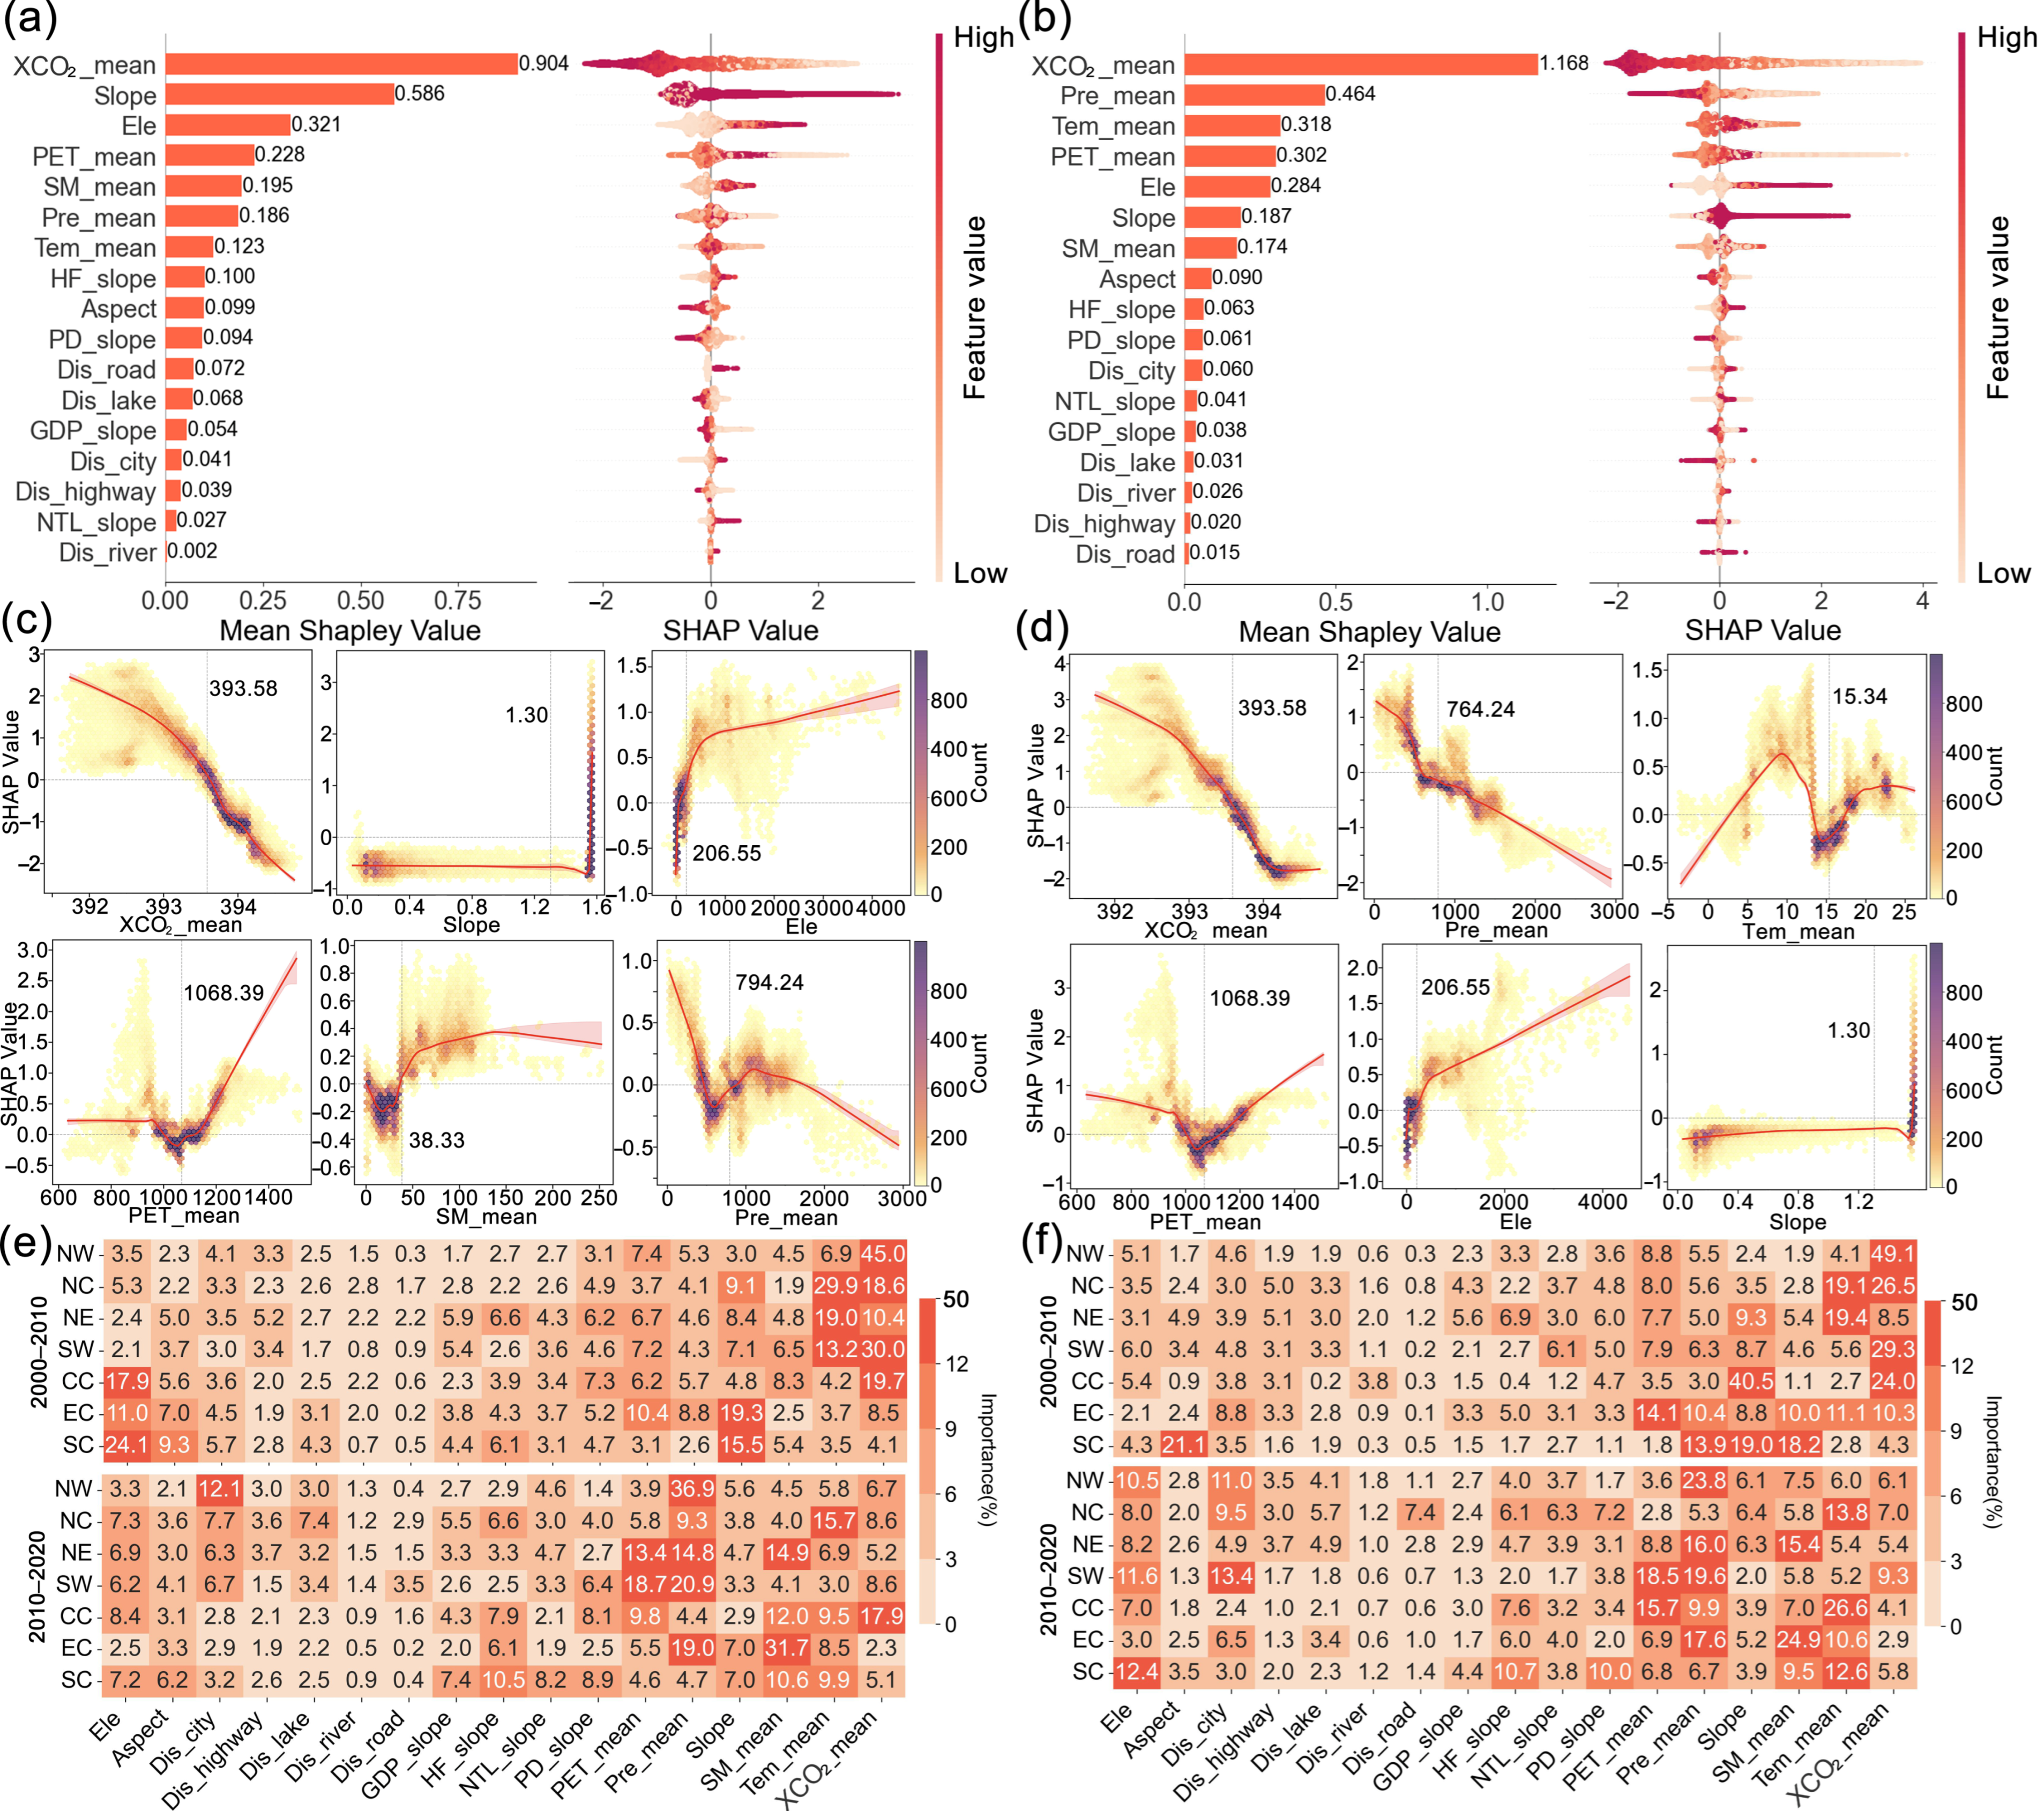
In the SHAP attribution analysis results for the negative impacts on AGB and BGB, climatic factors overall played a dominant role, while topographic and human activity factors also exerted a moderating effect. CO2 concentration was the most significant driver, with regions of lower CO2 concentration exhibiting more pronounced negative impacts, indicating a significant negative linear relationship between the two (Figure 6a). Positive SHAP values were observed under conditions of low precipitation and high potential evapotranspiration. In contrast, drought-prone areas were characterized by significant negative effects (Figure 6a–d). Topographic factors also demonstrated high explanatory power, as areas with steeper slopes and higher elevations experienced significant negative impacts (Figure 6a–d). In contrast, human activity factors ranked relatively lower in importance, while various distance variables among location factors exhibited similarly weak influence (Figure 6a,b). Compared to BGB, elevation and slope among the topographic factors played a more dominant role in the negative impacts on AGB (Figure 6a,b).
During the periods 2000–2010 and 2010–2020, climatic factors played a dominant role in the negative impacts on AGB and BGB across most geographical regions. However, the specific dominant drivers and the influence of human activity factors showed clear regional and temporal differences (Figure 6e,f). From 2000 to 2010, CO2 concentration was the most prominent driver in regions such as NW, NC, and SW. Elevation became the key driver in SC, while slope was the primary factor in EC. Human activity intensity indicators were significantly important for AGB in core urbanization regions like NC, CC, EC, and SC. In contrast, changes in BGB were generally less affected by human activities, with only limited influence observed in regions such as NE (Figure 6e,f). By the 2010–2020 period, the pattern of driving factors had shifted noticeably. The importance of CO2 concentration decreased substantially in regions like NW, NC, and NE. The influence of water-related climatic factors (average precipitation, average soil moisture) increased significantly in SW, NE, and NW, while the effect of average temperature became more pronounced in NC and EC. The role of topographic factors further strengthened in some areas, with elevation showing increased control over BGB in SW and NW (Figure 6e,f). In contrast, the importance of human activity factors generally decreased or remained at a moderate level in most regions (Figure 6e,f).

3.5. Regional Differences in the Impacts of Urban Expansion on AGB and BGB

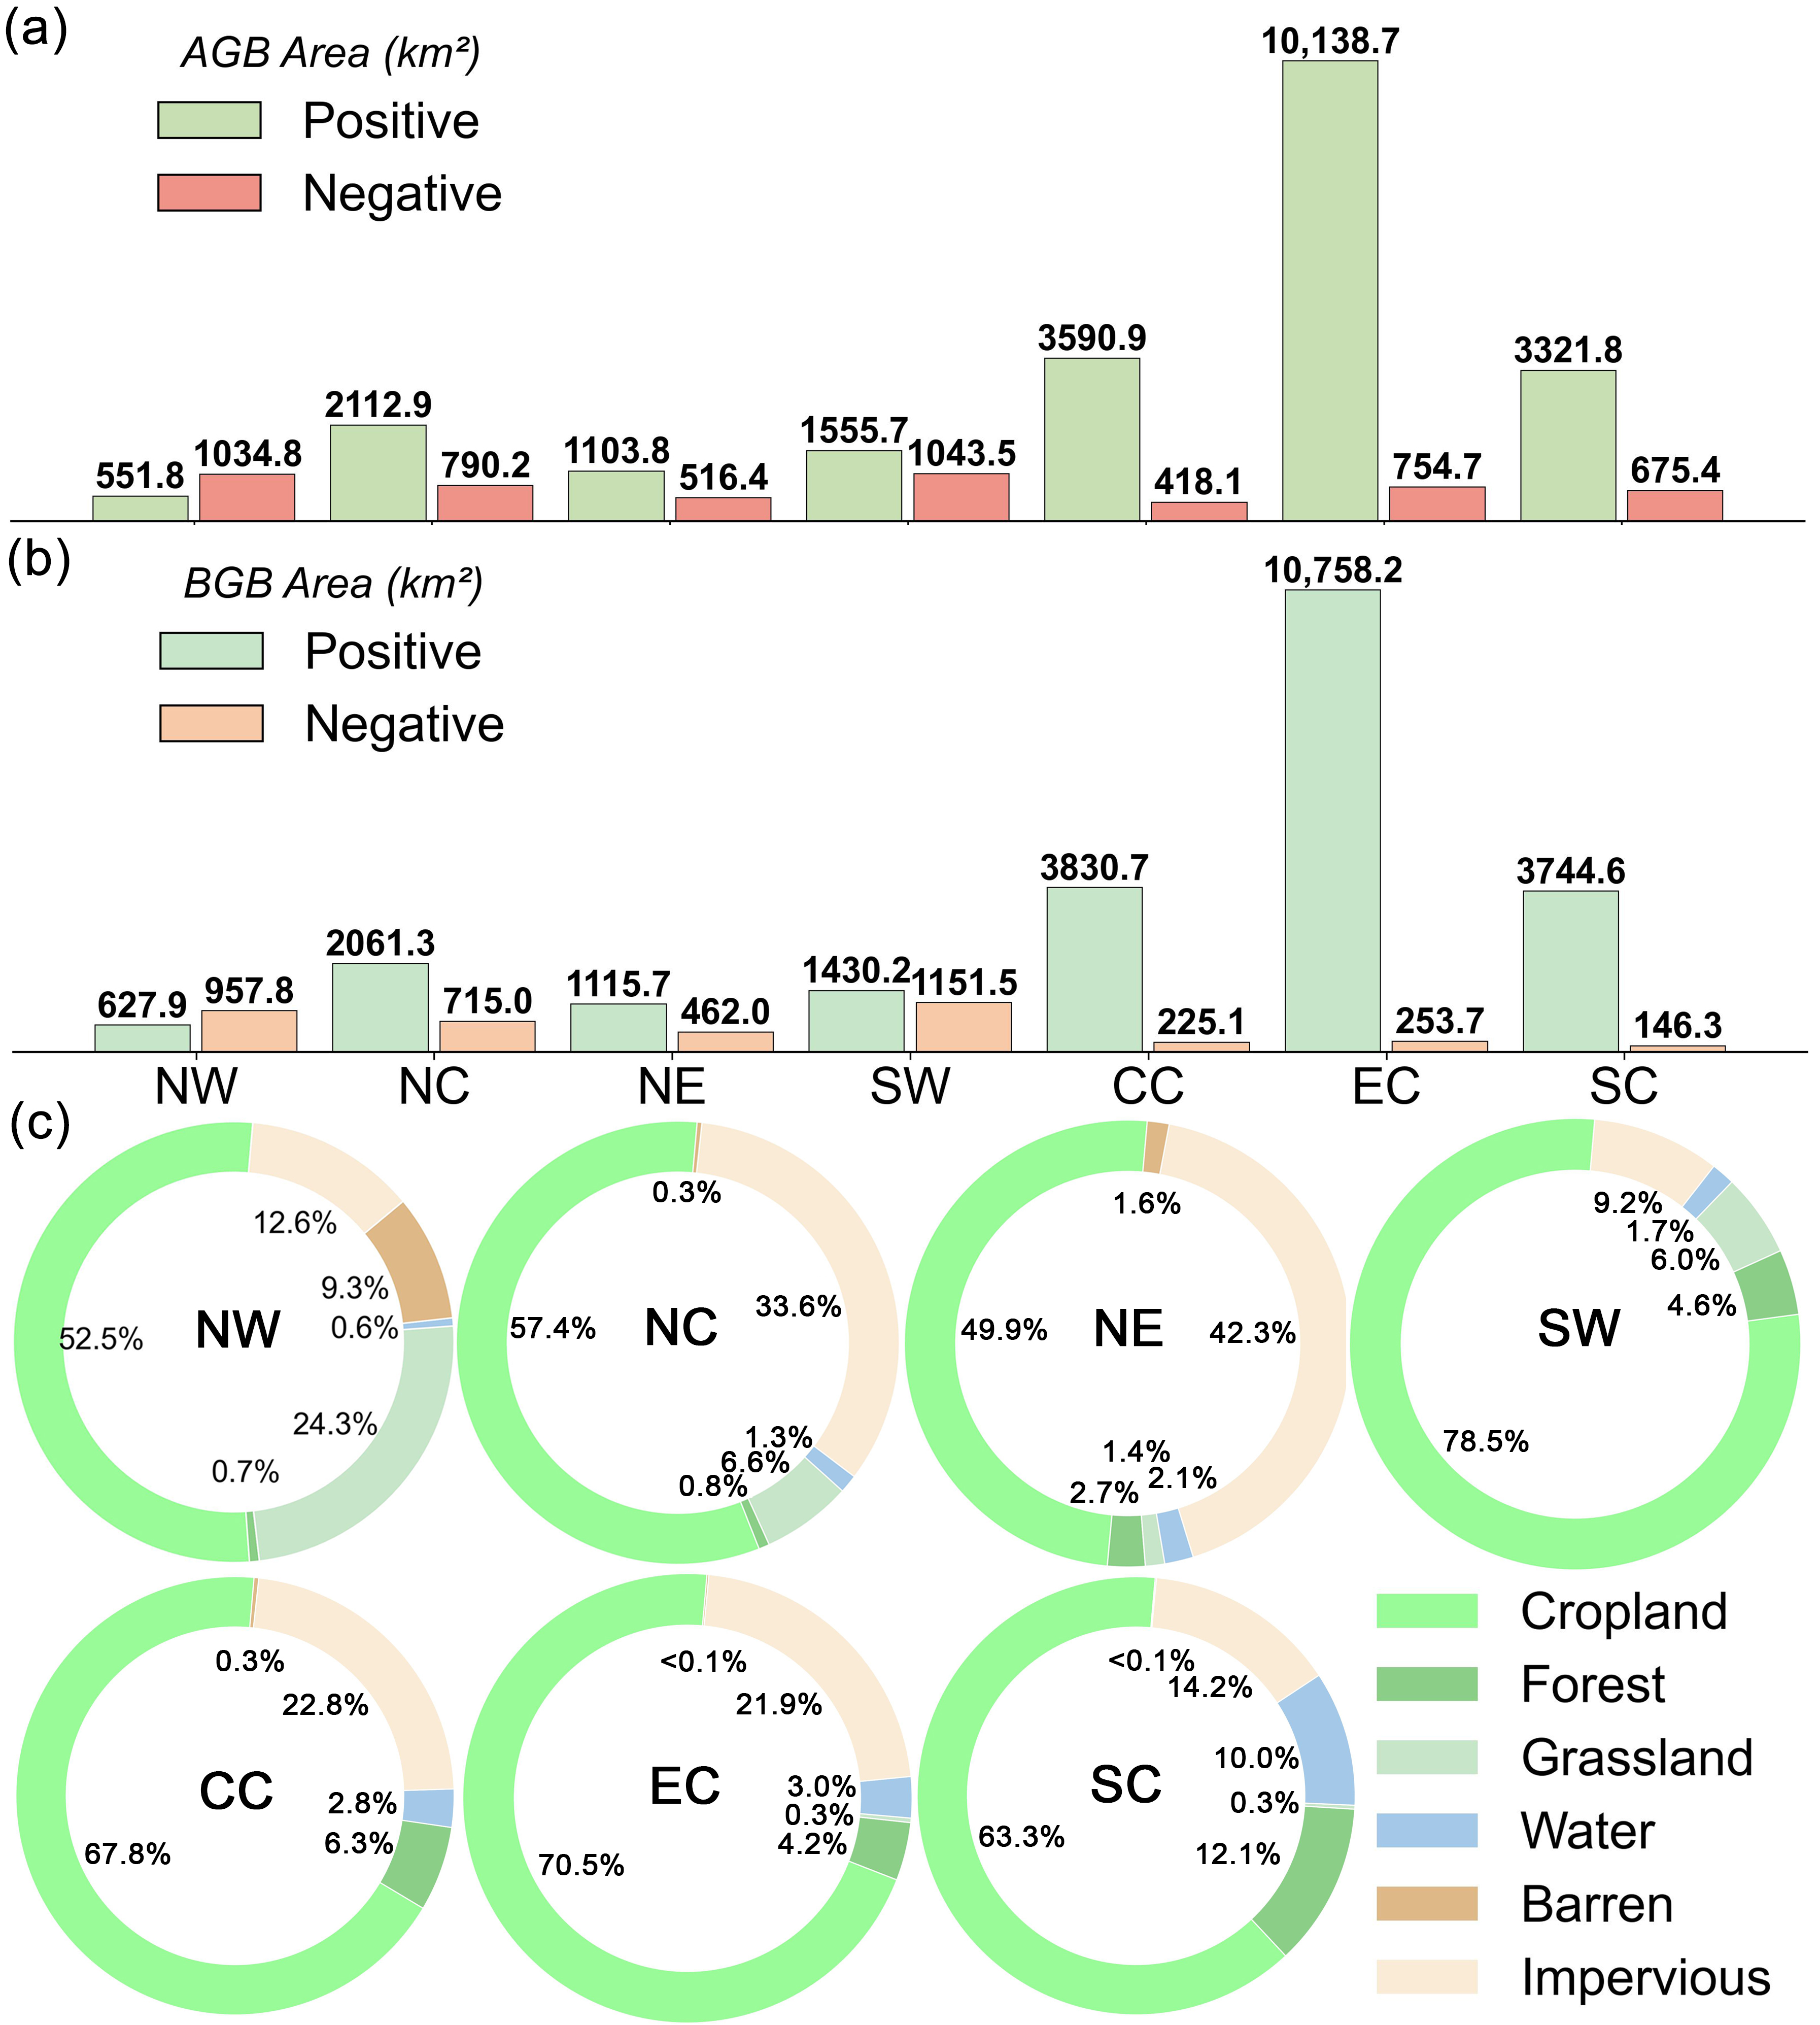
Climatic conditions in different geographical regions are key factors shaping the impacts of urban expansion on AGB and BGB (Figure 5 and Figure 6). The most direct manifestation is the significant variation in initial land use types within urban expansion areas across different geographical regions (Figure 7c). The initial land use in urban areas exhibits a clear relationship with the formation and relative magnitude of negative/positive impacts (Figure 7). In the CC, SW, SC, and EC regions, where cropland initially dominates, vegetation biomass experienced widespread impacts during the rapid early stages of urbanization (Figure 7). This phenomenon is particularly pronounced in the EC, where urban expansion has been especially rapid (Figure 7a,b). In contrast, the NC and NE regions, characterized by a higher initial proportion of impervious surfaces, show less pronounced urban expansion effects and relatively smaller impacts on vegetation biomass (Figure 7). The NW region, with its extensive bare land, often becomes a priority target for urban expansion due to lower development costs. While this has a smaller direct impact on biomass, the region’s large grassland areas and scarce water resources make urban expansion more likely to negatively affect vegetation biomass (Figure 7). Overall, in most regions, the positive impacts induced by urban expansion outweigh the negative impacts. However, in the NW region, the overall negative impacts exceed the positive impacts (Figure 7).

4. Discussion

4.1. EAGB and EBGB Can Effectively Monitor the Impacts of Urban Expansion on AGB and BGB in China

This study integrates multiple climatic factors (precipitation, temperature, potential evapotranspiration, and CO2 concentration) through principal component analysis to construct EAGB and EBGB. As key environmental factors for plant growth and development, changes in climatic factors such as temperature and precipitation inevitably alter vegetation growth conditions, thereby affecting plant growth [33]. High temperatures can promote plant growth and increase photosynthetic rates, while temporal and spatial variations in precipitation distribution significantly influence vegetation carbon sequestration capacity by affecting water availability [34]. Previous studies have shown that under the background of global warming, rising temperatures have promoted vegetation activity in most regions but adversely affected vegetation growth in arid and semi-arid areas [35]. In these regions, the correlation between vegetation increase and temperature turns negative, while it becomes positive with precipitation [36]. Additionally, the substantial carbon dioxide emissions generated during urban development alter regional greenhouse effects and carbon cycle processes. Higher CO2 levels in urban areas, along with greenhouse gas emissions and temperatures, may to some extent promote vegetation growth [37]. Evapotranspiration, as a primary mechanism for water and energy exchange on land surfaces, directly regulates plant growth processes by influencing soil moisture and surface temperature [38]. Correlation analysis based on nationwide data from 2000 to 2020 indicates significant correlations between AGB, BGB, and precipitation, temperature, potential evapotranspiration, and CO2 concentration (Figure S3).
Compared with traditional approaches based on vegetation indices or ecosystem productivity indicators, EAGB and EBGB incorporate climatic background information and can reduce, to some extent, the influence of natural climate variability on the identification of biomass changes. Previous studies have demonstrated that remote sensing-based vegetation indices, such as NDVI and EVI, and productivity indicators, such as GPP and NEP, have been widely applied in assessing the ecological effects of urbanization. However, variations in these indicators reflect not only anthropogenic disturbances but also changes in climatic conditions and environmental backgrounds. Therefore, single indicators may have limited ability to distinguish the relative contributions of urban expansion and natural factors to vegetation changes. In this study, comprehensive bias indices were developed based on AGB and BGB and further integrated with climatic factors for correction, enabling a more direct characterization of vegetation carbon pool changes in urban expansion areas.

4.2. Overall Spatial Patterns of Urban Expansion Impacts on AGB and BGB

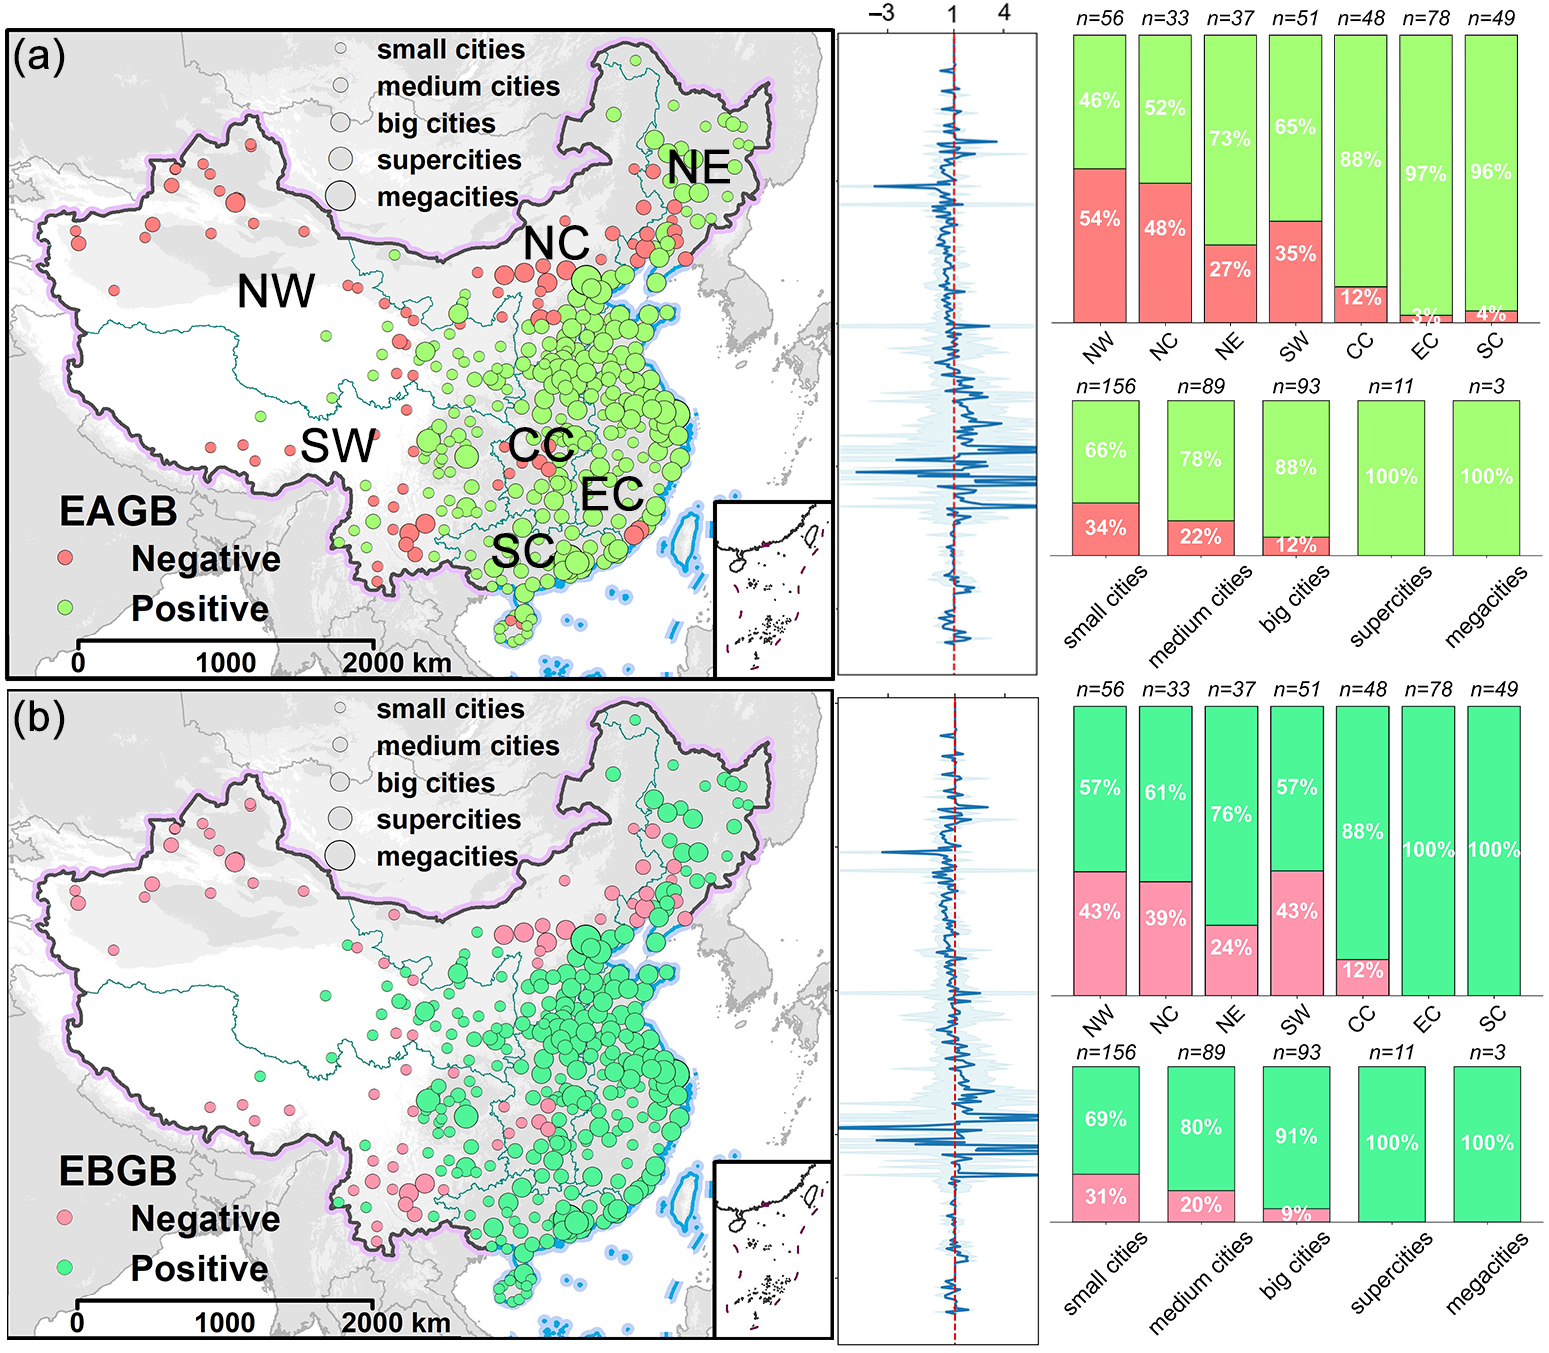
The impact of urban expansion on vegetation biomass in China exhibits a spatial distribution pattern that shifts from positive in the southeastern coastal regions to negative in the northwestern interior (Figure 8). This study identified marked regional disparities in the impacts of urban expansion on biomass, aligning with previous findings regarding the spatial heterogeneity of urbanization’s ecological effects [39]. However, diverging from prior studies that primarily focused on biomass loss, our results reveal that urban expansion can trigger dual ecological responses—simultaneous biomass gain and loss. This suggests that urbanization does not inevitably result in regional ecological degradation; rather, its net effect is contingent upon the interplay between natural constraints and anthropogenic management. Previous research has established that urban development stage and governance models are critical determinants of these ecological outcomes [40]. In the CC and southeastern coastal cities, for instance, favorable hydrothermal conditions, coupled with high ecological investment driven by economic prosperity and eco-city initiatives, collectively facilitated positive effects on both AGB and BGB [41]. Meanwhile, data distribution trends for AGB and BGB from 2000 to 2020 indicate a significant decline in AGB in the NC and NE regions, while BGB shows an increasing trend in most areas (Figures S4 and S5). The intensity of urban expansion’s impact on vegetation biomass also varies across different latitudinal gradients. In low-latitude regions, abundant hydrothermal resources and favorable environmental conditions support strong natural vegetation recovery capacity [42], resulting in less pronounced fluctuations in impacts. In contrast, mid-latitude regions such as NC and the middle-lower reaches of the Yangtze River, characterized by rapid urban expansion and dense urban agglomerations, exhibit significant fluctuations between positive and negative impacts due to the interplay between natural vegetation loss and urban ecological engineering [43]. In some high-latitude regions, such as the developed urban areas of Northeast China, the magnitude of urban expansion’s impact on vegetation is also considerable. In these highly developed cities, intensive human activities often play a key role in determining whether the effects on vegetation biomass are positive or negative [44]. Faced with both the positive and negative impacts of urban expansion, urban planning and ecological management must be grounded in regional specificity and comprehensively assess and balance these complex effects in order to achieve sustainable urban development and low-carbon expansion. In addition, greening measures and ecological construction in the context of urban expansion should strike a balance between short-term benefits and long-term sustainability. On the one hand, priority should be given to the protection of existing vegetation, and ecological degradation caused by urban expansion should be mitigated through effective planning and land-use management [45]. On the other hand, resource-efficient and environmentally friendly urbanization modes should be adopted in alignment with regional socioeconomic development priorities, so as to enhance socioeconomic benefits while ensuring the sustainability of ecosystems.

4.3. Synergy and Divergence in the Impacts of Urban Expansion on AGB and BGB

From the perspective of the positive impacts of urban expansion on AGB and BGB, the spatial extents of positive impacts on AGB and BGB in most cities exhibit a certain degree of synergy. For example, in cities such as Suzhou (637.63 km2, 649.48 km2) and Wuxi (501.05 km2, 508.02 km2), the positive impacts on AGB and BGB are largely consistent (Figure 3). This is often the result of the combined effects of climatic drivers and human management. On one hand, urban expansion can improve local microclimates through heat island effects and precipitation redistribution, simultaneously promoting aboveground photosynthesis and belowground root development, leading to synergistic growth of AGB and BGB [43,46]. On the other hand, thanks to urban greening strategies that coordinate aboveground vegetation enhancement with belowground soil improvement, AGB and BGB can grow synergistically under artificial irrigation and fertilization management in urban green spaces [47]. However, a small number of cities show significant divergence, such as Beijing (354.00 km2, 230.66 km2) and Zhangzhou (88.50 km2, 137.28 km2), where the impacts on AGB and BGB differ markedly. This may be due to differences in vegetation carbon allocation strategies, the occupation of underground space during urban expansion, and urban soil compaction limiting deep root development [48]. Driver analysis results indicate that the drivers of positive impacts on AGB and BGB are highly similar, but CO2 concentration plays a more important role in positive impacts on BGB. High CO2 concentrations have a significantly positive effect on BGB (Figure 5). The uniqueness of plant carbon allocation mechanisms and root response characteristics likely makes BGB more sensitive to CO2 concentration than AGB, which may be the primary reason for this phenomenon [49,50].
The negative impacts of urban expansion on AGB and BGB across cities exhibit a complex relationship of synergy and divergence (Figure 4). In most cities within the NW, NC, NE, SW, and CC regions, the magnitudes of negative impacts on AGB and BGB are similar, indicating that urban expansion has a synergistic destructive effect on vegetation and soil carbon pools; that is, AGB loss is often accompanied by synchronous BGB reduction. However, in the SC and EC regions, the negative impact on AGB is significantly higher (Figure 4). This divergence in damage may be related to the rapid urbanization process, which reduces vegetation cover while partially preserving the soil carbon pool [51]. Among the drivers of negative impacts on AGB and BGB, topographic factors—specifically elevation and slope—play a more dominant role in the negative impact on AGB (Figure 6a,b). This reflects how changes in topography often alter temperature, moisture, and light conditions, exerting a direct, rapid, and pronounced effect on AGB [52].

4.4. Research Uncertainty and Future Prospects

This study focuses on rapidly developing urban expansion areas in China from 2000 to 2020. Based on EAGB and EBGB, it systematically assesses the dual impacts of urban expansion on AGB and BGB over the past two decades and explores the driving factors, regional differences, as well as the synergies and divergences of these impacts on AGB and BGB. The results show that during 2000–2020, urban expansion in China was substantial but regionally uneven, exerting significant positive and negative impacts on AGB and BGB. Climatic factors and human activities are the dominant drivers behind the varying impacts of urban expansion on AGB and BGB, with their relative influence displaying notable regional and temporal differences. The positive/negative impacts of urban expansion on AGB and BGB across cities exhibit complex synergistic and divergent relationships, with consistent impact directions in most cities. These findings provide important theoretical and practical insights for deepening the understanding of urbanization’s ecological effects, promoting coordination between urban development and ecological conservation, and supporting sustainable urban development.
However, this study still has certain limitations, which also point to directions for future research. Currently, large-scale remote sensing-based assessments of vegetation dynamics are limited by spatial and temporal resolution, making it difficult to capture the fine-scale, highly heterogeneous distribution of vegetation within cities and short-term, small-scale vegetation change dynamics [40,53]. In addition, although the use of CIF in this study improved the model’s ability to represent climatic stress, the construction of EAGB and EBGB still involves uncertainties. A simple linear ratio form may not fully capture the complex nonlinear relationships between biomass and climatic factors, and the influence of non-climatic biological factors such as soil conditions and pests/diseases has not been considered [54]. Although PCA cannot fully characterize the complex nonlinear interactions between climate and vegetation, it provides an effective approach for integrating multiple climatic variables and reducing variable redundancy and has therefore been widely applied in large-scale ecological studies. It should be noted that the objective of EAGB and EBGB is not to completely eliminate the influence of climatic factors but rather to reduce climatic background interference as much as possible at the national scale and improve the identification of biomass responses associated with urban expansion. In addition, this study adopted nationally unified thresholds to ensure methodological consistency among different regions. Future studies could further improve the sensitivity of the indices to regional ecological differences by applying region-specific or ecoregion-specific thresholds. In model construction, the LightGBM classification model used in this study effectively identified the occurrence of positive and negative biomass responses, although it limited the ability to quantify the magnitude of biomass changes. Although certain socioeconomic variables may exhibit potential collinearity, tree-based models such as LightGBM are generally less sensitive to multicollinearity than traditional linear models. Future studies could further optimize variable selection by incorporating additional collinearity analyses. In terms of attribution analysis, while the selection of drivers covered four major categories and a total of 17 factors, some potentially key urban management policy factors (e.g., green space ratio regulations, irrigation infrastructure) could not be included due to data availability, which may affect the model’s explanatory power for regional differences [55]. It should be noted that atmospheric CO2 in this study was primarily used to represent the long-term climatic background rather than a direct physiological driver of vegetation biomass changes at the urban scale. In subsequent research, remote sensing data with higher spatiotemporal resolution should be integrated, combined with technologies such as LiDAR, and an assessment framework incorporating multiple indicators such as biodiversity and vegetation community structure should be adopted to gain a more comprehensive, multi-scale understanding of the overall impact of urban expansion on vegetation biomass in China. When interpreting spatial patterns at local scales, the uncertainties introduced by resampling multi-source datasets should be fully considered, particularly in highly heterogeneous areas such as urban fringe zones. At the same time, future studies should expand the set of driving factors from natural elements to socioeconomic dimensions such as governance models, land policies, and public participation. A social–ecological coupled analysis framework could be applied to reveal the human-driven mechanisms affecting vegetation biomass and explore governance pathways for coordinated development [56]. Moreover, in the context of global climate change, follow-up research needs to focus on the compound effects and feedback mechanisms between extreme climate events (e.g., heatwaves, droughts) and urban expansion and to assess the vulnerability and resilience of urban vegetation biomass, thereby providing a basis for formulating climate-adaptive urban strategies [57].

5. Conclusions

This study developed EAGB and EBGB by incorporating climatic background information to reduce the interference of natural environmental variability in identifying biomass responses, thereby providing a novel analytical framework for large-scale assessments of ecosystem carbon stock changes under urban expansion. Compared with conventional vegetation indices and ecosystem productivity indicators, EAGB and EBGB more directly capture changes in AGB and BGB and effectively identify vegetation biomass recovery and loss associated with urban expansion. Using this framework, we revealed pronounced spatial heterogeneity in the impacts of urban expansion on AGB and BGB across China during 2000–2020. The results indicate that urban expansion does not inevitably lead to vegetation biomass loss; instead, its ecological effects are jointly regulated by regional climatic conditions, urban development stages, and human management activities. Climatic factors, human activities, and topographic conditions collectively drive biomass responses across different regions, and their relative contributions vary over time. These findings provide a scientific basis for urban ecological planning and low-carbon development. In ecologically fragile regions, greater emphasis should be placed on land-use regulation and vegetation conservation, whereas in rapidly urbanizing areas, urban greening, ecological restoration, and optimized land-use planning should be strengthened to mitigate biomass loss. Furthermore, future urban ecosystem management should jointly consider changes in AGB and BGB to achieve a more comprehensive evaluation of the impacts of urban expansion on ecosystem carbon stocks.

Supplementary Materials

The following supporting information can be downloaded at: https://www.mdpi.com/article/10.3390/f17080890/s1. Note S1. Quantifying urban expansion dynamics. Table S1. Number of cities in each urban category. Table S2. Details of 17 potential drivers selected in this study. Table S3. Summary of model parameters and performance for the positive effects model. Table S4. Summary of model parameters and performance for the negative effects model. Figure S1. The cumulative variance explained by the first two principal components for the period 2000–2020. Figure S2. Spatial distribution of CIF and four climatic factors during 2000 to 2020. Figure S3. The correlation between AGB, BGB, and multiple climatic factors across China for the period 2000–2020. Figure S4. Temporal trends in AGB and BGB within positive effects regions across different geographical divisions of China (NW, NC, NE, SW, CC, EC, SC) for the period 2000–2020. Figure S5. Temporal trends in AGB and BGB within negative effects regions across different geographical divisions of China (NW, NC, NE, SW, CC, EC, SC) for the period 2000–2020. References [9,58,59,60] are cited in the supplementary materials.

Author Contributions

Conceptualization, Y.L. and C.Z.; methodology, Y.L. and M.S.; software, Y.X. and S.N.; validation, Y.X., M.S. and S.N.; formal analysis, Y.L.; investigation, X.G. and S.N.; resources, M.S. and X.G.; data curation, Y.X. and X.G.; writing—original draft preparation, Y.L.; writing—review and editing, C.Z. and Z.Z.; visualization, Y.X.; supervision, Z.Z.; project administration, C.Z. and Z.Z.; funding acquisition, C.Z. and Z.Z. All authors have read and agreed to the published version of the manuscript.

Funding

This research was supported by Stabilization support from the Young Doctor Program of the 2024 “Tianchi Talent” Introduction Program (Grant No. 007510) and the National Natural Science Foundation of China (42501070).

Data Availability Statement

All data generated or analyzed during this study are included in this published article and its Supplementary Information Files.

Conflicts of Interest

The authors declare no conflicts of interest.

References

  1. Gong, P.; Li, X.; Wang, J.; Bai, Y.; Chen, B.; Hu, T.; Liu, X.; Xu, B.; Yang, J.; Zhang, W.; et al. Annual maps of global artificial impervious area (GAIA) between 1985 and 2018. Remote Sens. Environ. 2020, 236, 111510. [Google Scholar] [CrossRef]
  2. Peng, L.; Huang, K.; Zhang, H.; Sun, W. Exploring the impacts of urbanization on vegetation growth from the perspective of urban expansion patterns and maturity: A case study on 40 large cities in China. Sustain. Cities Soc. 2024, 115, 105841. [Google Scholar] [CrossRef]
  3. Chen, W.; Liu, Q.; Wang, G.; Pan, S.; Zeng, J. How does habitat quality respond to urbanization in China? A multi-scale perspective. J. Environ. Manag. 2025, 396, 128058. [Google Scholar] [CrossRef] [PubMed]
  4. Gong, J.; Zhao, J.; Wang, Y.; Zhang, H.; Fan, L.; Xiong, T.; Zhou, Y. The footprint of urbanization on land surface phenology in China. Glob. Planet. Chang. 2026, 258, 105306. [Google Scholar] [CrossRef]
  5. Fassnacht, F.E.; Hartig, F.; Latifi, H.; Berger, C.; Hernández, J.; Corvalán, P.; Koch, B. Importance of sample size, data type and prediction method for remote sensing-based estimations of aboveground forest biomass. Remote Sens. Environ. 2014, 154, 102–114. [Google Scholar] [CrossRef]
  6. Akhtar, M.; Zhao, Y.; Gao, G.; Gulzar, Q.; Hussain, A. Assessment of spatiotemporal variations of ecosystem service values and hotspots in a dryland: A case-study in Pakistan. Land Degrad. Dev. 2022, 33, 15. [Google Scholar] [CrossRef]
  7. Mata, L.; Hahs, A.K.; Palma, E.; Backstrom, A.; Johnston, N.; King, T.; Olson, A.R.; Renowden, C.; Smith, T.R.; Vogel, B.; et al. Large positive ecological changes of small urban greening actions. Ecol. Solut. Evid. 2023, 4, e12259. [Google Scholar] [CrossRef]
  8. Milnar, M.; Ramaswami, A. Impact of Urban Expansion and In Situ Greenery on Community-Wide Carbon Emissions: Method Development and Insights from 11 US Cities. Environ. Sci. Technol. 2020, 54, 16086–16096. [Google Scholar] [CrossRef] [PubMed]
  9. Qi, T.; He, C.; Ren, Q.; Wang, Y.; Cao, S. Dual effects on vegetation caused by urban expansion in global drylands: Insights from the enhanced vegetation disturbance index. Resour. Conserv. Recycl. 2025, 222, 108438. [Google Scholar] [CrossRef]
  10. You, Y.-J.; Liu, M.; Ni, H.-G. Dynamic indirect impacts of urbanization on vegetation growth in Chinese cities. Int. J. Appl. Earth Obs. Geoinf. 2024, 131, 103974. [Google Scholar] [CrossRef]
  11. Liu, X.; Cui, Y.; Li, W.; Li, M.; Li, N.; Shi, Z.; Dong, J.; Xiao, X. Urbanization expands the fluctuating difference in gross primary productivity between urban and rural areas from 2000 to 2018 in China. Sci. Total Environ. 2023, 901, 166490. [Google Scholar] [CrossRef] [PubMed]
  12. Wang, Z.; Liang, C.; Liu, J.; Liu, H.; Xu, X.; Xue, P.; Gong, H.; Jiao, F.; Zhang, M. How urbanization shapes the ecosystem carbon sink of vegetation in China: A spatiotemporal analysis of direct and indirect effects. Urban Clim. 2024, 55, 101896. [Google Scholar] [CrossRef]
  13. Wu, B.; Zhang, Y.; Wang, Y.; Lin, X.; Wu, Y.; Wang, J.; Wu, S.; He, Y. Urbanization promotes carbon storage or not? The evidence during the rapid process of China. J. Environ. Manag. 2024, 359, 121061. [Google Scholar] [CrossRef] [PubMed]
  14. Du, H.; Cui, R.; Zhou, G.; Shi, Y.; Xu, X.; Fan, W.; Lü, Y. The responses of Moso bamboo (Phyllostachys heterocycla var. pubescens) forest aboveground biomass to Landsat TM spectral reflectance and NDVI. Acta Ecol. Sin. 2010, 30, 257–263. [Google Scholar] [CrossRef]
  15. Gao, B.C. NDWI—A normalized difference water index for remote sensing of vegetation liquid water from space. IEEE Trans. Geosci. Remote Sens. 1996, 58, 257–266. [Google Scholar] [CrossRef]
  16. Li, X.; Jiang, Y.; Liu, Y.; Sun, Y. The impact of landscape spatial morphology on green carbon sink in the urban riverfront area. Cities 2024, 148, 104919. [Google Scholar] [CrossRef]
  17. Zhang, J.; Deng, Y.; Wang, J.; Torres, R.A.C.; Li, J.; Pan, J.; Cheng, F.; Wang, C. Estimation of above-ground carbon storage in urban green space trees incorporating crown volume structural parameters. Trees For. People 2026, 23, 101117. [Google Scholar] [CrossRef]
  18. Nowak, D.J.; Greenfield, E.J. Tree and impervious cover in the United States. Landsc. Urban Plan. 2012, 107, 21–30. [Google Scholar] [CrossRef]
  19. Kuang, W.; Du, G.; Lu, D.; Dou, Y.; Li, X.; Zhang, S.; Chi, W.; Dong, J.; Chen, G.; Yin, Z.; et al. Global observation of urban expansion and land-cover dynamics using satellite big-data. Sci. Bull. 2021, 66, 297–300. [Google Scholar] [CrossRef] [PubMed]
  20. Huang, J.Y.X. The 30 m annual landcover datasets and its dynamics in China from 1985 to 2025. Earth Syst. Sci. Data 2026. [Google Scholar] [CrossRef]
  21. Zhang, X.; Masron, T.A. Does climate affect regional economic development in China? Cogent Soc. Sci. 2023, 9, 2283918. [Google Scholar] [CrossRef]
  22. Qi, W.; Deng, Y. How to define the city size in China? A review over a century from 1918 to 2020. Cities 2024, 144, 104649. [Google Scholar] [CrossRef]
  23. Zhu, C.; Li, Y.; Ding, J.; Rao, J.; Xiang, Y.; Ge, X.; Wang, J.; Wang, J.; Chen, X.; Zhang, Z. Spatiotemporal analysis of AGB and BGB in China: Responses to climate change under SSP scenarios. Geosci. Front. 2025, 16, 102038. [Google Scholar] [CrossRef]
  24. Liu, Y.; Huang, C.; Yang, C.; Huang, W. Dynamic vegetation changes and driving factors analysis of the Guanzhong Plain urban agglomeration. Adv. Space Res. 2026, 77, 4746–4762. [Google Scholar] [CrossRef]
  25. Luo, Q.; Liu, F.; Liu, M.; Yao, L.; Rong, J.; Zhou, J. Spatiotemporal heterogeneity and drivers of vegetation carbon sequestration across 1363 Chinese cities: An urban-rural gradient perspective. Urban For. Urban Green. 2025, 112, 128941. [Google Scholar] [CrossRef]
  26. Ma, Q.; He, C.; Fang, X. A rapid method for quantifying landscape-scale vegetation disturbances by surface coal mining in arid and semiarid regions. Landsc. Ecol. 2018, 33, 2061–2070. [Google Scholar] [CrossRef]
  27. Lever, J.; Krzywinski, M.; Altman, N. Principal component analysis. Nat. Methods 2017, 14, 641–642. [Google Scholar] [CrossRef]
  28. Qi, T.; Ren, Q.; He, C.; Zhang, X. Dual effects on vegetation from urban expansion in the drylands of northern China: A multiscale investigation using the vegetation disturbance index. Sci. Total Environ. 2024, 928, 172481. [Google Scholar] [CrossRef] [PubMed]
  29. Lundberg, S.M.; Lee, S.-I. A unified approach to interpreting model predictions. In Proceedings of the 31st International Conference on Neural Information Processing Systems; Curran Associates Inc.: Long Beach, CA, USA, 2017; Volume 30, pp. 4768–4777. [Google Scholar]
  30. Ke, G.; Meng, Q.; Finley, T.; Wang, T.; Chen, W.; Ma, W.; Ye, Q.; Liu, T.-Y. Lightgbm: A highly efficient gradient boosting decision tree. In Proceedings of the 31st Conference on Neural Information Processing Systems (NIPS 2017), Long Beach, CA, USA, 4–9 December 2017. [Google Scholar]
  31. Sun, X.; Liu, M.; Sima, Z. A novel cryptocurrency price trend forecasting model based on LightGBM. Financ. Res. Lett. 2020, 32, 101084. [Google Scholar] [CrossRef]
  32. Shorrocks, A.F. Decomposition Procedures for Distributional Analysis: A Unified Framework Based on the Shapley Value. J. Econ. Inequal. 2012, 11, 99–126. [Google Scholar] [CrossRef]
  33. Seddon, A.W.R.; Macias-Fauria, M.; Long, P.R.; Benz, D.; Willis, K.J. Sensitivity of global terrestrial ecosystems to climate variability. Nature 2016, 531, 229–232. [Google Scholar] [CrossRef] [PubMed]
  34. Yang, M.; Liu, J.; Wang, Y.; Chen, J.M.; Cui, Z.; Zhang, Z.; Chen, Z.; Cheng, Z.; Cheng, X. Prominent impact of Diurnal rainfall variations on evapotranspiration and gross primary productivity in forests over low latitudes. Agric. For. Meteorol. 2023, 342, 109740. [Google Scholar] [CrossRef]
  35. Cao, D.; Zhang, J.; Xun, L.; Yang, S.; Wang, J.; Yao, F. Spatiotemporal variations of global terrestrial vegetation climate potential productivity under climate change. Sci. Total Environ. 2021, 770, 145320. [Google Scholar] [CrossRef] [PubMed]
  36. Liu, Y.; Li, Y.; Li, S.; Motesharrei, S. Spatial and temporal patterns of global NDVI trends: Correlations with climate and human factors. Remote Sens. 2015, 7, 13233–13250. [Google Scholar] [CrossRef]
  37. Luo, J.; Liu, L.; Zheng, J.; Yan, Y.; Han, C.; Han, W. Aerosol optical depth and ozone enhance their impacts on vegetation productivity via temperature in urban agglomerations of China. Ecol. Indic. 2025, 181, 114483. [Google Scholar] [CrossRef]
  38. Zhu, Y.; Zheng, Z.; Zhao, G.; Zhu, J.; Zhao, B.; Sun, Y.; Gao, J.; Zhang, Y. Evapotranspiration increase is more sensitive to vegetation greening than to vegetation type conversion in arid and semi-arid regions of China. Glob. Planet. Chang. 2025, 244, 104634. [Google Scholar] [CrossRef]
  39. Haase, D.; Larondelle, N.; Andersson, E.; Artmann, M.; Borgström, S.; Breuste, J.; Gomez-Baggethun, E.; Gren, Å.; Hamstead, Z.; Hansen, R.; et al. A Quantitative Review of Urban Ecosystem Service Assessments: Concepts, Models, and Implementation. Ambio 2014, 43, 413–433. [Google Scholar] [CrossRef] [PubMed]
  40. Zhao, K.; Shao, Z.; Li, L.; Xu, X.; Liu, Y.; Hu, G. Historical and future losses of terrestrial ecosystem carbon stocks induced by urbanization in China from 1990 to 2100 under SSP scenarios. Environ. Sustain. Indic. 2025, 28, 101023. [Google Scholar] [CrossRef]
  41. Zhang, L.; Yang, L.; Zohner, C.M.; Crowther, T.W.; Li, M.; Shen, F.; Guo, M.; Qin, J.; Yao, L.; Zhou, C. Direct and indirect impacts of urbanization on vegetation growth across the world’s cities. Sci. Adv. 2022, 8, eabo0095. [Google Scholar] [CrossRef] [PubMed]
  42. Poorter, L.; Bongers, F.; Aide, T.M.; Almeyda Zambrano, A.M.; Balvanera, P.; Becknell, J.M.; Boukili, V.; Brancalion, P.H.S.; Broadbent, E.N.; Chazdon, R.L.; et al. Biomass resilience of Neotropical secondary forests. Nature 2016, 530, 211–214. [Google Scholar] [CrossRef] [PubMed]
  43. Wu, B.; Zhang, Y.; Wang, Y.; He, Y.; Dong, Z. Indirect Urbanization Impacts Shape Vegetation Growth and Carbon Sink Dynamics: Synergies and Trade-Offs across China. Environ. Sci. Technol. 2026, 60, 3186–3201. [Google Scholar] [CrossRef] [PubMed]
  44. Seto, K.C.; Güneralp, B.; Hutyra, L.R. Global forecasts of urban expansion to 2030 and direct impacts on biodiversity and carbon pools. Proc. Natl. Acad. Sci. USA 2012, 109, 16083–16088. [Google Scholar] [CrossRef] [PubMed]
  45. Xiao, R.; Yin, H.; Liu, R.; Zhang, Z.; Chinzorig, S.; Qin, K.; Tan, W.; Wan, Y.; Gao, Z.; Xu, C.; et al. Exploring the relationship between land use change patterns and variation in environmental factors within urban agglomeration. Sustain. Cities Soc. 2024, 108, 105447. [Google Scholar] [CrossRef]
  46. Lisha, M.A.; Liu, Y. Modelling Gradient Changes of Non-linear Dynamic Coupling Relationships between Urban Expansion and Ecological Land. J. Geo-Inf. Sci. 2023, 25, 1968–1985. [Google Scholar] [CrossRef]
  47. Zhang, T.; Wang, Y.; Liu, Y.; Peng, J. Multi-temporal detection of landscape evolution in western Shenzhen City during 1987–2015. Geogr. Res. 2016, 12, 2170–2184. [Google Scholar]
  48. Xie, J.; Zhan, Y.; Li, X.; Dai, Z.; Cong, R.; Xu, R.; Zhang, Z.; Yao, Z. Significant carbon storage and sequestration by urban greenery in Beijing city during 2010–2020. Urban For. Urban Green. 2025, 112, 128944. [Google Scholar] [CrossRef]
  49. Chen, Y.; Zhang, S.; Wang, Y. Spatial distribution patterns and drivers of above- and below- biomass in Chinese terrestrial ecosystems. Sci. Total Environ. 2024, 944, 173922. [Google Scholar] [CrossRef] [PubMed]
  50. Wang, X.; An, Y.; Wang, L.; Zhang, M.; Xing, X.; Tong, S.; Wu, H. Leaf and root traits codetermine biomass production and allocation patterns in agriculturally managed wetlands in a semi-arid region. Agric. Ecosyst. Environ. 2026, 400, 173922. [Google Scholar] [CrossRef]
  51. Guo, L.B.; Gifford, R.M. Soil carbon stocks and land use change: A meta analysis. Glob. Chang. Biol. 2002, 8, 345–360. [Google Scholar] [CrossRef]
  52. Salinas-Melgoza, M.A.; Skutsch, M.; Lovett, J.C. Predicting aboveground forest biomass with topographic variables in human-impacted tropical dry forest landscapes. Ecosphere 2018, 9, e02063. [Google Scholar] [CrossRef]
  53. Kabisch, N.; Selsam, P.; Kirsten, T.; Lausch, A.; Bumberger, J. A multi-sensor and multi-temporal remote sensing approach to detect land cover change dynamics in heterogeneous urban landscapes. Ecol. Indic. 2019, 99, 273–282. [Google Scholar] [CrossRef]
  54. Farkas, J.Z.; Hoyk, E.; de Morais, M.B.; Csomós, G. A systematic review of urban green space research over the last 30 years: A bibliometric analysis. Heliyon 2023, 9, e13406. [Google Scholar] [CrossRef] [PubMed]
  55. Lourdes, K.T.; Hamel, P.; Gibbins, C.N.; Sanusi, R.; Azhar, B.; Lechner, A.M. Planning for green infrastructure using multiple urban ecosystem service models and multicriteria analysis. Landsc. Urban Plan. 2022, 226, 104500. [Google Scholar] [CrossRef]
  56. Grimm, N.B.; Faeth, S.H.; Golubiewski, N.E.; Redman, C.L.; Wu, J.; Bai, X.; Briggs, J.M. Global Change and the Ecology of Cities. Science 2008, 319, 756–760. [Google Scholar] [CrossRef] [PubMed]
  57. Zhou, W.; Huang, G.; Pickett, S.T.A.; Wang, J.; Cadenasso, M.L.; McPhearson, T.; Grove, J.M.; Wang, J. Urban tree canopy has greater cooling effects in socially vulnerable communities in the US. One Earth 2021, 4, 1764–1775. [Google Scholar] [CrossRef]
  58. Zhou, W.; Yu, W.; Qian, Y.; Han, L.; Pickett, S.T.; Wang, J.; Li, W.; Ouyang, Z. Beyond city expansion: Multi-scale environmental impacts of urban megaregion formation in China. Natl. Sci. Rev. 2022, 9, nwab107. [Google Scholar] [CrossRef]
  59. Mu, H.; Li, X.; Wen, Y.; Huang, J.; Du, P.; Su, W.; Miao, S.; Geng, M. A global record of annual terrestrial Human Footprint dataset from 2000 to 2018. Sci. Data 2022, 9, 176. [Google Scholar]
  60. Li, X.C.; Zhou, Y.Y.; Zhao, M.; Zhao, X. A harmonized global nighttime light dataset 1992–2018. Sci. Data 2020, 7, 168. [Google Scholar]
Figure 1. Urban Distribution and Initial Land Cover Status of China’s Seven Geographical Divisions. (a) Spatial distribution of different city categories. The color and size of the circles indicate city categories, including 156 small cities (urban population < 0.5 million), 89 medium-sized cities (0.5–1 million), 93 large cities (1–5 million), 11 megacities (5–10 million), and 3 super megacities (>10 million). (b) Number of cities in each category across different regions.
Forests 17 00890 g001
Figure 2. The situation of urban expansion in China from 2000 to 2020. (a) Spatial distribution of urban expansion scale. (b) Top 30 cities ranked by urban expansion scale. (c) Spatial distribution of urban expansion rate. (d) Top 30 cities ranked by urban expansion rate.
Forests 17 00890 g002
Figure 3. Positive impacts of AGB and BGB caused by urban expansion in China from 2000 to 2020. (a) Spatial distribution of positive impacts on AGB and BGB. (b) Top 30 cities ranked by the magnitude of positive impacts on AGB and BGB.
Forests 17 00890 g003
Figure 4. Negative impacts of AGB and BGB caused by urban expansion in China from 2000 to 2020. (a) Spatial distribution of negative impacts on AGB and BGB. (b) Top 30 cities ranked by the magnitude of negative impacts on AGB and BGB.
Forests 17 00890 g004
Figure 5. Relative contributions of each driving factor to the positive impacts on AGB and BGB. (a,b) respectively show the SHAP importance rankings and SHAP values of key driving factors for the positive impacts on AGB and BGB in the overall study area. (c,d) respectively show the SHAP dependence plots for the key driving factors of positive impacts on AGB and BGB in the overall study area. (e,f) respectively show the relative contributions of each driving factor to the positive impacts on AGB and BGB in different geographical regions during the two periods of 2000–2010 and 2010–2020.
Forests 17 00890 g005
Figure 6. Relative contributions of each driving factor to the negative impacts on AGB and BGB. (a,b) respectively show the SHAP importance rankings and SHAP values of key driving factors for the negative impacts on AGB and BGB in the overall study area. (c,d) respectively show the SHAP dependence plots for the key driving factors of negative impacts on AGB and BGB in the overall study area. (e,f) respectively show the relative contributions of each driving factor to the negative impacts on AGB and BGB in different geographical regions during the two periods of 2000–2010 and 2010–2020.
Forests 17 00890 g006
Figure 7. Regional differences in the positive and negative impacts of urban expansion on AGB and BGB in China from 2000 to 2020. (a) Comparison of positive and negative impacts on AGB across different geographical regions. (b) Comparison of positive and negative impacts on BGB across different geographical regions. (c) Initial land use/cover patterns within urban expansion areas across different geographical regions.
Forests 17 00890 g007
Figure 8. Spatial and latitudinal distribution patterns of the positive and negative impacts of urban expansion on AGB and BGB across Chinese cities of different sizes from 2000 to 2020. (a) Spatial distribution of the positive and negative impacts of urban expansion on AGB. The bar charts on the right show the proportions of areas with positive and negative impacts on AGB across different geographical regions and urban size categories. (b) Spatial distribution of the positive and negative impacts of urban expansion on BGB. The bar charts on the right show the proportions of areas with positive and negative impacts on BGB across different geographical regions and urban size categories.
Forests 17 00890 g008
Disclaimer/Publisher’s Note: The statements, opinions and data contained in all publications are solely those of the individual author(s) and contributor(s) and not of MDPI and/or the editor(s). MDPI and/or the editor(s) disclaim responsibility for any injury to people or property resulting from any ideas, methods, instructions or products referred to in the content.