Article

Research on the Establishment of Experimental Equations for Grassland Water and Sediment Yield and Their Relationships

College of Ecology, Resources and Environment, Dezhou University, Dezhou 253023, China
*
Author to whom correspondence should be addressed.
Forests 2026, 17(8), 882; https://doi.org/10.3390/f17080882
Submission received: 30 May 2026 / Revised: 22 July 2026 / Accepted: 27 July 2026 / Published: 28 July 2026
(This article belongs to the Section Forest Soil)

Abstract

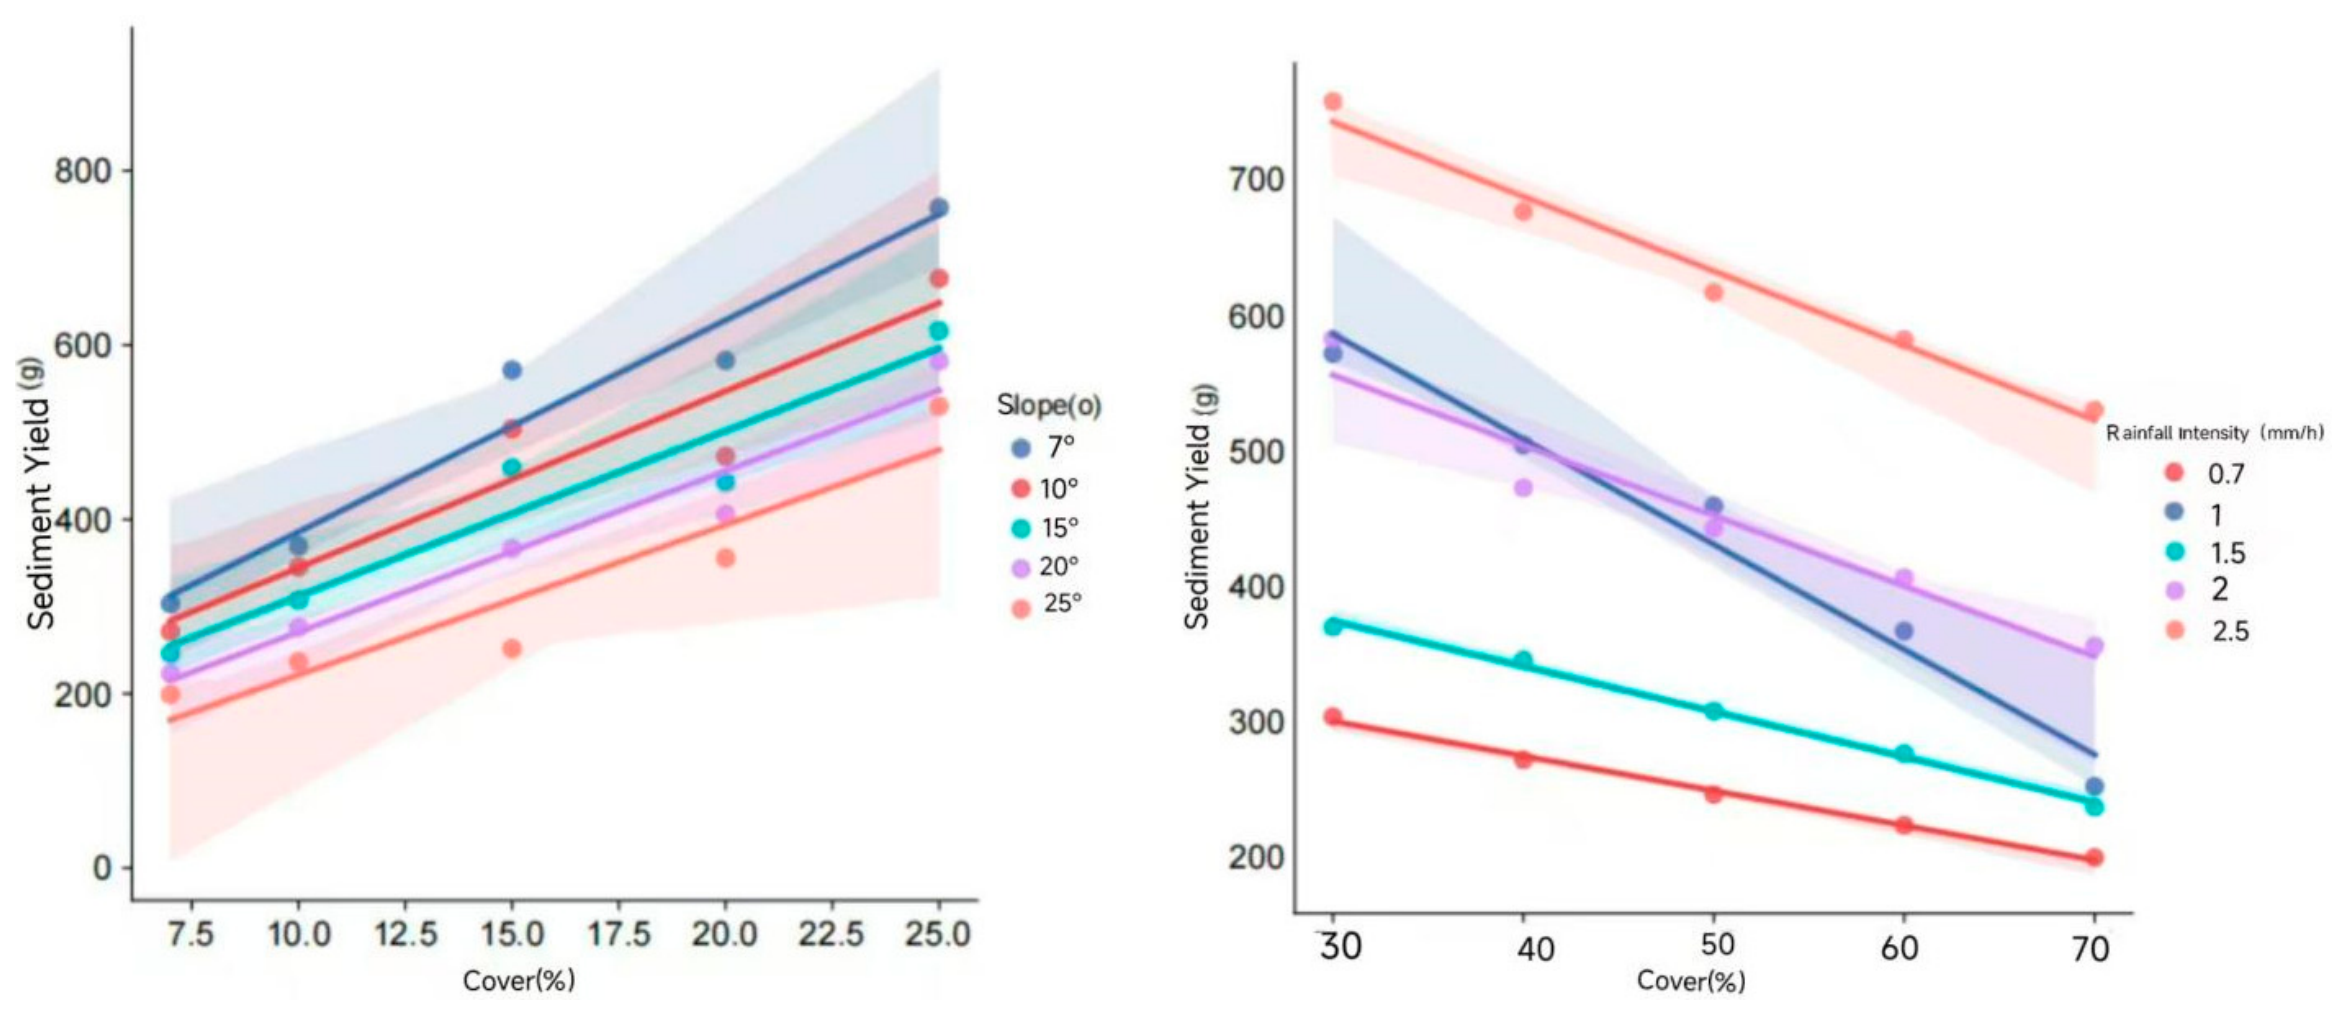
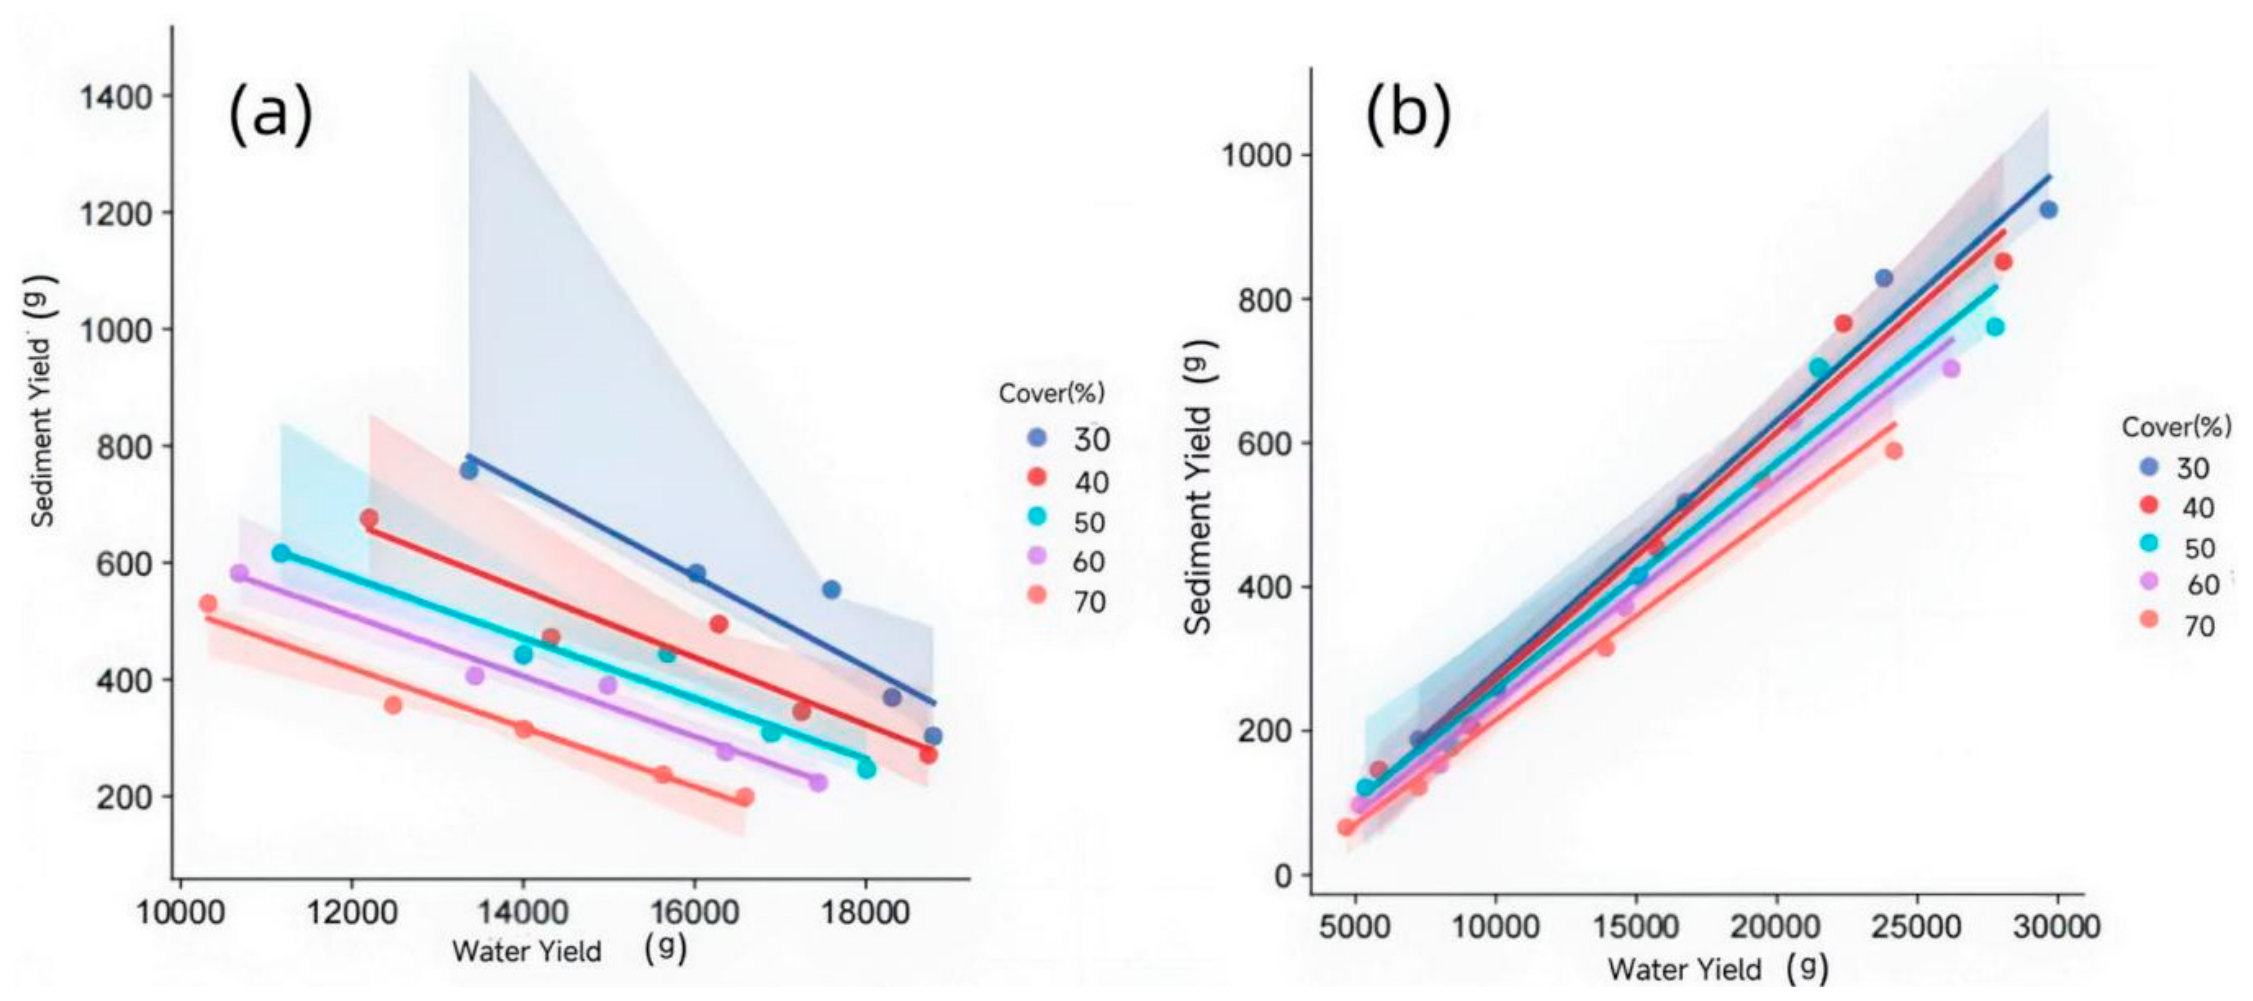
Effective characterization of water and their relationship is the current focus and difficulty of grassland soil and water loss research. This investigation utilized simulated rainfall to conduct experiments. The findings revealed the following: ① The sediment yield of grassland under different slopes decreases linearly with the increase in water yield. The sediment yield of grassland under different rainfall intensities increases linearly with the increase in water yield. The decrease is more obvious between 30% and 40%, and 60% and 70%, coverage. ② This phenomenon may be attributed to the stronger correlation between plant biomass and sediment yield compared to that between plant biomass and water yield. The efficacy of vegetation coverage in characterizing grassland sediment yield surpasses its ability to depict water yield. ③ The variability of is more obvious than that of, and the relationship between and has cyclical characteristics. ④ This study uses volume and root dry weight to establish an empirical equation for the relationship between sediment yield and water yield. Later studies should supplement field experiments and determine the main controlling factors and the conduction paths between factors. The research will provide technical guidance for grassland water and soil resource management and soil erosion model optimization.

1. Introduction

Grass coverage is a very important index of grassland soil erosion [1,2,3]. Scholars have studied many equations of runoff, erosion and grass coverage. Most of the equations are linear equations and power equations [4,5,6,7,8,9]. The soil and water loss of grassland is mainly affected by the characteristics of grass and soil. The indexes of grass coverage, grass root volume, soil bulk density and soil micro-aggregates can be used to describe the soil and water loss of grassland [10,11,12,13,14,15,16]. However, the current research has never considered the difference in coverage in the characterization of runoff and erosion. At present, the problem of grassland soil erosion is a multi-dimensional problem, and the difference mechanism of supplementary coverage in the characterization of soil erosion will help to improve the depth of research.
The interaction between runoff and erosion plays a critical role in shaping local landscapes by influencing confluence and accelerated erosion. The correlation between grassland runoff and erosion is intricately linked to local confluence and accelerated erosion [17,18]. Previous research has not prioritized the runoff–erosion relationship as a primary indicator, leading to challenges in the early detection of grassland soil erosion [3,19,20,21,22]. Currently, scholarly research predominantly focuses on runoff and sediment yield, with limited studies quantitatively examining their relationship. The ratio of water yield to sediment yield (WS) is a composite indicator of water yield and sediment yield, and is an index that can directly reflect the synergy of water yield and sediment yield. Current research only focuses on a single indicator of water yield and sediment yield, but the actual application scenario requires judgment of the synergy of water yield and sediment yield to deal with early judgments of soil and water loss on slopes. Therefore, this study introduces the indicator of WS to supplement the theory of early water and soil loss judgment on slopes and deepen the research on water and soil loss. These findings contribute to a deeper understanding of soil and water loss and support improved management of water and soil resources in such environments. The objectives of this study are as follows: (1) to conduct a comparative analysis of differences in water and sediment yields from grasslands; (2) to clarify the patterns and underlying mechanisms of sediment yield changes in response to variations in water yield from grasslands; and (3) to elucidate the patterns and mechanisms governing the relationship between water and sediment yields, specifically the water-to-sediment yield ratio, in grassland ecosystems.

2. Research Methods

The study was conducted at the Artificial Simulation Hall, using loessial soil from the loess hilly and gully region. Poa annua L. was chosen as the experimental grass species, and strip planting was implemented. The experimental design included slopes of 7°, 10°, 15°, 20°, and 25°, rainfall intensities of 0.7, 1.0, 1.5, 2.0, and 2.5 mm/min, and grass coverage levels of 30%, 40%, 50%, 60%, and 70%. Each experimental design was replicated twice to ensure reliability and consistency of the results. The setup comprised runoff plots and simulated rainfall equipment utilizing a side spray method. The nozzles were positioned at a height of 14.5 m, with a raindrop spray height of 1.5 m and a total rainfall height of 16 m, ensuring all raindrops reached terminal velocity. Prior to testing, a bare soil plot was prepared with a 5 cm layer of fine sand at the base covered by permeable gauze to mimic natural slope conditions. A layered filling approach was employed to ensure soil uniformity.
Each layer, stratified by design bulk density, was filled to a depth of 5 cm to minimize variability in underlying surface soil conditions. Compaction during soil filling mitigates the impact of sidewalls on infiltration, runoff, sediment processes, and micro-morphological development of slope erosion. Subsequently, the filled surface is leveled, and grass is planted to establish a grassland plot. The grass is then carefully managed and protected until stable vegetation growth is achieved, at which point rainfall testing is conducted.
Excel is utilized for mapping and data analysis, with primary methods including time series and correlation analyses. To determine the impact or significance of each independent variable on the dependent variable, the coefficient of determination in multiple regression analysis must be computed. The coefficient of determination, denoted as R2, signifies the proportion of variance in the dependent variable that is accounted for by the independent variables under consideration. The formula for calculating the contribution of grassland characteristics to grassland water yield, sediment yield, and water–sediment ratio is as follows:
P i = R 2 i = 1 n β i 2 β i 2 × 100 %
In Formula (1): Pi It is the contribution rate of the ith factor; R2 is the square of complex regression; β i = b i σ x i σ y . Among them, bi is the regression coefficient of the ith factor. σxi is the mean square error of the ith factor, and σy is the mean square error of the dependent variable.

3. Study on Water Yield Characteristics of Grassland with Different Coverage

3.1. Response Characteristics of Water Yield of Grassland with Different Coverage to Coverage

Figure 1 illustrates a decrease in water yield from grassland as coverage increases across varying slopes and rainfall intensities. Water yield varied between 10,322 g to 18,786 g and 497 g to 29,668 g, with significant reductions observed at coverage levels of 30%–40% and 60%–70%, resulting in decreases of 1058 g and 775 g, and 1287 g and 1012 g, respectively. Empirical equations in Table 1 depict the relationship between water yield and grass coverage under different slope or rainfall intensities. The data in Table 1 indicate a strong and statistically significant correlation, described by a power equation. The coefficients of determination range from 0.868 to 0.992 and 0.898 to 0.994, respectively. The results of the study are similar to those of previous studies [6,12].

3.2. Correlation Analysis Between Water Yield and Grassland Characteristics of Different Coverage Grasslands

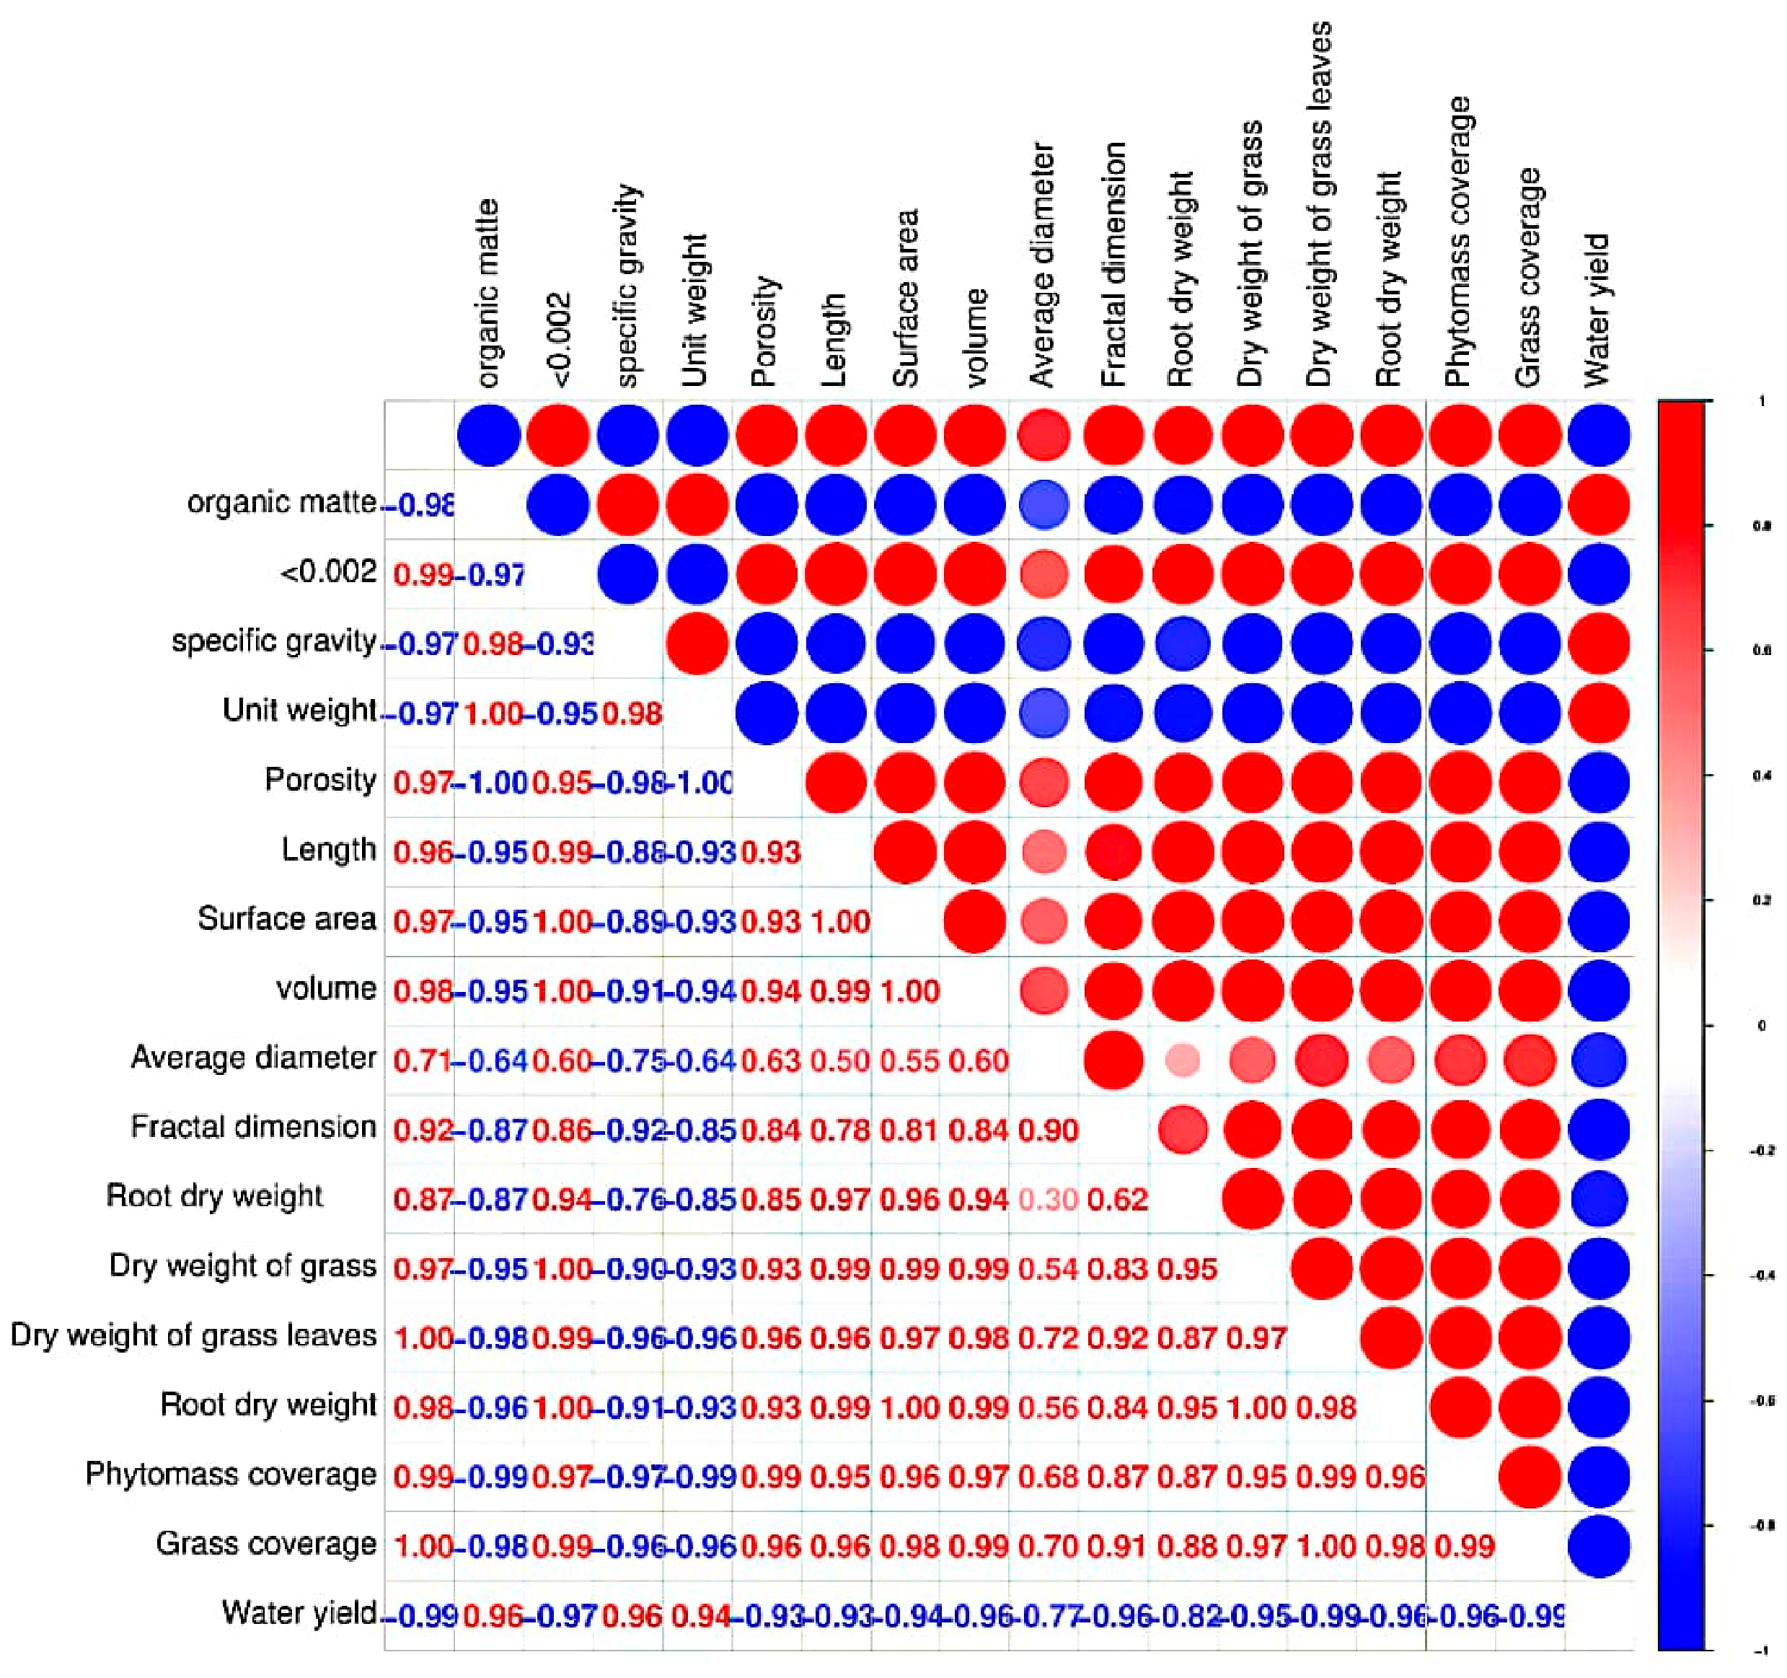
Figure 2 displays the correlation analysis outcomes of grassland water yield concerning various grassland characteristics. The results in Figure 2 reveal that across different slopes and rainfall intensities, the correlation between water yield and the specific gravity, as well as the dry weight of grass leaves, is notably strong. Specifically, the correlation coefficients are 0.966 and 0.994, 0.957 and 0.993, or 0.963 and 0.993, respectively. These findings suggest that the specific gravity and dry weight of grass leaves exhibit the most significant association with water yield in grasslands with varying coverage.
The change in grassland water yield with specific gravity and leaf dry weight under different slope, rainfall intensity, or slope and rainfall intensity can be described by a binary linear equation. The determination coefficients are 0.959, 0.955 and 0.957, and the response equation is (2)–(4).
W = −77799.2 + 34121.72P + 1580.934L    R2 = 0.959
W = −70180.2 + 31061.54P + 2374.883L    R2 = 0.955
W = −77074.2 + 33802.97P + 1866.842L    R2 = 0.957
In the formula: W is the water yield, g; p is specific gravity, g/cm3; and l is the dry weight of grass leaves, g. Calculated by the contribution rate Formula (1), the contribution rates of specific gravity and grass leaf dry weight to the change in grassland water yield under different slope, rainfall intensity, or slope and rainfall intensity were 0.44% and 95.43%, 0.16% and 95.35% or 46.13% and 49.53%, respectively.

4. Study on the Characteristics of Sediment Yield of Grassland with Different Coverage

4.1. Response Characteristics of Sediment Yield to Slope and Rainfall Intensity in Different Coverage Grasslands

Figure 3 illustrates a decrease in grassland sediment yield with increasing coverage across varying slopes and rainfall intensities. Sediment yield ranged from 199 g to 758 g and 97 g to 924 g, with coverage levels of 30%–40% and 60%–70%. The reduction was substantial, with decreases of 61 g and 48 g, or 59 g and 64 g, respectively. Table 2 presents the empirical equation depicting the relationship between sediment yield and grass coverage under different slope gradients or rainfall intensities. The data in Table 2 indicate that the relationship between grassland sediment yield and grass coverage under different slope gradients or rainfall intensities can be effectively modeled by a power equation. The correlation is strong and statistically significant, with determination coefficients ranging from 0.938 to 0.995, or 0.940 to 0.987. The results of the study are similar to those of previous studies [13,14].

4.2. Correlation Analysis Between Sediment Yield and Grassland Characteristics in Different Coverage Grasslands

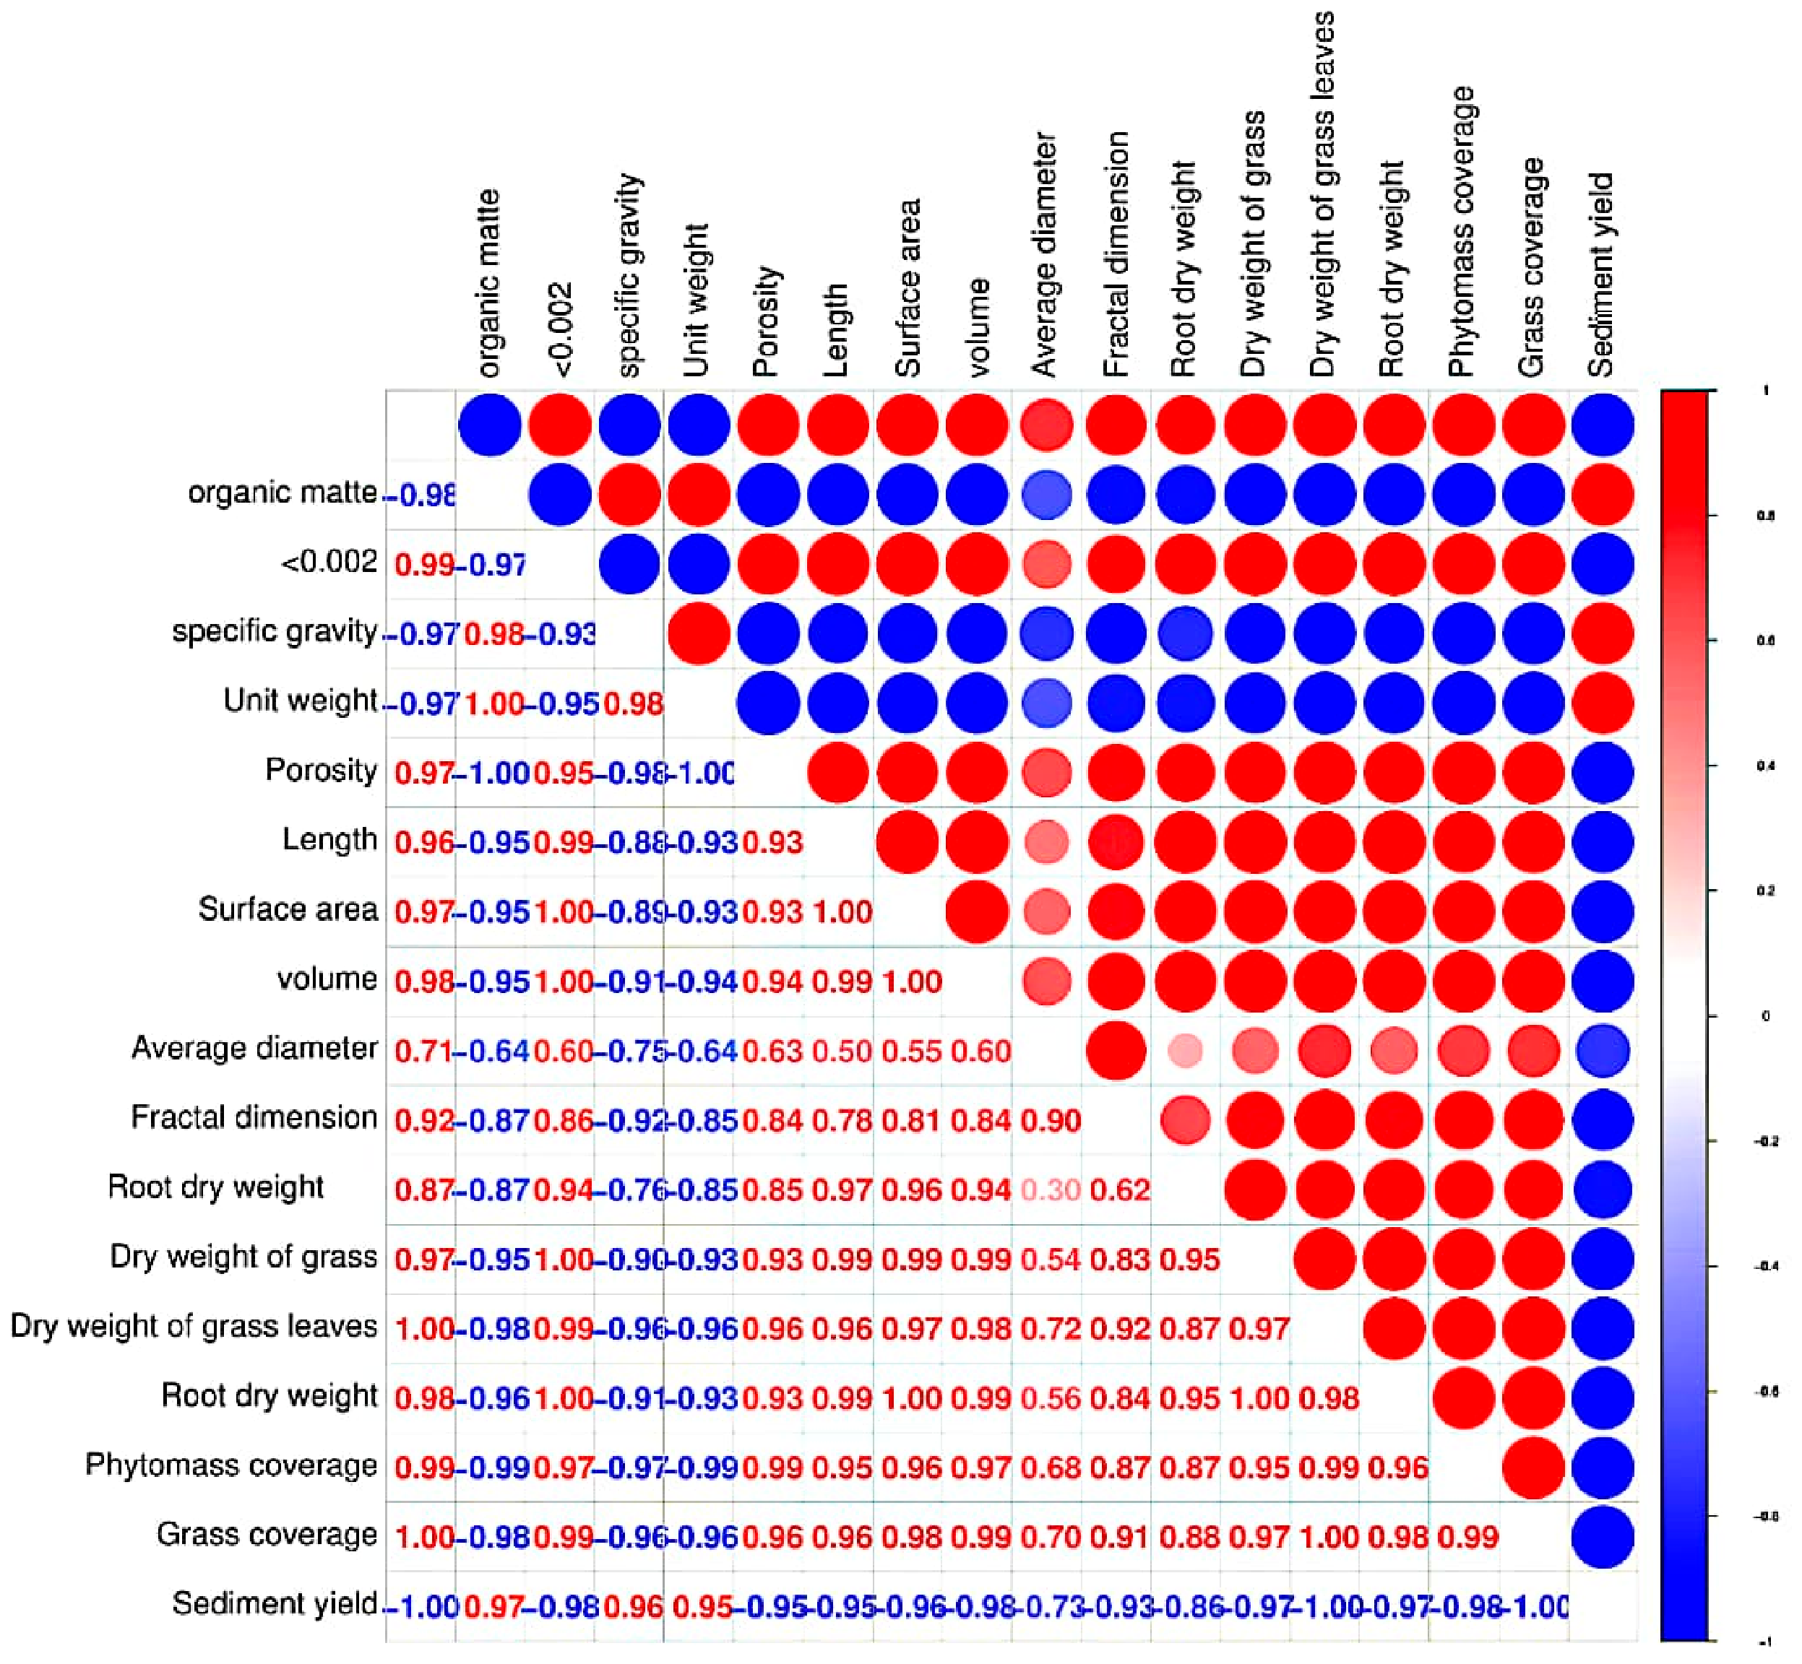
Figure 4 displays the correlation analysis results between sediment yield and grassland characteristics across varying coverage levels. The analysis reveals that specific gravity and root dry weight exhibit the strongest correlation with sediment yield in grasslands subjected to different slope gradients, rainfall intensities, or a combination of both. Specifically, the correlation coefficients for specific gravity and sediment yield were 0.968 and 0.960, for root dry weight and sediment yield were 0.979 and 0.999, and for the combined effect of slope and rainfall intensity were 0.961 and 0.999, respectively. These findings underscore the close relationship between specific gravity, root dry weight, and sediment yield in grassland ecosystems. Further correlation analysis between sediment yield and grassland characteristics in areas with varying coverage demonstrated that the fluctuations in sediment yield concerning specific gravity and root dry weight across different slope gradients could be accurately described by a binary power equation, yielding a determination coefficient of 0.996 and response equations denoted as Equations (5)–(7). Moreover, the variations in sediment yield associated with specific gravity and root dry weight under different rainfall intensities or combinations of slope gradients and rainfall intensities were effectively captured by a binary exponential equation. The determination coefficients for these equations were 0.992 and 0.959, respectively, with a significance level of 0.01, and the corresponding response equations were denoted as Equations (6) and (7).
S = 3202285 × P−8.006 × D−0.313    R2 = 0.992
S = 435.8383 × e0.0008L−0.0086V    R2 = 0.996
S = 4507062 × e−3.04612P−0.04322L    R2 = 0.999
In the formula: S is sediment yield, g; p is specific gravity, (g/cm3); l is the dry weight of grass leaves, g; v is the volume, cm3; and d is root dry weight, g. Combined with the calculation formula of contribution rate (1), the contribution rates of specific gravity and root dry weight to the change in grassland sediment yield under different slope, rainfall intensity, or slope and rainfall intensity were 0.03% and 99.14%, 5.19% and 94.36% or 4.70% and 95.18%, respectively.

5. Study on the Variation in Sediment Yield with Water Yield in Different Coverage Grasslands

Under varying canopy covers, the sediment yield of grasslands on slopes decreases with increasing runoff. In contrast, under different rainfall intensities, sediment yield increases as runoff rises. The sediment yield decreased by 559 g or 827 g within the respective runoff ranges of 10,322 g–18,786 g and 4670 g–29,668 g (Figure 5). Table 3 presents the empirical equation depicting the relationship between sediment yield and water yield across different slope gradients. The linear equations in Table 3 effectively describe the variations in sediment yield with water yield under different slope gradients and rainfall intensities for grassland under various coverage levels. The correlation is robust and statistically significant, with coefficients of determination ranging from 0.885 to 0.971 or 0.977 to 0.985.

6. The Variation Characteristics and Mechanisms of the Relationship Between Sediment Yield with Water Yield on the Grassland

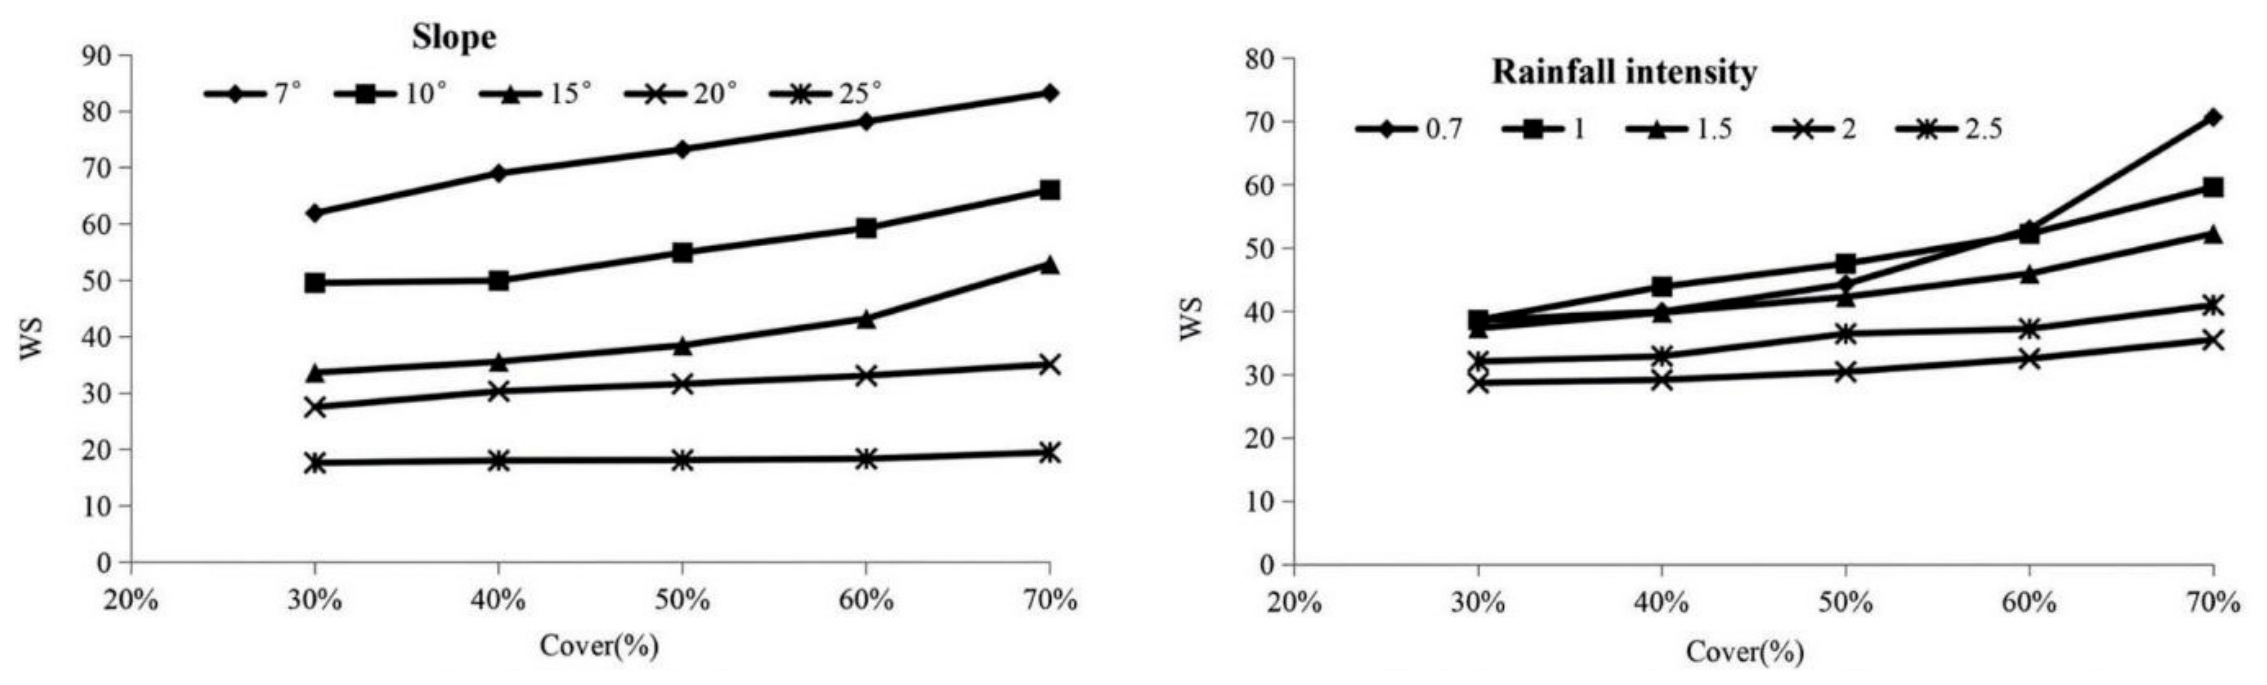
Figure 6 illustrates a positive correlation between WS and coverage across varying slope gradients and rainfall intensities. The WS values range between 18 g and 83 g or 29 g and 71 g, with more pronounced increases observed at coverage levels of 30%–40% and 60%–70%. Table 4 presents an empirical equation depicting the relationship between WS and grass coverage under different slope gradients or rainfall intensities. The data suggest a strong and statistically significant correlation, with coefficients of determination ranging from 0.993 to 0.996 or 0.910 to 0.992.
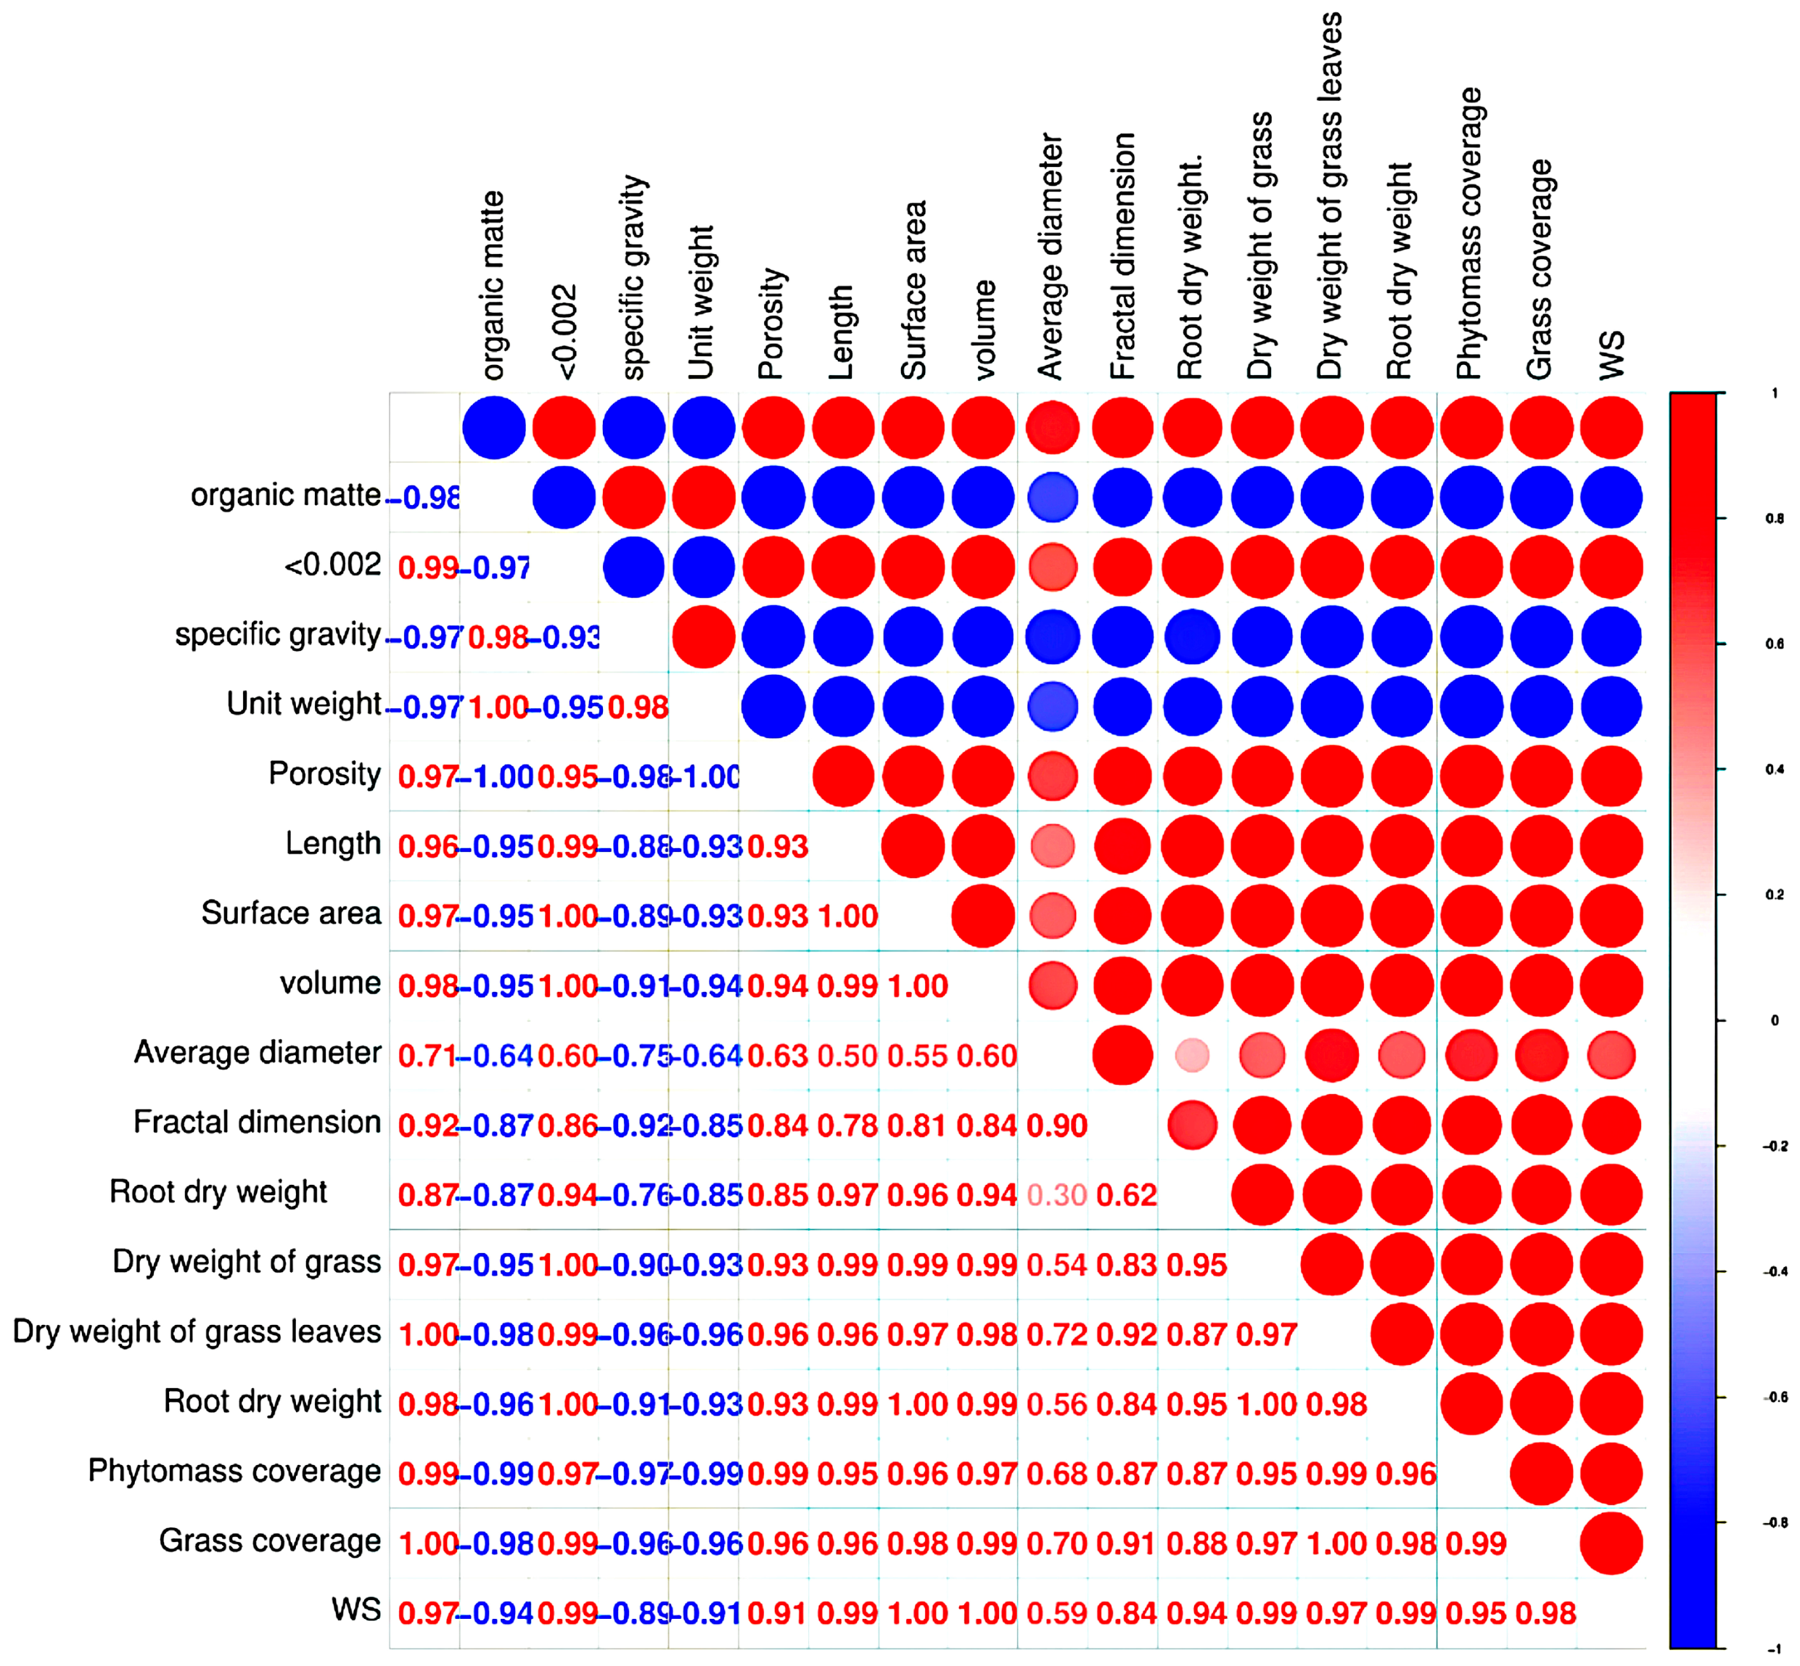
Figure 7 presents the correlation analysis results of grassland characteristics across varying slopes, rainfall intensities, and their combinations, along with different levels of coverage. The analysis revealed that the strongest correlations were observed between volume and root dry weight with the parameter WS, with correlation coefficients of 0.996 and 0.917, 0.997 and 0.947, and 0.998 and 0.942 for different slope conditions, rainfall intensities, and combined slope and rainfall intensities, respectively. This indicates a close relationship between volume, root dry weight, and WS across different coverage levels. Further correlation analysis between WS at different coverage levels and grassland characteristics indicated that the variations in WS concerning volume and root dry weight could be effectively modeled by a linear equation under diverse slope conditions, yielding a coefficient of determination of 0.994 (Equation (8)). Conversely, under varying rainfall intensities, slope gradients, and their combinations, the relationship between WS, root dry weight, and volume was best described by a power equation. The determination coefficients were 0.999 or 0.997, with a significance level of 0.01, and the corresponding response equations were represented by Equations (9) and (10).
WS = 36.6596 + 0.26211V + 0.05023D    R2 = 0.994
WS = 33.30627 × e0.0012D+0.0083V    R2 = 0.999
WS = 34.44639 × e0.0069V−0.0016D    R2 = 0.997
In the formula: WS is the relationship between water and sediment yield; v is the volume, cm3; and d is root dry weight, g. The contribution rate of root volume and root dry weight to the WS was 88.59% and 10.77%, 93.59% and 6.26% or 85.36% and 14.37%, respectively, under different slope gradients, rainfall intensities, or slope gradients and rainfall intensities.

7. Discussion

7.1. The Characterization of Water Yield, Sediment Yield of Grassland

The figure and table in the study illustrate the impact of grassland coverage on grassland water yield, sediment yield, and the correlation between the two. The findings indicate that grassland water yield surpasses the relationship between water yield and sediment yield, which in turn exceeds sediment yield. In specific soil and rainfall conditions, the soil infiltration rate governs the runoff process, leading to stability. Water yield is typically modeled using linear or power equations [23,24] with high coefficients of determination, aligning with previous research. Conversely, sediment yield is influenced by topography, soil characteristics, and vegetation [25,26], exhibiting greater variability and requiring power function representation due to its prolonged stability process and noticeable fluctuations [24]. Despite sediment yield’s higher variability dictating the water yield and sediment yield relationship, the combined effect of both variables mitigates this variability, enhancing the characterization of water and sediment yield compared to sediment yield alone.

7.2. The Obvious Lag and Variability of Sediment Yield Make the Relationship Between Water and Sediment Yield Cyclical with the Change in Coverage

Runoff contributes to erosion transport capacity, yet there is a time delay in the decomposition of soil structure by runoff, leading to a lag in sediment yield compared to runoff yield. Soil transport processes exhibit variability, with intermittent as well as sudden and substantial soil transport occurrences [27]. Certain soil types display regular decomposition patterns over time, resulting in cyclical relationships between runoff and sediment, as illustrated in Figure 2 of this study. The research indicates that early detection of soil erosion hinges on assessing sediment yield variability, which is influenced by grass roots. In this experiment, it was found that the key to the sediment yield–discharge relationship lies in the characterization of sediment variability, which is determined by grass roots. A power function of root volume and root dry weight can be used to characterize the sediment yield–discharge relationship.

7.3. For the Relationship Between Water and Sediment Yield in a Specific Area, Rainfall Characteristics and Terrain Complexity Should Be Considered

For specific regions, if rainfall is relatively stable and the topography is diverse, the relationship between runoff and sediment yield can be described using a polynomial of the runoff–sediment ratio. In contrast, in areas with relatively uniform topography and unstable, heavy rainfall, the relationship should be characterized by a power equation of the runoff–sediment ratio. These outcomes facilitate the classification and enhancement of soil and water loss management strategies [3]. From a mechanistic perspective, topography, rainfall intensity, and changes in vegetation cover influence the relationship between runoff generation and sediment yield. These patterns can be applied to the management of water and soil resources.

7.4. From the Characterization and Analysis of Grassland Water and Sediment Yield and Their Relationships to Soil and Water Loss Models and Water and Soil Resource Management

The optimal relationship between grassland water yield, sediment yield and their relationship and coverage was determined by fitting equations, and the changing rules of grassland water yield, sedimentation and their relationship were clarified. On this basis, we analyze the correlation between grassland water yield, sediment yield and their relationship with the two dominant factors of soil and grass cover, select the soil and grass cover indicators with the greatest correlation, explain the changes in grassland water yield, sediment yield, and their relationship, and finally reveal the grassland water yield, sediment yield, and their relationship. Under experimental conditions, soil and grass indicators have a high degree of explanation of grassland water and sediment yield and their relationships. Empirical equations can not only be used for reference or optimization in model establishment [28], but also can be used to guide grassland water and soil resource management under different underlying surfaces or climate conditions [29]. However, current research has not yet clarified the main controlling factors and transmission paths between grassland water and sediment yield and their relationships, so the research conclusions remain superficial. Moreover, this study is suitable for indoor controlled test conditions, and field tests should be supplemented later.

8. Conclusions

(1)
Under different slopes or rain intensities, the water yield and sediment yield of grassland decrease with the increase in coverage, and both can be described by power functions; under different covers, the sediment yield of grassland with different slopes decreases with the increase in water yield, while the grassland sediment yield with different rainfall intensities increases with the increase in water yield, which can be described by linear equations. Under different slopes or rainfall intensity, the ratio of grassland water yield to sediment yield (WS) increases with the increase in coverage, which can be described by polynomial equations.
(2)
The contribution rates of specific gravity and dry weight of grass blades to changes in grassland water yield under different slopes, rain intensities, or gradients and rainfall intensities are 0.44% and 95.43%, 0.16% and 95.35%, or 46.13% and 49.53% respectively; regarding the contribution of specific gravity and root dry weight to grassland sediment yields, the rates were 0.03% and 99.14%, 5.19% and 94.36%, or 4.70% and 95.18% respectively. The contribution rates of root volume and root dry weight to changes in the water and sediment yield ratio (WS) of grassland slopes were 88.59% and 10.77%, 93.59% and 6.26%, or 85.36% and 14.37%, respectively.

Author Contributions

Data analysis, chart production, and paper writing were done by D.W., and revisions were done by other authors (X.S., R.Y., G.L. and D.W.). All authors have read and agreed to the published version of the manuscript.

Funding

The National Key Research and Development Program of China (2017YFC0505404); Guangdong Provincial Science and Technology Project (2018B030324001); Key-Area Research and Development Program of Guangdong Province (2019B110205003); Guangzhou Science and Technology Plan Project (202002020026); School-level research projects (30101451; 30101937; 320114; SYJS18009; SYJS18015; ZZYQ20004).

Data Availability Statement

The raw data supporting the conclusions of this article will be made available by the authors on request.

Acknowledgments

During the preparation of this manuscript/study, the author(s) used Spss13 and Excel2010 for the purposes of data analysis and charting. The authors have reviewed and edited the output and take full responsibility for the content of this publication.

Conflicts of Interest

This manuscript has not been published or presented elsewhere in part or in entirety and is not under consideration by another journal. We have read and understood your journal’s policies, and we believe that neither the manuscript nor the study violates any of these. There are no conflicts of interest to declare.

References

  1. Cheng, Y.; Yu, X.; Li, Z.; Li, S.; Cheng, S.; Wang, K.; Xu, X. Quantitatively Distinguishing the Factors Driving Runoff and Sediment Yield Variations in Karst Watersheds. Water Resour. Res. 2024, 60, e2024WR037089. [Google Scholar] [CrossRef]
  2. Chen, Y.; Vanmaercke, M.; Jiao, J.; Bai, L.; Tang, B.; Wang, N.; Zhang, Y.; Wang, H. Quantifying the importance of different erosion processes and soil and water conservation measure collapses following an extreme rainstorm in the Chinese Loess Plateau. Land Degrad. Dev. 2022, 34, 403–422. [Google Scholar] [CrossRef]
  3. Kong, D.; Miao, C.; Gou, J.; Zhang, Q.; Su, T. Sediment reduction in the middle Yellow River basin over the past six decades: Attribution, sustainability, and implications. Sci. Total Environ. 2023, 882, 163475. [Google Scholar] [CrossRef] [PubMed]
  4. Araújo Filho, R.S.; de Araújo, J.C.; de Mendonça, A.S.; de Andrade, E.M.; de Souza, M.B.; de Morais, R.M. Influence of vegetation cover and rainfall intensity on soil attributes in an area undergoing desertification in Brazil. Soil Tillage Res. 2019, 194, 104382. [Google Scholar]
  5. da Silva, S.F.; dos Santos Araújo, D.C.; de Souza Viana, J.F.; Fontes, A.S.; Medeiros, Y.D.P.; Montenegro, S.M.G.L. Analysis of the correlation between land use and surface runoff in a Brazilian savanna basin. J. S. Am. Earth Sci. 2024, 133, 104724. [Google Scholar] [CrossRef]
  6. Li, J.; Wu, L.; Chen, L.; Zhang, J.; Shi, Z.; Ling, H.; Cheng, C.; Wu, H.; Butler, A.D.; Zhang, Q.; et al. Effects of slopes, rainfall intensity and grass cover on runoff loss of mercury from floodplain soil in Oak Ridge TN: A laboratory pilot study. Geoderma 2024, 441, 116750. [Google Scholar] [CrossRef]
  7. Chen, M.; Yang, X.; Zhang, X.; Bai, Y.; Shao, M.; Wei, X.; Jia, Y.; Wang, Y.; Jia, X.; Zhu, Y. Response of soil water to long-term revegetation, topography, and precipitation on the Chinese Loess Plateau. Catena 2024, 236, 107711. [Google Scholar] [CrossRef]
  8. Tao, S.; Peng, W.; Xiang, J. Spatiotemporal variations and driving mechanisms of vegetation coverage in the Wumeng Mountainous Area, China. Ecol. Inform. 2022, 70, 101737. [Google Scholar] [CrossRef]
  9. Jia, X.; Bai, X.; Liu, C.; Zhao, C.; Shao, M.; Pan, Y. Differences in plant water use between check-dam land and slope land on the Loess Plateau: Significance for vegetation restoration. Agric. Ecosyst. Environ. 2024, 362, 108849. [Google Scholar] [CrossRef]
  10. Li, H.; Chen, J.; Ling, M.; Chen, Z.; Lan, Y.; Huang, Q.; Li, X.; You, H.; Wang, F.; Han, X.; et al. A framework for dynamic assessment of soil erosion and detection of driving factors in alpine grassland ecosystems using the RUSLE-InVEST (SDR) model and Geodetector: A case study of the source region of the Yellow River. Ecol. Inform. 2025, 85, 102928. [Google Scholar] [CrossRef]
  11. Kühnhammer, K.; van Haren, J.; Kübert, A.; Bailey, K.; Dubbert, M.; Hu, J.; Ladd, S.N.; Meredith, L.K.; Werner, C.; Beyer, M. Deep roots mitigate drought impacts on tropical trees despite limited quantitative contribution to transpiration. Sci. Total Environ. 2023, 893, 164763. [Google Scholar] [CrossRef] [PubMed]
  12. Liu, Y.F.; Dunkerley, D.; López-Vicente, M.; Shi, Z.H.; Wu, G.L. Trade-off between surface runoff and soil erosion during the implementation of ecological restoration programs in semiarid regions: A meta-analysis. Sci. Total Environ. 2020, 712, 136477. [Google Scholar] [CrossRef] [PubMed]
  13. Liu, Y.F.; Liu, Y.; Shi, Z.H.; López-Vicente, M.; Wu, G.L. Effectiveness of re-vegetated forest and grassland on soil erosion control in the semi-arid Loess Plateau. Catena 2020, 195, 104787. [Google Scholar] [CrossRef]
  14. Shi, P.; Li, P.; Li, Z.; Sun, J.; Wang, D.; Min, Z. Effects of grass vegetation coverage and position on runoff and sediment yields on the slope of Loess Plateau, China. Agric. Water Manag. 2022, 259, 107231. [Google Scholar] [CrossRef]
  15. Fu, Y.; Wang, D.; Sun, W.; Guo, M. Impacts of grass planting density and components on overland flow hydraulics and soil loss. Land Degrad. Dev. 2023, 34, 234–249. [Google Scholar]
  16. Zhang, Q.; Fan, J.; Zhao, X. Effect of shrubland-to-grassland conversion on soil water storage and infiltration capacity in Loess Plateau region of China. Catena 2025, 249, 108720. [Google Scholar] [CrossRef]
  17. Lin, X.; Zhang, S.; Zhao, X. Global thresholds for the climate-driven effects of vegetation restoration on runoff and soil erosion. J. Hydrol. 2025, 647, 132374. [Google Scholar] [CrossRef]
  18. Zhang, X.; Song, J.; Wang, Y.; Peng, J.; Zhang, X.; Li, S.; Qu, J. Threshold effects of vegetation coverage on runoff and soil loss in the Loess Plateau of China: A meta-analysis. Geoderma 2022, 412, 115720. [Google Scholar] [CrossRef]
  19. Liu, M.; Wang, Q.; Guo, L.; Yi, J.; Lin, H.; Zhu, Q.; Fan, B.; Zhang, H. Influence of canopy and topographic position on soil moisture response to rainfall in a hilly catchment of Three Gorges Reservoir Area, China. J. Geogr. Sci. 2020, 30, 949–968. [Google Scholar] [CrossRef]
  20. Borrelli, P.; Robinson, D.A.; Fleischer, L.; Lugato, E.; Ballabio, C.; Alewell, C.; Meusburger, K.; Modugno, S.; Schütt, B.; Ferro, V.; et al. Land use and climate change impacts on global soil erosion by water (2015–2070). Proc. Natl. Acad. Sci. USA 2020, 117, 21994–22001. [Google Scholar] [CrossRef] [PubMed]
  21. Ke, Q.; Zhang, K. Interaction effects of rainfall and soil factors on runoff, erosion, and their predictions in different geographic regions. J. Hydrol. 2022, 605, 127291. [Google Scholar] [CrossRef]
  22. Zhang, X.; Zhang, S.; Zhang, F.; Li, H.; Shi, J.; Chen, J. Quantifying the effects of the soil erosion factors on water-eroded slopes. Catena 2025, 249, 108678. [Google Scholar] [CrossRef]
  23. Hou, J.; Lu, Y.; Li, Z.; Zhu, H. Effects of different functional structure parameters of plant communities on slope runoff in different periods of the year in semiarid grasslands. Sci. Total Environ. 2020, 713, 136705. [Google Scholar] [CrossRef] [PubMed]
  24. Wang, C.; Fu, X.; Zhang, X.; Wang, X.; Zhang, G.; Gong, Z. Modeling soil erosion dynamic processes along hillslopes with vegetation impact across different land uses on the Loess Plateau of China. Catena 2024, 243, 108202. [Google Scholar] [CrossRef]
  25. Yang, Z.; Li, Q.; Liu, W.; Gao, Y.; Wang, L.; Liu, X.; Zhang, S. Effects of Different Hedgerow Patterns on the Soil Physicochemical Properties, Erodibility, and Fractal Characteristics of Slope Farmland in the Miyun Reservoir Area. Plants 2022, 11, 2537. [Google Scholar] [CrossRef] [PubMed]
  26. Liao, J.; Yang, X.; Dou, Y.; Wang, B.; Xue, Z.; Sun, H.; Yang, Y.; An, S. Divergent contribution of particulate and mineral-associated organic matter to soil carbon in grassland. J. Environ. Manag. 2023, 344, 118536. [Google Scholar] [CrossRef]
  27. Zhang, Q.; Wang, Z.; Guo, Q.; Tian, N.; Shen, N.; Wu, B.; Liu, J.E. Plot-based experimental study of raindrop detachment, interrill wash and erosion-limiting degree on a clayey loessal soil. J. Hydrol. 2019, 575, 1280–1287. [Google Scholar] [CrossRef]
  28. Wei, H.; Nearing, M.A.; Stone, J.J.; Guertin, D.P.; Spaeth, K.E.; Pierson, F.B.; Nichols, M.H.; Moffett, C.A. A New Splash and Sheet Erosion Equation for Rangelands. Soil Sci. Soc. Am. 2009, 73, 1386–1392. [Google Scholar] [CrossRef]
  29. Wang, D.; Yuan, Z.; Cai, Y.; Jing, D.; Liu, F.; Tang, Y.; Song, N.; Li, Y.; Zhao, C.; Fu, X. Characterisation of soil erosion and overland flow on vegetation-growing slopes in fragile ecological regions: A review. J. Environ. Manag. 2021, 285, 112165. [Google Scholar] [CrossRef]
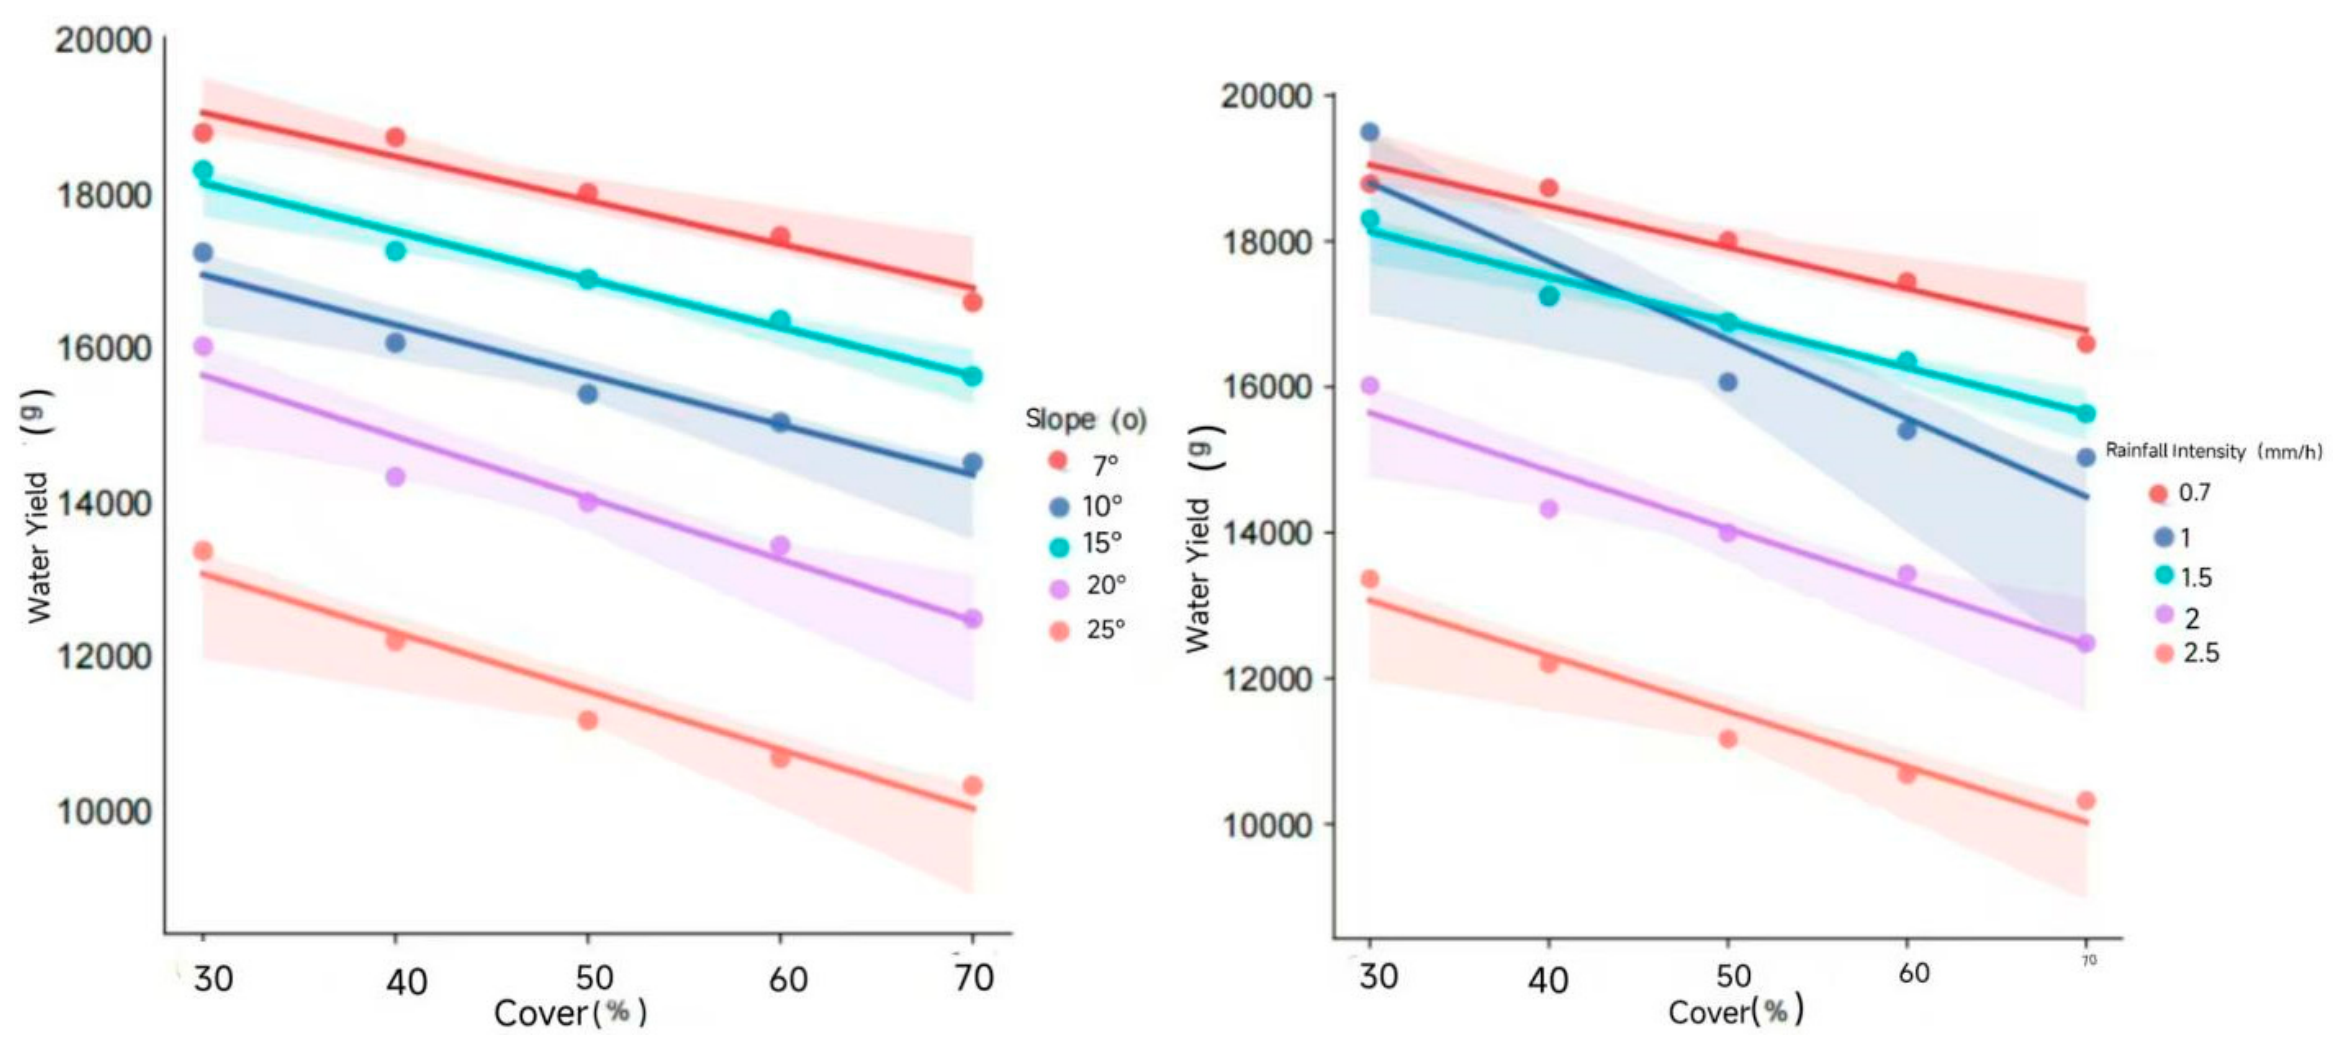
Figure 1. Variations in water yield of grassland with cover under different slopes or rainfall intensities.
Forests 17 00882 g001
Figure 2. The correlation analysis results of grassland water yield with different coverage on grassland characteristics.
Forests 17 00882 g002
Figure 3. Variations in sediment yield of grassland with cover under different slopes or rainfall intensities.
Forests 17 00882 g003
Figure 4. The correlation analysis results of grassland sediment yield with different coverage on grassland characteristics.
Forests 17 00882 g004
Figure 5. The variations in sediment yield with water yield at different slopes (a) or different rainfall intensities (b) under different covers.
Forests 17 00882 g005
Figure 6. Variations in the WS with cover under different slopes or rainfall intensities.
Forests 17 00882 g006
Figure 7. The correlation analysis results of WS with different coverage on grassland characteristics.
Forests 17 00882 g007
Table 1. The empirical equations for the relationships between water yield and cover under different slopes or rainfall intensities.
Slope (°)Empirical EquationCoefficient of DeterminationRainfall Intensity (mm/min)Empirical EquationCoefficient of Determination
7W = 16077C−0.1450.8680.7 W = 3908.7C−0.480.957
10W = 14836C−0.1740.9771.0 W = 6495.5C−0.360.987
15W = 12997C−0.2540.9821.5 W = 12997C−0.210.994
20W = 11499C−0.2680.9592.0 W = 18133C−0.230.988
25W = 9134.4C−0.3120.9922.5 W = 23052C−0.220.898
Note: W is water yield (g), C is cover (%).
Table 2. The empirical equations of the relationships between sediment yield and cover under different slopes or rainfall intensities.
Slope (°)Empirical EquationCoefficient of DeterminationRainfall Intensity (mm/min)Empirical EquationCoefficient of Determination
7S = 171C−0.480.9850.7 S = 49C−1.160.963
10S = 207C−0.510.9361.0 S = 94C−0.860.987
15S = 271C−0.630.9381.5 S = 270C−0.560.968
20S = 299C−0.540.9772.0 S = 486C−0.470.940
25S = 464C−0.410.9952.5 S = 521C−0.510.940
Note: S is sediment yield (g), and C is cover (%).
Table 3. The empirical equations of the relationship between sediment yield and water yield under different covers.
Coverage (%)Empirical EquationCoefficient of DeterminationEmpirical EquationCoefficient of Determination
At Different SlopesAt Different Rainfall Intensities
30S = −0.077W + 18170.885S = 0.03W − 680.985
40S = −0.057W + 13590.895S = 0.034W − 720.980
50S = −0.051W + 11970.939S = 0.031W − 530.980
60S = −0.051W + 11260.971S = 0.031W − 720.978
70S = −0.050W + 10260.965S = 0.02W − 740.977
Note: S is sediment yield (g), and W is water yield (g).
Table 4. The relationship between the WS and cover under different slopes or rainfall intensities.
Sope (°)Empirical EquationCoefficient of DeterminationRainfall Intensity (mm·min−1)Empirical EquationCoefficient of Determination
7WS = −23C2 + 75C + 410.9960.7WS = 22 × 101.49C0.910
10WS = 86C2 − 44C + 540.9931.0WS = 28 × 101.04C0.992
15WS = 123C2 − 77C + 460.9931.5WS = 28 × 100.81C0.971
20WS = −10C2 + 28C + 200.9862.0WS = 23 × 100.53C0.938
25WS = 11C2 − 7C + 18.90.9272.5WS = 26 × 100.61C0.959
Note: WS is the ratio of the water yield to sediment yield, and C is cover (%).
Disclaimer/Publisher’s Note: The statements, opinions and data contained in all publications are solely those of the individual author(s) and contributor(s) and not of MDPI and/or the editor(s). MDPI and/or the editor(s) disclaim responsibility for any injury to people or property resulting from any ideas, methods, instructions or products referred to in the content.