Review

Research Progress and Hotspot Evolution in Remote Sensing Monitoring of Mangrove Forests: A CiteSpace-Based Analysis

1
University Library, Guangdong Ocean University, Zhanjiang 524088, China
2
College of Electronic and Information Engineering, Guangdong Ocean University, Zhanjiang 524088, China
3
Guangdong Engineering Technology Research Center for Ocean Remote Sensing and Information Technology, Zhanjiang 524088, China
*
Author to whom correspondence should be addressed.
Forests 2026, 17(8), 879; https://doi.org/10.3390/f17080879
Submission received: 1 July 2026 / Revised: 23 July 2026 / Accepted: 26 July 2026 / Published: 28 July 2026
(This article belongs to the Section Forest Inventory, Modeling and Remote Sensing)

Abstract

Under the combined impacts of climate change and intensified human activities in coastal zones, mangrove ecosystems are increasingly exposed to degradation, fragmentation, and declines in ecological functions. It is therefore important to systematically examine the progress and evolution of the research hotspots in remote sensing monitoring of mangroves. In this study, 942 publications on mangrove remote sensing monitoring from 2000 to 2025 were retrieved from the China National Knowledge Infrastructure (CNKI) and the Web of Science Core Collection, comprising 485 CNKI records and 457 Web of Science records. CiteSpace 6.4.R2 was used to conduct bibliometric and knowledge-mapping analyses of publication trends, geographic distribution, author collaboration networks, keyword co-occurrence, keyword cluster timelines, and burst keywords. The results show that research on mangrove remote sensing monitoring generally increased over time, with marked growth after 2015. Research topics gradually shifted from early studies on mangrove distribution mapping, land-use change, and image classification to multi-source remote sensing applications, change detection, biomass estimation, blue carbon assessment, and machine learning- and deep learning-based methods. Author collaboration networks provide a descriptive overview of collaboration patterns and suggest that cross-team and cross-regional collaboration still needs to be strengthened. Keyword co-occurrence, cluster timeline, and burst keyword results indicate that remote sensing monitoring, machine learning, deep learning, random forest, support vector machine, object-based image analysis, ALOS PALSAR, ALOS-2 PALSAR-2, blue carbon, carbon stock, aboveground biomass, ecosystem services, and forest degradation are important themes in this field. Future research should further strengthen multi-source remote sensing data integration, cross-regional validation of intelligent algorithms, degradation monitoring indicator systems, uncertainty assessment, and long-term time-series analysis. These efforts will improve the accuracy, comparability, and management applicability of mangrove remote sensing monitoring and provide scientific support for coastal ecological conservation, mangrove restoration, and blue carbon governance.


1. Introduction

Mangroves are important woody plant communities distributed in the intertidal zones of tropical and subtropical coasts, and they represent typical coastal wetland ecosystems [1]. Owing to their unique habitat conditions and ecological structure, mangroves play essential roles in maintaining coastal ecological security, conserving biodiversity, protecting shorelines, accumulating carbon sinks, and sustaining fishery resources [2,3]. In recent years, under the combined impacts of global climate change, sea-level rise, increasing extreme weather events, and human activities such as aquaculture reclamation, urban expansion, and port construction, mangrove ecosystems in many regions have faced reductions in area, habitat fragmentation, degradation, and declines in ecological functions [4,5]. Therefore, accurately characterizing the spatial distribution, dynamic changes, and research trends of mangroves is of great significance for coastal ecological conservation, mangrove restoration, and blue carbon management [6,7,8].
Traditional mangrove monitoring mainly relies on field surveys. Although field investigations can provide accurate plot-level information, they are constrained by survey extent, time costs, and natural environmental conditions, making it difficult to meet the needs of large-scale and long-term dynamic monitoring [9]. With the development of remote sensing technology, multi-source remote sensing data, including Landsat, Sentinel, MODIS, high-resolution commercial satellite imagery, synthetic aperture radar (SAR), and unmanned aerial vehicle (UAV) imagery, have been widely applied to mangrove information extraction, distribution mapping, change detection, biomass estimation, and ecological quality assessment [10,11,12]. Meanwhile, methods such as random forests, support vector machines, object-based classification, and deep learning have increasingly been applied to mangrove monitoring, improving the efficiency and accuracy of mangrove identification and dynamic change analysis in complex coastal environments [13,14]. As a result, mangrove remote sensing research has gradually expanded from early studies focusing on area extraction and land-cover classification to more integrated topics, including multi-source data fusion, long-term change analysis, carbon stock assessment, and ecological function monitoring.
With the continuous increase in related publications, systematically reviewing the development trajectory, research hotspots, and frontier evolution of mangrove remote sensing has become important for understanding the knowledge structure of this field [15,16]. Existing studies have mainly reviewed mangrove remote sensing from the perspectives of technical methods, regional applications, biomass estimation, blue carbon assessment, or ecological conservation [17,18]. Although these studies have provided useful summaries of data sources, algorithms, and application cases, most of them were narrative or theme-specific reviews. Relatively few studies have quantitatively examined the intellectual structure and temporal evolution of mangrove remote sensing monitoring from a bibliometric perspective. In particular, limited attention has been paid to the combined comparison of Chinese-language literature and internationally indexed publications, the evolution of author collaboration networks, keyword co-occurrence structures, cluster timelines, and burst keywords over a long-term period from 2000 to 2025. This gap limits a systematic understanding of how research priorities, methodological frontiers, and regional emphases in mangrove remote sensing monitoring have changed over time. Bibliometric analysis can quantitatively describe the development status of a research field at the macro level, while scientific knowledge mapping tools such as CiteSpace can visually reveal thematic relationships, knowledge structures, and evolutionary pathways through keyword co-occurrence, cluster analysis, burst detection, and author collaboration networks [19,20]. Applying CiteSpace to mangrove remote sensing research can help identify research priorities across different periods and reveal the relationships among remote sensing data, classification methods, change detection, blue carbon functions, and ecological assessment.
To address this gap, this study retrieved publications related to mangrove remote sensing monitoring from the China National Knowledge Infrastructure (CNKI) and Web of Science databases for the period 2000–2025. The primary objective of this study is to reveal the research progress, knowledge structure, and evolution of hotspots in mangrove remote sensing monitoring from a bibliometric perspective. The research problem addressed by this study is the lack of a systematic understanding of how this field has developed across Chinese-language and internationally indexed literature, including changes in research output, geographic distribution, author collaboration, thematic structure, and emerging frontiers. CiteSpace 6.4.R2 was used to conduct bibliometric and visual analyses from the perspectives of publication trends, geographic distribution, author collaboration networks, keyword co-occurrence, keyword cluster timelines, and burst keywords. Specifically, this study addresses the following questions: How have publication trends and the spatial distribution of mangrove remote sensing research changed over time? What major research groups and collaboration patterns have emerged? What are the main research hotspots? How have frontier topics evolved across different periods? Through these analyses, this study aims to provide a reference for future mangrove remote sensing research, methodological improvement, and coastal ecological conservation practices.

2. Materials and Methods

2.1. Data Sources

The data used in this study were obtained from the China National Knowledge Infrastructure (CNKI) and the Web of Science Core Collection. CNKI and Web of Science were selected because they provide complementary coverage of the literature relevant to this study. CNKI was used to reflect Chinese-language academic publications on mangrove remote sensing research, whereas Web of Science Core Collection was used to represent internationally indexed publications with standardized bibliographic fields suitable for bibliometric and knowledge mapping analysis. Therefore, the findings of this study should be interpreted as patterns derived from CNKI and Web of Science records rather than as a complete representation of all global publications. The literature search was conducted in May 2026. To ensure the systematicity and comparability of the dataset, the retrieval period was set from 2000 to 2025, and the document types included journal articles, reviews, conference papers, and other relevant academic publications.
For Web of Science, records were retrieved from the Web of Science Core Collection. For CNKI, records were retrieved from academic journals and conference literature databases in natural sciences, geography, ecology, remote sensing, and environmental sciences. After retrieval, duplicate records, publications weakly related to the research topic, records outside the target period, and records with incomplete bibliographic information were manually removed. Finally, 485 records from CNKI and 457 records from Web of Science were retained, resulting in a total of 942 publications for subsequent CiteSpace-based visual analysis. There is no universally fixed minimum number of records required for CiteSpace-based bibliometric analysis. Dataset adequacy mainly depends on retrieval relevance, database coverage, study period, and screening consistency. Therefore, the final dataset was considered suitable for this study because it covered 2000–2025, combined Chinese-language and internationally indexed publications, and was generated through a defined retrieval and screening process.
During manuscript preparation and revision, generative artificial intelligence tools were used to assist with language polishing, improving clarity of expression, formatting of response text, and checking consistency among revised sections. The authors also used AI-assisted suggestions to support script drafting for data checking and keyword standardization. All AI-assisted outputs were carefully reviewed, verified, and revised by the authors. The authors take full responsibility for the accuracy, originality, interpretation, and integrity of the final manuscript.
This bibliometric review was conducted with reference to the PRISMA 2020 statement [21] to improve the transparency of literature retrieval, screening, and reporting. The review was not registered, and no formal review protocol was prepared.

2.2. Search Strategy

According to the research topic, search terms related to mangroves, remote sensing monitoring, dynamic change, biomass estimation, carbon stock, and blue carbon were used in both CNKI and Web of Science. The search period was set from 1 January 2000 to 31 December 2025.
For Web of Science, the search was conducted using the topic field. The Boolean search formula was as follows:
TS = (mangrove* AND (“remote sensing” OR “satellite imagery” OR “earth observation” OR UAV OR drone* OR LiDAR OR SAR) AND (monitor* OR mapping OR classification OR “change detection” OR biomass OR “carbon stock” OR “blue carbon”))
For CNKI, the search was conducted using Chinese terms corresponding to “mangrove”, “mangrove wetland”, “remote sensing”, “satellite imagery”, “UAV”, “LiDAR”, “SAR”, “monitoring”, “mapping”, “classification”, “change detection”, “dynamic change”, “biomass”, “carbon stock”, and “blue carbon”. The search fields included title, abstract, and keywords. The CNKI search formula was constructed as follows, using the corresponding Chinese terms in CNKI:
(mangrove OR mangrove wetland) AND (remote sensing OR satellite imagery OR UAV OR LiDAR OR SAR) AND (monitoring OR mapping OR classification OR change detection OR dynamic change OR biomass OR carbon stock OR blue carbon)
To improve the relevance and reliability of the dataset, the initially retrieved records were further screened. First, duplicate records were removed. Second, titles and abstracts were examined to exclude publications that were only weakly related to mangrove remote sensing monitoring. Third, records with incomplete bibliographic information, such as missing titles, keywords, abstracts, or references, were removed. Publications were included if they met the following criteria: (1) the study focused on mangrove ecosystems; (2) remote sensing data, methods, or monitoring applications were involved; and (3) the study addressed at least one topic related to distribution mapping, classification, change detection, biomass estimation, carbon stock assessment, blue carbon, or ecological monitoring. Publications were excluded if they only mentioned mangroves as background information, did not involve remote sensing methods or data, were non-academic materials, were outside the target period, or lacked complete bibliographic information.
For CNKI, 660 records were included in the preliminary retrieved dataset. After removing 84 records outside the target period or without publication year, 19 duplicate records, and 72 records weakly related to mangrove remote sensing, 485 CNKI records published between 2000 and 2025 were retained. For Web of Science, 465 records were included in the preliminary retrieved dataset. After removing 7 records outside the target period and 1 duplicate record, 457 Web of Science records were retained. Finally, 942 records were included for subsequent CiteSpace-based visual analysis. The screening process is summarized in Table 1.
The processed records from CNKI and Web of Science were exported in formats compatible with CiteSpace for subsequent knowledge mapping analysis.

2.3. Research Methods

This study combined bibliometric analysis with scientific knowledge mapping to examine the development of mangrove remote sensing monitoring research. Bibliometric analysis was used to reveal annual publication trends, changes in research output, and stage-specific development characteristics. Scientific knowledge mapping was used to visualize author collaboration networks, keyword co-occurrence structures, thematic clusters, and the evolution of research hotspots.
CiteSpace is a widely used visualization tool for scientific knowledge mapping. It can reveal the knowledge structure and dynamic evolution of a research field through indicators and functions such as nodes, links, centrality, keyword co-occurrence, cluster timelines, and burst detection [19,20]. In CiteSpace maps, node size generally represents the frequency of occurrence of a keyword, author, or institution; links between nodes indicate co-occurrence or collaboration relationships; betweenness centrality reflects the bridging role of a node within the network; keyword co-occurrence and cluster timeline analyses reveal thematic relationships and their temporal evolution; and burst keyword analysis helps identify research topics that have attracted rapidly increasing attention during specific periods.

2.4. Parameter Settings and Analytical Procedure

CiteSpace 6.4.R2 was used for visual analysis in this study. The time span was set from 2000 to 2025, with each slice representing one year. Depending on the analytical purpose, the node types were set to Author and Keyword. Author was used to generate author collaboration networks, whereas Keyword was used to generate keyword co-occurrence networks, keyword cluster timeline maps, and keyword burst maps. To improve reproducibility, the main parameter settings used in the CiteSpace analysis are summarized in Table 2.
The analytical procedure was as follows. First, the records retrieved from CNKI and Web of Science were organized, deduplicated, screened, and converted into CiteSpace-compatible formats. Second, the processed datasets were imported into CiteSpace to construct author collaboration networks, keyword co-occurrence networks, keyword cluster timeline maps, and keyword burst maps. Third, the hotspot themes and evolutionary patterns in mangrove remote sensing monitoring research were interpreted using node frequency, betweenness centrality, cluster labels, cluster numbers, burst strength, and burst periods. Finally, the publication trends, geographic distribution, and knowledge mapping results were integrated to summarize the research progress, hotspot changes, and future development directions of this field.
Because CNKI and Web of Science differ in language coverage, indexing rules, document types, and citation formats, the two datasets were analyzed separately in the CiteSpace visualization process. Comparative interpretations were therefore made cautiously, focusing on broad thematic tendencies rather than on direct numerical equivalence.

3. Results and Analysis

3.1. Publication Trends and Geographic Distribution

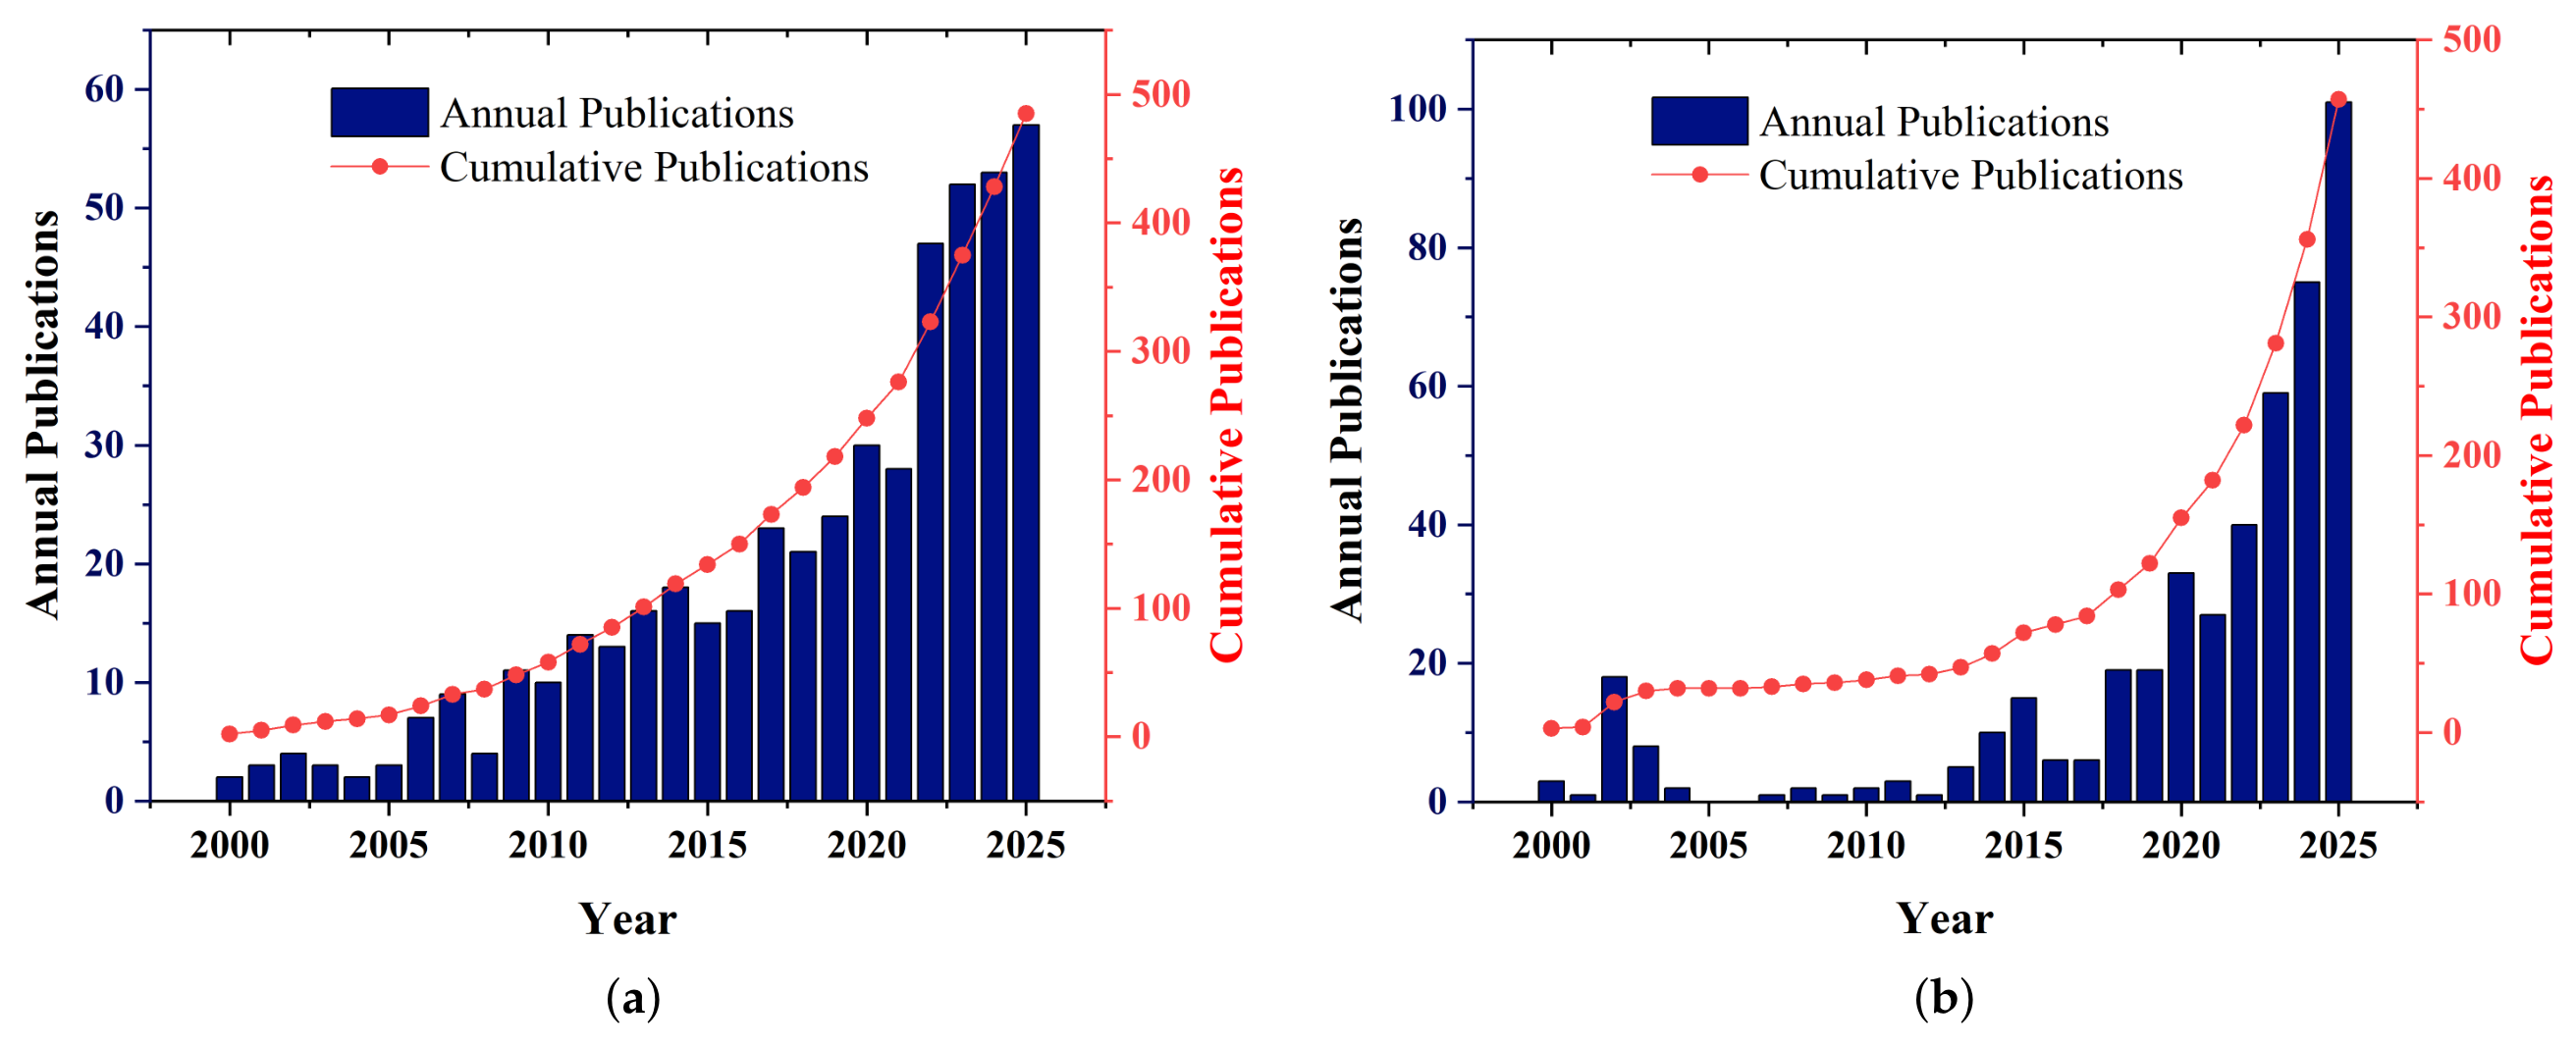
As shown in Figure 1, the number of publications related to mangrove remote sensing monitoring generally increased from 2000 to 2025. Publication output was relatively limited in the early stage, suggesting that the field was still in an exploratory phase, with research mainly focusing on mangrove distribution mapping, land-use change, and basic remote sensing classification. With the increasing availability of remote sensing data and the growing demand for coastal ecological conservation, research output has gradually increased.
After 2015, publication output in this field increased markedly, indicating that mangrove remote sensing monitoring gradually became an important research direction in ecological remote sensing and coastal studies. In recent years, with the widespread application of Landsat, Sentinel, high-resolution satellite imagery, synthetic aperture radar (SAR) data, and unmanned aerial vehicle (UAV) remote sensing data, studies on mangrove dynamic change monitoring, biomass estimation, blue carbon assessment, and ecological restoration monitoring have increased continuously [22,23,24,25]. Meanwhile, the introduction of machine learning and deep learning methods has promoted the transition of mangrove remote sensing monitoring from traditional classification and identification toward intelligent, fine-scale, and long-term time-series analysis [26,27,28,29].
The cumulative number of publications also showed a steady upward trend, indicating continuous accumulation of the research foundation and increasing academic attention in this field. Overall, mangrove remote sensing monitoring has gradually shifted from an early exploratory stage to a rapid development stage.
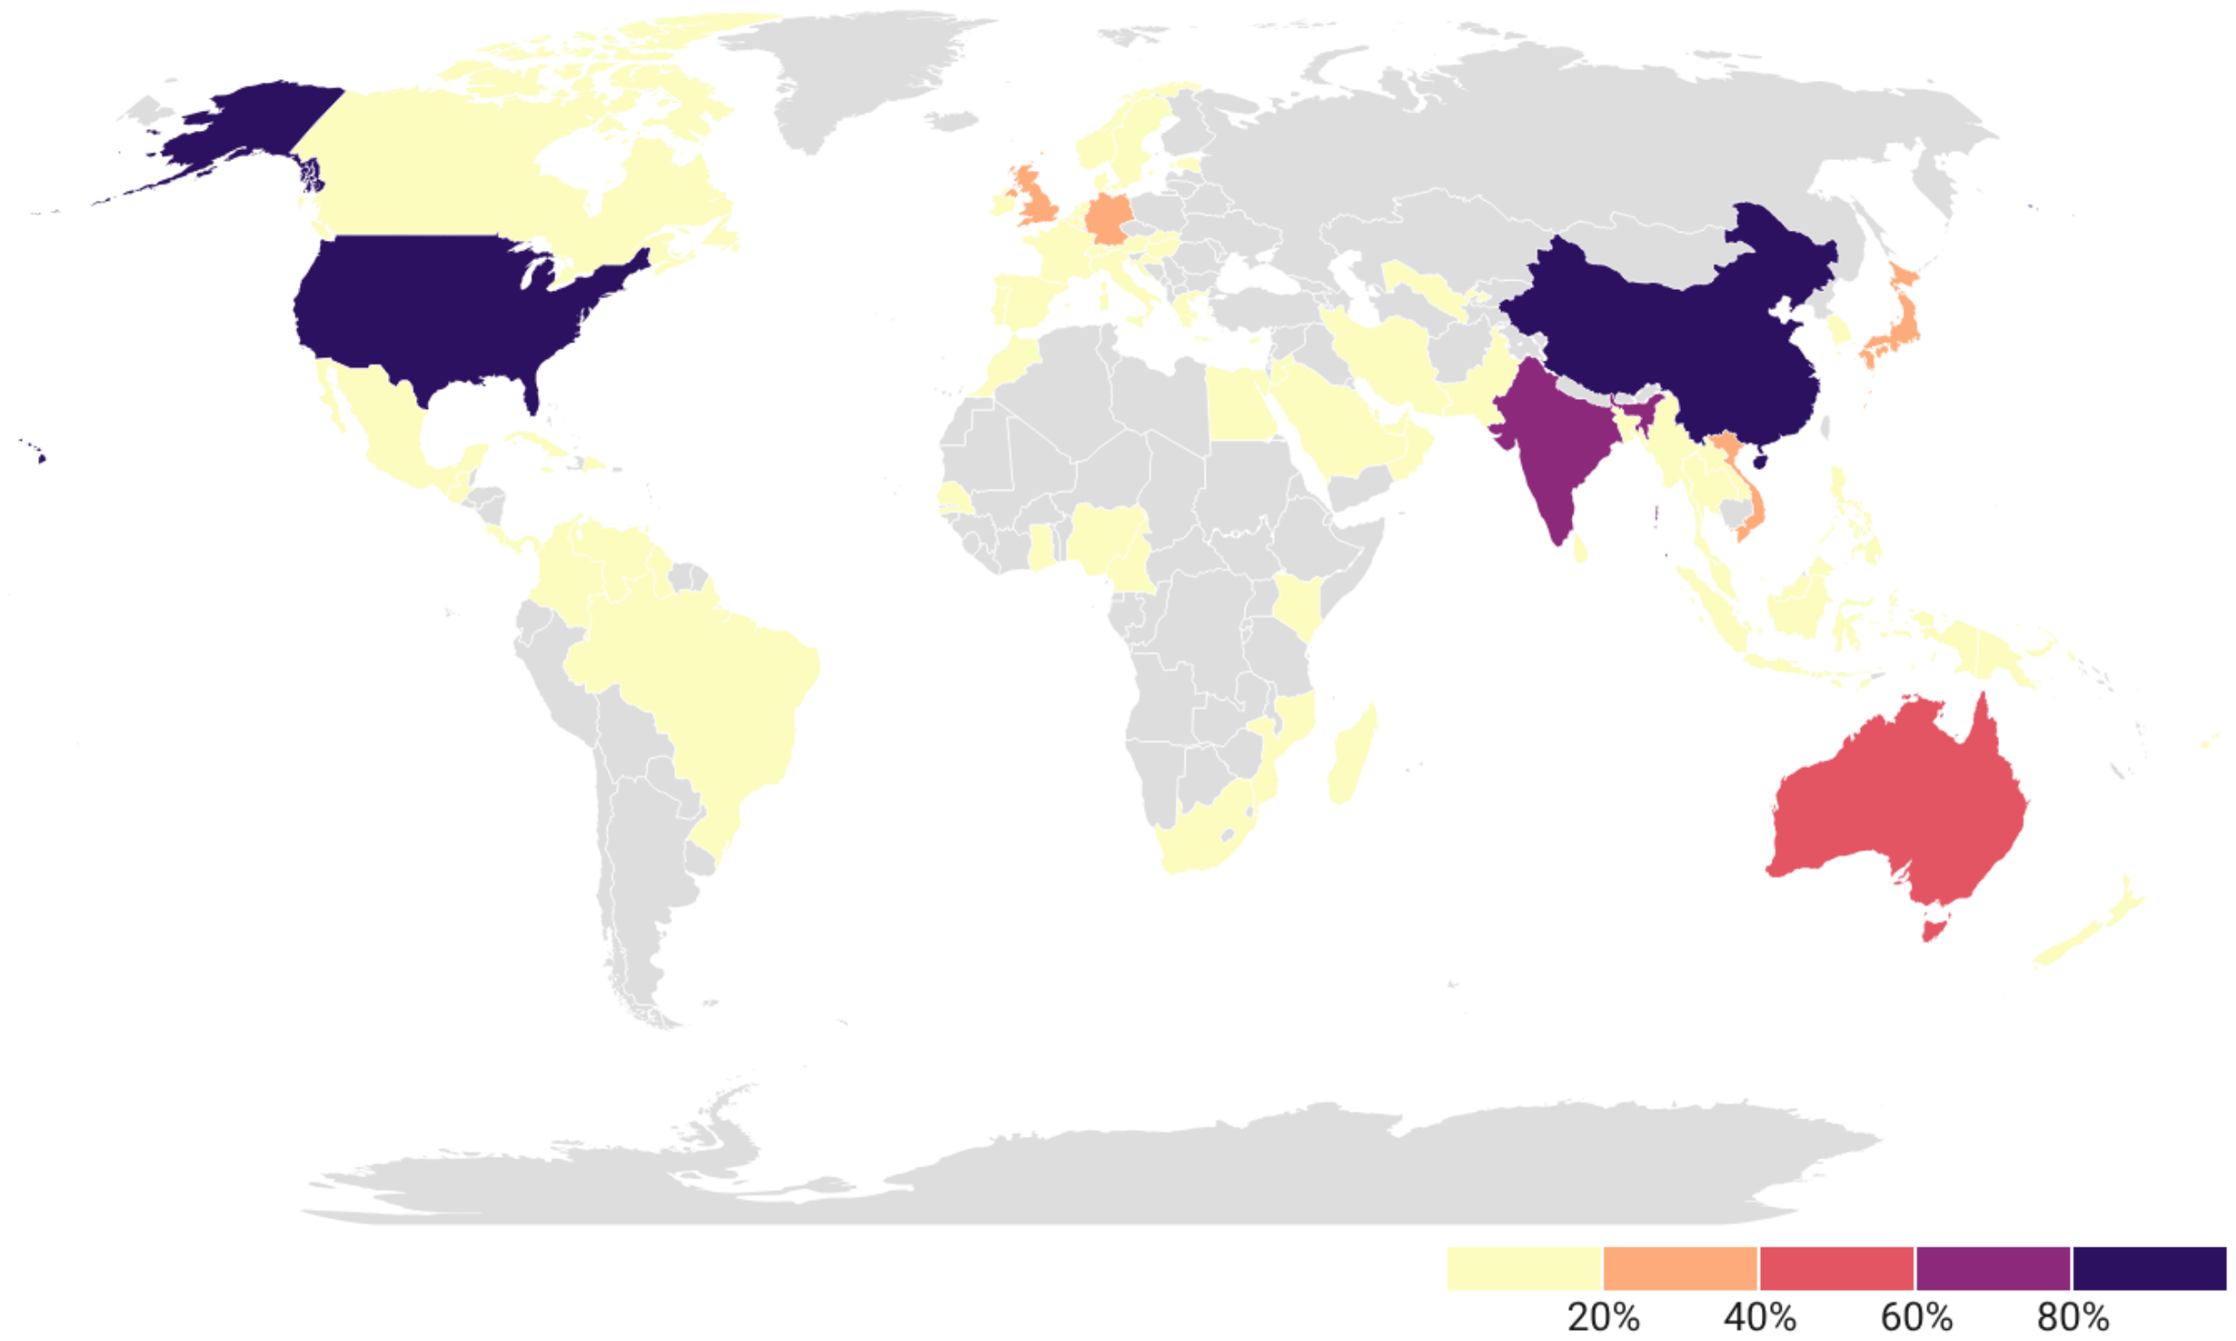
As shown in Figure 2, the geographic distribution map was generated using Datawrapper (Datawrapper GmbH, Berlin, Germany; https://www.datawrapper.de/). based on the proportion of publications contributed by each country/region in the Web of Science dataset. Country/region information was derived from the affiliation information in Web of Science records, and the color scale represents relative publication proportions rather than absolute publication counts. The results show that studies on mangrove remote sensing monitoring from 2000 to 2025 exhibited a clear pattern of regional concentration. China and the United States showed relatively high publication output and were the major contributors to this field, while India, Australia, Japan, and several Southeast Asian countries also showed considerable research activity. This distribution pattern is closely related to the geographic distribution of mangrove resources, the demand for coastal ecological conservation, and the level of remote sensing technology development in different countries [1,6,30]. Overall, research on mangrove remote sensing monitoring was mainly concentrated in Asia, North America, and Oceania, whereas research output from some mangrove-distributed countries in Africa and South America remained relatively limited, indicating a certain degree of regional imbalance in this field.

3.2. Author Collaboration Network Analysis

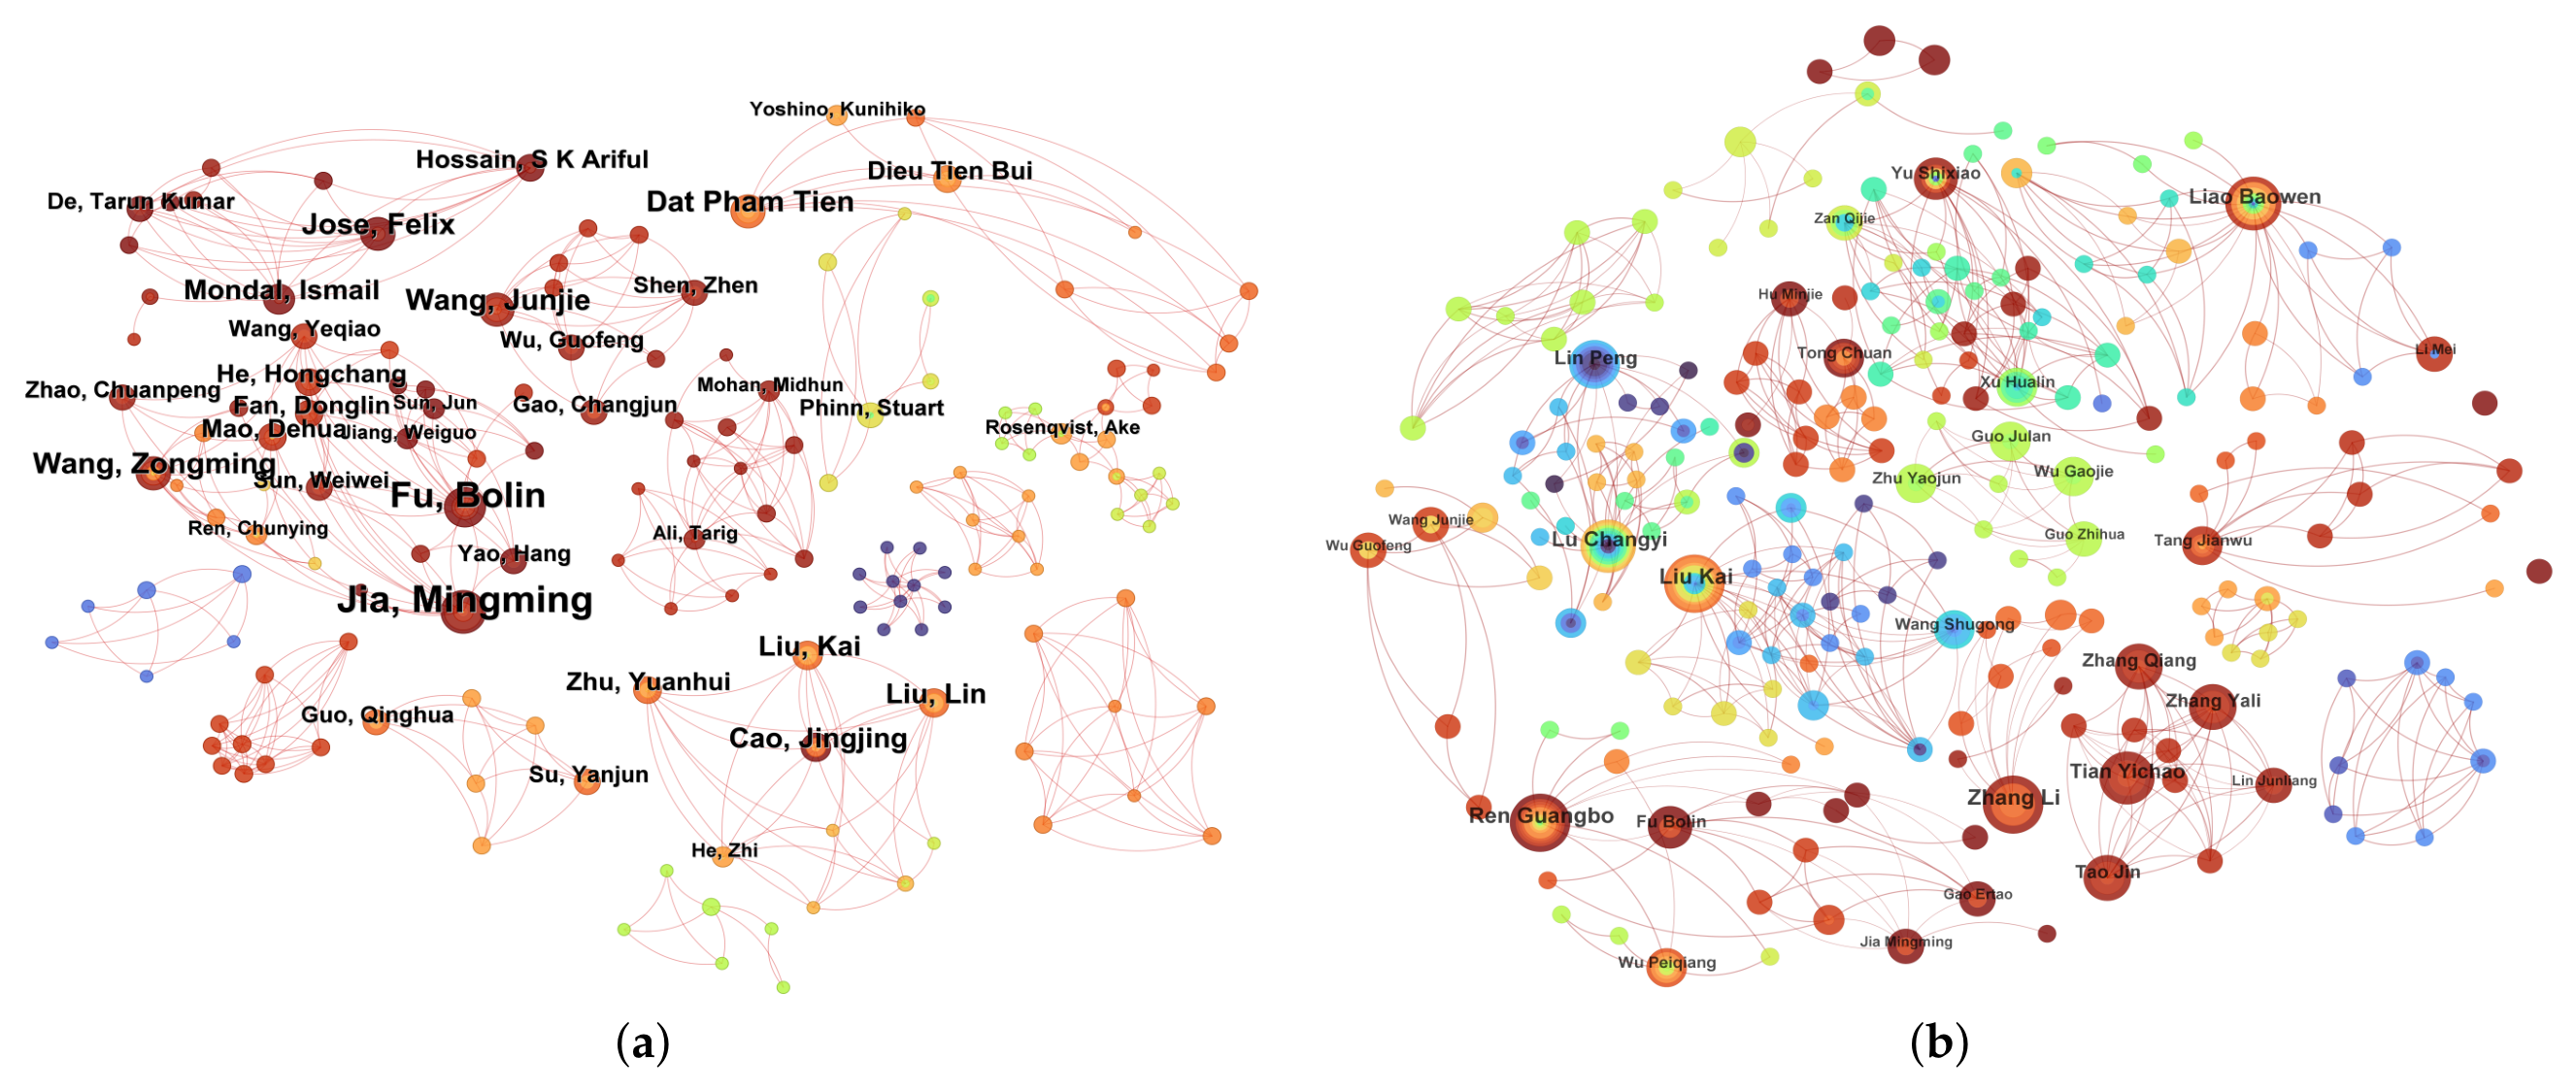
Author collaboration networks can reflect core researchers, collaboration relationships, and the distribution of research teams within a specific field. In the CiteSpace author collaboration maps, nodes represent authors, node size indicates the number of publications by each author, and links between nodes indicate co-authorship relationships. Denser links suggest closer collaboration among authors. As shown in Figure 3, several relatively distinct author collaboration groups have formed in the field of mangrove remote sensing monitoring, although the strength of connections among different groups varies.
In the Web of Science author collaboration network (Figure 3a), several productive authors could be identified. The most productive authors included Jia Mingming (13 publications), Fu Bolin (12), Wang Junjie (7), Dai Zhijun (7), Dat Pham Tien (7), Wang Zongming (7), and Jose Felix (7). At the network level, the Web of Science author collaboration network contained 454 nodes and 708 links, with a network density of 0.0072. The largest connected component included 27 nodes, accounting for 6% of the whole network. These results indicate that several local collaboration groups have formed in WoS-indexed mangrove remote sensing research, with relatively close cooperation within some teams. However, the low network density and small largest connected component suggest that connections among different collaboration groups remained limited.
In the CNKI author collaboration network (Figure 3b), the most productive authors included Liu Kai (11 publications), Zhang Li (11), Ren Guangbo (11), Lu Changyi (10), Liao Baowen (10), Tian Yichao (9), and Lin Peng (8). The CNKI author collaboration network contained 573 nodes and 824 links, with a network density of 0.005. The largest connected component included 30 nodes, accounting for 5% of the whole network. The network map shows several local collaboration groups, such as groups centered around authors including Xu Hualin, Zeng Qijie, and Yu Shixiao, indicating that stable cooperation existed within some research teams. Nevertheless, the overall network remained relatively sparse and fragmented, suggesting that sustained cross-institutional and cross-regional collaboration still needs further improvement.
Overall, the author collaboration analysis shows that mangrove remote sensing monitoring has led to the formation of several local research teams in both the CNKI and Web of Science datasets. However, the low network densities, small largest connected components, and near-zero betweenness centrality values of major authors indicate that collaboration was mainly concentrated within local groups, while connections among different groups remained limited. Therefore, future research should further strengthen cross-team, cross-regional, and interdisciplinary collaboration.

3.3. Keyword Co-Occurrence and Thematic Structure Analysis

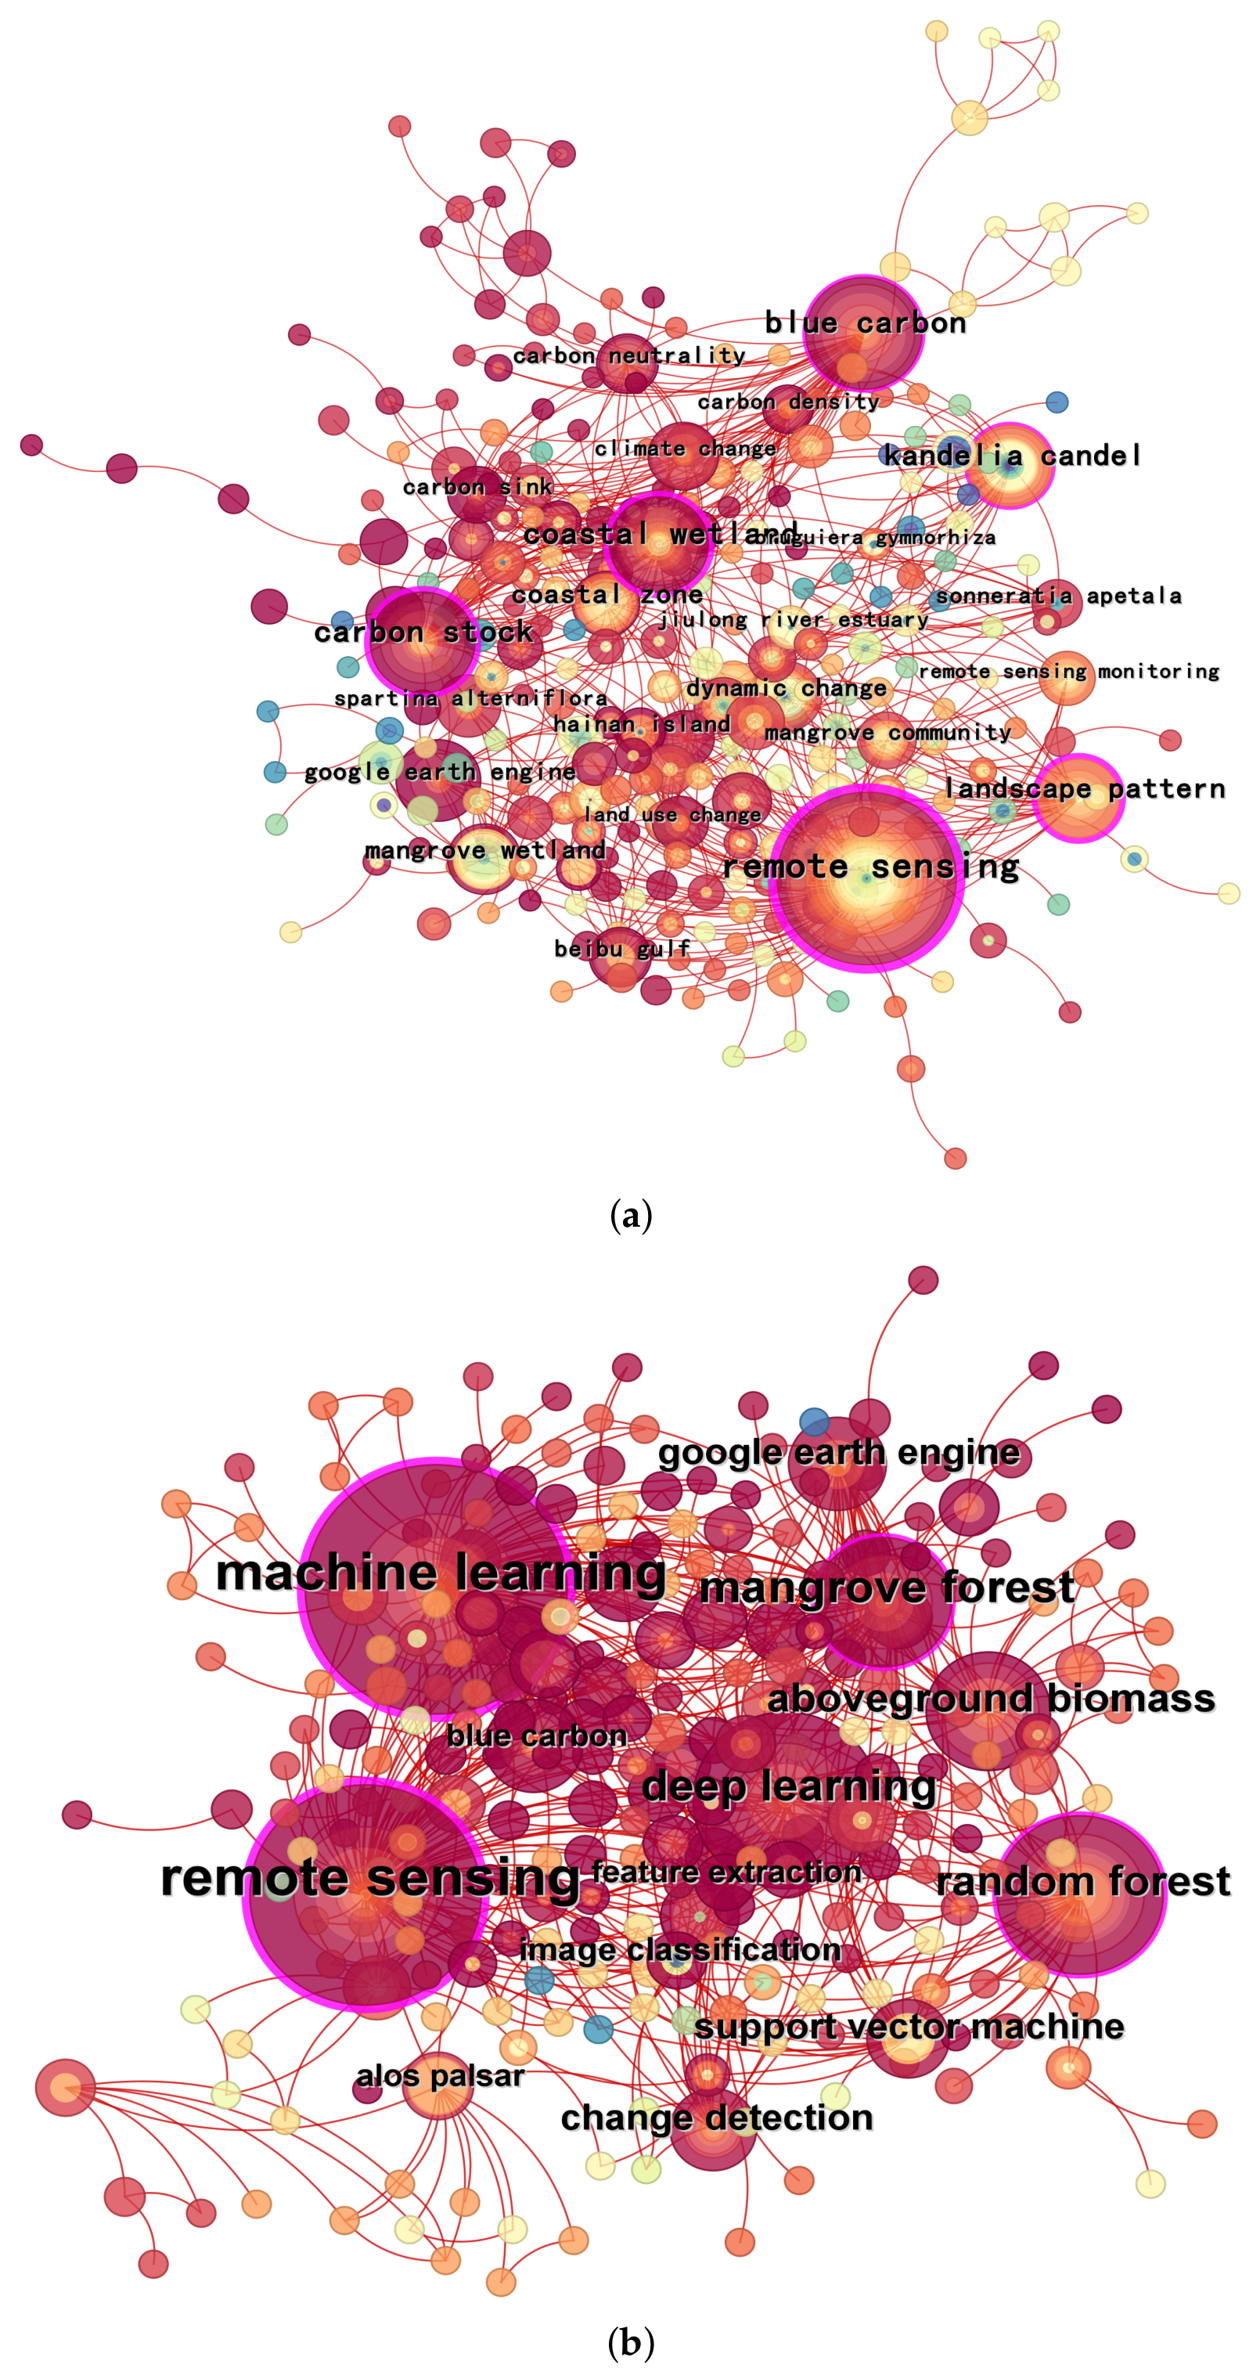
Keyword co-occurrence networks can reflect the core themes of a research field and the relationships among them. As shown in Figure 4, keyword co-occurrence networks were constructed separately for the CNKI and Web of Science datasets. The CNKI keyword co-occurrence network contained 352 nodes and 680 links, with a network density of 0.011. The largest connected component included 282 nodes, accounting for 80% of the whole network. The Web of Science author-keyword co-occurrence network contained 393 nodes and 778 links, with a network density of 0.0101. Its largest connected component included 303 nodes, accounting for 77% of the whole network. These results indicate that both datasets formed keyword association networks, although the overall network densities remained low, suggesting that the research themes were connected but still showed certain thematic dispersion.
In the network, node size represents keyword frequency, and links between nodes indicate co-occurrence relationships. Larger nodes indicate that the corresponding keywords appeared more frequently in the related literature, while betweenness centrality reflects the bridging role of a keyword among different thematic groups.
In the CNKI keyword co-occurrence network (Figure 4a), high-frequency keywords included remote sensing, blue carbon, carbon stock, coastal wetland, landscape pattern, Google Earth Engine, Kandelia candel, dynamic change, mangrove wetland, and coastal zone (Table 3). Among them, remote sensing had the highest frequency (63) and centrality (0.48), indicating that remote sensing technology served as a core methodological basis for CNKI-indexed mangrove research. Coastal wetland (centrality = 0.26), landscape pattern (0.23), carbon stock (0.20), and blue carbon (0.18) also showed relatively high betweenness centrality values within the CNKI network. Given that sensitivity analyses with alternative g-index k values were not conducted, these centrality values were interpreted descriptively as indicators of possible bridging roles among ecological monitoring, carbon-related assessment, and coastal wetland research, rather than as precise rankings of keyword importance. The relatively high frequencies of blue carbon, carbon stock, and carbon sink suggest that CNKI-indexed studies have paid considerable attention to the blue carbon function, carbon stock assessment, and ecosystem service value of mangroves [31,32,33,34]. Keywords such as coastal wetland, coastal zone, and mangrove wetland indicate that these studies often examine mangroves within the broader context of coastal wetland ecosystems and coastal ecological conservation.
In the Web of Science author-keyword co-occurrence network (Figure 4b), the most frequent keyword was machine learning (frequency = 88, centrality = 0.30), followed by remote sensing (79, centrality = 0.38), deep learning (42), random forest (36), mangrove forest (26), and aboveground biomass (22). These high-frequency author keywords indicate that WoS-indexed studies have placed strong emphasis on intelligent algorithms, remote sensing data applications, mangrove information extraction, and ecological parameter estimation. Machine learning and remote sensing showed relatively high betweenness centrality values among the major Web of Science author keywords. These values were interpreted descriptively, suggesting that the two keywords may serve as connecting themes between algorithm development, image classification, biomass estimation, change detection, and mangrove monitoring applications. The occurrence of deep learning, random forest, support vector machine, image classification, and feature extraction further reflects the increasing role of intelligent classification and interpretation methods in mangrove remote sensing [14,35,36,37,38]. In addition, keywords such as aboveground biomass, blue carbon, change detection, and Google Earth Engine indicate that recent WoS-indexed studies have increasingly connected methodological development with biomass estimation, carbon-related assessment, dynamic monitoring, and cloud-based geospatial analysis [39,40,41,42,43].
Overall, the keyword networks of both CNKI and Web of Science indicate that mangrove remote sensing monitoring research mainly focuses on remote sensing applications, intelligent classification, dynamic change monitoring, biomass estimation, blue carbon, carbon stock assessment, and ecological function monitoring. After reanalysis based on Web of Science author keywords only, the comparison between the two databases should be interpreted more cautiously. CNKI records show relatively stronger links to blue carbon, carbon stock, coastal wetlands, landscape pattern, mangrove wetlands, and ecological conservation, whereas WoS-indexed author keywords show greater emphasis on machine learning, deep learning, random forests, support vector machines, Google Earth Engine, aboveground biomass, and change detection. These results suggest that the two datasets share several common research concerns, but also show database-specific thematic emphases rather than a strict application-versus-technology division.

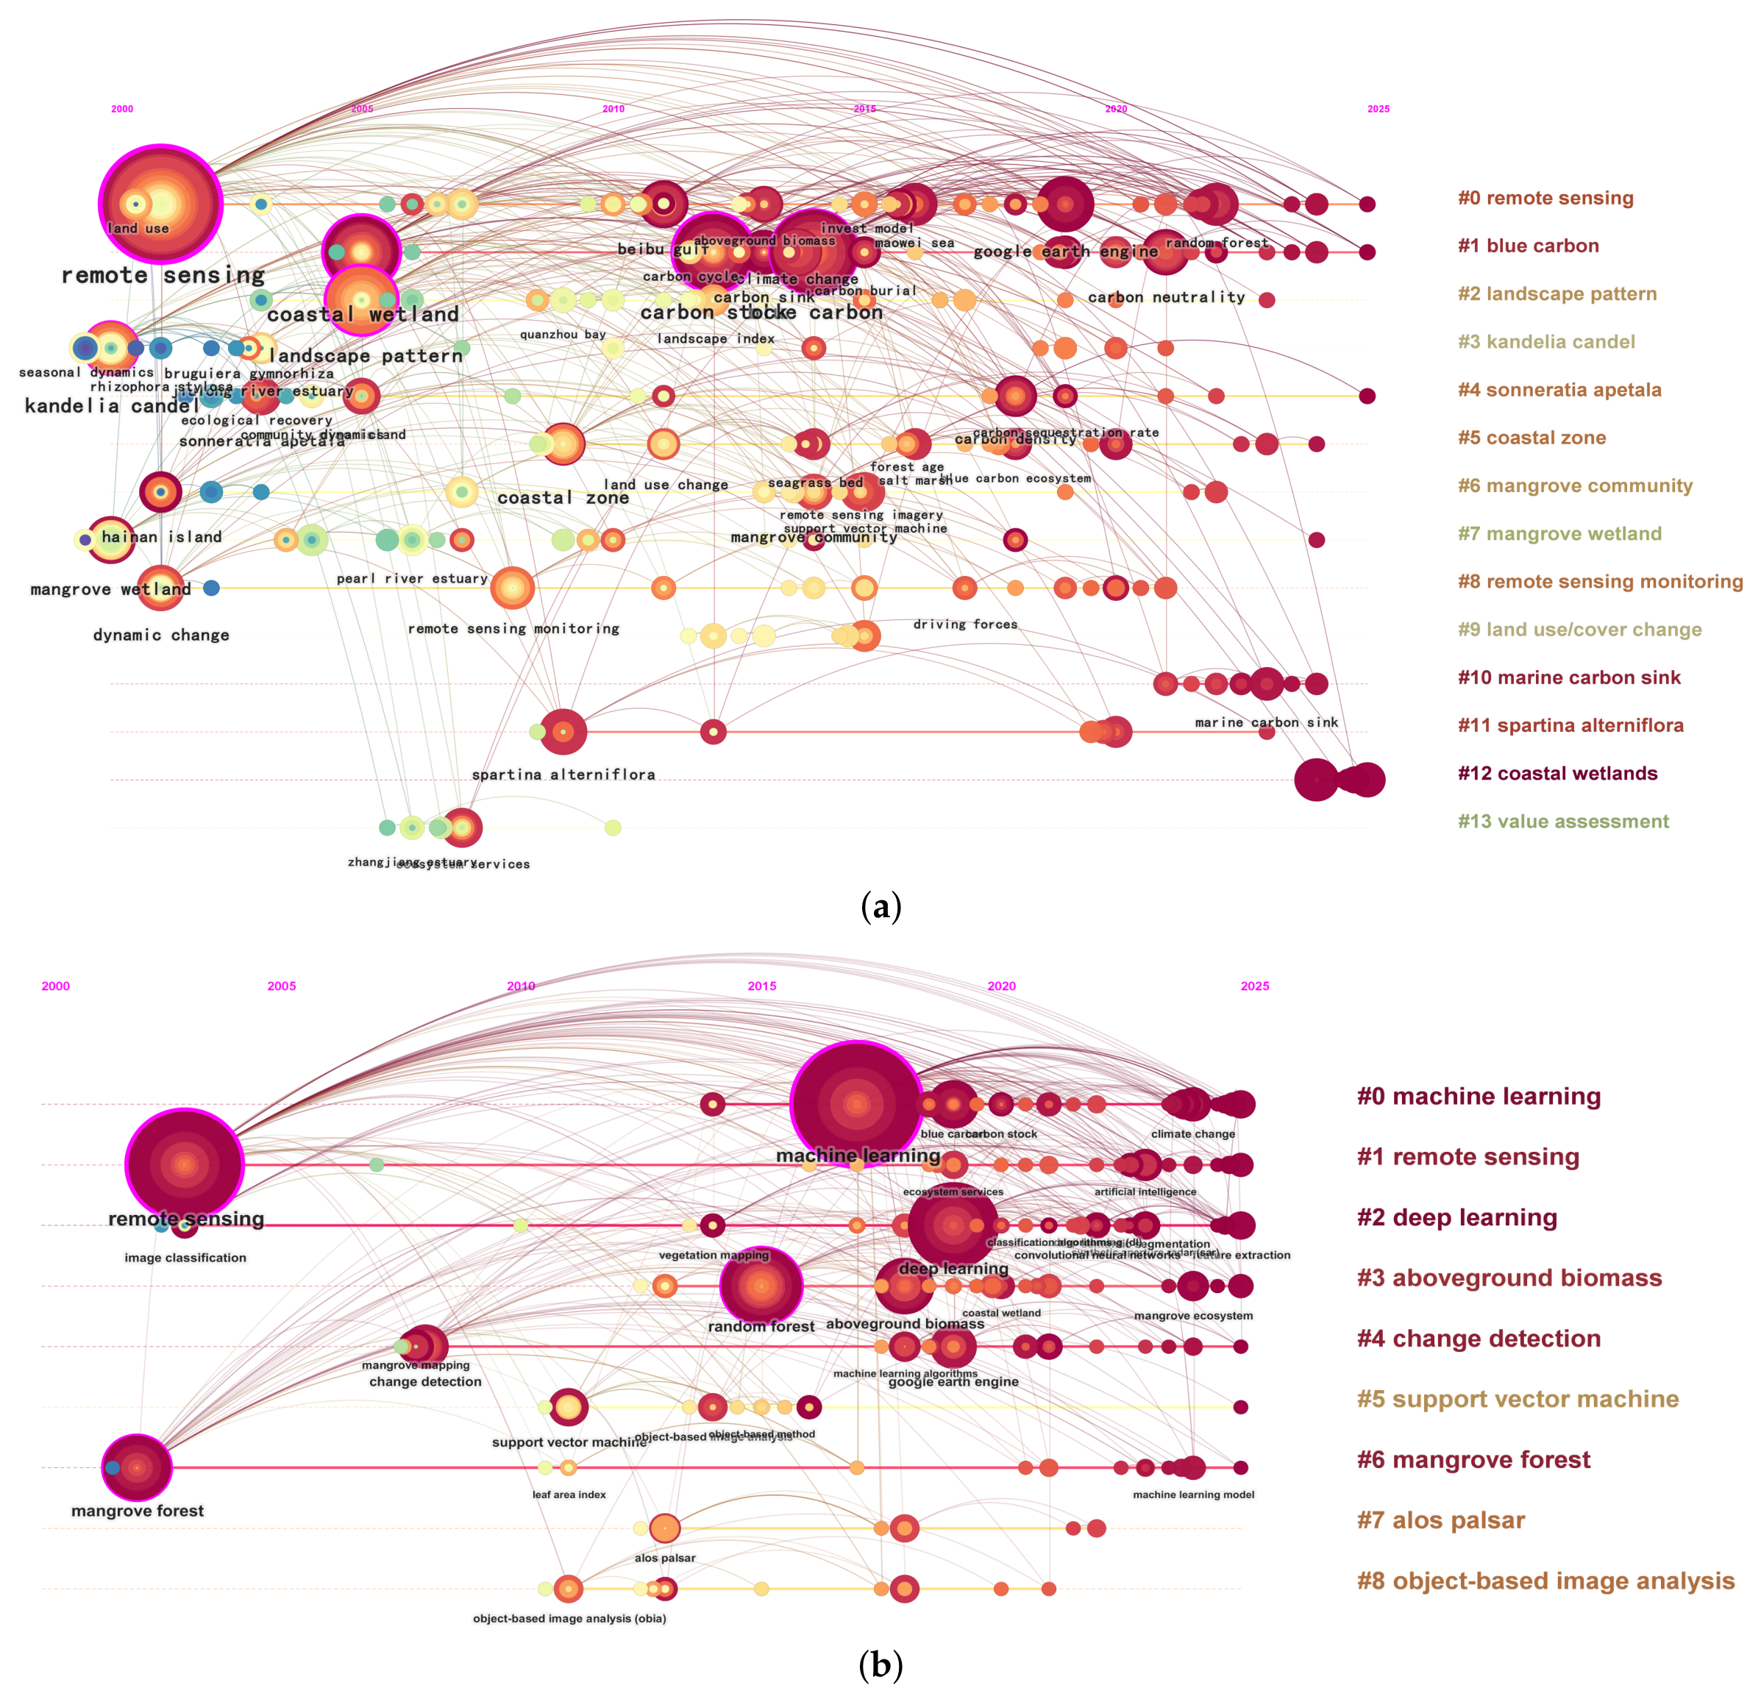
3.4. Keyword Cluster Timeline Analysis

The keyword cluster timeline map can reveal the temporal evolution of different research themes. As shown in Figure 5, from 2000 to 2025, the themes of mangrove remote sensing monitoring research evolved from basic distribution identification toward ecological function assessment, intelligent algorithm application, biomass estimation, blue carbon assessment, and cloud-based geospatial analysis. In the map, nodes represent keywords, node size indicates keyword frequency, links represent co-occurrence relationships, and different cluster labels indicate the main research themes in this field.
The keyword cluster timeline networks showed acceptable clustering quality in both datasets. For the CNKI dataset, the network contained 352 nodes and 680 links, with a density of 0.011. The largest connected component included 282 nodes, accounting for 80% of the whole network. The modularity Q value was 0.6585, and the weighted mean silhouette S value was 0.916. For the Web of Science author-keyword dataset, the network contained 393 nodes and 778 links, with a density of 0.0101. The largest connected component included 303 nodes, accounting for 77% of the whole network. The modularity Q value was 0.6693, and the weighted mean silhouette S value was 0.8697. In general, a modularity Q value greater than 0.3 indicates a significant clustering structure, while a silhouette S value greater than 0.5 suggests acceptable cluster consistency. Therefore, the clustering results of both datasets were suitable for interpreting the thematic evolution of mangrove remote sensing monitoring research.
In the CNKI keyword cluster timeline map (Figure 5a), the main clusters included remote sensing, blue carbon, landscape pattern, Kandelia candel, Sonneratia apetala, coastal zone, mangrove community, mangrove wetland, remote sensing monitoring, land use/cover change, marine carbon sink, Spartina alterniflora, coastal wetlands, and value assessment. Early studies mainly focused on remote sensing, coastal wetland, mangrove wetland, and landscape pattern, indicating that CNKI-indexed research initially emphasized mangrove spatial distribution, coastal wetland patterns, and land-use change. Subsequently, themes such as blue carbon, carbon stock, carbon sink, and marine carbon sink gradually became more prominent, suggesting that CNKI-indexed mangrove remote sensing research has increasingly focused on blue carbon functions, carbon stock assessment, and ecosystem service value [18,44,45,46,47]. In recent years, keywords such as remote sensing monitoring, dynamic change, Google Earth Engine, random forest, and value assessment have continued to appear, indicating that CNKI-indexed research has gradually shifted from distribution identification to dynamic monitoring, ecological value assessment, cloud-based analysis, and coastal management applications.
In the Web of Science author-keyword cluster timeline map (Figure 5b), the main clusters included machine learning, remote sensing, deep learning, aboveground biomass, change detection, support vector machine, mangrove forest, ALOS PALSAR, and object-based image analysis. Early WoS-indexed studies mainly focused on remote sensing, image classification, mangrove forest, and object-based image analysis, indicating an emphasis on mangrove identification, classification mapping, and land-cover information extraction. In the middle stage, keywords such as support vector machine, random forest, ALOS PALSAR, object-based image analysis, and vegetation mapping became prominent, indicating that machine learning methods and radar or high-resolution remote sensing data were increasingly applied [48,49,50,51]. In recent years, themes such as machine learning, deep learning, aboveground biomass, blue carbon stock, climate change, artificial intelligence, Google Earth Engine, and feature extraction have become more evident, suggesting that WoS-indexed studies have increasingly moved toward intelligent algorithms, biomass estimation, carbon-related assessment, cloud-based geospatial analysis, and ecological function monitoring [27,28,52,53,54].
Overall, the keyword cluster timelines of CNKI and Web of Science indicate that mangrove remote sensing monitoring research has evolved from basic classification and distribution identification toward dynamic change analysis, ecological function assessment, biomass estimation, blue carbon assessment, and intelligent monitoring. After reanalysis based on Web of Science author keywords only, the comparison between the two databases should be interpreted as database-specific thematic differences rather than a strict domestic-international contrast. CNKI records show relatively stronger links to blue carbon, carbon sinks, coastal wetlands, mangrove communities, landscape pattern, and ecological value assessment, whereas WoS-indexed author keywords highlight machine learning, deep learning, random forest, support vector machine, aboveground biomass, change detection, Google Earth Engine, ALOS PALSAR, and object-based image analysis. These results suggest that the two datasets are broadly consistent in their overall evolutionary direction, while differing in thematic emphasis and terminology structure.

3.5. Burst Keywords and Hotspot Evolution Analysis

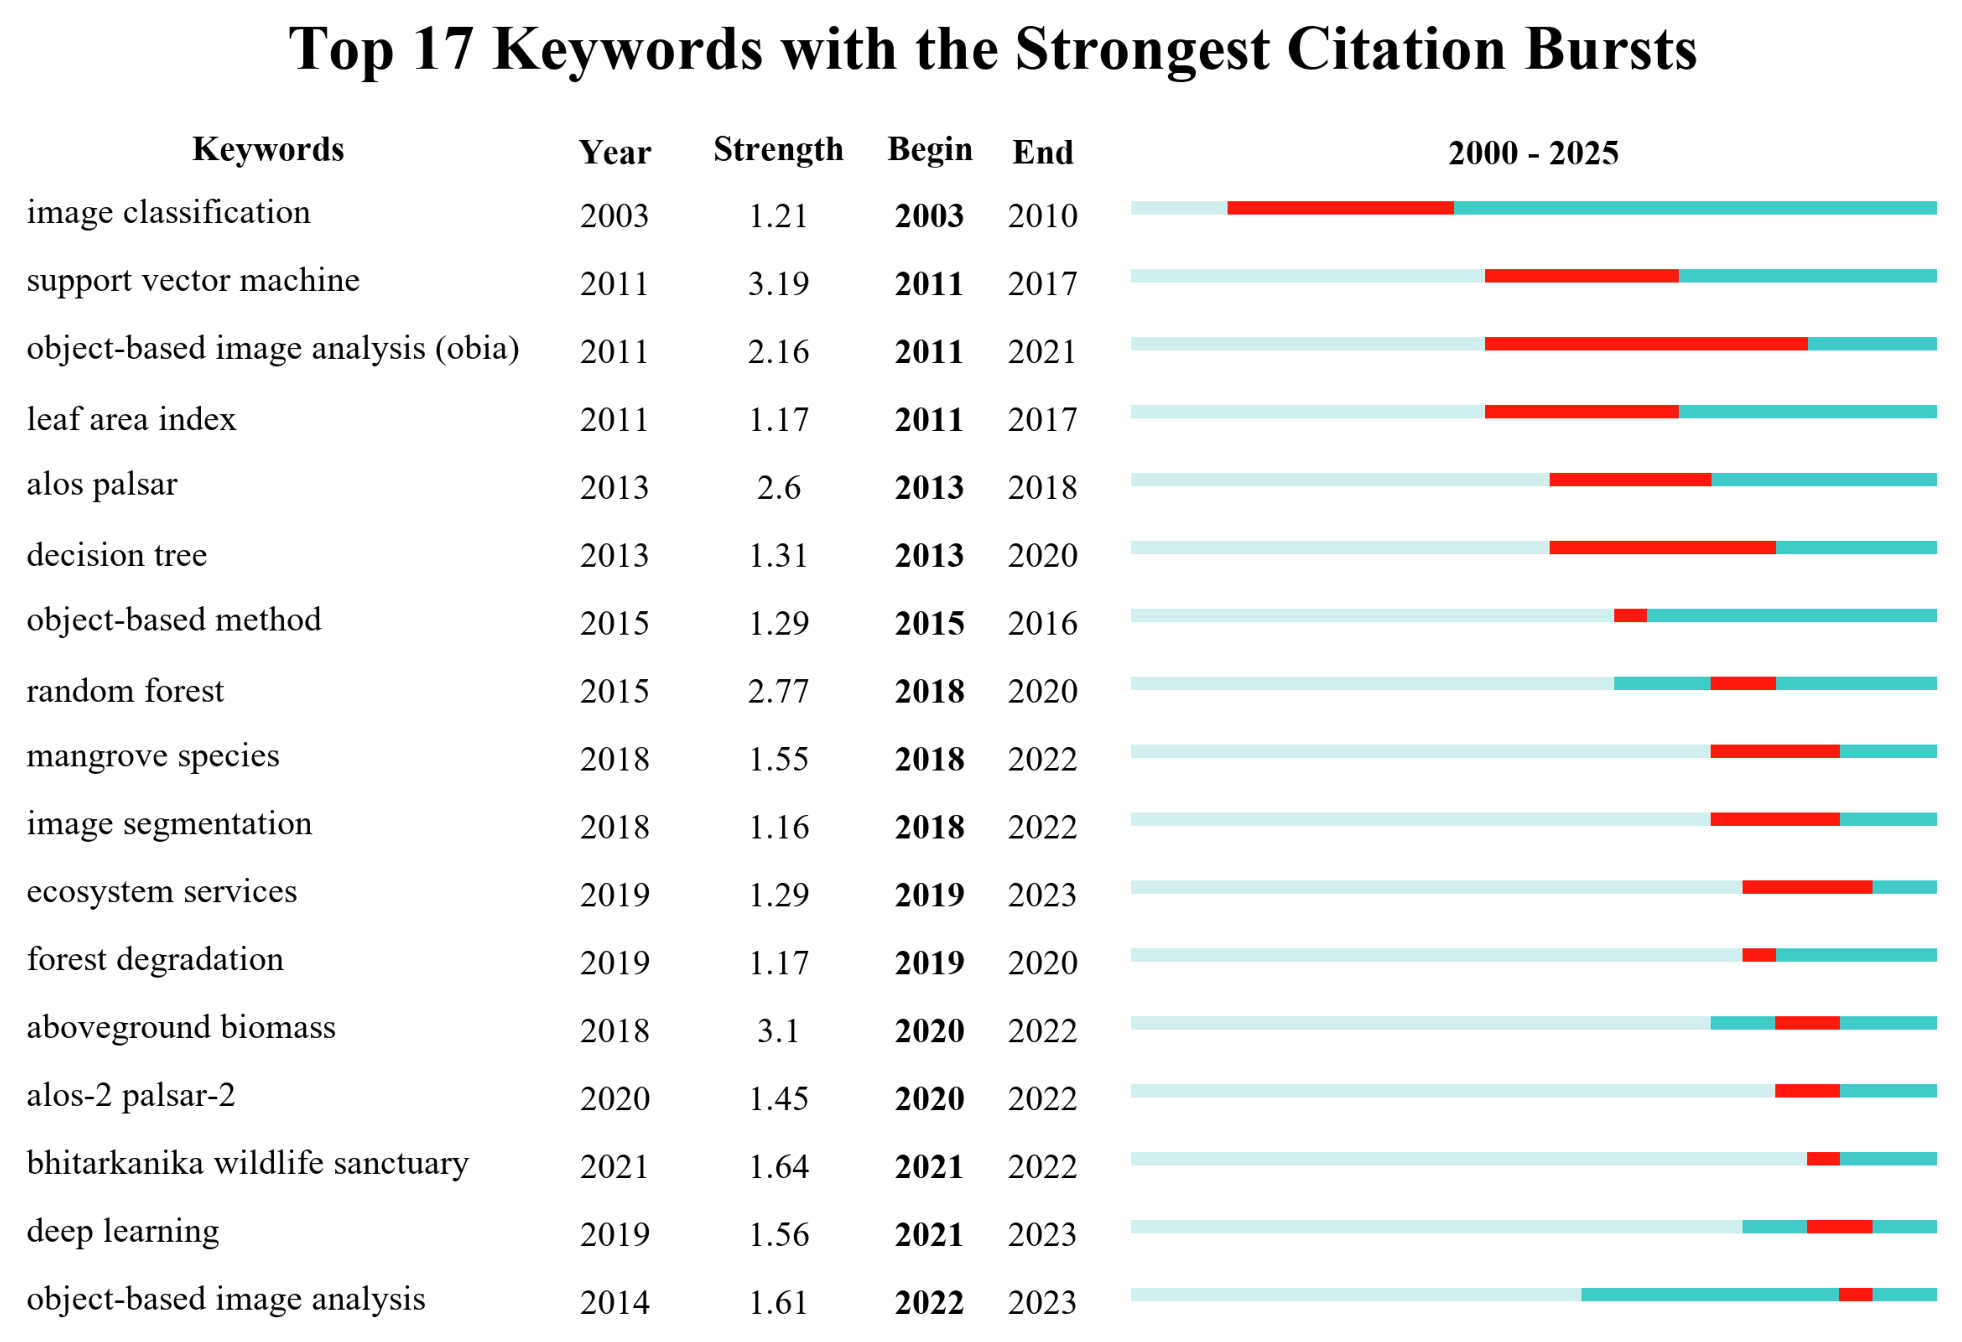
Burst keyword analysis can identify research topics that received rapidly increasing attention during specific periods and reveal their duration. As shown in Figure 6, the burst keyword results based on Web of Science author keywords indicate that hotspot evolution in mangrove remote sensing monitoring showed several stage-specific patterns from 2000 to 2025. In addition, the high-frequency author keywords for different periods are summarized in Table 4, which provides complementary evidence for interpreting the temporal evolution of research themes. The burst keywords mainly included image classification, support vector machine, object-based image analysis, leaf area index, ALOS PALSAR, decision tree, random forest, mangrove species, image segmentation, ecosystem services, forest degradation, aboveground biomass, ALOS-2 PALSAR-2, Bhitarkanika Wildlife Sanctuary, deep learning, and object-based image analysis. These results suggest that WoS-indexed studies have focused on the evolution of image classification methods, machine learning algorithms, radar and high-resolution data sources, biomass estimation, ecosystem services, and degradation monitoring.
The first stage can be described as a basic identification and early classification stage, roughly from 2003 to 2010. Burst keywords during this stage mainly included image classification, indicating that early WoS-indexed studies focused on mangrove identification, classification mapping, and land-cover information extraction based on remote sensing imagery. The high-frequency author keywords in 2000–2010, such as remote sensing, image classification, IKONOS, and coastal habitats (Table 4), provide descriptive evidence that early studies were mainly concerned with remote sensing-based mapping and habitat characterization. However, because the number of WoS records with author keywords in this early period was relatively small, these results should be interpreted as descriptive indicators rather than stable thematic patterns.
The second stage can be described as a method expansion and multi-source data application stage, roughly from 2011 to 2018. Burst keywords during this stage included support vector machine, object-based image analysis, leaf area index, ALOS PALSAR, decision tree, object-based method, and random forest. These keywords indicate that mangrove remote sensing monitoring gradually shifted from basic image classification toward object-based analysis, machine learning methods, vegetation index applications, and radar remote sensing data [13,26,48,49,50,51]. The high-frequency author keywords in 2011–2018, including object-based image analysis, random forest, remote sensing, support vector machine, ALOS PALSAR, WorldView-2, Landsat, and machine learning (Table 4), further support this interpretation. Overall, this stage reflects the increasing use of machine learning classifiers, object-based methods, and multi-source optical and radar data in mangrove mapping and monitoring.
The third stage can be described as an intelligent monitoring and ecological function assessment stage, mainly reflected after 2019. Burst keywords during this period included mangrove species, image segmentation, ecosystem services, forest degradation, aboveground biomass, ALOS-2 PALSAR-2, Bhitarkanika Wildlife Sanctuary, deep learning, and object-based image analysis. These terms indicate growing attention to species identification, semantic segmentation, ecosystem service assessment, degradation monitoring, biomass estimation, and deep learning-based interpretation. Meanwhile, high-frequency author keywords in 2019–2025, such as machine learning, remote sensing, deep learning, random forest, Sentinel-2, aboveground biomass, Google Earth Engine, Landsat, blue carbon, object-based image analysis, Sentinel-1, and LiDAR (Table 4), suggest that recent WoS-indexed studies have increasingly emphasized intelligent algorithms, cloud-based geospatial analysis, multi-sensor data use, and ecological parameter estimation [15,27,28,52,53,54,55]. It should be noted that the burst periods in Figure 6 do not extend beyond 2023; therefore, the characterization of the 2019–2025 period is based on the combined evidence from burst keywords and high-frequency author keywords rather than burst detection alone [56,57,58].
Overall, the burst keyword results and high-frequency author keywords indicate that research hotspots in mangrove remote sensing monitoring have evolved from basic image classification and distribution identification toward object-based analysis, machine-learning-based classification, dynamic monitoring, biomass estimation, blue carbon assessment, and ecological function evaluation. Future studies should place greater emphasis on cross-regional model transferability, long-term validation, degradation identification indicators, uncertainty assessment, and the practical use of monitoring results in coastal ecological management.

4. Discussion

4.1. Formation Mechanisms of Research Hotspots in Mangrove Remote Sensing Monitoring

Based on the publication trends, keyword co-occurrence, cluster timeline, and burst keyword results, research on mangrove remote sensing monitoring has increased markedly since 2015. This growth is closely related to the increasing demand for coastal ecological conservation, mangrove restoration, blue carbon assessment, biomass estimation, and the rapid development of remote sensing data and classification methods [4,5,6,22]. The keyword results also support this interpretation. In the CNKI dataset, high-frequency keywords such as remote sensing, blue carbon, carbon stock, coastal wetland, and landscape pattern indicate that mangrove monitoring has been closely linked with ecological function assessment and coastal wetland management. In the Web of Science author-keyword dataset, high-frequency keywords such as machine learning, remote sensing, deep learning, random forest, aboveground biomass, change detection, Google Earth Engine, and support vector machine indicate that intelligent algorithms, ecological parameter estimation, dynamic monitoring, and cloud-based geospatial analysis have become important drivers of research development.
The temporal evolution of keywords further suggests that the field has shifted from early image classification and distribution mapping toward object-based analysis, machine-learning-based classification, biomass estimation, ecological function assessment, and intelligent monitoring. Burst keywords such as image classification, support vector machine, object-based image analysis, leaf area index, ALOS PALSAR, decision tree, random forest, image segmentation, ecosystem services, forest degradation, aboveground biomass, ALOS-2 PALSAR-2, deep learning, and object-based image analysis show that changes in research hotspots are closely associated with the emergence of new data sources, classification algorithms, ecological assessment needs, and analytical methods. Therefore, the formation of research hotspots in mangrove remote sensing monitoring is driven by both ecological management needs and technological progress. On the one hand, mangroves are important blue carbon ecosystems with ecological values in carbon sequestration, coastal protection, and biodiversity conservation [30]. On the other hand, the increasing availability of Landsat, Sentinel, high-resolution optical imagery, SAR, hyperspectral, LiDAR, UAV data, Google Earth Engine, and other cloud-computing platforms has provided important technical support for mangrove spatial distribution extraction, dynamic monitoring, biomass estimation, and carbon stock assessment [13,31].

4.2. Differences in Thematic Emphasis Between CNKI and Web of Science

The comparison between CNKI and Web of Science should be interpreted with caution because the two databases differ in language coverage, indexing rules, journal selection, document types, and keyword standardization. Therefore, the two datasets should not be treated as fully equivalent representations of domestic and international research. In this study, CNKI mainly represents Chinese-language research records indexed by CNKI, whereas Web of Science represents internationally indexed publications, including studies by both Chinese and non-Chinese authors. Accordingly, comparisons between the two datasets are used to identify broad differences in thematic emphasis rather than to make direct quantitative judgments between domestic and international research systems.
The keyword frequency and centrality results show that the two datasets share several common concerns, including mangrove distribution identification, remote sensing classification, dynamic change monitoring, biomass estimation, carbon stock assessment, blue carbon, and ecological conservation. However, their thematic emphases differ. In the CNKI dataset, remote sensing had the highest frequency and centrality, while blue carbon, carbon stock, coastal wetland, and landscape pattern also showed relatively high frequency or centrality values. This suggests that CNKI-indexed studies are more closely associated with ecological function assessment, coastal wetland conservation, blue carbon accounting, and application-oriented monitoring [18,33].
In contrast, the Web of Science author-keyword dataset showed high-frequency keywords such as machine learning, remote sensing, deep learning, random forests, mangrove forests, aboveground biomass, blue carbon, change detection, Google Earth Engine, and support vector machines. These results suggest that WoS-indexed publications place relatively greater emphasis on intelligent algorithms, remote sensing data applications, image classification, biomass estimation, change detection, and cloud-based geospatial analysis [35,39]. This pattern may reflect differences in database coverage and research context. CNKI contains more Chinese-language studies linked to regional mangrove conservation, restoration, coastal wetland management, and blue carbon policy needs, whereas Web of Science includes a broader set of internationally indexed studies with stronger representation of methodological development and remote sensing algorithm applications. However, because WoS also includes many studies conducted by Chinese researchers, and CNKI does not cover all Chinese research outputs, these differences should be understood as dataset-specific thematic patterns rather than absolute domestic-international distinctions.

4.3. Limitations of Current Research and This Study

Although substantial progress has been made in mangrove remote sensing monitoring, several limitations can be identified from the bibliometric results. First, the increasing occurrence of keywords and burst terms such as ALOS PALSAR, Sentinel-2, UAV, hyperspectral data, LiDAR, Google Earth Engine, and multi-source remote sensing indicates that the field is moving toward integrated data use. However, the relatively low density of the keyword co-occurrence networks suggests that different technical themes remain somewhat dispersed. This implies that the integration of optical, radar, UAV, hyperspectral, LiDAR, and cloud-computing approaches still needs to be strengthened, especially for improving the comparability of monitoring results across regions, sensors, and time periods [4,5].
Second, although machine learning, random forest, support vector machine, object-based classification, and deep learning appeared as high-frequency or burst keywords, these methods are often discussed together with classification, accuracy, and specific data sources. This suggests that many studies still focus on improving classification performance in particular regions or datasets, while cross-regional transferability, model robustness, interpretability, and uncertainty assessment remain insufficiently represented. In coastal zones affected by tidal variation, cloud contamination, and mixed pixels, model performance may vary greatly across sensors, seasons, and geographic settings [27,53,59].
Third, the keyword and burst results show that dynamic change, change detection, vegetation index, and land-cover classification have long been important topics. However, studies on the driving mechanisms of mangrove dynamics remain relatively less visible than classification- and mapping-related topics. Existing research has focused more on detecting changes in area and spatial distribution, while the combined effects of sea-level rise, extreme weather events, human activities, aquaculture expansion, and restoration projects have not been fully examined. Remote sensing change results alone are insufficient to explain the underlying ecological and socio-environmental mechanisms of mangrove change [14,26].
In addition, the comparison between CNKI and Web of Science indicates that language coverage and database selection can influence the observed knowledge structure. CNKI-indexed records reflect many Chinese-language studies related to regional protection, restoration, and management practices, while WoS-indexed publications show stronger visibility in methodological and internationally indexed research. Future bibliometric studies should therefore further integrate multilingual databases and clarify database-specific biases to obtain a more comprehensive understanding of mangrove remote sensing research.
This study also has several limitations. First, the analysis was based on CNKI and Web of Science records, and publications indexed in other databases, such as Scopus, Google Scholar, or regional databases, were not included. Therefore, the results should be interpreted as patterns derived from the selected databases rather than a complete representation of all global publications. Second, although keyword variants were standardized before analysis, differences in database indexing rules, language, keyword usage, and translation may still influence keyword co-occurrence, clustering, and burst detection results. Third, CiteSpace results may be affected by parameter settings, such as time slicing, node selection criteria, and the g-index scale factor. Sensitivity analyses using alternative parameter settings were not conducted in this study. Finally, bibliometric analysis can reveal publication patterns and thematic evolution, but it cannot fully assess the methodological quality, ecological validity, or practical effectiveness of individual studies. These limitations should be considered when interpreting the findings.

4.4. Future Research Prospects

Future research directions can be derived from the observed keyword evolution, high-frequency author keywords, and burst patterns. First, multi-source remote sensing data integration should be further strengthened. The occurrence of keywords and related methodological themes such as ALOS PALSAR, ALOS-2 PALSAR-2, Sentinel-2, Sentinel-1, Landsat, LiDAR, UAV, Google Earth Engine, and object-based image analysis indicates that mangrove monitoring is shifting from single-sensor mapping toward multi-source and multi-scale observation. Future studies should pay more attention to cross-sensor consistency, tidal correction, cloud contamination, spatial resolution differences, and standardized validation procedures [12,15].
Second, intelligent algorithms should move beyond single-region classification accuracy. The prominence of machine learning, random forest, support vector machine, object-based image analysis, decision tree, image segmentation, and deep learning indicates that intelligent interpretation has become a major research frontier. However, future studies should strengthen cross-regional model generalization, sample transfer, model interpretability, and uncertainty assessment. This would improve the reliability of intelligent algorithms in practical ecological monitoring rather than limiting their application to individual case studies [23].
Third, long-term time-series monitoring and degradation mechanism analysis should be enhanced. The continued appearance of dynamic change, change detection, vegetation index, land-cover classification, forest degradation, and ecosystem services suggests that temporal monitoring and ecological process interpretation remain important topics. Future research should make greater use of long-term remote sensing archives to identify mangrove expansion, degradation, restoration, and fragmentation processes, and should combine remote sensing results with climate, hydrological, geomorphological, and human activity data to explain the driving mechanisms of observed changes [29].
Fourth, remote sensing monitoring should be more closely linked with ecological management needs. The prominence of blue carbon, carbon stock, aboveground biomass, conservation, coastal wetland, and ecosystem services indicates that mangrove remote sensing research is increasingly connected with ecological function assessment and management applications. Future work should further integrate remote sensing products with field surveys, ecological models, carbon accounting, restoration effectiveness evaluation, protected area management, and coastal risk prevention [17,18,29,58,60,61]. This would help transform mangrove remote sensing monitoring from spatial mapping toward decision-support-oriented ecological assessment.
Overall, mangrove remote sensing monitoring is gradually shifting from traditional spatial distribution extraction toward multi-source data fusion, the application of intelligent algorithms, ecological function assessment, and support for management decision-making. The results of this study suggest that future progress will depend not only on new sensors and algorithms but also on improving data comparability, model transferability, long-term monitoring capacity, uncertainty assessment, and the practical connection between remote sensing products and mangrove conservation management.

5. Conclusions

This study used 942 publications related to mangrove remote sensing monitoring from 2000 to 2025, including 485 records from CNKI and 457 records from Web of Science, as the data source. CiteSpace 6.4.R2 was applied to analyze publication trends, geographic distribution, author collaboration networks, keyword co-occurrence, keyword cluster timelines, and burst keywords. The results reveal the development trajectory, research hotspots, and thematic evolution of mangrove remote sensing monitoring.
First, research on mangrove remote sensing monitoring showed an overall increasing trend from 2000 to 2025, with a marked increase after 2015. This indicates that mangrove remote sensing has gradually become an important research direction in ecological remote sensing and coastal wetland studies. The geographic distribution of WoS-indexed publications showed regional concentration, with China and the United States as major contributors, while India, Australia, Japan, and several Southeast Asian countries also showed relatively high research activity.
Second, the author collaboration analysis showed that several local collaboration groups had formed in both datasets. However, the low network densities, small largest connected components, and near-zero betweenness centrality values of major authors indicate that collaboration was mainly concentrated within local groups, while connections among different groups remained limited. This suggests that cross-team, cross-regional, and interdisciplinary collaboration still needs to be strengthened.
Third, keyword co-occurrence and cluster timeline analyses showed that the main research themes include remote sensing applications, dynamic change monitoring, biomass estimation, carbon stock assessment, blue carbon, machine learning, deep learning, ALOS PALSAR, Google Earth Engine, and ecological function assessment. The CNKI keyword network contained 352 nodes and 680 links, while the Web of Science author-keyword network contained 393 nodes and 778 links. CNKI-indexed records showed relatively stronger links to blue carbon, carbon stock, coastal wetlands, landscape pattern, mangrove wetland, and ecological conservation, whereas WoS-indexed author keywords showed greater emphasis on machine learning, deep learning, random forest, support vector machine, Google Earth Engine, aboveground biomass, and change detection. These differences should be interpreted as database-specific thematic emphases rather than a strict application-versus-technology division.
Fourth, the keyword cluster timeline networks showed acceptable clustering quality. The modularity Q and weighted mean silhouette S values were 0.6585 and 0.916 for CNKI, and 0.6693 and 0.8697 for the Web of Science author-keyword network, respectively. These results indicate that the thematic structures of both datasets were suitable for interpreting hotspot evolution. The burst keyword analysis based on Web of Science author keywords further revealed stage-specific changes, from basic image classification and distribution identification to object-based analysis and machine-learning-based classification, and eventually to intelligent monitoring, biomass estimation, blue carbon assessment, and ecological function evaluation. However, the interpretation of the recent period was based on the combined evidence from burst keywords and high-frequency author keywords rather than burst detection alone.
Overall, this study addresses the gap identified in the Introduction by providing a systematic bibliometric overview of mangrove remote sensing monitoring based on CNKI and Web of Science records from 2000 to 2025. The findings clarify how publication output, author collaboration, thematic structure, and research hotspots have evolved, and reveal database-specific differences between Chinese-language and internationally indexed publications. These results strengthen the understanding of the knowledge structure and research frontiers of mangrove remote sensing monitoring, and suggest that future work should move toward more comparable, transferable, and management-oriented monitoring frameworks supported by robust validation, uncertainty assessment, degradation indicator construction, and ecological decision-support needs.

Supplementary Materials

The following supporting information can be downloaded at https://www.mdpi.com/article/10.3390/f17080879/s1, Supplementary Data: Cleaned bibliographic records from CNKI and Web of Science used for CiteSpace analysis, together with the English-only supplementary version of the cleaned CNKI records and the README file describing the supplementary dataset.

Author Contributions

Conceptualization, Y.L. and Q.Z.; methodology, Q.Z. and Y.L.; software, Q.Z.; validation, D.L. and Y.L.; formal analysis, Q.Z. and D.L.; investigation, Q.Z. and Y.L.; resources, Y.L. and D.L.; data curation, Y.L.; writing—original draft preparation, Y.L. and Q.Z.; writing—review and editing, Q.Z. and Y.L.; visualization, D.L. and Q.Z.; supervision, D.L. and Y.L.; project administration, Y.L.; funding acquisition, Y.L. All authors have read and agreed to the published version of the manuscript.

Funding

This research received no external funding.

Institutional Review Board Statement

This study did not involve humans or animals.

Informed Consent Statement

This study did not involve human participants.

Data Availability Statement

The bibliographic datasets used in this study, including the processed CNKI and Web of Science records for CiteSpace analysis, are provided as Supplementary Materials.

Acknowledgments

The authors acknowledge support received during data preparation and workflow testing. During the preparation and revision of this manuscript, the authors used OpenAI ChatGPT (OpenAI, San Francisco, CA, USA) for language polishing, improving clarity of expression, consistency checking, formatting of response text, and assistance with script drafting for data checking and keyword standardization. The authors reviewed and edited the output and take full responsibility for the content of this publication.

Conflicts of Interest

The authors declare no conflicts of interest.

References

  1. Giri, C.; Ochieng, E.; Tieszen, L.L.; Zhu, Z.; Singh, A.; Loveland, T.; Masek, J.; Duke, N. Status and distribution of mangrove forests of the world using earth observation satellite data. Glob. Ecol. Biogeogr. 2011, 20, 154–159. [Google Scholar]
  2. Donato, D.C.; Kauffman, J.B.; Murdiyarso, D.; Kurnianto, S.; Stidham, M.; Kanninen, M. Mangroves among the most carbon-rich forests in the tropics. Nat. Geosci. 2011, 4, 293–297. [Google Scholar] [CrossRef]
  3. Alongi, D.M. Carbon cycling and storage in mangrove forests. Annu. Rev. Mar. Sci. 2014, 6, 195–219. [Google Scholar] [CrossRef]
  4. Kuenzer, C.; Bluemel, A.; Gebhardt, S.; Quoc, T.V.; Dech, S. Remote sensing of mangrove ecosystems: A review. Remote Sens. 2011, 3, 878–928. [Google Scholar] [CrossRef]
  5. Pham, T.D.; Yokoya, N.; Bui, D.T.; Yoshino, K.; Friess, D.A. Remote sensing approaches for monitoring mangrove species, structure, and biomass: Opportunities and challenges. Remote Sens. 2019, 11, 230. [Google Scholar] [CrossRef]
  6. Bunting, P.; Rosenqvist, A.; Lucas, R.M.; Rebelo, L.M.; Hilarides, L.; Thomas, N.; Hardy, A.; Itoh, T.; Shimada, M.; Finlayson, C.M. The Global Mangrove Watch: A new 2010 global baseline of mangrove extent. Remote Sens. 2018, 10, 1669. [Google Scholar] [CrossRef]
  7. Sun, Y.G.; Zhao, D.Z.; Guo, W.Y.; Gao, Y.; Su, X.; Wei, B.Q. A review on the application of remote sensing in mangrove ecosystem monitoring. Acta Ecol. Sin. 2013, 33, 4523–4538. (In Chinese) [Google Scholar] [CrossRef]
  8. Zhou, Z.C.; Li, H.; Huang, C.; Liu, Q.S.; Liu, G.H.; He, Y.; Yu, H. Review on dynamic monitoring of mangrove forestry using remote sensing. J. Geo-Inf. Sci. 2018, 20, 1631–1643. (In Chinese) [Google Scholar]
  9. Maurya, K.; Mahajan, S.; Chaube, N. Remote sensing techniques: Mapping and monitoring of mangrove ecosystem: A review. Complex Intell. Syst. 2021, 7, 2797–2818. [Google Scholar] [CrossRef]
  10. Hu, T.; Zhang, Y.; Su, Y.; Zheng, Y.; Lin, G.; Guo, Q. Mapping the global mangrove forest aboveground biomass using multisource remote sensing data. Remote Sens. 2020, 12, 1690. [Google Scholar] [CrossRef]
  11. Wang, D.; Wan, B.; Liu, J.; Su, Y.; Guo, Q.; Qiu, P.; Wu, X. Estimating aboveground biomass of mangrove forests using field plots, UAV-LiDAR data and Sentinel-2 imagery. Int. J. Appl. Earth Obs. Geoinf. 2020, 85, 101986. [Google Scholar] [CrossRef]
  12. Li, Q.; Wong, F.K.K.; Fung, T. Mapping multi-layered mangroves from multispectral, hyperspectral, and LiDAR data. Remote Sens. Environ. 2021, 258, 112403. [Google Scholar] [CrossRef]
  13. Cao, J.; Leng, W.; Liu, K.; Liu, L.; He, Z.; Zhu, Y. Object-based mangrove species classification using unmanned aerial vehicle hyperspectral images and digital surface models. Remote Sens. 2018, 10, 89. [Google Scholar] [CrossRef]
  14. Shen, Z.; Miao, J.; Wang, J.; Zhao, D.; Tang, A.; Zhen, J. Evaluating feature selection methods and machine learning algorithms for mapping mangrove forests using optical and synthetic aperture radar data. Remote Sens. 2023, 15, 5621. [Google Scholar] [CrossRef]
  15. Xu, W.; Ouyang, X.; Xiao, X.; Hong, Y.; Zhang, Y.; Xu, Z.; Kwon, B.O.; Yang, Z. A review of applying drones and remote sensing technology in mangrove ecology. Forests 2025, 16, 870. [Google Scholar] [CrossRef]
  16. Wang, J.J.; Li, Q.Q.; Wu, G.F. Research progress on quantitative remote sensing of mangroves. Natl. Remote Sens. Bull. 2025, 29, 1769–1787. (In Chinese) [Google Scholar] [CrossRef]
  17. Roy, A.D.; Arachchige, P.S.P.; Watt, M.S.; Kale, A.; Davies, M.; Heng, J.E.; Daneil, R.; Galgamuwa, G.A.P.; Moussa, L.G.; Timsina, K.; et al. Remote sensing-based mangrove blue carbon assessment in the Asia-Pacific: A systematic review. Sci. Total Environ. 2024, 938, 173270. [Google Scholar] [CrossRef]
  18. Deng, S.W.; Yang, F.; Wang, Y.H.; Zhang, W.; Wang, W.H. Research progress on remote sensing monitoring of mangrove carbon pools. Natl. Remote Sens. Bull. 2024, 28, 2448–2468. (In Chinese) [Google Scholar] [CrossRef]
  19. Chen, C. CiteSpace II: Detecting and visualizing emerging trends and transient patterns in scientific literature. J. Am. Soc. Inf. Sci. Technol. 2006, 57, 359–377. [Google Scholar] [CrossRef]
  20. Chen, C. Science mapping: A systematic review of the literature. J. Data Inf. Sci. 2017, 2, 1–40. [Google Scholar] [CrossRef]
  21. Page, M.J.; McKenzie, J.E.; Bossuyt, P.M.; Boutron, I.; Hoffmann, T.C.; Mulrow, C.D.; Shamseer, L.; Tetzlaff, J.M.; Akl, E.A.; Brennan, S.E.; et al. The PRISMA 2020 statement: An updated guideline for reporting systematic reviews. BMJ 2021, 372, n71. [Google Scholar] [CrossRef] [PubMed]
  22. Heumann, B.W. Satellite remote sensing of mangrove forests: Recent advances and future opportunities. Prog. Phys. Geogr. 2011, 35, 87–108. [Google Scholar] [CrossRef]
  23. Wang, D.; Wan, B.; Qiu, P.; Su, Y.; Guo, Q.; Wang, R.; Sun, F.; Wu, X. Evaluating the performance of Sentinel-2, Landsat 8 and Pleiades-1 in mapping mangrove extent and species. Remote Sens. 2018, 10, 1468. [Google Scholar] [CrossRef]
  24. Son, N.T.; Chen, C.F.; Chang, N.B.; Chen, C.R.; Chang, L.Y.; Thanh, B.X. Mangrove mapping and change detection in Ca Mau Peninsula, Vietnam, using Landsat data and object-based image analysis. IEEE J. Sel. Top. Appl. Earth Obs. Remote Sens. 2015, 8, 503–510. [Google Scholar] [CrossRef]
  25. Nascimento, W.R.; Souza-Filho, P.W.M.; Proisy, C.; Lucas, R.M.; Rosenqvist, A. Mapping changes in the largest continuous Amazonian mangrove belt using object-based classification of multisensor satellite imagery. Estuar. Coast. Shelf Sci. 2013, 117, 83–93. [Google Scholar] [CrossRef]
  26. Heumann, B.W. An object-based classification of mangroves using a hybrid decision tree-support vector machine approach. Remote Sens. 2011, 3, 2440–2460. [Google Scholar] [CrossRef]
  27. Wang, D.; Wan, B.; Qiu, P.; Su, Y.; Guo, Q.; Wu, X. Artificial mangrove species mapping using Pleiades-1: An evaluation of pixel-based and object-based classifications with selected machine learning algorithms. Remote Sens. 2018, 10, 294. [Google Scholar] [CrossRef]
  28. Luo, Y.; Huang, D.; Liu, P.; Feng, H. An novel random forests and its application to the classification of mangroves remote sensing image. Multimed. Tools Appl. 2016, 75, 9707–9722. [Google Scholar]
  29. Pham, T.D.; Ha, N.T.; Saintilan, N.; Skidmore, A.; Phan, D.C.; Le, N.N.; Viet, H.L.; Takeuchi, W.; Friess, D.A. Advances in Earth observation and machine learning for quantifying blue carbon. Earth-Sci. Rev. 2023, 243, 104501. [Google Scholar] [CrossRef]
  30. Spalding, M.; Kainuma, M.; Collins, L. World Atlas of Mangroves; Earthscan: London, UK, 2010. [Google Scholar]
  31. Pham, T.D.; Xia, J.; Ha, N.T.; Bui, D.T.; Le, N.N.; Takeuchi, W. A review of remote sensing approaches for monitoring blue carbon ecosystems: Mangroves, seagrasses and salt marshes during 2010–2018. Sensors 2019, 19, 1933. [Google Scholar] [CrossRef] [PubMed]
  32. Araya-Lopez, R.; Costa, M.D.D.; Wartman, M.; Macreadie, P.I. Trends in the application of remote sensing in blue carbon science. Ecol. Evol. 2023, 13, e10559. [Google Scholar] [CrossRef] [PubMed]
  33. Zhang, L.; Guo, Z.H.; Li, Z.Y. Research progress on carbon storage and carbon sink of mangrove wetlands. Chin. J. Appl. Ecol. 2013, 24, 1153–1159. (In Chinese) [Google Scholar]
  34. Dai, Z.Y.; Liao, L.R.; Liang, J.H.; Wu, M.Y.; Zuo, P. Analysis of blue carbon storage changes of mangroves in Beihai, Guangxi from 1988 to 2018. Mar. Environ. Sci. 2022, 41, 8–23. (In Chinese) [Google Scholar]
  35. De Santiago, F.F.; Kovacs, J.M.; Lafrance, P. An object-oriented classification method for mapping mangroves in Guinea, West Africa, using multipolarized ALOS PALSAR L-band data. Int. J. Remote Sens. 2013, 34, 563–586. [Google Scholar]
  36. Pham, T.D.; Yoshino, K.; Bui, D.T. Biomass estimation of Sonneratia caseolaris at a coastal area of Hai Phong city, Vietnam, using ALOS-2 PALSAR imagery and GIS-based multi-layer perceptron neural networks. GISci. Remote Sens. 2017, 54, 329–353. [Google Scholar]
  37. Pham, T.D.; Yoshino, K.; Le, N.N.; Bui, D.T. Estimating aboveground biomass of a mangrove plantation on the northern coast of Vietnam using machine learning techniques with an integration of ALOS-2 PALSAR-2 and Sentinel-2A data. Int. J. Remote Sens. 2018, 39, 7761–7788. [Google Scholar] [CrossRef]
  38. Xiao, W.S.; Wang, X.Q.; Ling, F.L. Application of ALOS PALSAR data in mangrove extraction at Zhangjiang Estuary. Remote Sens. Technol. Appl. 2010, 25, 91–96. (In Chinese) [Google Scholar]
  39. Castillo, J.A.A.; Apan, A.A.; Maraseni, T.N.; Salmo, S.G. Estimation and mapping of above-ground biomass of mangrove forests and their replacement land uses in the Philippines using Sentinel imagery. ISPRS J. Photogramm. Remote Sens. 2017, 134, 70–85. [Google Scholar] [CrossRef]
  40. Pham, T.D.; Yokoya, N.; Xia, J.; Ha, N.T.; Le, N.N.; Nguyen, T.T.T.; Dao, T.H.; Vu, T.T.P.; Takeuchi, W. Comparison of machine learning methods for estimating mangrove above-ground biomass using multiple source remote sensing data in the Red River Delta Biosphere Reserve, Vietnam. Remote Sens. 2020, 12, 1334. [Google Scholar] [CrossRef]
  41. Tian, Y.; Huang, H.; Zhou, G.; Zhang, Q.; Tao, J.; Zhang, Y.; Lin, J. Aboveground mangrove biomass estimation in Beibu Gulf using machine learning and UAV remote sensing. Sci. Total Environ. 2021, 781, 146816. [Google Scholar] [CrossRef]
  42. Huang, Z.M.; Tian, Y.C.; Zhang, Q.; Huang, Y.J.; Liu, R.D.; Huang, H.; Zhou, G.Q.; Wang, J.Z.; Tao, J.; Yang, Y.W.; et al. Estimating mangrove above-ground biomass at Maowei Sea, Beibu Gulf of China using machine learning algorithm with Sentinel-1 and Sentinel-2 data. Geocarto Int. 2022, 37, 15778–15805. [Google Scholar] [CrossRef]
  43. Luo, J.X.; Tian, Y.C.; Zhang, Q.; Tao, J.; Huang, Y.J.; Wang, J.Z.; Zhang, Y.L.; Huang, Z.M.; Deng, J.W.; Tan, Y.X. Estimating mangrove aboveground biomass using UAV-LiDAR. Acta Oceanol. Sin. 2023, 45, 108–119. (In Chinese) [Google Scholar]
  44. Hu, K.J.; Wang, W.; Qian, W.; Jiang, Z.M.; Xiong, Y.M. Carbon accumulation rates of mangrove vegetation and soil in China and their influencing factors. Chin. J. Appl. Ecol. 2025, 36, 121–131. (In Chinese) [Google Scholar]
  45. Tang, L.D.; Zhang, W.; Deng, S.W.; Wang, Y.H. Remote sensing classification of mangrove species and biological carbon storage changes based on combined vegetation indices. Guangxi Sci. 2024, 31, 541–553. (In Chinese) [Google Scholar]
  46. Hu, L.L.; Tan, M.; Luo, Q.; Huang, Z.J.; Xiang, X.L.; Li, B.H.; Yu, S.X.; Wu, Z.F.; Yang, Q.; Hu, P. Interannual changes of mangrove carbon storage in Futian based on WorldView-3 remote sensing images. Guihaia 2024, 44, 1403–1414. (In Chinese) [Google Scholar]
  47. Kang, B.Y.; Li, J.X.; Ning, Y.L.; Li, H.Y. Application progress of machine learning in quantifying coastal blue carbon stocks. Acta Ecol. Sin. 2025, 45, 5075–5089. (In Chinese) [Google Scholar]
  48. Kamal, M.; Phinn, S. Hyperspectral data for mangrove species mapping: A comparison of pixel-based and object-based approach. Remote Sens. 2011, 3, 2222–2242. [Google Scholar] [CrossRef]
  49. Zhang, R.; Jia, M.; Wang, Z.; Zhou, Y.; Wen, X.; Tan, Y.; Cheng, L. A comparison of Gaofen-2 and Sentinel-2 imagery for mapping mangrove forests using object-oriented analysis and random forest. IEEE J. Sel. Top. Appl. Earth Obs. Remote Sens. 2021, 14, 4185–4193. [Google Scholar] [CrossRef]
  50. Lassalle, G.; Ferreira, M.P.; La Rosa, L.E.C.; Scafutto, R.D.M.; de Souza, C.R. Advances in multi- and hyperspectral remote sensing of mangrove species: A synthesis and study case on airborne and multisource spaceborne imagery. ISPRS J. Photogramm. Remote Sens. 2023, 195, 298–312. [Google Scholar] [CrossRef]
  51. Li, X.; Ye, J.A.; Wang, S.G.; Liu, K.; Liu, X.P.; Qian, J.P.; Chen, X.Y.; He, Z.J.; Qin, C.F. Radar remote sensing estimation of mangrove wetland vegetation biomass. J. Remote Sens. 2006, 10, 387–396. (In Chinese) [Google Scholar]
  52. Pham, L.T.H.; Brabyn, L. Monitoring mangrove biomass change in Vietnam using SPOT images and an object-based approach combined with machine learning algorithms. ISPRS J. Photogramm. Remote Sens. 2017, 128, 86–97. [Google Scholar] [CrossRef]
  53. Ghosh, S.M.; Behera, M.D. Aboveground biomass estimates of tropical mangrove forest using Sentinel-1 SAR coherence data: The superiority of deep learning over a semi-empirical model. Comput. Geosci. 2021, 150, 104737. [Google Scholar] [CrossRef]
  54. Win, K.S.; Sasaki, J. The change detection of mangrove forests using deep learning with medium-resolution satellite imagery: A case study of Wunbaik Mangrove Forest in Myanmar. Remote Sens. 2024, 16, 4077. [Google Scholar] [CrossRef]
  55. Ou, J.; Tian, Y.; Zhang, Q.; Xie, X.; Zhang, Y.; Tao, J.; Lin, J. Coupling UAV hyperspectral and LiDAR data for mangrove classification using XGBoost in China’s Pinglu Canal Estuary. Forests 2023, 14, 1838. [Google Scholar] [CrossRef]
  56. Zhu, Y.; Liu, K.; Liu, L.; Myint, S.W.; Wang, S.; Cao, J.; Wu, Z. Estimating and mapping mangrove biomass dynamic change using WorldView-2 images and digital surface models. IEEE J. Sel. Top. Appl. Earth Obs. Remote Sens. 2020, 13, 2123–2134. [Google Scholar] [CrossRef]
  57. Jiang, Y.; Zhang, L.; Yan, M.; Qi, J.; Fu, T.; Fan, S.; Chen, B. High-resolution mangrove forests classification with machine learning using WorldView and UAV hyperspectral data. Remote Sens. 2021, 13, 1529. [Google Scholar] [CrossRef]
  58. Abu Bakar, N.A.; Jaafar, W.S.W.M.; Maulud, K.N.A.; Kamarulzaman, A.M.M.; Saad, S.N.M.; Mohan, M. Monitoring mangrove-based blue carbon ecosystems using UAVs: A review. Geocarto Int. 2024, 39, 2405123. [Google Scholar] [CrossRef]
  59. Xia, Q.; Li, J.; Dai, S.; Zhang, H.; Xing, X. Remote sensing mapping of Chinese mangroves using GF-2 images considering tidal effects. Natl. Remote Sens. Bull. 2023, 27, 1320–1333. (In Chinese) [Google Scholar]
  60. Zhao, C.; Jia, M.; Zhang, R.; Wang, Z.; Ren, C.; Mao, D.; Wang, Y. Mangrove species mapping in coastal China using synthesized Sentinel-2 high-separability images. Remote Sens. Environ. 2024, 307, 114151. [Google Scholar] [CrossRef]
  61. Gao, W.; Lu, C.; Yang, N.; Wu, Y.; Wu, K.; Chen, Z. Cross-border mangrove dynamics and management in the Beibu Gulf: Long-term remote sensing observation using object-oriented deep learning. Ecol. Indic. 2025, 170, 113113. [Google Scholar] [CrossRef]
Figure 1. Annual and cumulative numbers of publications on mangrove remote sensing monitoring from 2000 to 2025 based on two bibliographic databases: (a) CNKI; (b) Web of Science.
Forests 17 00879 g001
Figure 2. Geographic distribution of Web of Science-indexed publications on mangrove remote sensing monitoring from 2000 to 2025. The map was generated using Datawrapper based on the proportion of publications contributed by each country/region. Darker colors indicate higher relative publication output.
Forests 17 00879 g002
Figure 3. Author collaboration networks in mangrove remote sensing monitoring research during 2000–2025: (a) Web of Science; (b) CNKI. Dots represent authors, dot size indicates the number of publications by each author, and lines indicate co-authorship relationships. Colors represent different time slices in the CiteSpace visualization. The names shown in the figure are author names extracted from the bibliographic records and do not correspond to specific reference numbers.
Forests 17 00879 g003
Figure 4. Keyword co-occurrence networks of mangrove remote sensing monitoring research during 2000–2025: (a) CNKI; (b) Web of Science. Dots represent keywords, dot size indicates keyword frequency, and lines indicate keyword co-occurrence relationships. Colors represent the time slices in which the keywords appeared in the CiteSpace visualization.
Forests 17 00879 g004
Figure 5. Timeline view of keyword clusters in mangrove remote sensing monitoring research during 2000–2025: (a) CNKI; (b) Web of Science. Dots represent keywords, dot size indicates keyword frequency, and lines indicate keyword co-occurrence relationships. The labels beginning with “#” denote cluster numbers automatically generated by CiteSpace and do not indicate ranking.
Forests 17 00879 g005
Figure 6. Top 17 keywords with the strongest citation bursts in mangrove remote sensing monitoring research from 2000–2025 based on Web of Science author keywords. Red bars indicate the burst periods, while light cyan bars indicate non-burst periods within the study period. Burst detection was conducted with γ = 0.35 and a minimum duration of 2 years.
Forests 17 00879 g006
Table 1. Screening process of literature records used in this study.
Screening StepCNKIWeb of ScienceTotal
Initial records in deposited files6604651125
Records outside 2000–2025 or without publication year84791
Duplicate records by title19120
Records weakly related to mangrove remote sensing72072
Final records retained for analysis485457942
Table 2. Main CiteSpace parameter settings used in this study.
ParameterSetting
SoftwareCiteSpace 6.4.R2, 64-bit Advanced
Data sourcesCNKI; Web of Science Core Collection
Time span2000–2025
Years per slice1
Node typesAuthor; Keyword
Selection criteriag-index, k = 25
LRF2.5
L/N10
LBY5
e1.0
PruningNone
Node labels1.0%
Burst detectionKleinberg burst detection algorithm
Cluster labelingLLR algorithm
Table 3. Representative high-frequency keywords in the CNKI and Web of Science keyword co-occurrence networks.
DatabaseKeywordFrequencyCentralityYear
CNKIRemote sensing630.482001
CNKIBlue carbon340.182014
CNKICarbon stock300.202012
CNKICoastal wetland300.262005
CNKILandscape pattern210.232005
CNKIGoogle Earth Engine150.042019
CNKIKandelia candel150.162000
CNKIDynamic change130.052001
CNKIMangrove wetland130.092000
CNKICoastal zone120.072009
Web of ScienceMachine learning880.302017
Web of ScienceRemote sensing790.382003
Web of ScienceDeep learning420.082019
Web of ScienceRandom forest360.132015
Web of ScienceMangrove forest260.122002
Web of ScienceAboveground biomass220.082018
Web of ScienceBlue carbon120.012019
Web of ScienceChange detection110.052008
Web of ScienceGoogle Earth Engine110.042019
Web of ScienceSupport vector machine90.032011
Note: CNKI keywords were translated from Chinese into English for consistency.
Table 4. High-frequency author keywords in mangrove remote sensing monitoring at different stages based on the Web of Science database.
YearsHigh-Frequency Author Keywords (Frequency)
2000–2010remote sensing (3)image classification (2)IKONOS (2)
coastal habitats (2)environmental quality monitoring (1)hyper-spectrum nerve network (1)
landscape characteristics (1)coral reefs (1)ecology (1)
fish community (1)habitat (1)machine learning (1)
2011–2018object-based image analysis (11)random forest (7)remote sensing (7)
support vector machine (7)ALOS PALSAR (5)WorldView-2 (4)
object-based (4)Landsat (4)machine learning (3)
hyperspectral remote sensing (2)biomass (2)variable importance (2)
2019–2025machine learning (87)remote sensing (70)deep learning (42)
random forest (32)Sentinel-2 (31)aboveground biomass (24)
Google Earth Engine (17)Landsat (15)blue carbon (12)
object-based image analysis (12)Sentinel-1 (11)LiDAR (11)
Note: The table is based on Web of Science author keywords only. Keyword variants were standardized before counting. The 2000–2010 stage contained relatively few records with author keywords; therefore, the high-frequency keywords in this stage should be interpreted as descriptive indicators rather than stable thematic patterns.
Disclaimer/Publisher’s Note: The statements, opinions and data contained in all publications are solely those of the individual author(s) and contributor(s) and not of MDPI and/or the editor(s). MDPI and/or the editor(s) disclaim responsibility for any injury to people or property resulting from any ideas, methods, instructions or products referred to in the content.