Article

Climate Change May Drive the Distribution and Richness Patterns of Global Pinus L.

1
Research Center for Engineering Ecology and Nonlinear Science, North China Electric Power University, Beijing 102206, China
2
Theoretical Ecology and Engineering Ecology Research Group, School of Life Sciences, Shandong University, Qingdao 266237, China
*
Author to whom correspondence should be addressed.
Forests 2026, 17(8), 865; https://doi.org/10.3390/f17080865
Submission received: 17 June 2026 / Revised: 22 July 2026 / Accepted: 22 July 2026 / Published: 24 July 2026
(This article belongs to the Special Issue Species Diversity and Habitat Conservation in Forest)

Abstract

Climate change has significantly affected the geographical distribution and richness patterns of plant species worldwide. Pinus is a major component of many temperate and montane forests in the Northern Hemisphere and is important for carbon storage, climatic buffering and timber production. Here, we utilized the MaxEnt model and integrated global occurrence records of 113 Pinus species, predicting climatic envelopes and diversity distribution patterns under three emission scenarios for the 2050s and 2070s, while also identifying diversity hotspots, high-decline regions, and conservation gaps. As global overheating and linked climatic variations intensify, climatically suitable areas for Pinus are projected to shift poleward. Using projected climatic envelope contraction as a screening criterion, 7.96%–44.25% of species qualified as climate-vulnerable across scenarios. Additionally, Pinus demonstrates high species richness in North America, the Mediterranean region, and mid-latitude mountainous regions of East Asia. Our predictions reveal that species richness distribution will be notably influenced by climate change, with impacts gradually intensifying as climate change progresses. Fortunately, the current coverage rate of protected areas in diversity hotspots exceeds 92.31%, and the conservation gaps primarily occur in Mexico. It is anticipated that over 86.46% of hotspot areas will remain protected in the future. However, new conservation gaps may arise in eastern North America and southeastern Europe; these regions should be prioritized in future conservation planning. Our research enhances current understanding of how species might respond to the challenges of climate change while also providing practical guidance for priority conservation planning targeting both biodiversity hotspots and high-decline regions.

1. Introduction

Between 2011 and 2020, the global surface temperature was 1.1 °C higher relative to the pre-industrial baseline in 1850–1900 [1]. Numerous studies have shown that climate change may significantly affect the distribution and adaptability of plant species worldwide [2,3,4,5]. Extreme heat and related climatic factors have also been predicted to cause some species to migrate toward cooler regions with more suitable climates [6,7,8]. When the migration rate of plants fails to keep pace with climate change, it will result in a decrease in climatic envelopes for various species, subsequently leading to a decline in biodiversity [9,10,11]. The IUCN Red List shows that over 46,300 species currently face the threat of extinction, accounting for approximately 28% of all species assessed [12]. In this context, predicting the potential geographical distribution and spatial changes in the richness of species due to climate change has become a critical topic within the fields of biogeography, global change ecology, and biodiversity conservation [13,14,15].
As a powerful tool for predicting the potential geographical ranges of species under climate change, species distribution models (SDMs) play an important role in researching species’ climate envelope shifts and conservation planning [16,17,18,19]. Common SDM algorithms include generalized linear models, boosted regression trees, random forests and ensemble models. Among these models, the maximum entropy (MaxEnt) model is particularly prevalent in ecology, biogeography, and conservation biology studies, as it requires presence-only data and maintains high predictive accuracy even with limited sample sizes [20,21]. Consequently, the prediction and analysis of climatic envelopes and diversity for plants, based on the MaxEnt model combined with large-scale climate data, can enhance our understanding of their ecological requirements and reveal the evolutionary distribution within their potential range [15,22,23]. This is important for comprehending how species might effectively respond to the challenges posed by climate change, and will also support priority planning for biodiversity conservation.
Studies indicate that climate change may lead to the decline of most coniferous forests [24]. Pinus is the largest genus of conifers, comprising 113 species globally [25,26]. These species are naturally found across North America, Europe, and Asia, where they often dominate most of the vegetation in the Northern Hemisphere [25]. Additionally, many cultivated species of Pinus have been introduced in the Southern Hemisphere due to their high economic value [27,28]. Pinus species are essential for determining both regional and global climates, demonstrating significant sensitivity to climate change [26,29]. Research has confirmed that climate change will affect the geographic distribution of Pinus and modify its spread rate [23,30,31,32]. Given the important ecological and economic value of this genus, it is essential to anticipate the effects of impending global climate change on the geographical ranges and diversity of Pinus, as well as to develop effective and targeted conservation policies.
In this study, we utilized the MaxEnt model, integrating precise sample records and bioclimatic factors from various periods to investigate the climatic envelope dynamics, species richness patterns, and conservation status of 113 Pinus species worldwide in the context of current and future climate change. Specifically, we aimed to (a) identify key predictor variables that influence the global geographical distribution patterns of Pinus species and their potential responses to these variables; (b) assess the impact of climate change on both current and future climatic envelope distributions of Pinus species, as well as the threat level faced by each tree species; (c) explore the richness distribution pattern characteristics of Pinus species under current climate conditions and predict potential richness distribution and spatial changes influenced by climate change; and (d) identify current and future diversity hotspots and high-decline regions of global Pinus while evaluating their conservation effects based on existing nature reserves. Pinus diversity hotspots are defined as grid cells with the highest co-occurring Pinus species richness. By forecasting how climate change influences the distribution and diversity patterns of Pinus, we aim to deepen our comprehension of the biogeographical traits of this genus and develop targeted priority conservation strategies to mitigate the potential impacts of climate change on Pinus. Our findings have significant implications for the effective conservation of Pinus biodiversity.

2. Materials and Methods

2.1. Species Distribution Data

The global distribution data for Pinus species were collected from the BRAHMS database (https://herbaria.plants.ox.ac.uk/bol/conifers/, accessed 28 May 2024) and the Global Biodiversity Information Facility (GBIF, https://www.gbif.org/, accessed 27 May 2024). We evaluated and cleaned GBIF records by removing zero coordinates, oceanic points, records with low positional accuracy, taxonomic ambiguities, and duplicates. To reduce spatial autocorrelation and uneven sampling intensity, one record per species was retained in each 10 × 10 km grid cell [33]. After sorting and screening, we finally retained a total of 112,693 occurrence records of 113 Pinus species worldwide, with subspecies and varieties merged into their corresponding species (Table S1). According to the IUCN Red List of Threatened Species (https://www.iucnredlist.org/), there are two Critically Endangered (CR) species, nine Endangered (EN) species, seven Vulnerable (VU) species, and 15 Near Threatened (NT) species (Table S1).

2.2. Environmental Variables

At a global macro-spatial scale, we hypothesize that climate acts as a dominant driver shaping species distribution patterns [34]. We obtained data on 19 bioclimatic variables from WorldClim (version 2.1, http://www.worldclim.org/). This dataset provides global bioclimatic data covering 1970–2000, as well as future climate projections at a spatial resolution of 5 arcminutes. We detail all bioclimatic variables utilized in this study in Table S2. Future climate data are derived from the Shared Socioeconomic Pathways (SSPs) outlined in the Sixth Assessment Report (AR6) released by the Intergovernmental Panel on Climate Change (IPCC). To address projection uncertainty arising from differences in climate models and scenarios, we averaged outputs from three General Circulation Models (GCMs) before modeling, including BCC-CSM2-MR (Beijing Climate Center, Beijing, China), HadGEM3-GC31-LL (Met Office Hadley Centre, Exeter, UK), and IPSL-CM6A-LR (Institut Pierre-Simon Laplace, Paris, France). For each GCM, we selected two time periods (2041–2060 and 2061–2080) and three climate change scenarios. SSP-126, SSP-245, and SSP-585 represent low, medium, and high-forcing scenarios, respectively.

2.3. Species Distribution Models

We mainly implemented the MaxEnt model (version 3.4.1) to assess the impacts of climate change on the current and future climatic envelopes of the entire Pinus genus and its constituent species [35]. Multicollinearity among the 19 bioclimatic variables may trigger overfitting during species distribution modeling. We therefore implemented the Jackknife method to quantify the relative importance of each predictor for Pinus distribution models. Subsequently, we performed Pearson correlation analysis to further screen the variables (Table S3). If the correlation coefficient between any pair of variables is greater than 0.8, we eliminated the variables with lower importance to the prediction. Finally, we identified ten bioclimatic variables that are essential for predicting the potential distribution of the entire Pinus genus. These include temperature variables—BIO1 (annual mean temperature), BIO2 (mean diurnal range), BIO3 (isothermality), BIO5 (max temperature of warmest month), and BIO8 (mean temperature of wettest quarter)—as well as precipitation variables: BIO12 (annual precipitation), BIO15 (precipitation seasonality), BIO17 (precipitation of driest quarter), BIO18 (precipitation of warmest quarter), and BIO19 (precipitation of coldest quarter).
For model construction, we allocated 75% of the distribution data to training, and the remaining 25% for testing via MaxEnt’s native random subsampling function. To enhance the robustness of our modeling results, we employed a cross-validation approach and conducted 10 replicates to derive more reliable outcomes. No spatial segregation was performed between training and testing subsets, as random partitioning represents the default built-in setting of MaxEnt replicates. The area under the receiver operating characteristic curve (AUC) was used to assess the predictive accuracy of the models. AUC values were classified as follows: poor (0.5–0.6), fair (0.6–0.7), good (0.7–0.8), very good (0.8–0.9), and excellent (0.9–1.0) [36]. A higher AUC value indicates superior model performance [35]. We summarized all replicate runs to generate the final prediction.
Under different climate scenarios, the output values of the potential climatic envelope for the entire Pinus genus ranged from 0 to 1 and were binarized (presence/absence) using the maximum training sensitivity plus specificity logistic threshold (MTSPS = 0.3587) [37]. These potential climatic envelope layers were further categorized into four classes, namely “highly suitable” (0.6–1.0), “moderately suitable” (0.4–0.6), “poorly suitable” (MTSPS–0.4), and “unsuitable” (<MTSPS) [38]. To ensure comparability, identical thresholds were applied to classify the potential climatic envelope layers of the entire Pinus genus under both current and future climate scenarios. Furthermore, we projected the changes in these climatic envelope layers across six future climate scenarios (SSP-126-2050s, SSP-245-2050s, SSP-585-2050s, SSP-126-2070s, SSP-245-2070s, SSP-585-2070s). The resulting future climatic envelope changes were classified into three types: range expansion, range contraction, and no change. Additionally, we utilized the Jackknife method to quantify the relative importance of selected bioclimatic factors [35]. We also constructed response curves to analyze the relationship between the occurrence probability of the entire Pinus genus and dominant environmental variables.
For the 113 Pinus species, we assumed that unlimited global dispersal of species may lead to unrealistic predictions [39]. Therefore, drawing on prior research [23], we defined a unified 12.5° buffer surrounding each species’ occurrence data to delineate its climatic background range; the predicted geographic extents corresponds to the climatic niche. In addition, given that models constructed with sample sizes fewer than five may lack sufficient predictive capability [40], we used alternative distribution modeling methods for species with fewer than five occurrence records (Pinus amamiana and Pinus squamata). Specifically, Pinus amamiana had four valid occurrence records, and we applied the range bagging method [41,42]. As a hull-based machine learning method for presence-only climate envelope modeling, it adopts an ensemble of convex hulls derived from a reduced set of climatic niche parameters (i.e., the species’ marginal climatic envelope) and optimized through bootstrap aggregation (bagging) [41]. For Pinus squamata, which had only one valid occurrence record, we employed the Area of Occupancy (AOO) method [42] and mapped its distribution range to the known occurrence count at a grid cell resolution of 10 × 10 km.
In the distribution model of each Pinus species, we used the same ten bioclimatic variables as those employed for the entire Pinus genus. This approach avoided methodological discrepancies caused by independent variable selection for each species, which is particularly crucial for cross-species comparisons of climatic envelope changes and threat levels. For species with limited occurrence records, the unified variable set reduced the risk of overfitting noise in small datasets and ensured that ecologically meaningful variables were not excluded due to sample size limitations [40]. We kept subsequent modeling data partitioning ratios, model evaluation criteria, potential climatic envelope classification criteria (see Table S1 for MTSPS values of each species), and variable importance assessments consistent with those adopted for modeling the entire Pinus genus. To screen climate-related risk in a way broadly analogous to IUCN Criterion A3 [43], species projected to lose more than 30% of their climate envelopes were treated as climate-vulnerable [44].

2.4. Data Analysis

To mitigate the influence of area on species diversity, we analyzed the distribution patterns of actual and potential species richness at a 100 × 100 km resolution. We excluded grid cells where half of their area intersected global land borders or were situated along coastlines to ensure data reliability. Consequently, we used a total of 14,623 grid cells for subsequent analyses.
We calculated actual species richness based on the valid distribution records of 113 Pinus species. In contrast, potential species richness under current and future climate scenarios was derived by superimposing the binary climatic envelope maps of each species; these maps were generated independently from species-specific distribution models. Species richness under each climate scenario was determined by counting the number of species in each grid cell. Furthermore, we calculated the variation in species richness between future and current scenarios. All distribution maps were created utilizing the World Behrmann Equal-Area Projection in ArcGIS 10.8.
Biodiversity centers were defined as the top 2.5% [45,46], 5% [47,48], and 10% [18,49] of grid cells with the highest species richness. Based on this criterion, we assessed different levels of biodiversity centers for Pinus species at the global scale. Furthermore, under future climate scenarios, regions with high species richness decline were defined as the top 2.5%, 5%, and 10% of grid cells that showed the largest losses in potential species richness relative to the current levels. We adopted the same threshold used to identify biodiversity hotspots to guarantee methodological consistency across analyses.
We overlaid the identified Pinus biodiversity hotspots and high-decline regions with existing protected areas to evaluate conservation gaps. Polygon data for global protected areas were obtained from the World Database on Protected Areas (WDPA, https://www.protectedplanet.net), while supplemented data for China’s protected areas were sourced from the China Nature Reserve Specimen Resource Sharing Platform (http://www.papc.cn/) [50]. Grid cells within biodiversity hotspots or high-decline regions that were not covered by any protected area were defined as conservation gaps. To assess the effectiveness of existing protected areas, we calculated the number and proportion of grid cells in biodiversity hotspots or high-decline regions that were located inside and outside protected areas. Additionally, we compared the identified Pinus biodiversity centers with 36 global terrestrial biodiversity hotspots, using data from the Conservation International’s Biodiversity Hotspots Database (version 2016.1, https://www.cepf.net/). Notably, the two hotspot frameworks adopt distinct criteria: the Conservation International’s global hotspots are large bioregions defined by ≥1500 endemic vascular plant species and ≥70% loss of native vegetation, while our Pinus diversity hotspots refer to grid cells with the highest co-occurring Pinus species richness, independent of endemicity and habitat loss thresholds.

3. Results

3.1. Potential Effects of Climate Change on Current Distribution and Future Range Shifts of Pinus

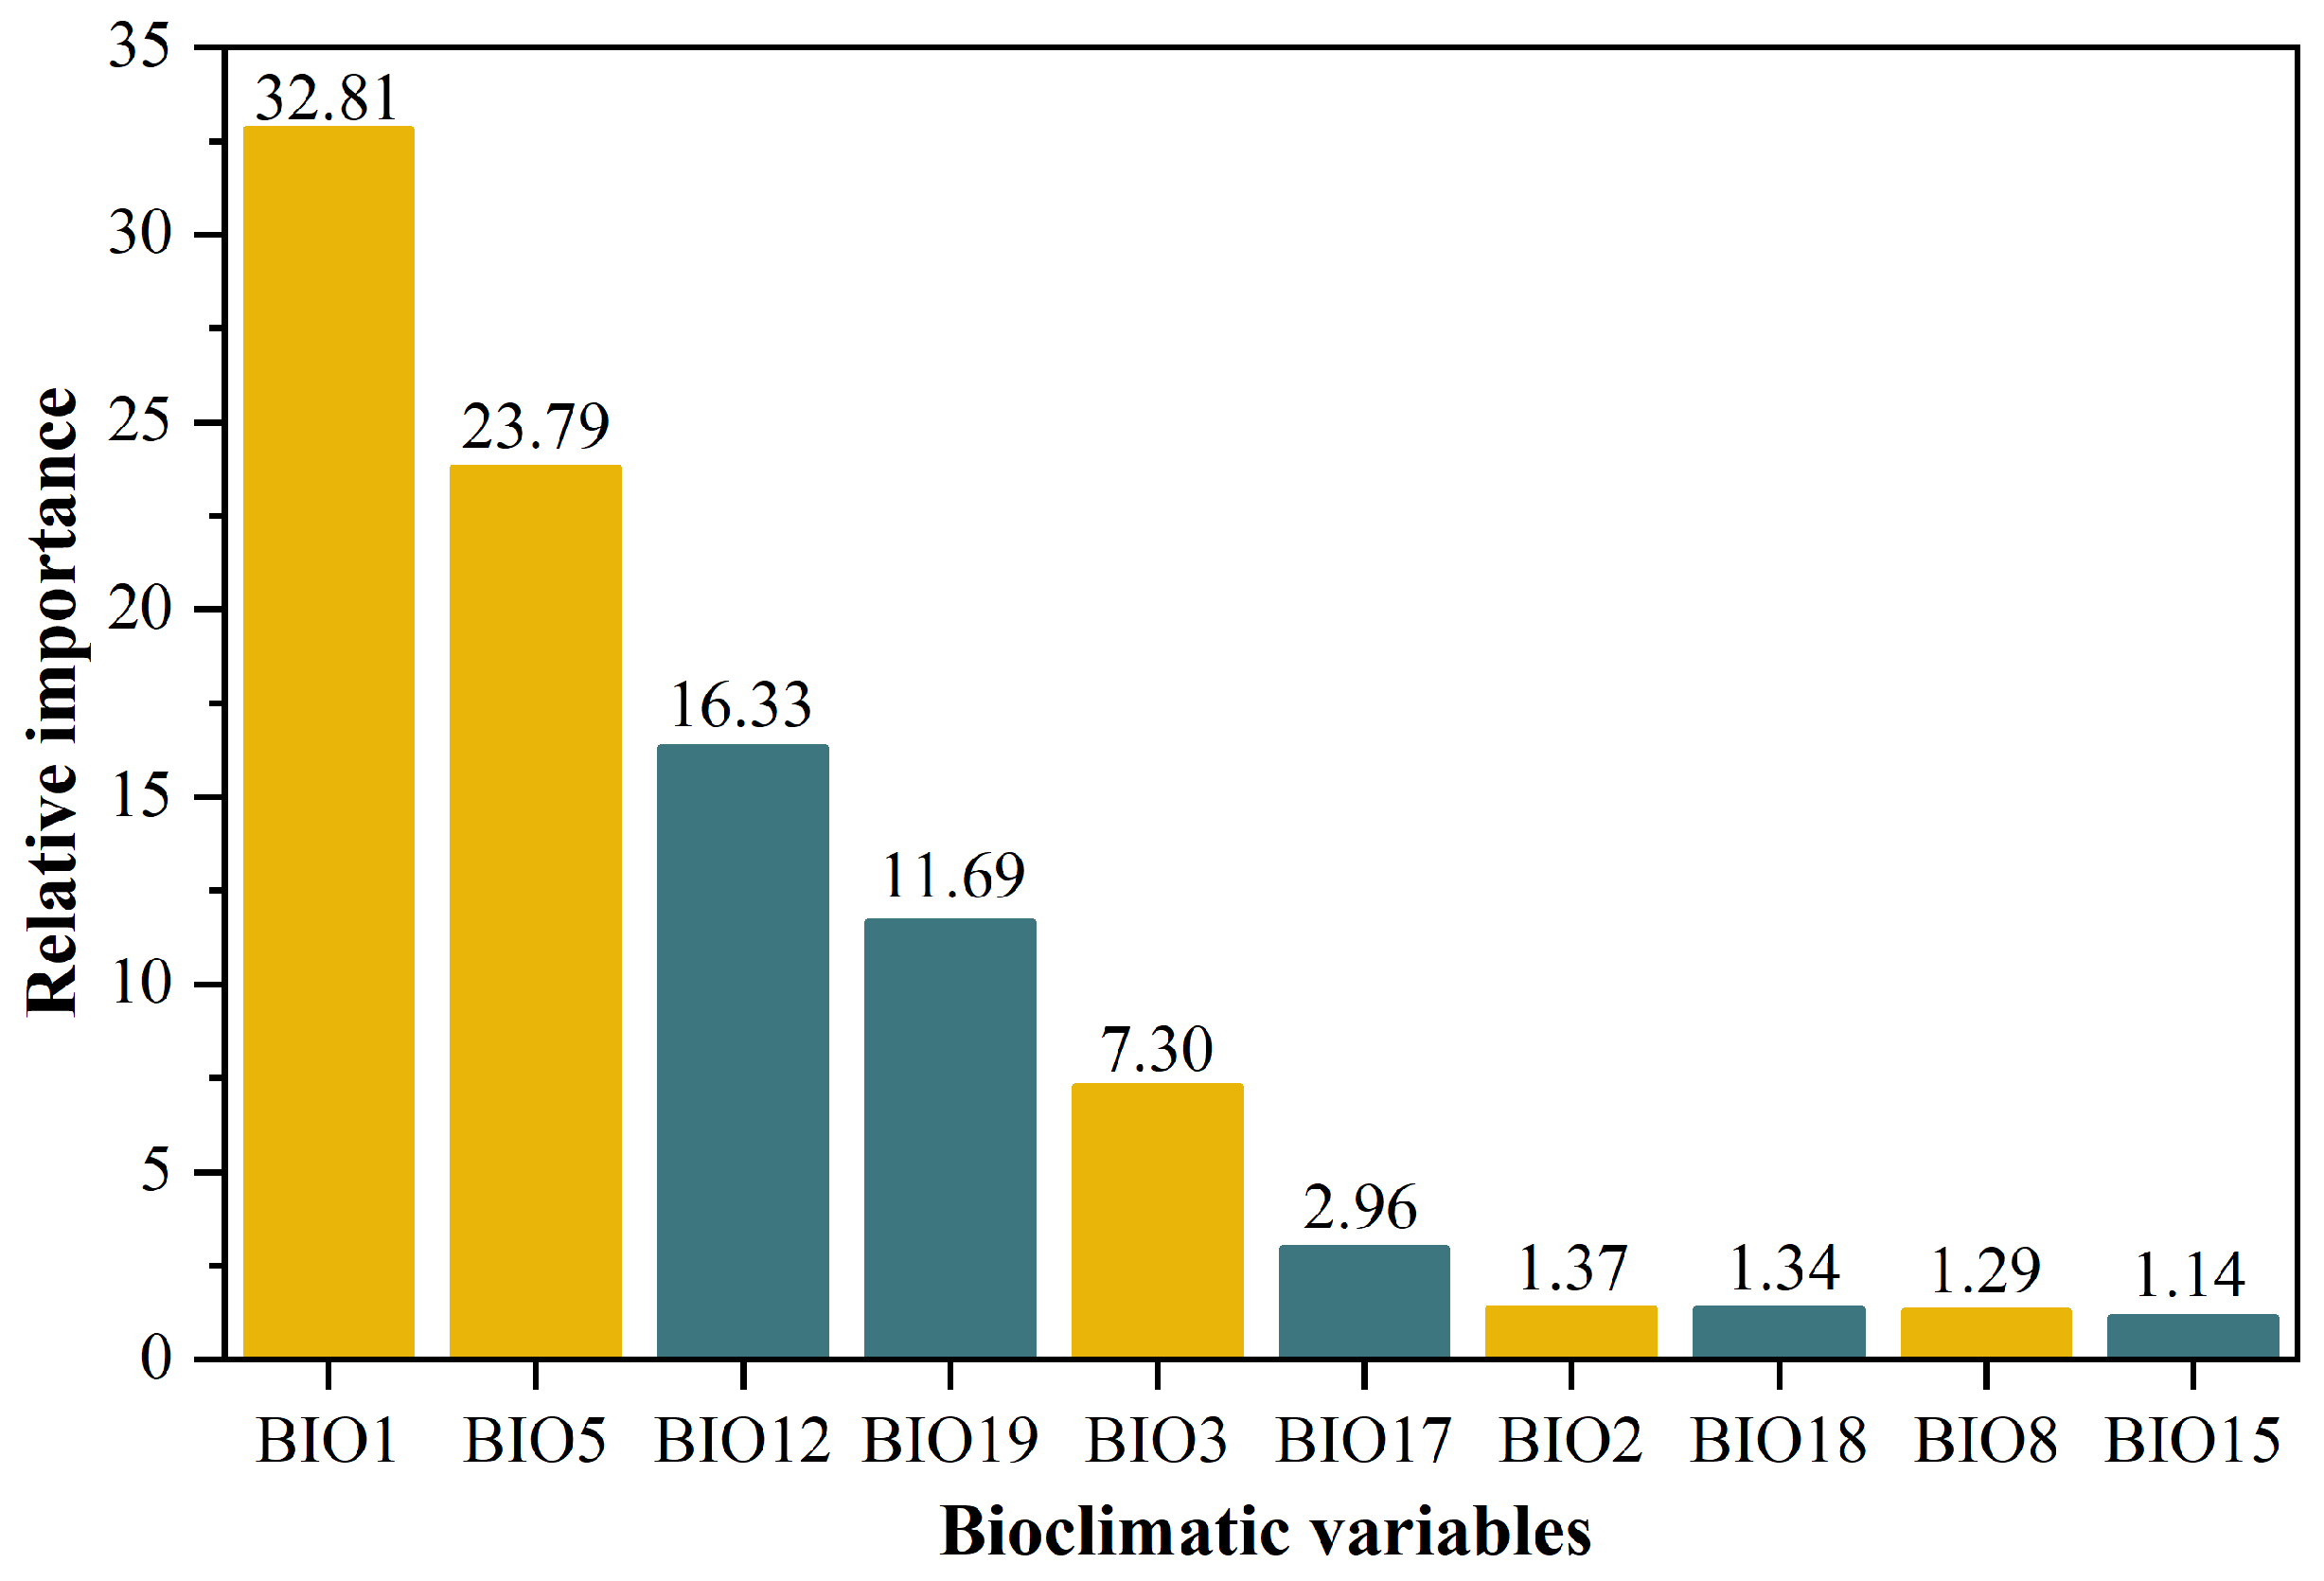
The average test AUC value of Pinus was 0.789, indicating that the model’s predictions achieved a “good” level of accuracy. As illustrated in Figure 1, the Jackknife method was utilized to assess the relative importance of selected bioclimatic factors in predicting the potential distribution of Pinus under current climate conditions. Jackknife outputs demonstrated that predicted changes in temperature (BIO1, 2, 3, 5, 8) and precipitation (BIO12, 15, 17, 18, 19) may significantly influence the future distributions of Pinus. Among these variables, BIO1 exhibited the highest relative importance, followed by BIO5, BIO12, and BIO19, with their cumulative importance reaching 84.61%. The species response curves illustrate the relationship between climatic factors and species presence probability, reflecting the biological tolerance and climatic niche preference of Pinus (Figure S1). Threshold values of key bioclimatic parameters were defined at a presence probability of 0.3587 based on the response curve. As BIO1 increases, the presence probability of Pinus initially rises and then declines, with the majority of occurrences found between –0.96 and 22.61 °C (Figure S1a). Additionally, Pinus grows in areas with BIO5 ranging from approximately 8.81 to 44.93 °C (Figure S1c), and shows a preference for regions with high precipitation (BIO12 > 244.58 mm, BIO19 > 19.51 mm; Figure S1e,g).
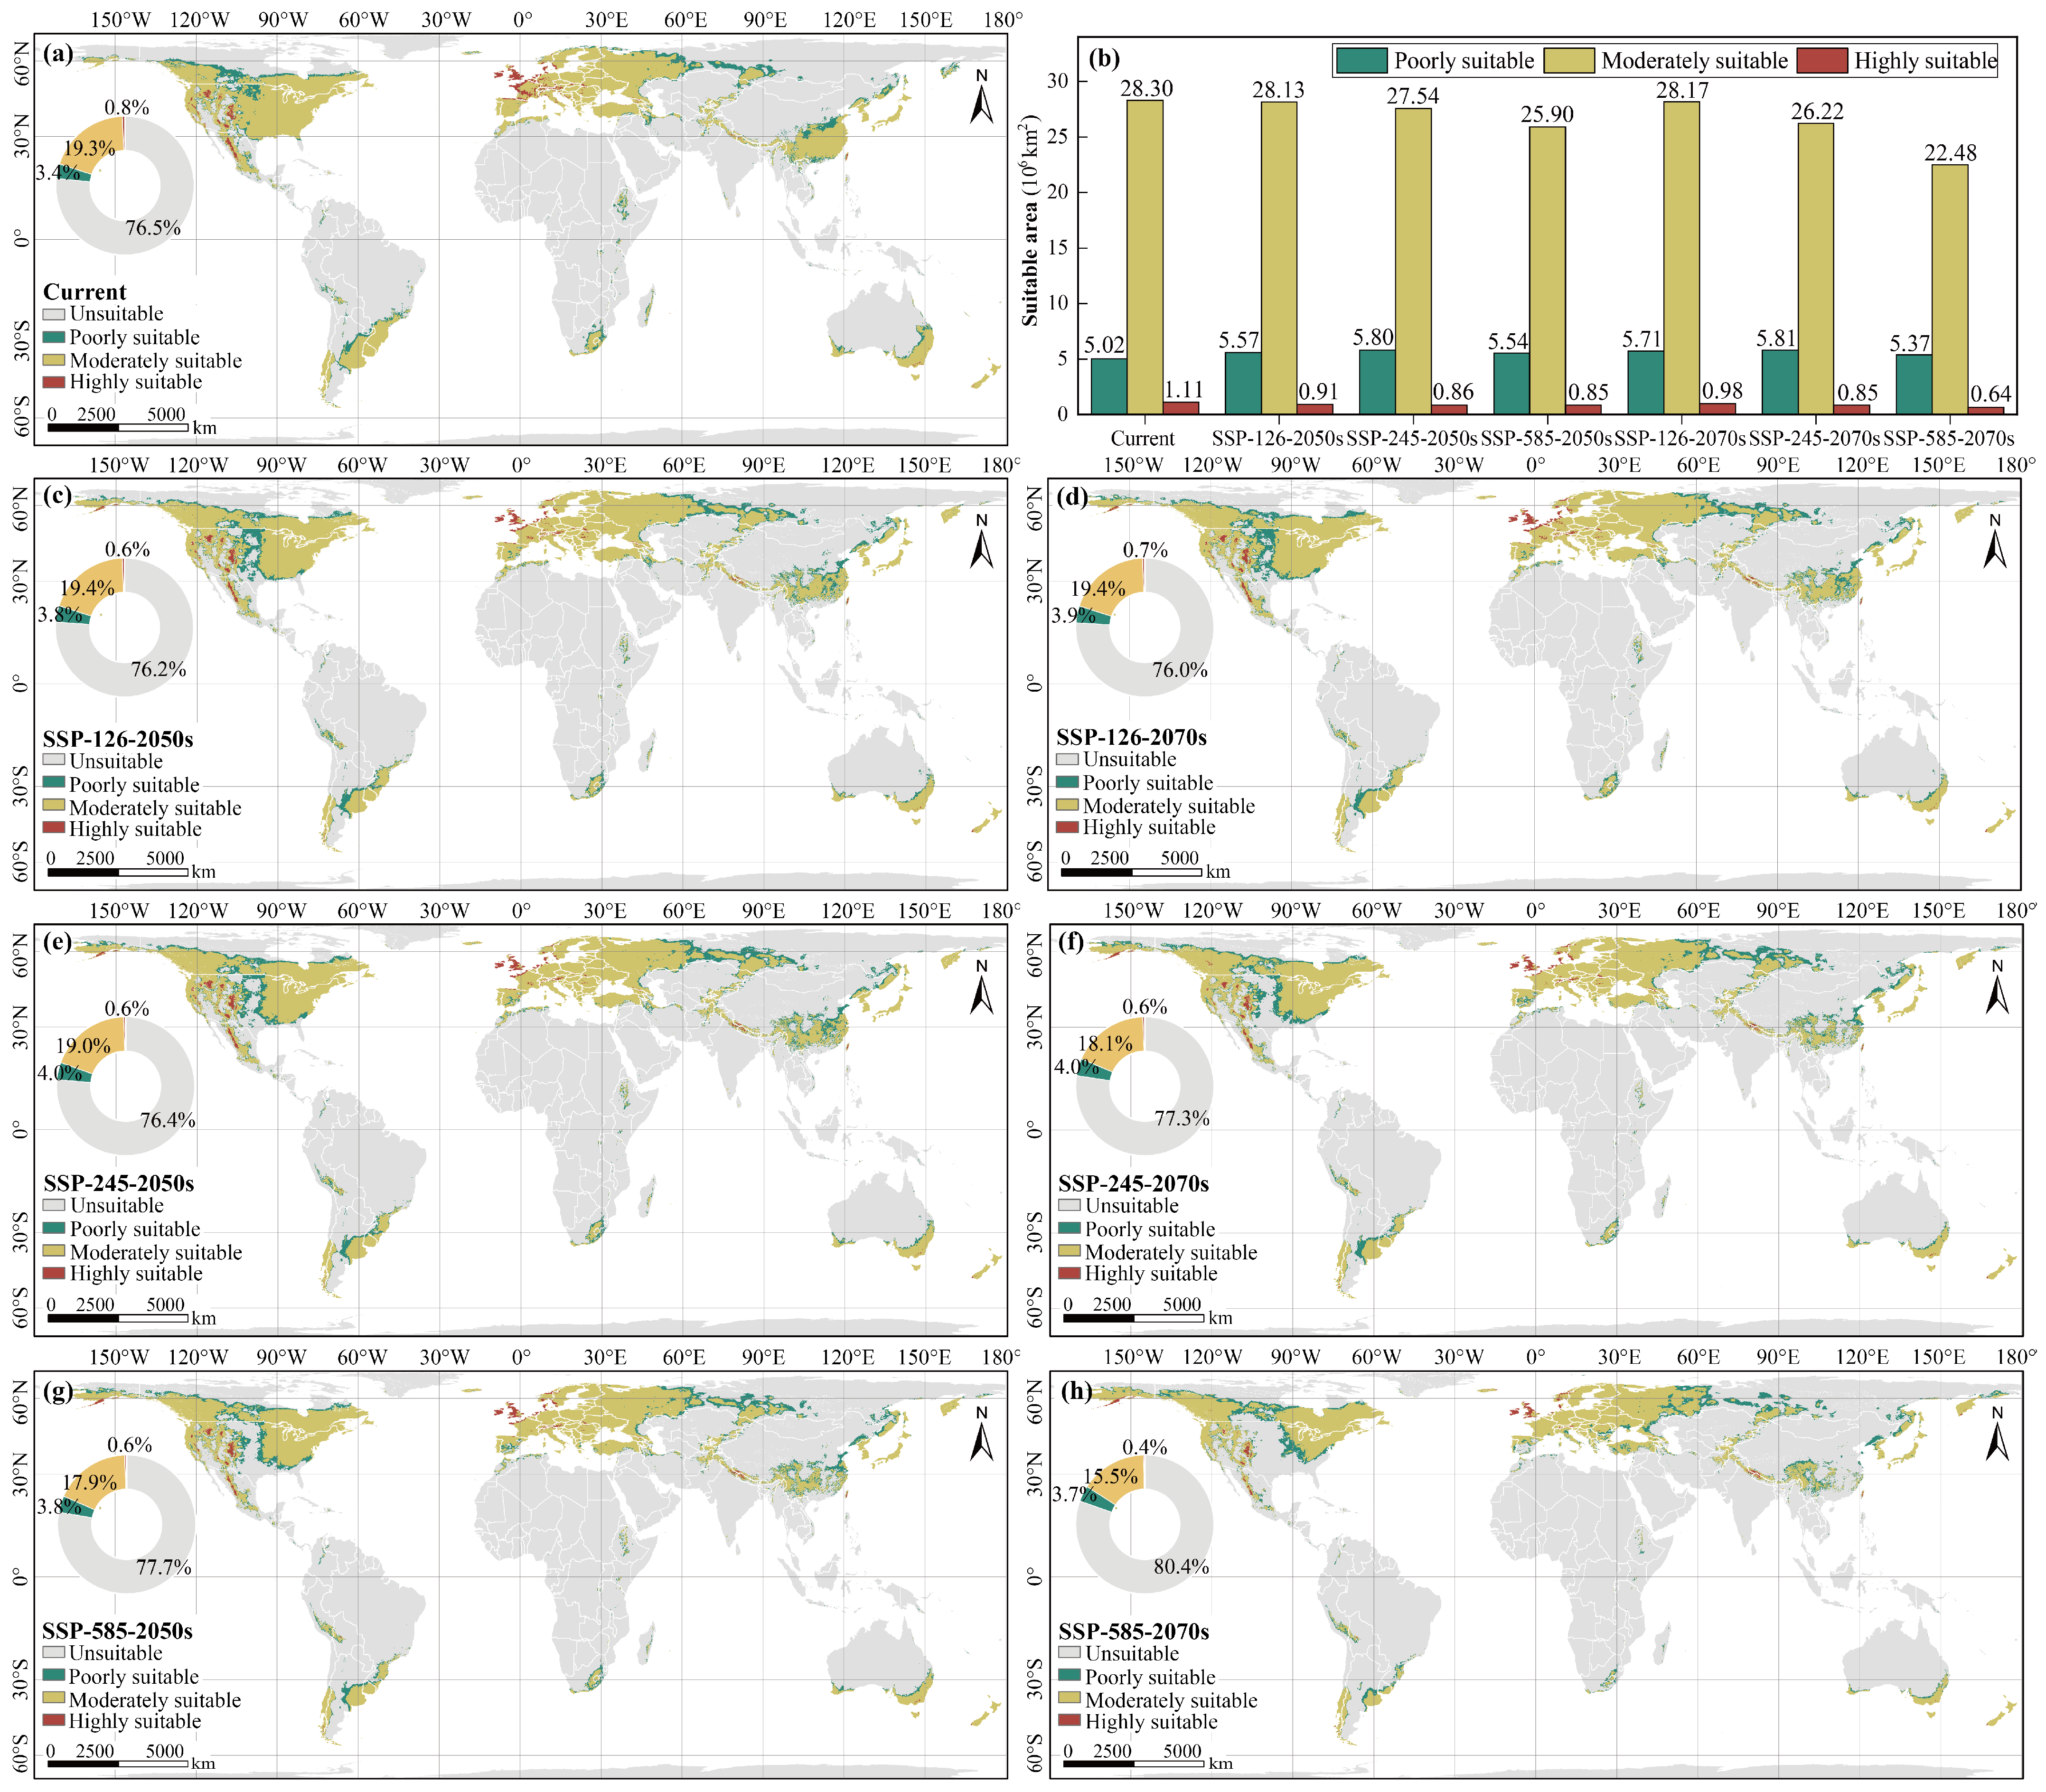
Under current climate conditions, the modeled suitable area broadly matched the known distribution of the genus (Figure 2a). Highly climatically suitable zones for Pinus are concentrated primarily in the western United States, the Mexican Plateau, western Europe, the western Himalayas, and Taiwan Province of China. Moderately climatically suitable zones are mainly distributed in North America, Europe and East Asia, as well as regions near 30° S in the Southern Hemisphere. Poorly climatically suitable zones are scattered across northern North America, northwestern and eastern Asia, and a few locations in the Southern Hemisphere (Figure 2a). Furthermore, the predicted future climatic envelope range of Pinus remains largely consistent with that under current climate scenarios (Figure 2c–h). Under the low-emissions scenario (SSP-126), the extent of highly climatically suitable zones is projected to decline by 17.74% and 11.52% over the next 30 to 50 years, while the area of moderately climatically suitable zones is projected to decrease by 0.63% and 0.48%, respectively. However, the expansion of poorly climatically suitable zones is projected to drive an overall rise in the total area of climatic envelopes, with increases of 0.50% and 1.23%, respectively. In contrast, model outputs indicate that the overall extent of climatic envelope would decrease under medium and high-emissions scenarios, with this trend expected to intensify over time. Notably, the SSP-585 scenario exhibited the most substantial decline. By the 2070s, highly and moderately climatically suitable zones are projected to shrink by 41.83% and 20.57%, respectively, leading to a reduction in the total area of the climatic envelope from the current 34.43 × 10⁶ km2 to 28.50 × 10⁶ km2, representing a change of −17.23% (Figure 2b). Taken together, with the future intensification of global overheating and associated climatic shifts, the global climatic envelopes of Pinus are projected to undergo substantial contraction, which may lead to a considerable decline in Pinus populations.
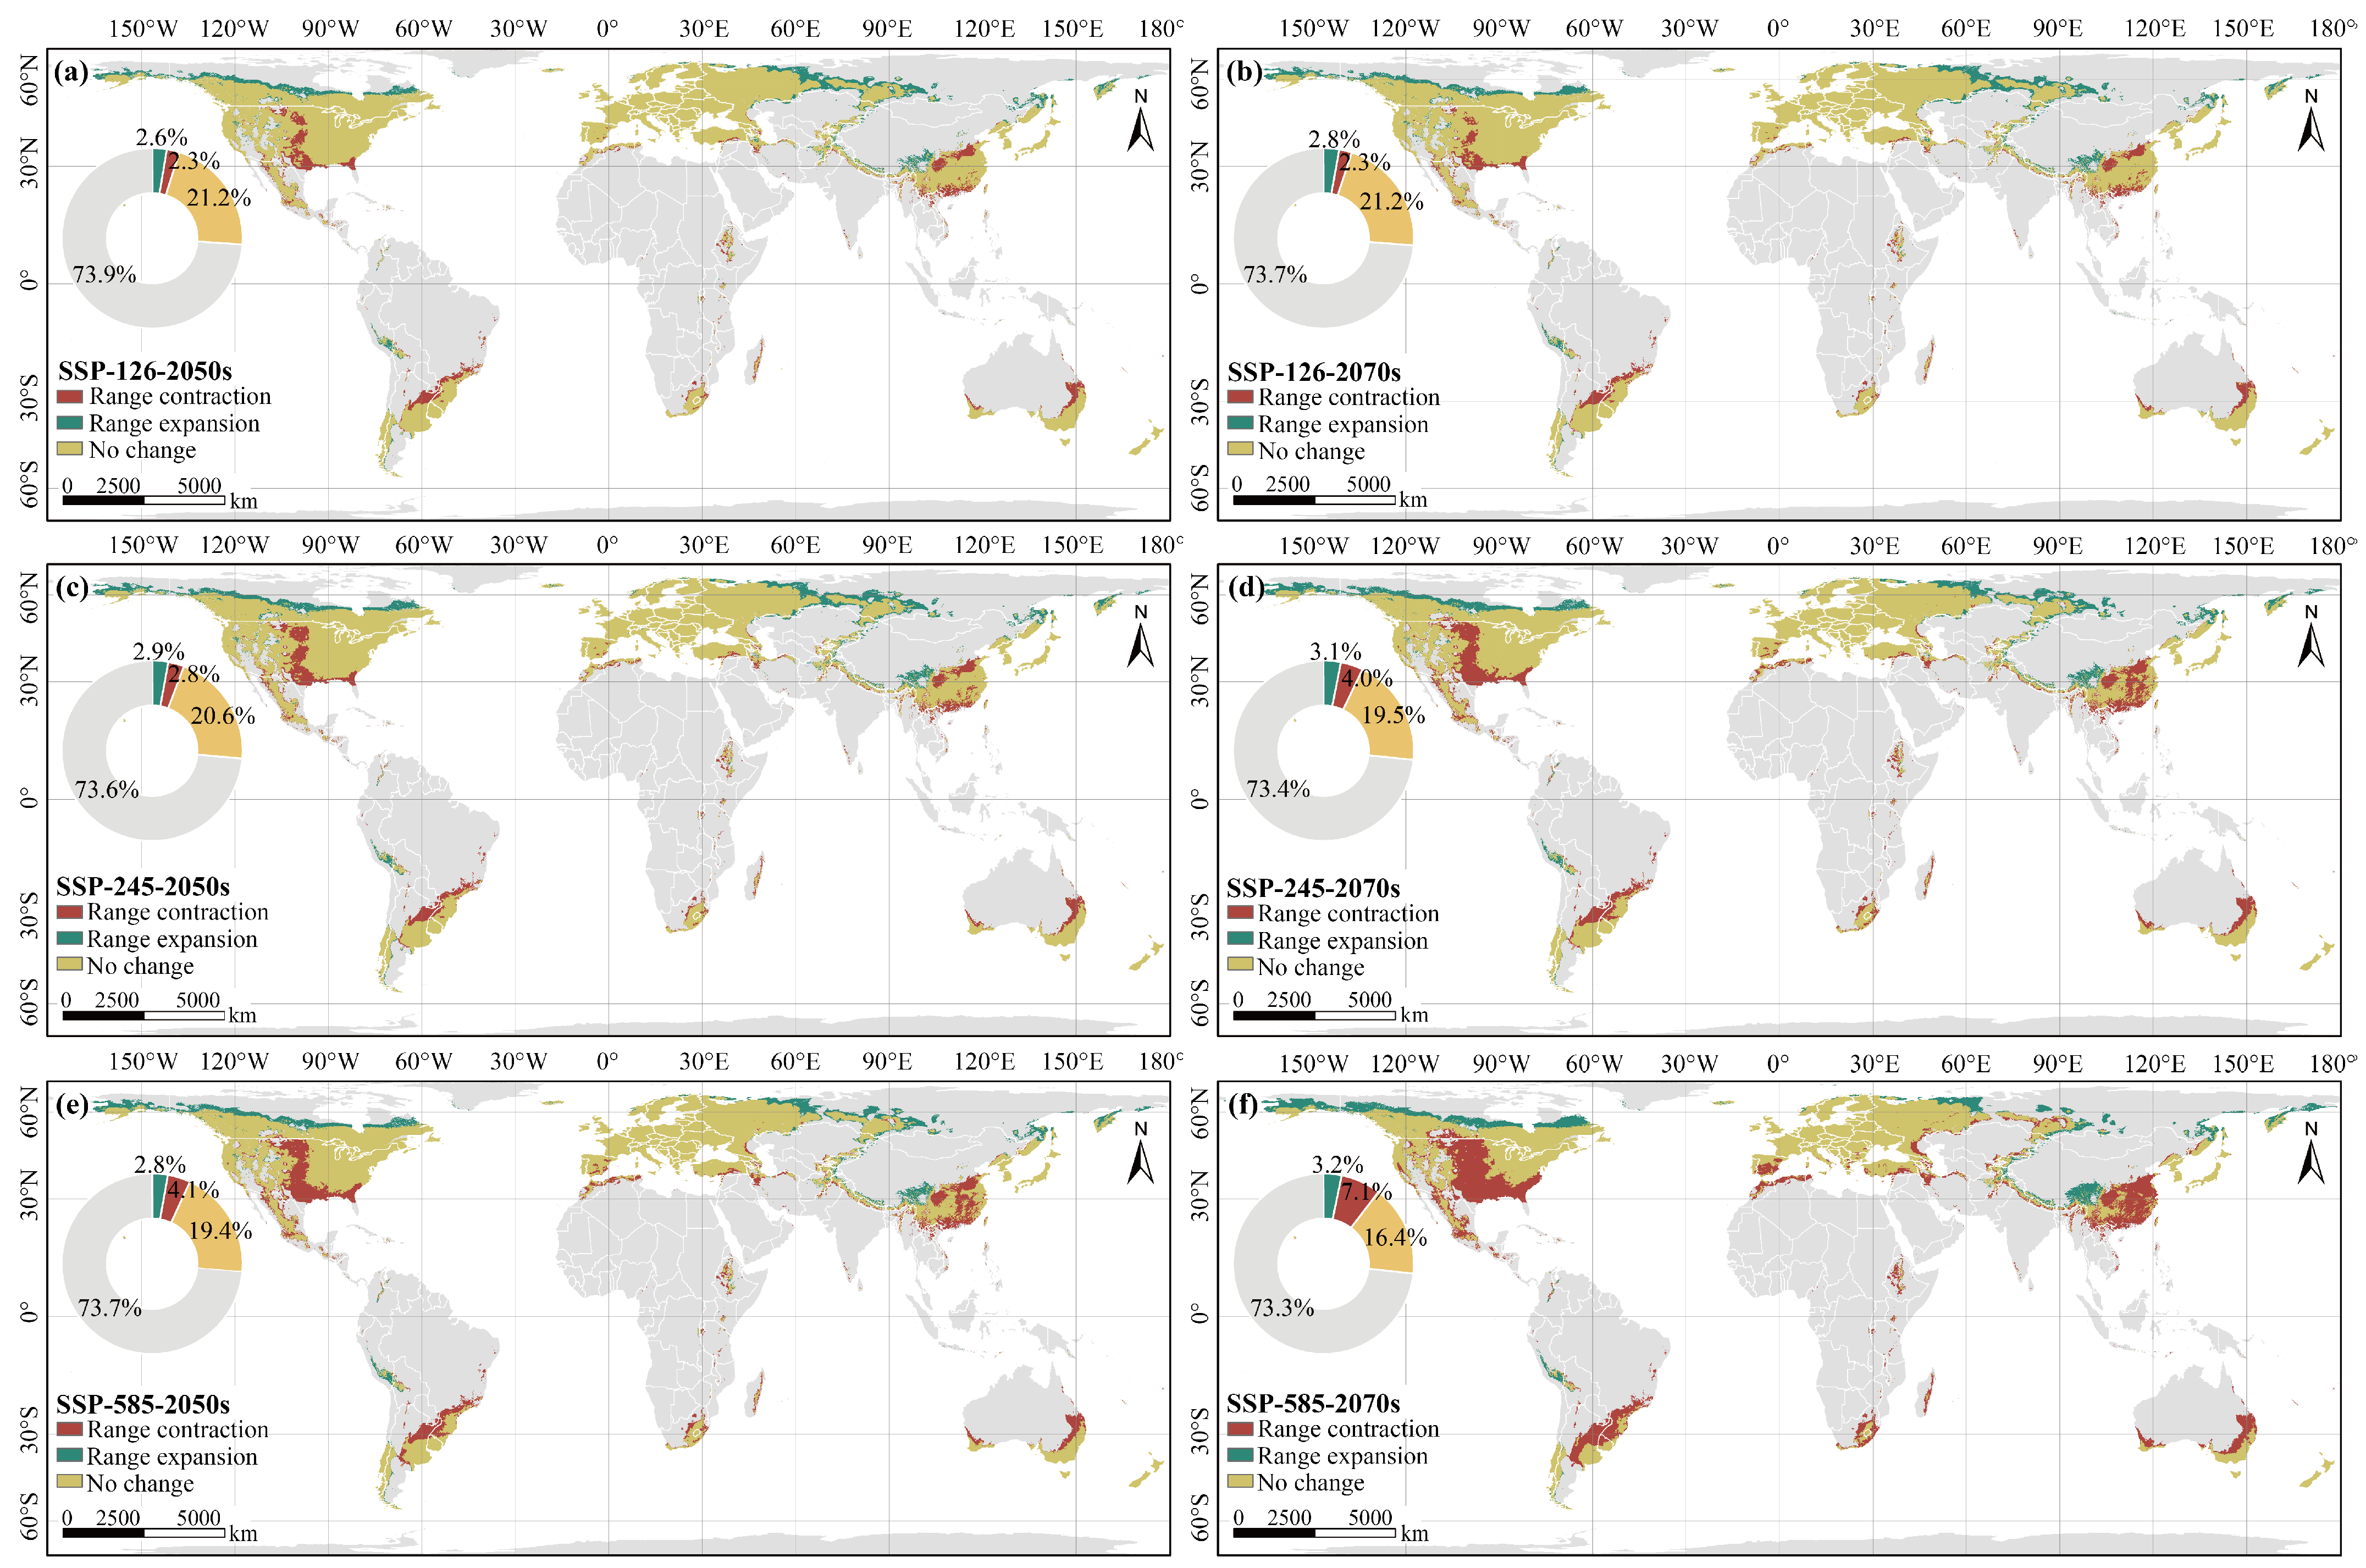
Comparisons of climatic envelope distributions across current and future climate scenarios revealed that range gains are projected near 60° N and the southeastern Tibetan Plateau. In contrast, range losses are anticipated mainly across the central United States, central and southern China, southern South America, and southern Australia (Figure 3). By the 2050s, as CO2 concentrations rise, the total area of new range gains for Pinus may first grow then shrink, while the area of range loss may steadily expand (Figure 3a,c,e). By the 2070s, substantial rises in both range gain and loss extents are projected (Figure 3b,d,f). Notably, under the SSP-585 scenario, the areas of climatic envelope gain and loss are projected to reach their maximum values, at 4.70 × 10⁶ km2 and 10.38 × 10⁶ km2, respectively (Figure 3f).

3.2. Potential Effects of Climate Change on Key Drivers and Future Range Shifts of Individual Pinus Species

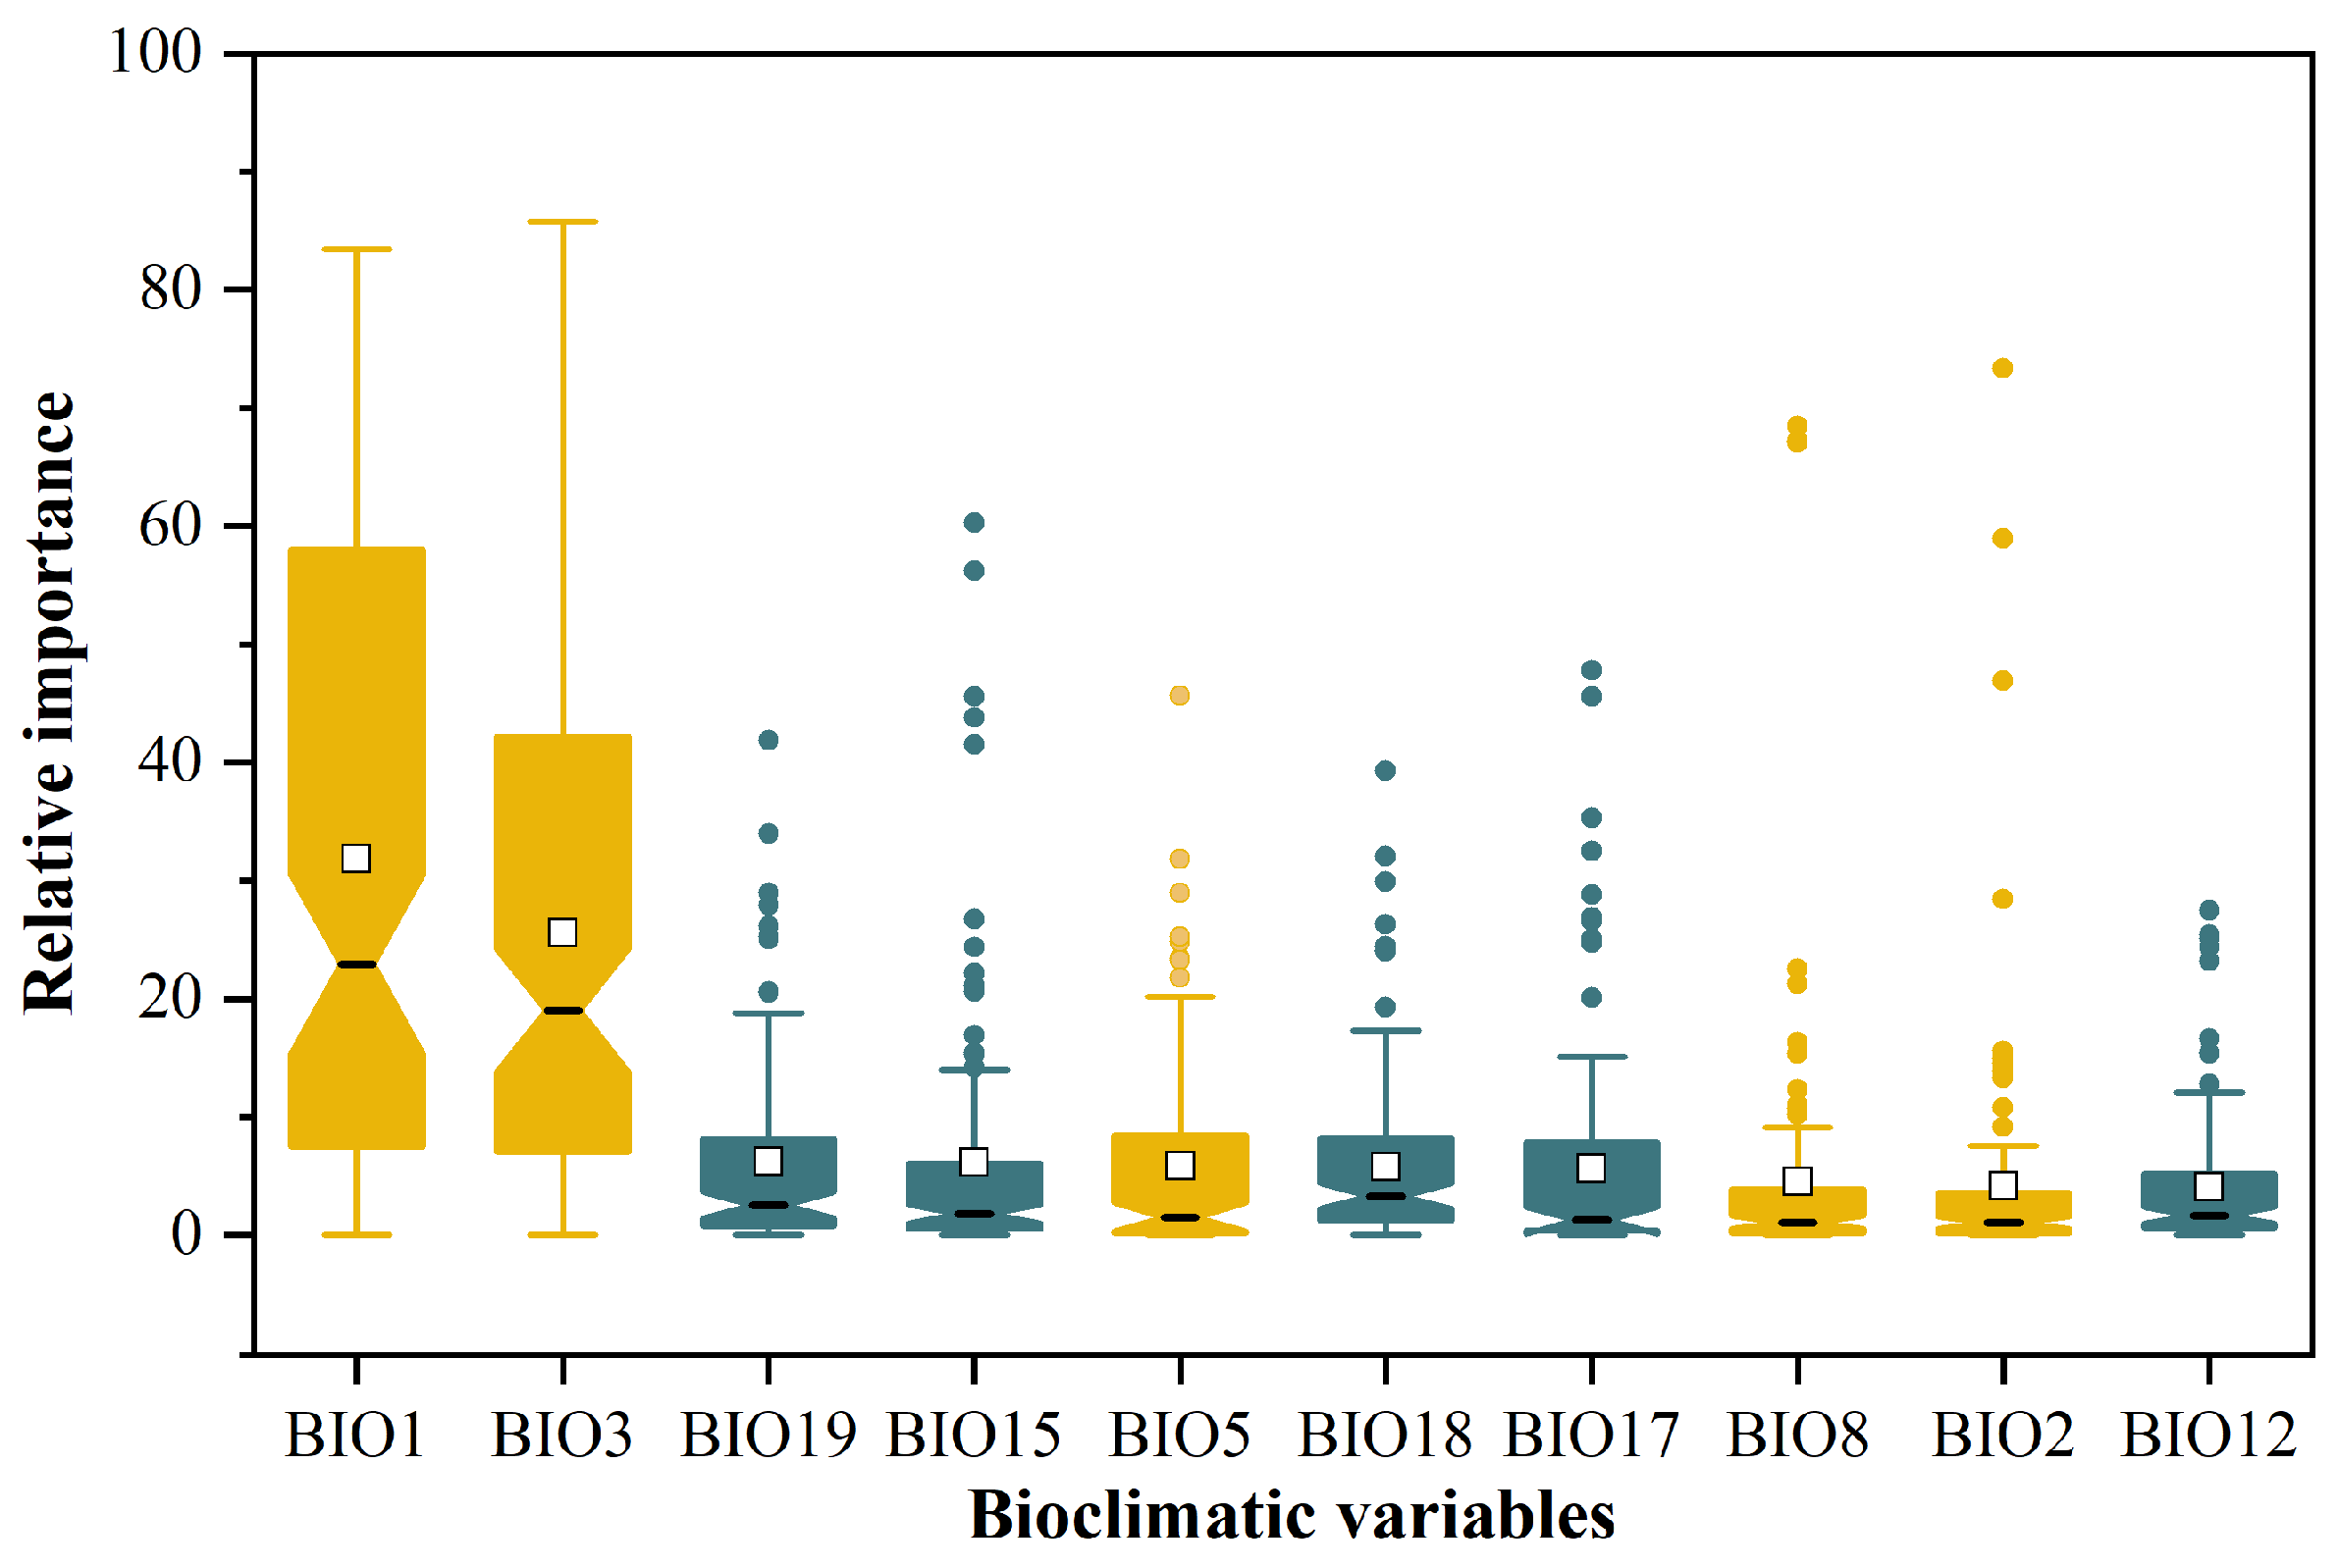
The evaluation indicators of the prediction results for each Pinus species are presented in Table S1. The average AUC value across 111 species reached 0.970 ± 0.029, with a range from 0.859 to 0.999, suggesting that SDMs exhibited good accuracy. The MaxEnt model provided the relative importance of chosen variables in predicting the potential distribution of each species (see Figure 4 and Table S4), with considerable variation observed among species. Regarding dominant climatic predictors, temperature emerged as the primary influencing factor for most Pinus species. Specifically, BIO1 was deemed to have more than 50% importance for the distribution of 32 species and was identified as the foremost influencing factor for 47 species. Furthermore, BIO3 was defined as the primary influencing factor for 38 species. Although only 15 species had precipitation-related variables as the primary influencing factor, this does not indicate that precipitation has minimal impact on the distribution of Pinus species. In fact, precipitation factors, particularly BIO19 and BIO15, were the second and third most influential factors for most species, indicating their significant role in species distribution.
Future shifts in the distribution range of Pinus species indicate that the average range contraction for threatened species is projected to intensify as global overheating and associated climatic shifts progress. Additionally, the proportion of threatened species would rise from 7.96% (9/113) under SSP-126 to 44.25% (50/113) under SSP-585 (Table S5). Specifically, by the 2050s, under low, medium, and high-emissions scenarios, the potential geographical ranges of 9, 15 and 25 species are expected to contract, with average reductions of 34.33%, 39.57% and 41.91%, respectively. By the 2070s, a greater number of species are projected to become threatened, with 11, 31, and 50 species experiencing average range contractions of 37.22%, 40.88%, and 49.19% under the three emissions scenarios (low, medium, and high), respectively.

3.3. Potential Effects of Climate Change on Current and Future Pinus Species Richness Distribution

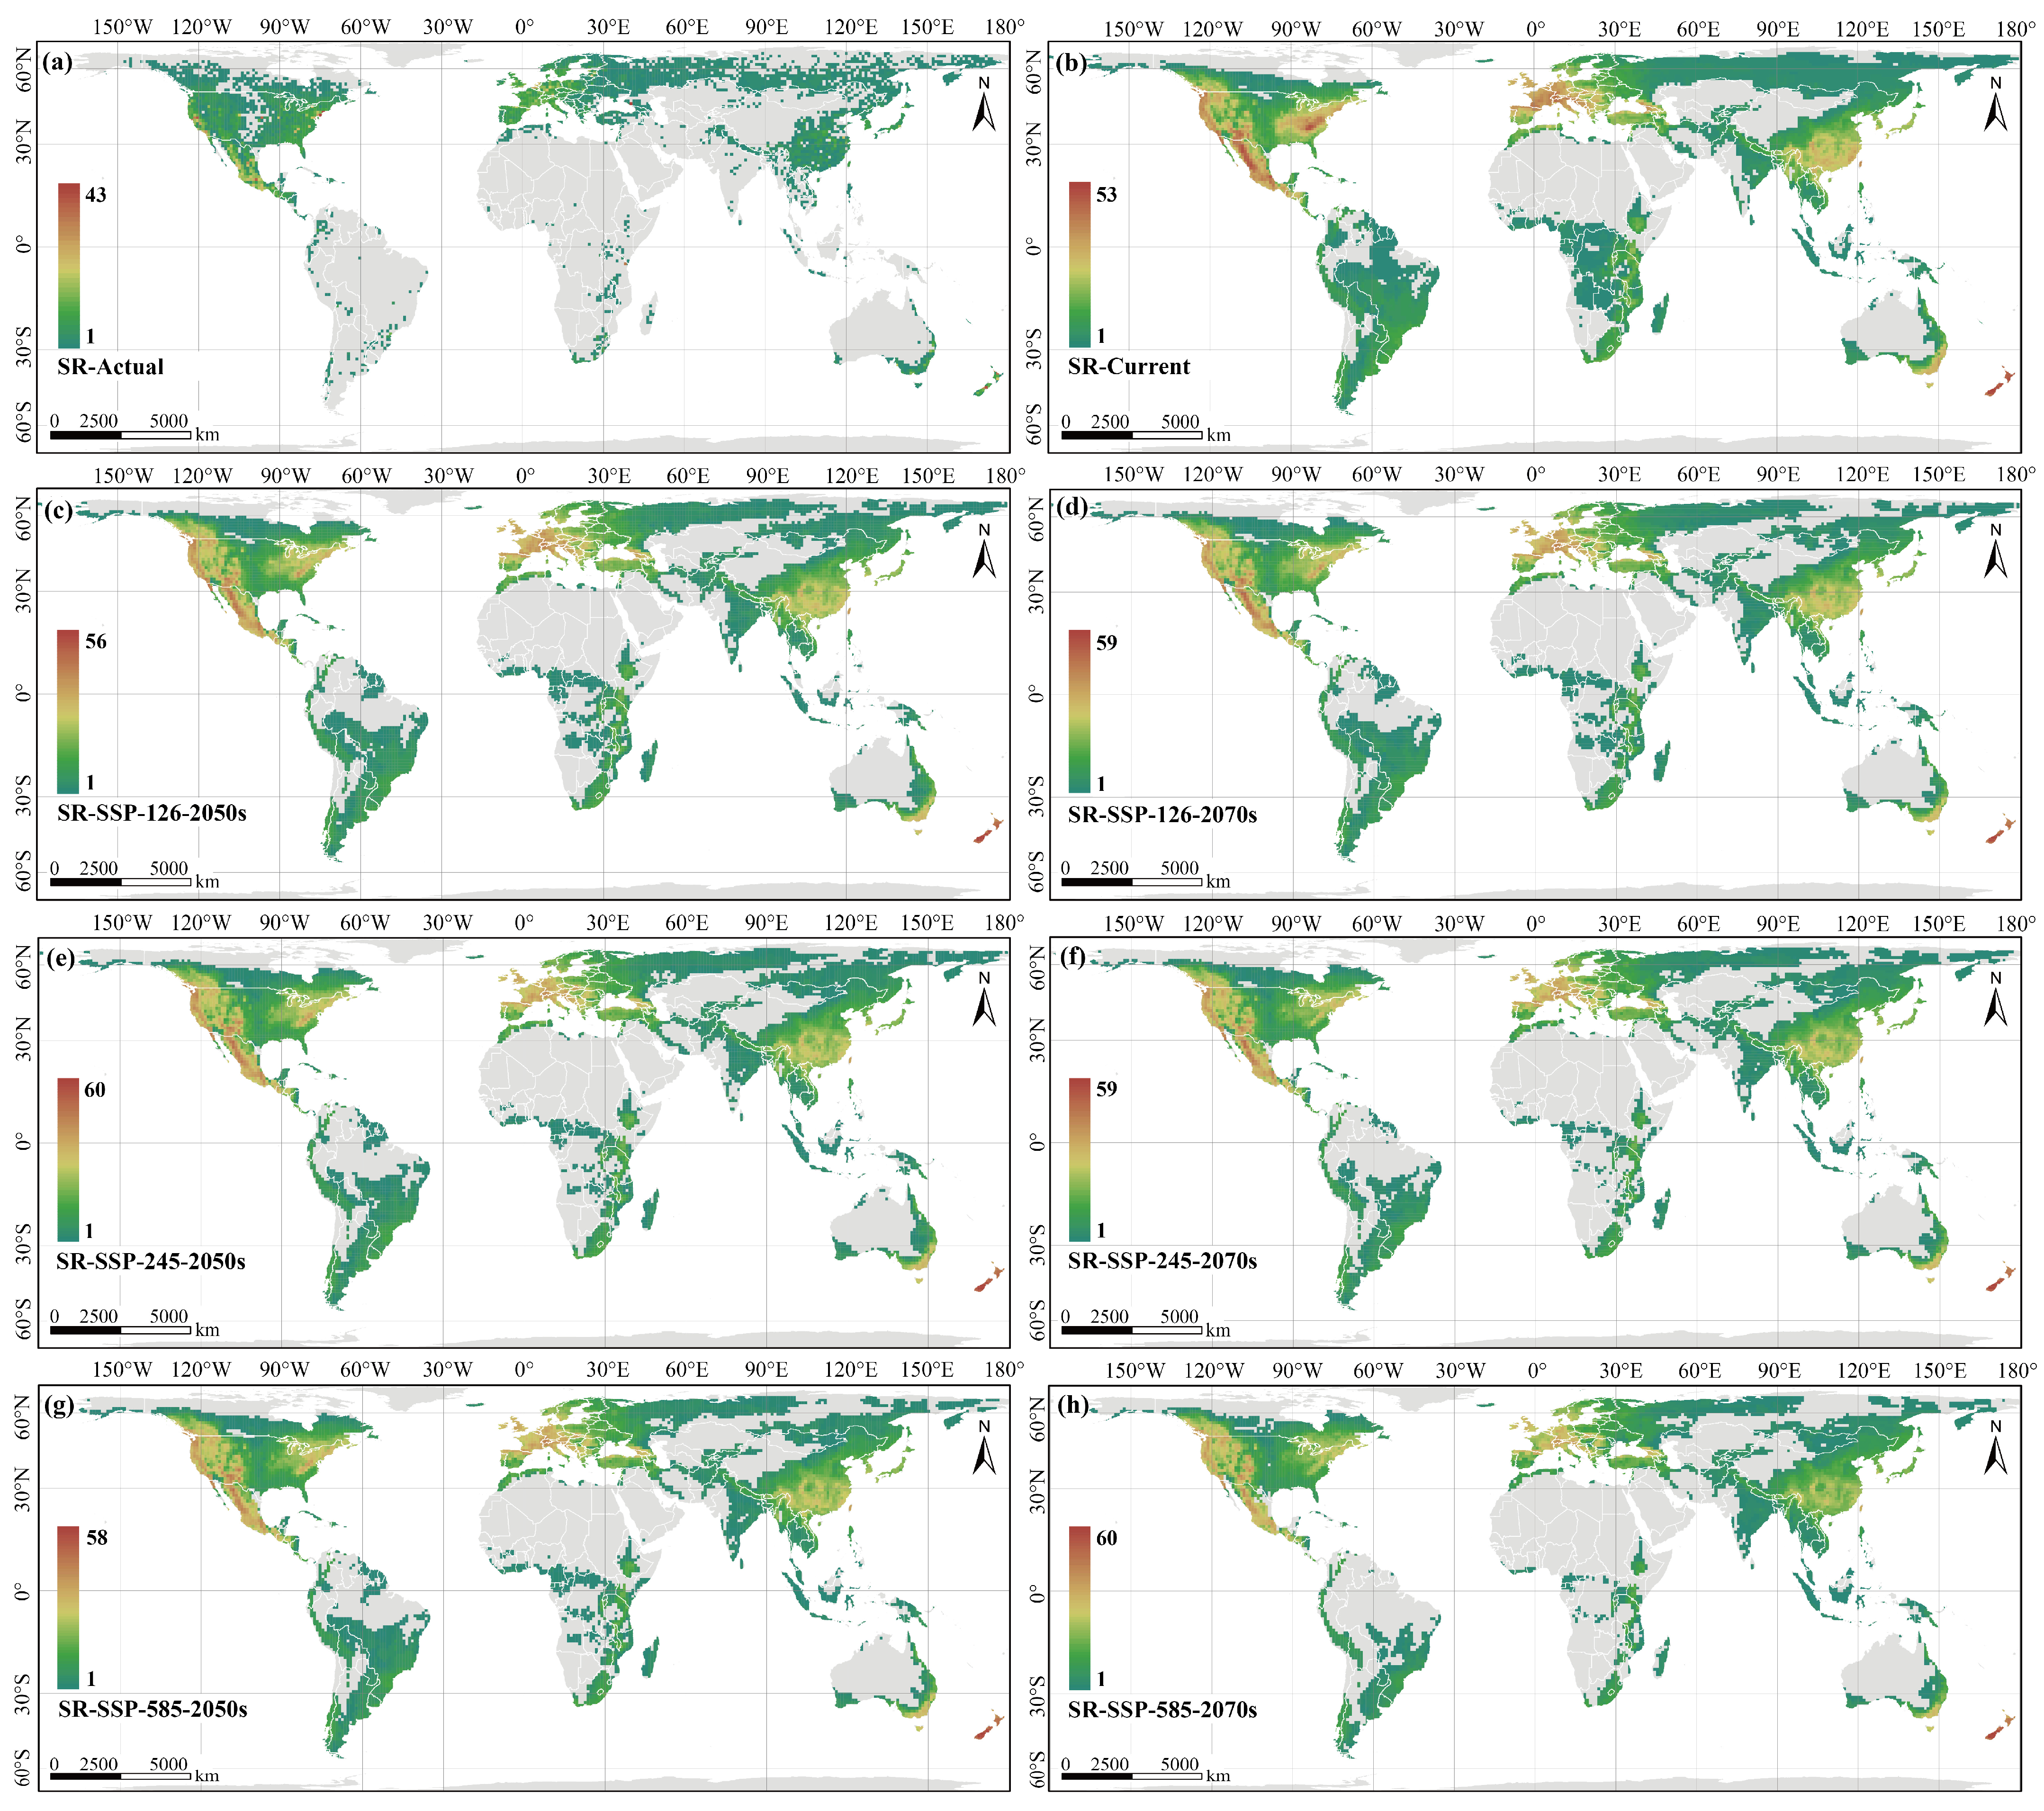
The observed richness pattern of Pinus was based on verified occurrence records (Figure 5a). Pinus species were predominantly found in the Northern Hemisphere, including North America, Europe, northern and eastern Asia, with only a limited presence in the Southern Hemisphere. The distribution of average species richness across each grid cell showed strong geographical differences, with higher richness observed in North America, the Mediterranean region, and the mid-latitudes of East Asia, while lower richness was found in the high latitudes of the Northern Hemisphere. Overlay analysis of individual Pinus climatic envelope outputs showed that the number of grid cells with predicted species richness increased by 92.13% (Figure 5b, Table S6). This expansion of suitable grid cells is mainly concentrated in the Southern Hemisphere. Furthermore, the maximum value of species richness is expected to rise from 43 to 53, with newly identified areas of high species richness emerging in Europe, southern China, and Japan (Figure 5b). Substantial shifts in Pinus richness were identified by comparing future (2050s, 2070s) MaxEnt outputs against present-day simulations. The number of grid cells containing Pinus species is projected to decrease markedly, with a maximum reduction of 20.86% anticipated for SSP-585 in the 2070s (Figure 5).
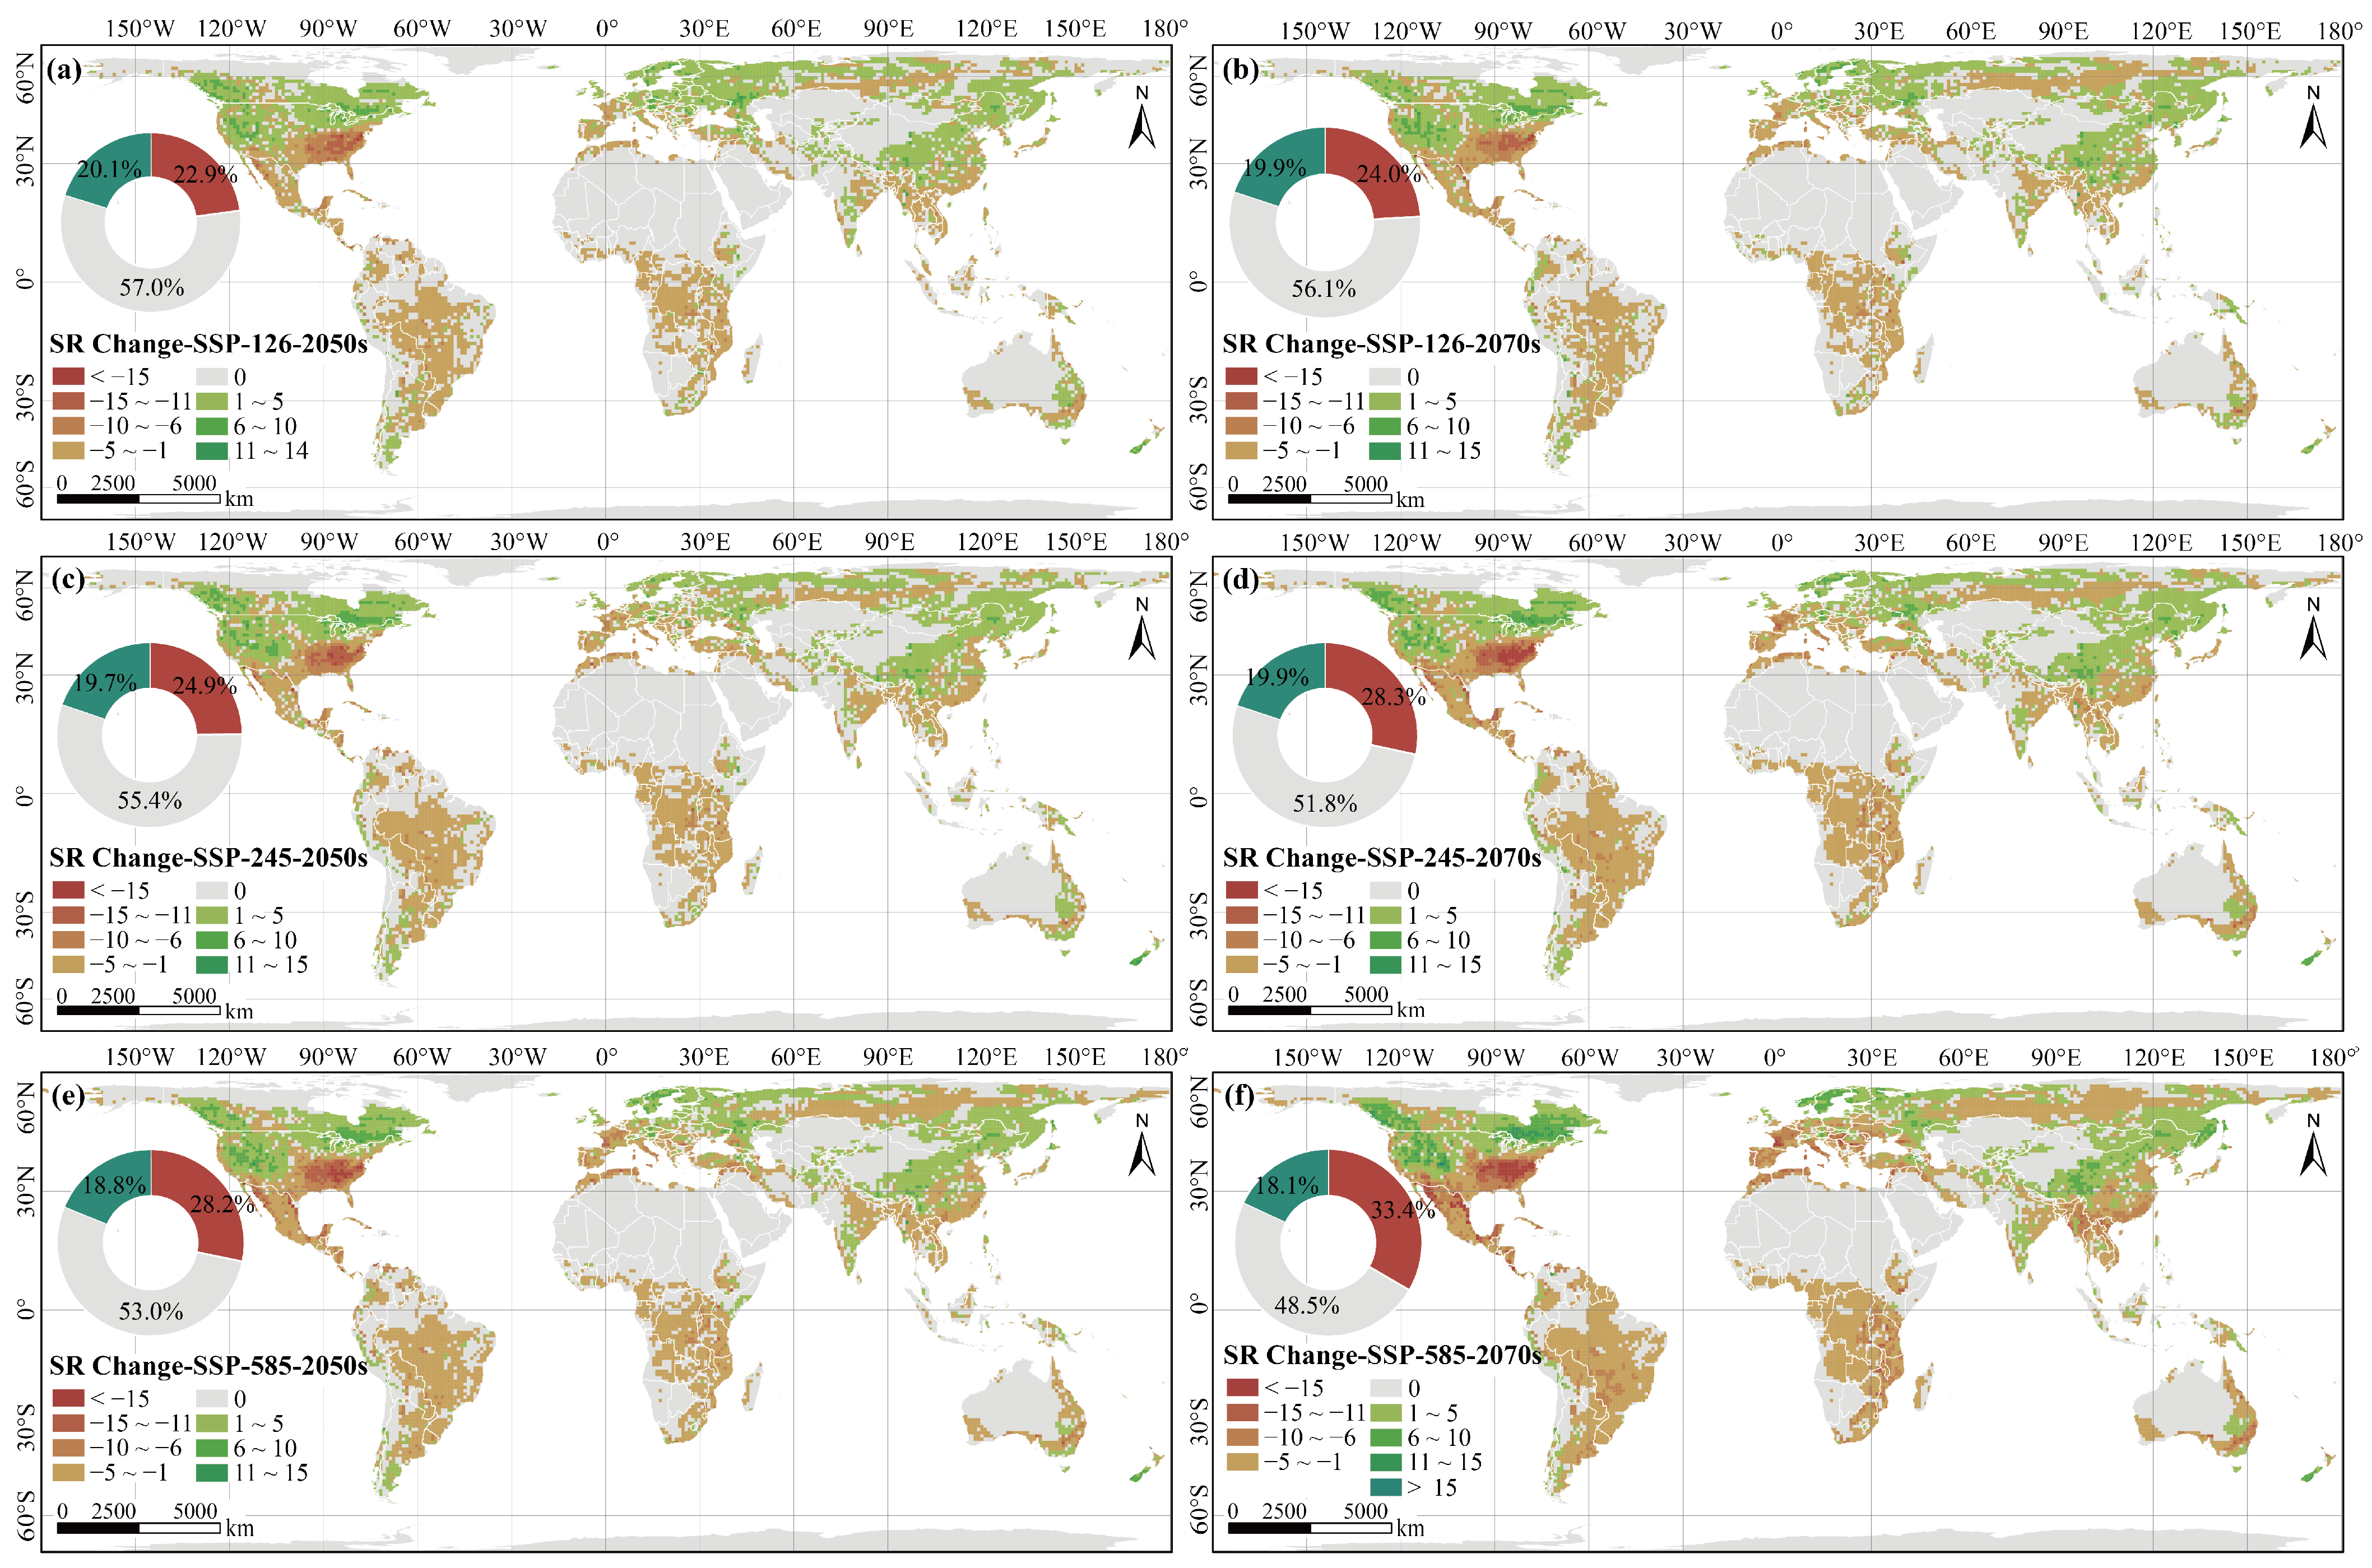
Comparisons of species richness shifts between the 2050s and 2070s revealed that the spatial range of areas undergoing both gains and losses in species richness will expand with ongoing climate change (Figure 6). The count of grid cells with reduced species richness is projected to show a steady upward trend. In contrast, the number of grid cells demonstrating a gain in species richness is projected to display an overall downward trend. In general, with the exception of the severe loss of species richness observed in southeastern North America and the Mediterranean Basin, mid-to-high latitudes north of 30° N are expected to serve as the primary regions where species richness increases. Furthermore, species richness is projected to drop across most areas south of 30° N. As time progresses and CO2 concentrations rise, this pattern is expected to become increasingly pronounced.

3.4. Potential Effects of Climate Change on Pinus Richness Hotspots and High-Decline Regions

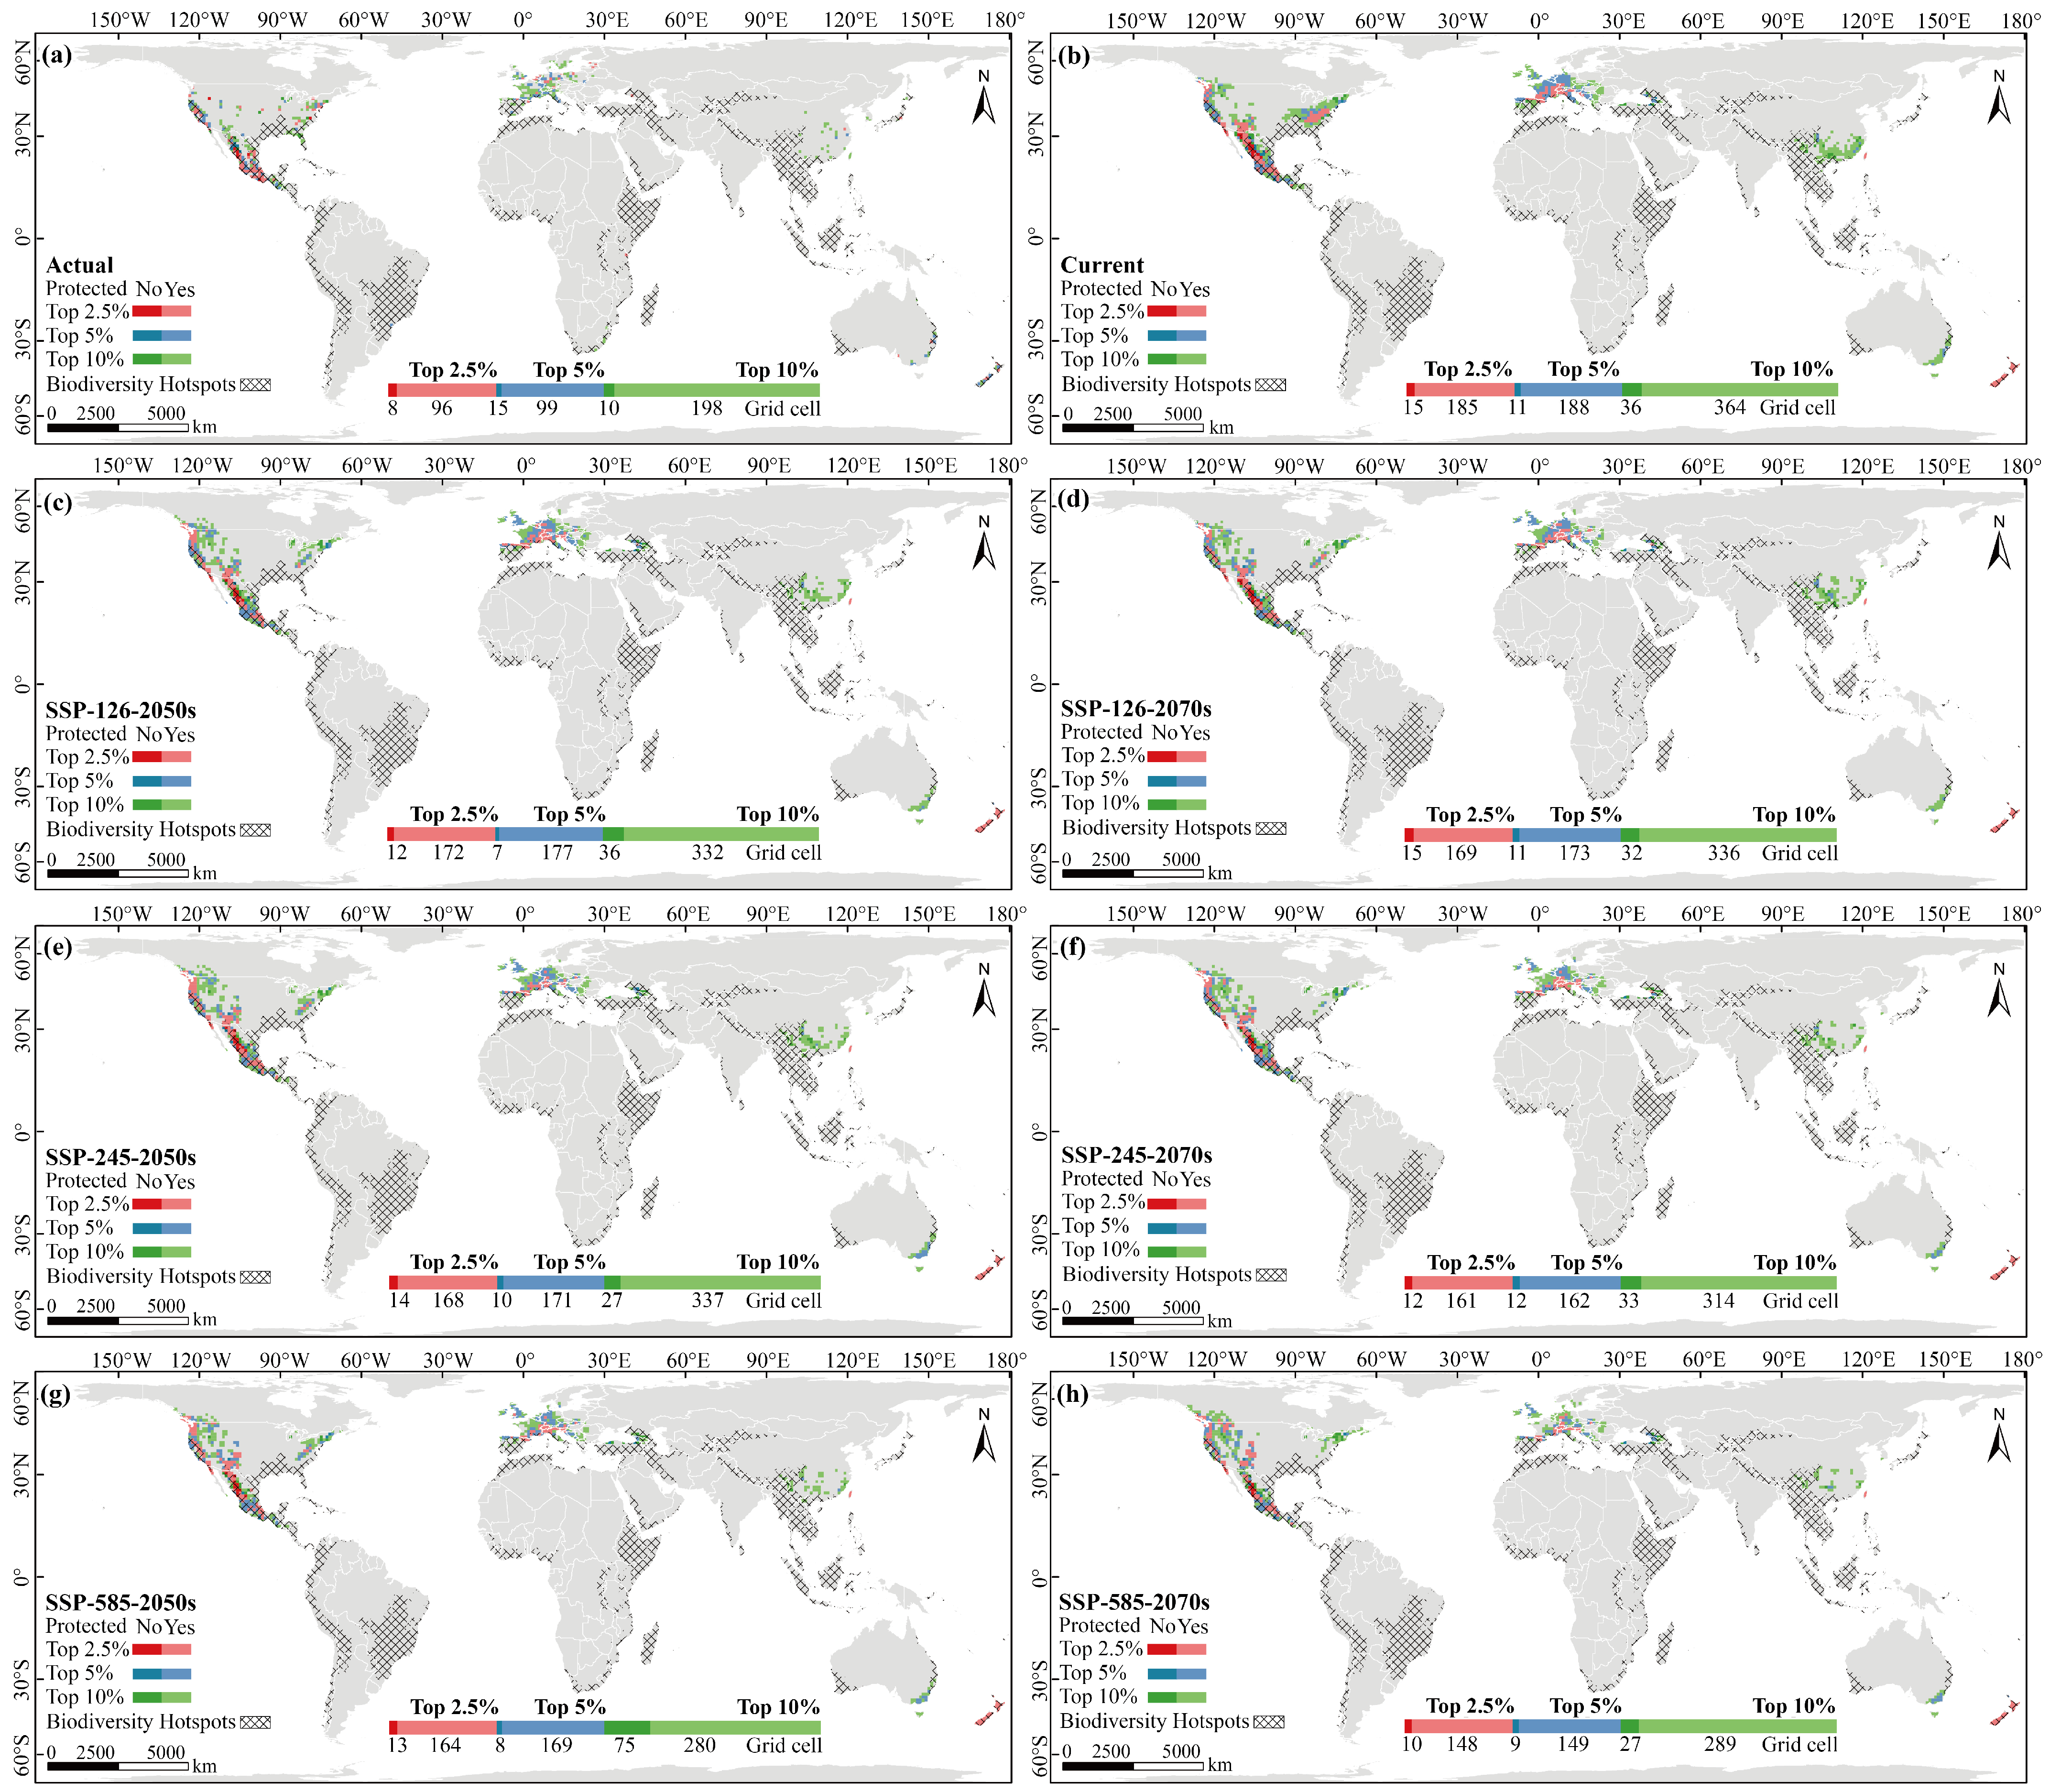
Based on the observed Pinus richness patterns, the top 2.5%, 5%, and 10% richness thresholds yielded 104, 208, and 416 hotspot grid cells, respectively. These hotspots were primarily located within four global terrestrial biodiversity hotspots: the Madrean Pine-Oak Woodlands, California Floristic Province, the Mediterranean Basin, and New Zealand (Figure 7a). Analysis of protection coverage revealed that, regardless of the threshold used to identify Pinus richness hotspots, over 92.31% of these grid cells were covered by existing protected areas. The protected Pinus hotspot grid cells contained at least 101 species, representing 89.38% of the total number of Pinus species worldwide. One CR, eight EN, four VU, and eleven NT Pinus species were captured in our modeled distributions, accounting for 50%, 88.89%, 57.14% and 73.33% of the global total of each risk category, respectively. Overall, Pinus species were well protected on a global scale. However, notable differences existed between continents. Prominent conservation gaps within hotspot zones were mainly distributed across Mexico.
The potential richness hotspots of Pinus under current climate conditions included 200, 399, and 799 grid cells for the top 2.5%, 5%, and 10% richness thresholds, respectively. These hotspots were primarily distributed across five global biodiversity hotspots: the Madrean Pine-Oak Woodlands, the Mediterranean Basin, California Floristic Province, New Zealand, and Indo-Burma (Figure 7b). Spatial patterns of Pinus hotspots under different future climate conditions were basically consistent with the current potential hotspot distribution (Figure 7c–h). However, driven by global overheating, multifaceted climatic shifts and rising CO2 concentrations, the extents of biodiversity hotspots are projected to contract, alongside an overall poleward range shift trend. Compared to the current actual hotspot distribution pattern, potential hotspot grids are projected to expand in eastern North America, southern Europe, and southern and southwestern China. Within the existing protection network, more than 92.24% of the hotspot grids are covered by protected areas. Based on the top 10% richness threshold, protected hotspot grids worldwide harbor at least 96.46% of all Pinus species, yet conservation gaps are projected to emerge in eastern North America and southeastern Europe in the future.
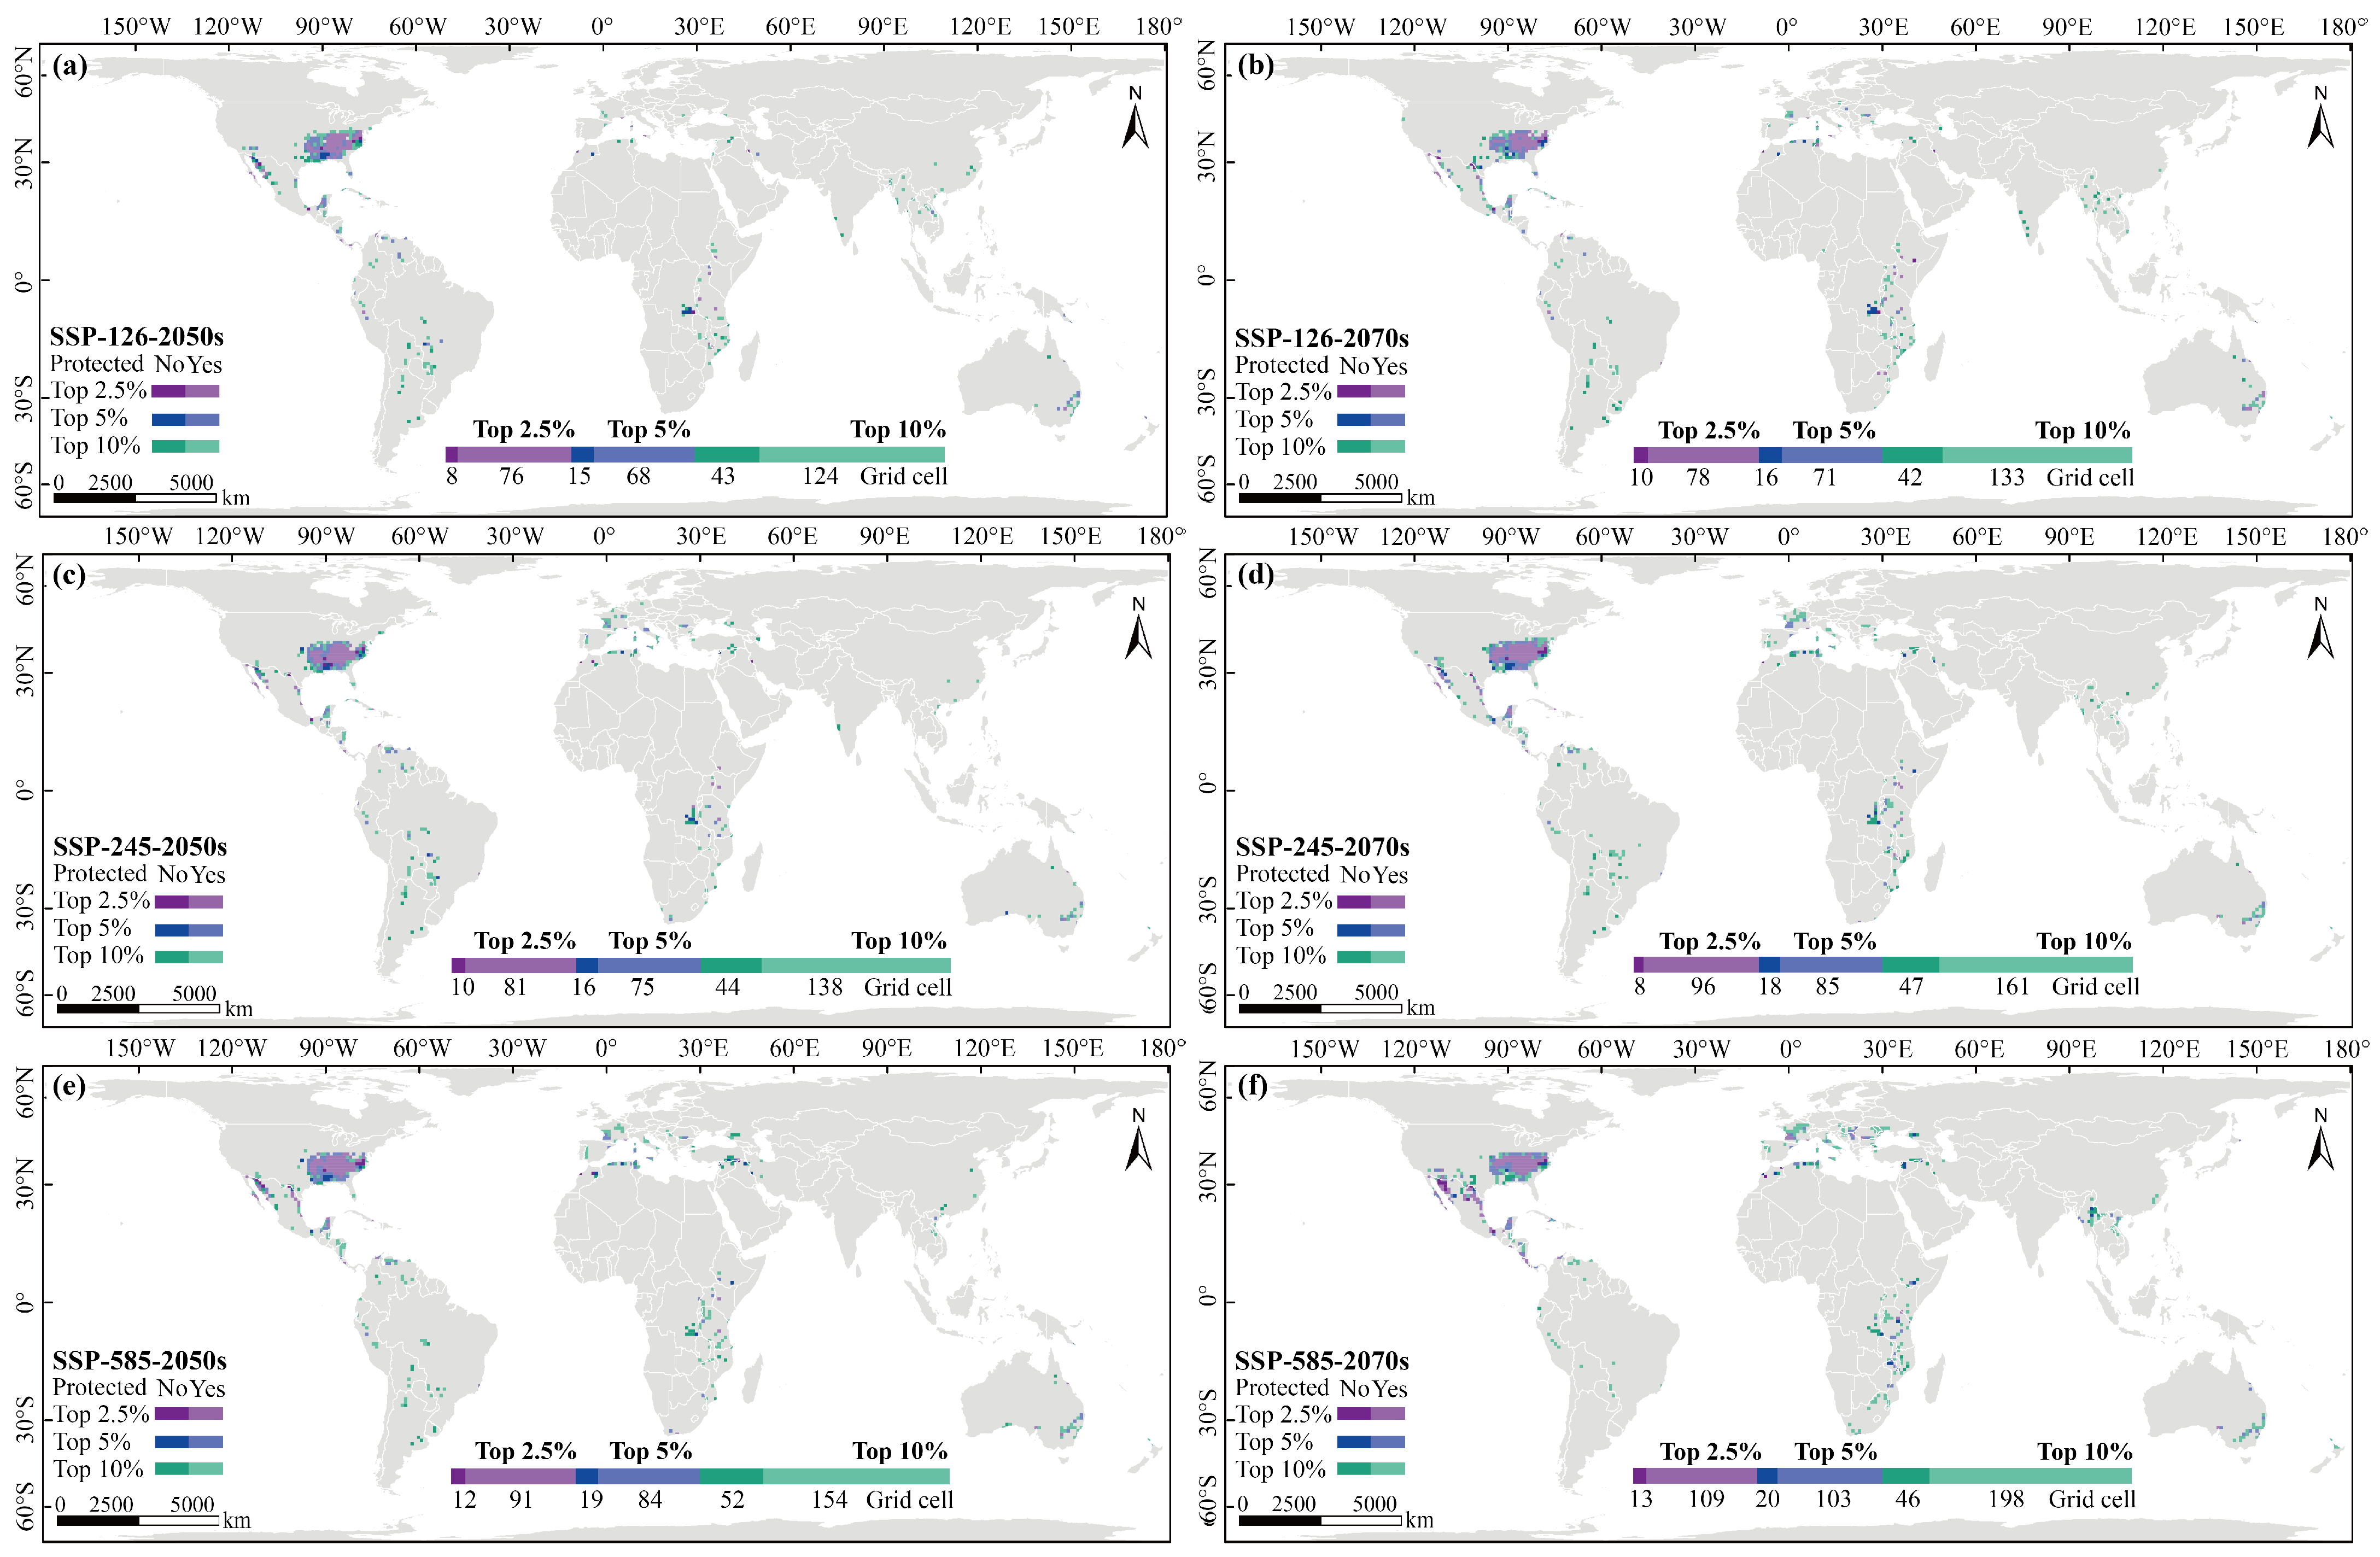
Using the top 2.5%, 5%, and 10% thresholds, richness decline hotspots were delineated under six future climate scenarios, with consistent spatial patterns among thresholds (Figure 8). These high-decline regions were mainly concentrated in southeastern North America and Mexico. Conservation gap analysis revealed that 79.85%–92.31% of the high-decline grid cells were covered by existing protected areas, with substantial variations in coverage rates among different scenarios. Notably, significant conservation gaps are projected to occur in southeastern North America, particularly on the eastern side of the Appalachian Mountains and the southern Great Plains.

4. Discussion

At large spatial scales, climate represents a dominant factor shaping species distribution patterns [51]. According to the results of the Jackknife method, a total of ten climate variables are closely associated with the global distribution of Pinus. We assessed the importance of the main predictor factors identified by the model and concluded that both temperature and precipitation are the limiting factors restricting the current distribution of Pinus, aligning with previous studies on Pinus species [30,31,50,52]. The response curves of bioclimatic variables reflect the impact of key climatic drivers on the climatic envelope range of Pinus. Our findings reveal that suitable temperature and sufficient precipitation are critical environmental variables influencing the distribution of Pinus species (Figure S1), particularly BIO1, BIO5, BIO12, and BIO19, with BIO1 exerting the most significant influence. Notably, despite obvious differences in the ranking of important variables across different species, BIO1 consistently emerges as the strongest influencing factor affecting the distribution of Pinus species (Figure 4), suggesting that temperature exerts a greater impact on their distribution than precipitation. Similar conclusions have been drawn in other studies, where temperature-related variables were found to play a more critical role in influencing the geographical distribution of Pinus species and demonstrated higher sensitivity to climate fluctuations compared to precipitation factors [31,53].
Modeled suitability for the genus peaked within an annual mean temperature range of −0.96 to 22.61 °C and at annual precipitation values above 244.58 mm. Our finding is consistent with the characteristics of Pinus, indicating its unsuitability for high temperatures and limited cold tolerance [54,55]. Moderate warming can facilitate the growth and development of trees, but when temperatures surpass their optimal range, high temperatures may become a limiting factor for the growth of Pinus plants [56]. Consequently, a suitable temperature range is crucial for tree growth [57]. On the other hand, during their growth process, trees utilize substantial amounts of soil moisture. An increase in precipitation enhances soil moisture supply, reduces drought-related stress to vegetation, and fosters their development [52]. In particular, adequate winter precipitation can elevate soil moisture content and promote carbohydrate accumulation [58,59]. Studies have shown that average drought stress in forests by the 2050s is expected to exceed the most extreme drought occurrences recorded over the past 1000 years [60]. Coupled with global overheating, linked climatic variation and ongoing greenhouse gas emissions, changes in temperature and precipitation are projected to surpass the thresholds currently suited for plant growth, leading to further migration and reduction in species distribution ranges [61,62]. This situation will heighten the extinction risk for Pinus species and bring new survival challenges for them. Crucially, deep cuts to greenhouse gas emissions are foundational to avoid catastrophic habitat loss for Pinus; local conservation efforts will be largely ineffective under unmitigated warming. The warm trailing edges of Pinus ranges also merit focused attention, as these peripheral populations face the earliest and most severe climate-driven range contractions. Therefore, in order to reduce the effects of extreme climate events on Pinus globally, it is crucial to conduct research and implement targeted protection measures for potential Pinus climatic envelopes.
We posited that climate acts as the primary predictive driver shaping shifts in Pinus climatic envelopes, although our models did not explicitly quantify dispersal ability, landscape connectivity, biotic interactions, or evolutionary adaptation to climate change [63,64,65,66]. A 12.5° geographic buffer was applied to define the accessible background range for all distribution projections; this buffer restricted the spatial domain for climatic suitability calculation but did not implement formal dispersal process modeling. Previous studies have shown that long-distance dispersal is often not a requisite for the widespread distribution of coniferous species across continuous or nearly continuous land, provided that suitable climatic envelopes are abundantly available [25]. Consequently, our results solely capture the climatic niche and optimal climatic conditions of the focal Pinus species.
Our findings suggest that the climatic envelope of Pinus species is mainly distributed across the Northern Hemisphere, covering North America, Europe, and northern and eastern Asia, with limited climatically suitable zones in the Southern Hemisphere (Figure 2). The model’s predictions of potential climatic envelopes for Pinus are highly consistent with the actual distribution, thereby validating the model’s accuracy. Furthermore, with future intensification of global overheating and related climatic variation, the climatic envelope distribution of Pinus is projected to shift northward, accompanied by substantial range contractions across the genus (Figure 2). These predictions support the notion that global overheating and associated climatic shifts are driving the migration of numerous species toward higher latitudes [67,68].
In recent decades, extreme climate events have increasingly occurred worldwide, land use has intensified, and species distributions have significantly responded to climate change [69]. Previous research has reported threats to Pinus species resulting from climate change [23,32,70,71]. Our results utilizing the MaxEnt model indicate that the distribution range of 7.96%–44.25% of Pinus species is expected to contract significantly due to climate change (Table S5), with the maximum losses exceeding 49.19%, thereby exposing these species to extremely high extinction risks. This contraction may be attributed to climate change diminishing the climate adaptability and competitiveness of these species [72,73]. However, different tree species exhibit varied responses to climate change, which may stem from the differing characteristics of species [70]. Overall, global climate change may significantly impact species climatic envelopes, ultimately altering the richness distribution pattern of Pinus species.
Owing to differences in input data and analytical approaches, our mapped Pinus richness distribution broadly aligns with prior research [23,47], yet discrepancies in richness cell counts exist (Figure 5). Notably, the current occurrence range of Pinus is quite different from the predicted richness distribution area (the number of grid cells containing Pinus species increased by 92.13%), particularly in the Southern Hemisphere. This difference is partly attributed to the inevitable inclusion of sample records of non-native species that arise from extensive cultivation in our analyses (mainly distributed in the Southern Hemisphere). Additionally, the invasion of Pinus species in this region may contribute to this phenomenon, as the competitive pressure posed by species that are adapted to the local environment is relatively low [74,75]. However, whether a species is able to spread into new areas with favorable climates is influenced by a range of additional factors, including its dispersal capacity and landscape connectivity [65].
Our study found that mountainous areas in North America, the Mediterranean, and mid-latitudes of East Asia continue to exhibit high species richness despite the impacts of climate change (Figure 5). Mountains are essential for sustaining species richness, which has been widely acknowledged as a direct result of geological history and environmental heterogeneity [76]. Heterogeneous terrain generates diverse ecological niches that facilitate species coexistence and serve as climatic refugia buffering species from glacial climate fluctuations [77,78].
The predicted results for Pinus species richness in the 2050s and 2070s indicate that, on average, 19.59% and 19.28% of the land surface will increase in richness, respectively, while 25.31% and 28.59% of the area will decrease. As global overheating and linked climatic variation intensify, the extent of increase in richness is expected to decline over time, whereas the extent of decrease will generally exhibit an upward trend. The spatial patterns across various emissions scenarios are similar, but the spatial distribution under the maximum climate change scenario (SSP-585-2070s) shows the most significant alteration. Increases in Pinus richness are predominantly concentrated in mid-latitude and high-latitude regions, where studies have demonstrated that plant productivity and diversity are largely controlled by temperature [79]. Based on our knowledge of the historical dynamics of Pinus, the species tends to maintain its ancestral climatic niche characterized by cooler environments, thereby providing a competitive advantage at higher latitudes [26,55]. If these species migrate northward, niche conservatism may enable them to successfully endure the colder winter temperatures at higher latitudes while avoiding drought conditions prevalent at lower latitudes [23]. Decreases in richness are most likely to occur in southeastern North America, the Mediterranean Basin, and most regions south of 30° N. Southeastern North America and the Mediterranean Basin are expected to encounter considerable droughts in the future, leading to a dramatic decline in species suitability, which could adversely affect Pinus richness in these regions [23]. Human land use change acts as a synergistic stressor that magnifies climate-induced conifer habitat loss, especially across the southeastern United States. Native natural conifer ecosystems have largely been replaced by uniform commercial timber plantations; such intensive land conversion fragments wild pine populations and weakens their capacity to cope with future climatic shifts. Furthermore, extreme heat and excessive precipitation are primary factors limiting the diversity of Pinus species at low latitudes [55].
We employed the top 2.5%, 5%, and 10% richness hotspot algorithms to identify 104, 208, and 416 hotspot grid cells, respectively, which represent only 0.71% to 2.84% of the global land area while encompassing at least 89.38% of Pinus species. Furthermore, these hotspot areas also provide climatic envelope space for 24 endangered species, highlighting their critical importance for the conservation and management of Pinus species. Current protected areas cover 16.1% of the Earth’s land area and are frequently situated in regions of high biodiversity [49]. Although the proportion of overlap between a species’ extant range and the boundaries of a protected area may be small, these areas can still serve as effective refuges, particularly for populations of globally threatened species [80,81]. As shown in the Results Section, the current distribution of Pinus hotspots is relatively concentrated, with some hotspot grids spanning 4 of the 36 global terrestrial biodiversity hotspots defined by the Conservation International’s Biodiversity Hotspots Database. Fortunately, the protective measures in place for the identified hotspots are relatively effective, with the coverage rate of protected areas reaching between 92.31% and 94.47%. Such a high coverage rate is largely because Pinus diversity hotspots are mainly distributed in temperate mountain regions with abundant large protected lands. In addition, unlike tropical biodiversity hotspots with severe habitat loss, Pinus-rich mountain areas have long been prioritized for conservation by various countries. However, due to the uneven global distribution of protected areas and the spatial disparities in protection status, the conservation effects on Pinus species vary across continents. Currently, centers of Pinus biodiversity in Europe (100%), East Asia (100%), and Oceania (100%) are better protected than those in North America (89.25%–89.60%). Notably, conservation gaps in existing hotspots are primarily found in the Mexican region (84.51%–87.23%), indicating that this area should be prioritized in future conservation and management strategies.
Future hotspot areas will contract (7.77%–21%) and shift poleward under stronger warming scenarios. Protected areas’ coverage remains high overall, but emerging gaps in eastern North America and southeastern Europe indicate that current reserve networks may not fully track future climatic suitability. However, prioritizing hotspots alone is insufficient to address the risks of species richness loss under climate change, as it fails to account for regions where richness will decline sharply. The identification of high-decline regions of potential species richness thus provides a critical supplement to the prioritization of Pinus conservation. As our results show, the high-decline regions under future climate scenarios are mainly concentrated in southeastern North America and Mexico. Although 79.85%–92.31% of the high-risk grid cells are covered by existing protected areas, this relatively high coverage is partly due to abundant mountain forest reserves distributed across these two regions. Notably, this coverage proportion only describes the protection status of current terrain, instead of Pinus climatic envelopes that will shift poleward in the future. The significant conservation gaps in southeastern North America—particularly on the eastern side of the Appalachian Mountains and the southern Great Plains—highlight unaddressed vulnerabilities. This finding indicates that effective conservation planning for Pinus must prioritize both biodiversity hotspots (areas with high species richness) and high-decline regions (areas experiencing severe losses in species richness). Biodiversity hotspots are the core for sustaining overall species diversity, while high-decline regions are crucial for protecting unique genetic resources and ecosystem functions that are underrepresented in hotspots. The coexistence of biodiversity hotspots and high-decline regions in Mexico and southeastern North America further underscores the urgency of implementing targeted measures in these “dual-risk” areas—such as expanding protected area networks, enhancing landscape connectivity, and adopting adaptive management—to mitigate the combined impacts of climate change and insufficient protection.

Data Limitations and Uncertainties

Our study carries several inherent limitations and uncertainties associated with climate envelope modeling. First, our continental analysis relies on coarse 10 km sampling cells and 100 km grid resolution, which cannot capture fine-scale mountain microrefugia and subtle topographic microclimate variations that buffer Pinus populations from warming. Second, as a pure climate niche model, MaxEnt only reflects the climatic tolerance of Pinus species and ignores key non-climate drivers governing real-world distributions, including interspecific competition, dispersal barriers, predation, soil conditions, and pervasive land use transformation; the absence of these constraints inevitably leads to model overprediction, explaining the large discrepancy between simulated suitable areas and observed species richness grids. Third, the presence-only occurrence data contain mixed native, naturalized, and cultivated records, and global databases lack standardized tags to separate these groups. Arbitrary filtering of non-native records would introduce subjective bias and reduce dataset representativeness; therefore, all records were retained, which may inflate predicted climatic suitability especially across the Southern Hemisphere. In addition, we used MaxEnt’s default random partitioning to split training and test data, a practice widely documented to overestimate model performance due to spatial autocorrelation among clustered occurrence points. Ensemble averaging further smooths heterogeneous model outputs and masks inter-model uncertainty, another well-documented drawback of common ensemble SDM workflows.
Substantial projection uncertainty stems from divergent future greenhouse gas emission pathways. The magnitude of pine range contraction, poleward shift and conservation gap expansion varies drastically depending on emission mitigation policies and whether global biodiversity targets such as the 30 × 30 and 50 × 50 frameworks are fully implemented. Without deep emission cuts and coordinated protection of fine-scale microrefugia both inside and outside richness hotspots, climate and land use pressures will jointly accelerate pine biodiversity loss. Our climate-only projections cannot serve as precise habitat forecasts; they merely map theoretical climatic envelopes. Future work should integrate high-resolution topography, land use layers and biotic interactions to reduce predictive bias, while targeted conservation actions combining emission mitigation, land use stress reduction and microrefugia safeguarding are critical to offset projected range declines.

5. Conclusions

Our study employed the MaxEnt model to predict the geographical distribution of 113 Pinus species under current and future climate conditions, aiming to investigate the global climatic envelope and richness distribution of Pinus, alongside their potential responses to climate change. Our findings indicate that temperature-related variables are crucial in determining the geographical distribution of Pinus. As global overheating and linked climatic variations intensify in the future, the climatic envelopes of Pinus are expected to migrate towards higher latitudes. Furthermore, climate change has diminished the climate adaptability and competitiveness of certain species, resulting in a notable decrease in the distribution ranges of most Pinus species, which in turn affects their richness distribution patterns. Although over 92% of Pinus richness hotspot grids fall within existing protected areas, uneven global coverage of protected areas and spatially inconsistent conservation statuses create distinct intercontinental gaps in Pinus conservation. Notably, the current protection gaps mainly occur in Mexico. In the future, it is essential to strengthen the protection of potential conservation gaps in eastern North America and southeastern Europe, and to prioritize “dual-risk” areas (e.g., Mexico and southeastern North America) by expanding protected area networks and enhancing landscape connectivity. Our continental-scale grids fail to capture mountain microclimates that form small climate refugia even within warming, range contraction zones. Fine-resolution topographic modeling is needed in follow-up research to detect these cryptic refugia and refine local conservation planning.
These spatial conservation insights align closely with core targets laid out in the Kunming–Montreal Global Biodiversity Framework, including the widely advocated target of 30% protected by 2030 (i.e., “30 × 30”) and the forward-looking long-term biodiversity vision of 50% protected by 2050 (i.e., “50 × 50”). Our data reveal that the current high coverage of Pinus hotspots alone cannot satisfy long-term climate-resilient conservation requirements; merely fulfilling the basic 30% terrestrial protection quota fails to accommodate poleward shifts in species’ climatic envelopes, while expanding protected land consistent with the 50 × 50 blueprint helps offset future emerging conservation gaps. The high-conservation-value Pinus hotspots and climate refugia identified in this study offer actionable spatial guidance for national authorities to rationally allocate land resources and deliver on international biodiversity obligations under the framework, and also support the development of targeted conservation strategies to counteract climate risks and sustain the long-term protection of global Pinus biodiversity.

Supplementary Materials

The following supporting information can be downloaded at https://www.mdpi.com/article/10.3390/f17080865/s1: Figure S1: Response curves and spatial distribution maps of important environmental predictors in species distribution model for Pinus; Table S1: Threatened status, number of records, and test AUC values based on MaxEnt model for each Pinus species; Table S2: Bioclimatic variables used in study; Table S3: Pearson correlation coefficients among 19 bioclimatic variables used in initial screening; Table S4: The relative importance of the 10 selected variables provided by the MaxEnt model in predicting the potential distribution of 111 Pinus species; Table S5: The potential climatic envelope range changes of 113 Pinus species under future climate scenarios; Table S6: Statistics on the actual and potential richness distribution of grid cells for Pinus. Table S7: Statistics on potential changes in Pinus species richness across grid cells under future climate scenarios.

Author Contributions

Conceptualization, J.Y. and H.Z.; methodology, J.Y. and H.Z.; software, J.Y. and X.X.; validation, J.Y. and H.Z.; formal analysis, J.Y. and H.Z.; investigation, J.Y.; resources, H.Z.; data curation, J.Y.; writing—original draft preparation, J.Y., H.Z. and X.X.; writing—review and editing, J.Y., H.Z. and X.X.; visualization, J.Y. and X.X.; supervision, H.Z.; project administration, J.Y.; funding acquisition, H.Z. All authors have read and agreed to the published version of the manuscript.

Funding

This research was funded by the National Water Pollution Control and Treatment Science and Technology Major Project (2017ZX07101) and the Discipline Construction Program of Huayong Zhang, Distinguished Professor of Shandong University, School of Life Sciences (61200082363001).

Data Availability Statement

The distribution data for 113 Pinus species were collected from the BRAHMS database (https://herbaria.plants.ox.ac.uk/bol/conifers/, accessed on accessed 28 May 2024) and the Global Biodiversity Information Facility (GBIF, https://www.gbif.org/, accessed on 27 May 2024). The current and future bioclimatic variables are available from WorldClim (http://www.worldclim.org/). The polygon data for global protected areas were obtained from the World Database on Protected Areas (WDPA, https://www.protectedplanet.net/), while we further supplemented the data for China’s protected areas using the China Nature Reserve Specimen Resource Sharing Platform (http://www.papc.cn/).

Conflicts of Interest

The authors declare no conflicts of interest.

References

  1. IPCC Summary for Policymakers. Climate Change 2023: Synthesis Report; Lee, H., Romero, J., Eds.; Contribution of Working Groups I, II and III to the Sixth Assessment Report of the Intergovernmental Panel on Climate Change; IPCC: Geneva, Switzerland, 2023; pp. 1–34. [Google Scholar]
  2. Thuiller, W.; Lavergne, S.; Roquet, C.; Boulangeat, I.; Lafourcade, B.; Araujo, M.B. Consequences of Climate Change on the Tree of Life in Europe. Nature 2011, 470, 531–534. [Google Scholar] [CrossRef] [PubMed]
  3. Scheffers, B.R.; De Meester, L.; Bridge, T.C.L.; Hoffmann, A.A.; Pandolfi, J.M.; Corlett, R.T.; Butchart, S.H.M.; Pearce-Kelly, P.; Kovacs, K.M.; Dudgeon, D.; et al. The Broad Footprint of Climate Change from Genes to Biomes to People. Science 2016, 354, aaf7671. [Google Scholar] [CrossRef] [PubMed]
  4. Lloyd, A.H.; Bunn, A.G. Responses of the Circumpolar Boreal Forest to 20th Century Climate Variability. Environ. Res. Lett. 2007, 2, 045013. [Google Scholar] [CrossRef]
  5. Blois, J.L.; Zarnetske, P.L.; Fitzpatrick, M.C.; Finnegan, S. Climate Change and the Past, Present, and Future of Biotic Interactions. Science 2013, 341, 499–504. [Google Scholar] [CrossRef] [PubMed]
  6. Walther, G.R.; Berger, S.; Sykes, M.T. An Ecological “footprint” of Climate Change. Proc. R. Soc. B Biol. Sci. 2005, 272, 1427–1432. [Google Scholar] [CrossRef] [PubMed]
  7. Fadrique, B.; Báez, S.; Duque, Á.; Malizia, A.; Blundo, C.; Carilla, J.; Osinaga-Acosta, O.; Malizia, L.; Silman, M.; Farfán-Ríos, W.; et al. Widespread but Heterogeneous Responses of Andean Forests to Climate Change. Nature 2018, 564, 207–212. [Google Scholar] [CrossRef] [PubMed]
  8. Colwell, R.K.; Brehm, G.; Cardelús, C.L.; Gilman, A.C.; Longino, J.T.; Cardelus, C.L.; Gilman, A.C.; Longino, J.T. Global Warming, Elevational Range Shifts, and Lowland Biotic Attrition in the Wet Tropics. Science 2008, 322, 258–261. [Google Scholar] [CrossRef] [PubMed]
  9. Barber, Q.E.; Nielsen, S.E.; Hamann, A. Assessing the Vulnerability of Rare Plants Using Climate Change Velocity, Habitat Connectivity, and Dispersal Ability: A Case Study in Alberta, Canada. Reg. Environ. Change 2016, 16, 1433–1441. [Google Scholar] [CrossRef]
  10. Wang, R.; Yang, H.; Wang, M.; Zhang, Z.; Huang, T.; Wen, G.; Li, Q. Predictions of Potential Geographical Distribution of Diaphorina Citri (Kuwayama) in China under Climate Change Scenarios. Sci. Rep. 2020, 10, 9202. [Google Scholar] [CrossRef] [PubMed]
  11. Ackerly, D.D.; Loarie, S.R.; Cornwell, W.K.; Weiss, S.B.; Hamilton, H.; Branciforte, R.; Kraft, N.J.B. The Geography of Climate Change: Implications for Conservation Biogeography. Divers. Distrib. 2010, 16, 476–487. [Google Scholar] [CrossRef]
  12. IUCN. The IUCN Red List of Threatened Species. Available online: https://www.iucnredlist.org/ (accessed on 17 November 2024).
  13. Zhao, Y.; Deng, X.; Xiang, W.; Chen, L.; Ouyang, S. Predicting Potential Suitable Habitats of Chinese Fir under Current and Future Climatic Scenarios Based on Maxent Model. Ecol. Inform. 2021, 64, 101393. [Google Scholar] [CrossRef]
  14. Bellard, C.; Bertelsmeier, C.; Leadley, P.; Thuiller, W.; Courchamp, F. Impacts of Climate Change on the Future of Biodiversity. Ecol. Lett. 2012, 15, 365–377. [Google Scholar] [CrossRef] [PubMed]
  15. Sun, S.; Zhang, Y.; Huang, D.; Wang, H.; Cao, Q.; Fan, P.; Yang, N.; Zheng, P.; Wang, R. The Effect of Climate Change on the Richness Distribution Pattern of Oaks (Quercus L.) in China. Sci. Total Environ. 2020, 744, 140786. [Google Scholar] [CrossRef] [PubMed]
  16. Lu, Y.; Liu, H.; Chen, W.; Yao, J.; Huang, Y.; Zhang, Y.; He, X. Conservation Planning of the Genus Rhododendron in Northeast China Based on Current and Future Suitable Habitat Distributions. Biodivers. Conserv. 2021, 30, 673–697. [Google Scholar] [CrossRef]
  17. Xian, Y.; Lu, Y.; Liu, G. Is Climate Change Threatening or Beneficial to the Habitat Distribution of Global Pangolin Species? Evidence from Species Distribution Modeling. Sci. Total Environ. 2022, 811, 151385. [Google Scholar] [CrossRef] [PubMed]
  18. Zhang, W.; Bussmann, R.W.; Li, J.; Liu, B.; Xue, T.; Yang, X.; Qin, F.; Liu, H.; Yu, S. Biodiversity Hotspots and Conservation Efficiency of a Large Drainage Basin: Distribution Patterns of Species Richness and Conservation Gaps Analysis in the Yangtze River Basin, China. Conserv. Sci. Pract. 2022, 4, e12653. [Google Scholar] [CrossRef]
  19. Wang, F.; Yuan, X.; Sun, Y.; Liu, Y. Species Distribution Modeling Based on MaxEnt to Inform Biodiversity Conservation in the Central Urban Area of Chongqing Municipality. Ecol. Indic. 2024, 158, 111491. [Google Scholar] [CrossRef]
  20. Phillips, S.J.; Dudík, M. Modeling of Species Distributions with Maxent: New Extensions and a Comprehensive Evaluation. Ecography 2008, 31, 161–175. [Google Scholar] [CrossRef]
  21. Merow, C.; Smith, M.J.; Silander, J.A. A Practical Guide to MaxEnt for Modeling Species’ Distributions: What It Does, and Why Inputs and Settings Matter. Ecography 2013, 36, 1058–1069. [Google Scholar] [CrossRef]
  22. Li, W.B.; Teng, Y.; Zhang, M.Y.; Shen, Y.; Liu, J.W.; Qi, J.W.; Wang, X.C.; Wu, R.F.; Li, J.H.; Garber, P.A.; et al. Human Activity and Climate Change Accelerate the Extinction Risk to Non-Human Primates in China. Glob. Change Biol. 2024, 30, e17114. [Google Scholar] [CrossRef] [PubMed]
  23. Salazar-Tortosa, D.F.; Saladin, B.; Castro, J.; Rubio de Casas, R. Climate Change Is Predicted to Impact the Global Distribution and Richness of Pines (Genus Pinus) by 2070. Divers. Distrib. 2024, 30, e13849. [Google Scholar] [CrossRef]
  24. Dakhil, M.A.; Xiong, Q.; Farahat, E.A.; Zhang, L.; Pan, K.; Pandey, B.; Olatunji, O.A.; Tariq, A.; Wu, X.; Zhang, A.; et al. Past and Future Climatic Indicators for Distribution Patterns and Conservation Planning of Temperate Coniferous Forests in Southwestern China. Ecol. Indic. 2019, 107, 105559. [Google Scholar] [CrossRef]
  25. Farjon, A.; Filer, D. An Atlas of the World’s Conifers: An Analysis of Their Distribution, Biogeography, Diversity and Conservation Status; Brill: Leiden, The Netherlands, 2013. [Google Scholar]
  26. Richardson, D.M. Ecology and Biogeography of Pinus; Cambridge University Press: Cambridge, UK, 1998. [Google Scholar]
  27. Procheş, Ş.; Wilson, J.R.U.; Richardson, D.M.; Rejmánek, M. Native and Naturalized Range Size in Pinus: Relative Importance of Biogeography, Introduction Effort and Species Traits. Glob. Ecol. Biogeogr. 2012, 21, 513–523. [Google Scholar] [CrossRef]
  28. Gallien, L.; Saladin, B.; Boucher, F.C.; Richardson, D.M.; Zimmermann, N.E. Does the Legacy of Historical Biogeography Shape Current Invasiveness in Pines? New Phytol. 2016, 209, 1096–1105. [Google Scholar] [CrossRef] [PubMed]
  29. Allen, C.D.; Breshears, D.D. Drought-Induced Shift of a Forest-Woodland Ecotone: Rapid Landscape Response to Climate Variation. Proc. Natl. Acad. Sci. USA 1998, 95, 14839–14842. [Google Scholar] [CrossRef] [PubMed]
  30. Chi, Y.; Wang, G.G.; Zhu, M.; Jin, P.; Hu, Y.; Shu, P.; Wang, Z.; Fan, A.; Qian, P.; Han, Y.; et al. Potentially Suitable Habitat Prediction of Pinus massoniana Lamb. in China under Climate Change Using Maxent Model. Front. For. Glob. Change 2023, 6, 1144401. [Google Scholar] [CrossRef]
  31. Feng, J.; Wang, B.; Xian, M.; Zhou, S.; Huang, C.; Cui, X. Prediction of Future Potential Distributions of Pinus Yunnanensis Varieties under Climate Change. Front. For. Glob. Change 2023, 6, 1308416. [Google Scholar] [CrossRef]
  32. Yue, J.; Zhang, H.; Zhao, L.; Wang, Z.; Zou, H.; Liu, Z. Historical Climate Change Drives Species Richness Patterns of Pinus L. in China. Biodivers. Conserv. 2025, 34, 2177–2195. [Google Scholar] [CrossRef]
  33. Kass, J.M.; Guenard, B.; Dudley, K.L.; Jenkins, C.N.; Azuma, F.; Fisher, B.L.; Parr, C.L.; Gibb, H.; Longino, J.T.; Ward, P.S.; et al. The Global Distribution of Known and Undiscovered Ant Biodiversity. Sci. Adv. 2022, 8, eabp9908. [Google Scholar] [CrossRef] [PubMed]
  34. Pearson, R.G.; Dawson, T.P. Predicting the Impacts of Climate Change on the Distribution of Species: Are Bioclimate Envelope Models Useful? Glob. Ecol. Biogeogr. 2003, 12, 361–371. [Google Scholar] [CrossRef]
  35. Phillips, S.J.; Anderson, R.P.; Schapire, R.E. Maximum Entropy Modeling of Species Geographic Distributions. Ecol. Modell. 2006, 190, 231–259. [Google Scholar] [CrossRef]
  36. Swets, J.A. Measuring the Accuracy of Diagnostic Information. Science 1988, 240, 1285–1293. [Google Scholar] [CrossRef]
  37. Xu, L.; Fan, Y.; Zheng, J.; Guan, J.; Lin, J.; Wu, J.; Liu, L.; Wu, R.; Liu, Y. Impacts of Climate Change and Human Activity on the Potential Distribution of Aconitum leucostomum in China. Sci. Total Environ. 2024, 912, 168829. [Google Scholar] [CrossRef] [PubMed]
  38. Huang, R.; Du, H.; Wen, Y.; Zhang, C.; Zhang, M.; Lu, H.; Wu, C.; Zhao, B. Predicting the Distribution of Suitable Habitat of the Poisonous Weed Astragalus variabilis in China under Current and Future Climate Conditions. Front. Plant Sci. 2022, 13, 921310. [Google Scholar] [CrossRef] [PubMed]
  39. Zurell, D.; Graham, C.H.; Gallien, L.; Thuiller, W.; Zimmermann, N.E. Long-Distance Migratory Birds Threatened by Multiple Independent Risks from Global Change. Nat. Clim. Change 2018, 8, 992–996. [Google Scholar] [CrossRef] [PubMed]
  40. Pearson, R.G.; Raxworthy, C.J.; Nakamura, M.; Townsend Peterson, A. Predicting Species Distributions from Small Numbers of Occurrence Records: A Test Case Using Cryptic Geckos in Madagascar. J. Biogeogr. 2007, 34, 102–117. [Google Scholar] [CrossRef]
  41. Drake, J.M. Range Bagging: A New Method for Ecological Niche Modelling from Presence-Only Data. J. R. Soc. Interface 2015, 12, 20150086. [Google Scholar] [CrossRef] [PubMed]
  42. Andrew, S.C.; Mokany, K.; Falster, D.S.; Wenk, E.; Wright, I.J.; Merow, C.; Adams, V.; Gallagher, R. V Functional Diversity of the Australian Flora: Strong Links to Species Richness and Climate. J. Veg. Sci. 2021, 32, e13018. [Google Scholar] [CrossRef]
  43. IUCN. Guidelines for Using the IUCN Red List Categories and Criteria. Version 16. Prepared by the Standards and Petitions Committee. Available online: https://www.iucnredlist.org/resources/redlistguidelines (accessed on 17 November 2024).
  44. Peng, S.; Shrestha, N.; Luo, Y.; Li, Y.; Cai, H.; Qin, H.; Ma, K.; Wang, Z. Incorporating Global Change Reveals Extinction Risk beyond the Current Red List. Curr. Biol. 2023, 33, 3669–3678.e4. [Google Scholar] [CrossRef] [PubMed]
  45. Roll, U.; Feldman, A.; Novosolov, M.; Allison, A.; Bauer, A.M.; Bernard, R.; Böhm, M.; Castro-Herrera, F.; Chirio, L.; Collen, B.; et al. The Global Distribution of Tetrapods Reveals a Need for Targeted Reptile Conservation. Nat. Ecol. Evol. 2017, 1, 1677–1682. [Google Scholar] [CrossRef] [PubMed]
  46. Orme, C.D.L.; Davies, R.G.; Olson, V.A.; Thomas, G.H.; Ding, T.S.; Rasmussen, P.C.; Ridgely, R.S.; Stattersfield, A.J.; Bennett, P.M.; Owens, I.P.F.; et al. Global Patterns of Geographic Range Size in Birds. PLoS Biol. 2006, 4, e208. [Google Scholar] [CrossRef] [PubMed]
  47. Xie, H.; Tang, Y.; Fu, J.; Chi, X.; Du, W.; Dimitrov, D.; Liu, J.; Xi, Z.; Wu, J.; Xu, X. Diversity Patterns and Conservation Gaps of Magnoliaceae Species in China. Sci. Total Environ. 2022, 813, 152665. [Google Scholar] [CrossRef] [PubMed]
  48. Prendergast, J.R.; Quinn, R.M.; Lawton, J.H.; Eversham, B.C.; Gibbons, D.W. Rare Species, the Coincidence of Diversity Hotspots and Conservation Strategies. Nature 1993, 365, 335–337. [Google Scholar] [CrossRef]
  49. Luo, A.; Li, Y.; Shrestha, N.; Xu, X.; Su, X.; Li, Y.; Lyu, T.; Waris, K.; Tang, Z.; Liu, X.; et al. Global Multifaceted Biodiversity Patterns, Centers, and Conservation Needs in Angiosperms. Sci. China Life Sci. 2024, 67, 817–828. [Google Scholar] [CrossRef] [PubMed]
  50. Ameca, E.I.; Nie, Y.; Wu, R.; Mittermeier, R.A.; Foden, W.; Wei, F. Identifying Protected Areas in Biodiversity Hotspots at Risk from Climate and Human-Induced Compound Events for Conserving Threatened Species. Sci. Total Environ. 2024, 938, 173192. [Google Scholar] [CrossRef] [PubMed]
  51. Field, R.; Hawkins, B.A.; Cornell, H.V.; Currie, D.J.; Diniz-Filho, J.A.F.; Guégan, J.F.; Kaufman, D.M.; Kerr, J.T.; Mittelbach, G.G.; Oberdorff, T.; et al. Spatial Species-Richness Gradients across Scales: A Meta-Analysis. J. Biogeogr. 2009, 36, 132–147. [Google Scholar] [CrossRef]
  52. Jin, S.; Chi, Y.; Li, X.; Shu, P.; Zhu, M.; Yuan, Z.; Liu, Y.; Chen, W.; Han, Y. Predicting the Response of Three Common Subtropical Tree Species in China to Climate Change. Front. For. Glob. Change 2023, 6, 1299120. [Google Scholar] [CrossRef]
  53. Wang, B.; Mao, J.F.; Zhao, W.; Wang, X.R. Impact of Geography and Climate on the Genetic Differentiation of the Subtropical Pine Pinus yunnanensis. PLoS ONE 2013, 8, e67345. [Google Scholar] [CrossRef] [PubMed]
  54. Hu, Y.; Liang, L.; Xiao, L.; Li, X. Fossils history of Pinus and its implications in biogeography. J. Earth Environ. 2022, 13, 243–256. [Google Scholar] [CrossRef]
  55. Jin, W.T.; Gernandt, D.S.; Wehenkel, C.; Xia, X.M.; Wei, X.X.; Wang, X.Q. Phylogenomic and Ecological Analyses Reveal the Spatiotemporal Evolution of Global Pines. Proc. Natl. Acad. Sci. USA 2021, 118, e2022302118. [Google Scholar] [CrossRef] [PubMed]
  56. Liu, X.; Nie, Y.; Wen, F. Seasonal Dynamics of Stem Radial Increment of Pinus taiwanensis Hayata and Its Response to Environmental Factors in the Lushan Mountains, Southeastern China. Forests 2018, 9, 387. [Google Scholar] [CrossRef]
  57. Rossi, S.; Deslauriers, A.; Anfodillo, T.; Carraro, V. Evidence of Threshold Temperatures for Xylogenesis in Conifers at High Altitudes. Oecologia 2007, 152, 1–12. [Google Scholar] [CrossRef] [PubMed]
  58. Xu, Z.; Shimizu, H.; Ito, S.; Yagasaki, Y.; Zou, C.; Zhou, G.; Zheng, Y. Effects of Elevated CO2, Warming and Precipitation Change on Plant Growth, Photosynthesis and Peroxidation in Dominant Species from North China Grassland. Planta 2014, 239, 421–435. [Google Scholar] [CrossRef] [PubMed]
  59. Jiao, L.; Xue, R.; Qi, C.; Chen, K.; Liu, X. Comparison of the Responses of Radial Growth to Climate Change for Two Dominant Coniferous Tree Species in the Eastern Qilian Mountains, Northwestern China. Int. J. Biometeorol. 2021, 65, 1823–1836. [Google Scholar] [CrossRef] [PubMed]
  60. Williams, A.P.; Allen, C.D.; Macalady, A.K.; Griffin, D.; Woodhouse, C.A.; Meko, D.M.; Swetnam, T.W.; Rauscher, S.A.; Seager, R.; Grissino-Mayer, H.D.; et al. Temperature as a Potent Driver of Regional Forest Drought Stress and Tree Mortality. Nat. Clim. Change 2013, 3, 292–297. [Google Scholar] [CrossRef]
  61. Parmesan, C.; Yohe, G. A Globally Coherent Fingerprint of Climate Change Impacts across Natural Systems. Nature 2003, 421, 37–42. [Google Scholar] [CrossRef] [PubMed]
  62. Duffy, K.; Gouhier, T.C.; Ganguly, A.R. Climate-Mediated Shifts in Temperature Fluctuations Promote Extinction Risk. Nat. Clim. Change 2022, 12, 1037–1044. [Google Scholar] [CrossRef]
  63. Pollock, L.J.; Tingley, R.; Morris, W.K.; Golding, N.; O’Hara, R.B.; Parris, K.M.; Vesk, P.A.; Mccarthy, M.A. Understanding Co-Occurrence by Modelling Species Simultaneously with a Joint Species Distribution Model (JSDM). Methods Ecol. Evol. 2014, 5, 397–406. [Google Scholar] [CrossRef]
  64. Meier, E.S.; Lischke, H.; Schmatz, D.R.; Zimmermann, N.E. Climate, Competition and Connectivity Affect Future Migration and Ranges of European Trees. Glob. Ecol. Biogeogr. 2012, 21, 164–178. [Google Scholar] [CrossRef]
  65. Li, G.; Xiao, N.; Luo, Z.; Liu, D.; Zhao, Z.; Guan, X.; Zang, C.; Li, J.; Shen, Z. Identifying Conservation Priority Areas for Gymnosperm Species under Climate Changes in China. Biol. Conserv. 2021, 253, 108914. [Google Scholar] [CrossRef]
  66. Bush, A.; Mokany, K.; Catullo, R.; Hoffmann, A.; Kellermann, V.; Sgrò, C.; McEvey, S.; Ferrier, S. Incorporating Evolutionary Adaptation in Species Distribution Modelling Reduces Projected Vulnerability to Climate Change. Ecol. Lett. 2016, 19, 1468–1478. [Google Scholar] [CrossRef] [PubMed]
  67. Xie, C.; Huang, B.; Jim, C.Y.; Han, W.; Liu, D. Predicting Differential Habitat Suitability of Rhodomyrtus tomentosa under Current and Future Climate Scenarios in China. For. Ecol. Manag. 2021, 501, 119696. [Google Scholar] [CrossRef]
  68. Li, J.; Chang, H.; Liu, T.; Zhang, C. The Potential Geographical Distribution of Haloxylon across Central Asia under Climate Change in the 21st Century. Agric. For. Meteorol. 2019, 275, 243–254. [Google Scholar] [CrossRef]
  69. Brown, C.J.; O’Connor, M.I.; Poloczanska, E.S.; Schoeman, D.S.; Buckley, L.B.; Burrows, M.T.; Duarte, C.M.; Halpern, B.S.; Pandolfi, J.M.; Parmesan, C.; et al. Ecological and Methodological Drivers of Species’ Distribution and Phenology Responses to Climate Change. Glob. Change Biol. 2016, 22, 1548–1560. [Google Scholar] [CrossRef] [PubMed]
  70. Dyderski, M.K.; Paź, S.; Frelich, L.E.; Jagodziński, A.M. How Much Does Climate Change Threaten European Forest Tree Species Distributions? Glob. Change Biol. 2018, 24, 1150–1163. [Google Scholar] [CrossRef] [PubMed]
  71. Puchałka, R.; Paź-Dyderska, S.; Jagodziński, A.M.; Sádlo, J.; Vítková, M.; Klisz, M.; Koniakin, S.; Prokopuk, Y.; Netsvetov, M.; Nicolescu, V.N.; et al. Predicted Range Shifts of Alien Tree Species in Europe. Agric. For. Meteorol. 2023, 341, 109650. [Google Scholar] [CrossRef]
  72. Thomas, K.A.; Stauffer, B.A.; Jarchow, C.J. Decoupling of Species and Plant Communities of the U.S. Southwest: A CCSM4 Climate Scenario Example. Ecosphere 2023, 14, e4414. [Google Scholar] [CrossRef]
  73. Feeley, K.J.; Bravo-Avila, C.; Fadrique, B.; Perez, T.M.; Zuleta, D. Climate-Driven Changes in the Composition of New World Plant Communities. Nat. Clim. Change 2020, 10, 965–970. [Google Scholar] [CrossRef]
  74. Taylor, K.T.; Maxwell, B.D.; Pauchard, A.; Nuñez, M.A.; Rew, L.J. Native versus Non-Native Invasions: Similarities and Differences in the Biodiversity Impacts of Pinus contorta in Introduced and Native Ranges. Divers. Distrib. 2016, 22, 578–588. [Google Scholar] [CrossRef]
  75. Peña, E.; Hidalgo, M.; Langdon, B.; Pauchard, A. Patterns of Spread of Pinus Contorta Dougl. Ex Loud. Invasion in a Natural Reserve in Southern South America. For. Ecol. Manag. 2008, 256, 1049–1054. [Google Scholar] [CrossRef]
  76. López-Pujol, J.; Zhang, F.M.; Sun, H.Q.; Ying, T.S.; Ge, S. Centres of Plant Endemism in China: Places for Survival or for Speciation? J. Biogeogr. 2011, 38, 1267–1280. [Google Scholar] [CrossRef]
  77. Sundaram, M.; Donoghue, M.J.; Farjon, A.; Filer, D.; Mathews, S.; Jetz, W.; Leslie, A.B. Accumulation over Evolutionary Time as a Major Cause of Biodiversity Hotspots in Conifers. Proc. R. Soc. B Biol. Sci. 2019, 286, 20191887. [Google Scholar] [CrossRef] [PubMed]
  78. Stein, A.; Gerstner, K.; Kreft, H. Environmental Heterogeneity as a Universal Driver of Species Richness across Taxa, Biomes and Spatial Scales. Ecol. Lett. 2014, 17, 866–880. [Google Scholar] [CrossRef] [PubMed]
  79. Venevskaia, I.; Venevsky, S.; Thomas, C.D. Projected Latitudinal and Regional Changes in Vascular Plant Diversity through Climate Change: Short-Term Gains and Longer-Term Losses. Biodivers. Conserv. 2013, 22, 1467–1483. [Google Scholar] [CrossRef]
  80. Pacifici, M.; Di Marco, M.; Watson, J.E.M. Protected Areas Are Now the Last Strongholds for Many Imperiled Mammal Species. Conserv. Lett. 2020, 13, e12748. [Google Scholar] [CrossRef]
  81. Cazalis, V.; Princé, K.; Mihoub, J.B.; Kelly, J.; Butchart, S.H.M.; Rodrigues, A.S.L. Effectiveness of Protected Areas in Conserving Tropical Forest Birds. Nat. Commun. 2020, 11, 4461. [Google Scholar] [CrossRef] [PubMed]
Figure 1. The relative importance of the ten selected bioclimatic variables in predicting the potential distributions of Pinus under current climatic conditions. The orange bars represent temperature-related variables, and the dark blue bars represent precipitation-related variables.
Forests 17 00865 g001
Figure 2. Current and future potential distribution of Pinus. (a) Map of potential climatic envelope under current climate scenarios; (b) statistics on areas of highly, moderately, and poorly potential suitable climatic zones in different climate scenarios; (ch) maps of potential climatic envelope based on six future climate scenarios.
Forests 17 00865 g002
Figure 3. Changes in the potential climatic envelopes of Pinus under the six future climate scenarios. (af) Maps illustrating range contraction, range expansion and no change zones of Pinus under the SSP-126-2050s, SSP-126-2070s, SSP-245-2050s, SSP-245-2070s, SSP-585-2050s, and SSP-585-2070s scenarios, respectively.
Forests 17 00865 g003
Figure 4. The relative importance and differences of the chosen variables derived from species-specific MaxEnt model simulations in predicting the potential distribution of various Pinus species. The orange boxes represent temperature-related variables, while the dark blue boxes represent precipitation-related variables. Within each box plot, the white square denotes the mean value of relative importance, and the black horizontal line inside the box denotes the median value of relative importance.
Forests 17 00865 g004
Figure 5. Current and future species richness distributions of Pinus. (a) Actual species richness distribution based on species distribution data; (b) current potential species richness distribution derived by superimposing binary climatic envelope maps from species-specific MaxEnt model simulations; (ch) future potential species richness distributions based on six climate scenarios, also generated by integrating results from species-specific MaxEnt model simulations.
Forests 17 00865 g005
Figure 6. Species richness changes of Pinus under the six future climate scenarios. (af) Maps illustrating species richness changes of Pinus under the SSP-126-2050s, SSP-126-2070s, SSP-245-2050s, SSP-245-2070s, SSP-585-2050s, and SSP-585-2070s scenarios, respectively. The red part in the circular chart represents species richness loss, the gray part represents no change, and the green part represents gain.
Forests 17 00865 g006
Figure 7. Current and future hotspots and conservation status of Pinus. (a) Actual hotspots and conservation status derived from species occurrence data; (b) current potential hotspots and conservation status based on species-specific MaxEnt model outputs; (ch) future potential hotspots and conservation status under six climate scenarios. Hotspots are identified using top 2.5%, 5%, and 10% hotspot richness algorithms; 36 global biodiversity hotspots are shown as black grids in figure for reference.
Forests 17 00865 g007
Figure 8. Potential spatial patterns and conservation gap distributions of high-decline regions of Pinus species richness under future climate scenarios. (af) Maps illustrating high-decline regions identified using top 2.5%, 5%, and 10% algorithms under the SSP-126-2050s, SSP-126-2070s, SSP-245-2050s, SSP-245-2070s, SSP-585-2050s, and SSP-585-2070s scenarios, respectively. High-decline regions are defined as grid cells with largest loss of potential species richness compared to current conditions.
Forests 17 00865 g008
Disclaimer/Publisher’s Note: The statements, opinions and data contained in all publications are solely those of the individual author(s) and contributor(s) and not of MDPI and/or the editor(s). MDPI and/or the editor(s) disclaim responsibility for any injury to people or property resulting from any ideas, methods, instructions or products referred to in the content.