1. Introduction
Wood connections are critical regions in timber structures, furniture, and engineered wood products because they control load transfer, stiffness, serviceability, and failure behavior. Conventional connections usually rely on metallic fasteners, mechanical connectors, or synthetic adhesives. Metallic fasteners may introduce local stress concentration and visual discontinuity, whereas adhesive bonding can involve curing time, volatile emissions, recyclability concerns, and reduced environmental compatibility. Adhesive-free joining has therefore attracted attention in furniture applications [
1,
2], panel products [
3,
4], and timber-type connections [
5].
Rotational friction welding of wood dowels is a promising adhesive-free joining method. A cylindrical dowel is rotated and plunged into a predrilled hole, and friction at the dowel–hole interface generates heat. Thermal softening and partial degradation of lignin and hemicelluloses contribute to material flow and consolidation [
6,
7], while local densification and mechanical interlocking also participate in interface formation [
8,
9]. These coupled physicochemical and mechanical effects distinguish wood-dowel welding from conventional fastening or adhesive bonding.
The feasibility of rotationally welded dowel joints has been demonstrated in different assemblies. Furniture joints have achieved performance comparable to glued dowel joints in some configurations [
1,
2], and welded dowels have also been applied to blockboards and panel-type products [
3,
4]. Shrink-fitting combined with dowel welding improved mortise-and-tenon connections [
5]. Studies on Canadian hardwoods, larch, and modified or densified dowels further demonstrated substantial withdrawal resistance [
8,
10,
11].These findings indicate potential for furniture, engineered wood products, and selected timber connection concepts.
However, the mechanical performance of welded dowel joints is sensitive to both process and material conditions. Rotational speed affects the rate of frictional energy input [
12], whereas plunging rate and welding duration influence contact time, axial compression, and consolidation [
13,
14]. Species-dependent studies further show that the favorable speed–rate combination is material specific [
4]. Interference, wood density and modification, grain orientation, moisture condition, and interface morphology also affect local contact and load transfer [
6,
11,
15,
16]. The hole-to-dowel diameter ratio directly affects contact pressure and compaction; rotational speed controls the rate of frictional energy input; and plunging rate simultaneously changes welding duration, axial compression, and material flow. Their combined effects should therefore be evaluated using a systematic experimental design.
Pull-out loading is one of the most direct methods for evaluating welded dowel joints because the welded interface is formed mainly along the cylindrical contact surface between the dowel and the substrate. The peak pull-out load reflects the combined effects of interfacial bonding, frictional resistance, mechanical interlocking, and local wood damage. Nevertheless, peak load alone may not fully describe the failure behavior of welded dowel joints. The load–displacement curve can also provide information on displacement at peak load, post-peak load degradation, sliding behavior, and failure suddenness. A well-formed welded interface may provide high peak resistance but may also fail abruptly once interfacial cracking or local wood failure is initiated. By contrast, an insufficiently welded interface may show lower peak load but a more gradual sliding-dominated response. Therefore, the post-peak response should be considered together with peak strength when evaluating the performance of welded dowel joints [
17,
18].
Although previous studies have provided important knowledge on the mechanism, parameter sensitivity, interface characteristics, and application potential of wood-dowel welding, further work is still needed for beech dowel joints fabricated under controlled rotational friction welding conditions. Beech is a dense hardwood commonly used in furniture, wood products, and dowel-type connection components. However, the combined effects of hole-to-dowel diameter ratio, rotational speed, and plunging rate on the pull-out behavior of rotationally friction-welded beech dowel joints remain insufficiently clarified. In particular, limited attention has been paid to combining orthogonal experimental design, supplementary testing for high-scatter groups, curve-based validity assessment, independent validation of the predicted optimal parameter combination, and quantitative evaluation of post-peak failure response.
Therefore, this study aims to optimize the welding parameters of rotationally friction-welded beech dowel joints under pull-out loading. An L9 orthogonal design was used to investigate the effects of hole-to-dowel diameter ratio, rotational speed, and plunging rate on pull-out capacity. Supplementary tests were conducted for groups with relatively large scatter, and load–displacement curves were examined to exclude clearly invalid specimens with abnormal responses. The screened data were then used for orthogonal range analysis to determine the influence ranking and optimal parameter combination. In addition to peak pull-out load, the post-peak half-load displacement, , was introduced to describe the suddenness of post-peak load degradation. Finally, an independent validation group was prepared using the predicted optimal parameters to verify the effectiveness of the optimization.
2. Materials and Methods
2.1. Materials
Beech wood (Fagus sylvatica L.) was used as both the substrate material and the dowel material in this study. Beech was selected because of its relatively high density, favorable mechanical properties, and common use in wood products, furniture components, and dowel-type connections.
The wood substrates were prepared as rectangular blocks with dimensions of 50 mm × 50 mm × 30 mm. Cylindrical beech dowels with a diameter of 10 mm were used. Before welding, all blocks and dowels were conditioned at (20 ± 2) °C and (65 ± 5)% relative humidity until constant mass. The equilibrium moisture content of the conditioned beech material was 13.3 ± 1.3% (mean ± SD, n = 5).
Specimens with visible defects, such as knots, cracks, severe grain deviation, local crushing, or surface damage, were excluded before welding. The grain direction of the wood substrates was kept consistent as far as possible to reduce the influence of wood anisotropy on the pull-out response.
2.2. Specimen Preparation and Rotational Friction Welding
Each pull-out specimen consisted of one beech block and one beech dowel. A predrilled hole was made at the center of the top surface, and the dowel was joined by rotational friction welding. The target plunging depth was 20 mm for all specimens.
Rotational friction welding was performed using a numerically controlled drilling machine. During welding, the dowel was rotated at a prescribed rotational speed and plunged into the predrilled hole at a controlled plunging rate. Rotation was stopped after the dowel reached the target plunging depth. The welded specimens were then allowed to cool naturally at room temperature before pull-out testing.
Three welding parameters were investigated: hole-to-dowel diameter ratio, rotational speed, and plunging rate. The hole-to-dowel diameter ratio was defined as:
where d
h is the predrilled hole diameter and d
d is the dowel diameter. Since d
d was 10 mm, ratios of 0.80, 0.85, and 0.90 corresponded to hole diameters of 8.0, 8.5, and 9.0 mm, respectively.
2.3. Orthogonal Experimental Design
An L9 orthogonal experimental design was adopted to investigate the effects of the three welding parameters on pull-out performance. The three factors were hole-to-dowel diameter ratio, rotational speed, and plunging rate, and each factor had three levels. The factor levels are listed in
Table 1.
The detailed L9 orthogonal design is shown in
Table 2. Six repeated specimens were prepared for each group in the initial orthogonal tests.
2.4. Supplementary and Validation Tests
After the first round of orthogonal tests, some groups showed relatively large scatter in peak pull-out load. To improve the reliability of the statistical results and further verify the observed trends, supplementary tests were conducted for the groups with relatively unstable responses.
The supplementary tests were not intended to replace the original orthogonal-test results. All valid supplementary observations were pooled with all valid first-round observations, and no valid first-round specimen was removed or replaced by a supplementary specimen. A specimen was excluded only when its complete load–displacement response met at least one of the curve-based validity criteria described in
Section 2.7. Additional specimens were prepared for T1, T7, T8, and T9, with 4, 7, 3, and 7 additional specimens, respectively.
In addition, an independent validation group, denoted as V, was prepared to verify the optimized parameter combination predicted from the orthogonal analysis. The validation group used a predrilled hole diameter of 8.0 mm, corresponding to a hole-to-dowel diameter ratio of 0.80, a rotational speed of 1800 rpm, a plunging rate of 14 mm·s
−1, and a plunging depth of 20 mm. A total of 7 validation specimens were prepared. The supplementary and validation test design is summarized in
Table 3.
Table 3.
Supplementary and validation test design.
Table 3.
Supplementary and validation test design.
| Test Type | Group | Number of Additional Specimens | Predrilled Hole Diameter
/mm | Rotational Speed
/rpm | Plunging Rate
/mm·s−1 | Purpose |
|---|
| Supplementary | T1 | 4 | 8.0 | 1600 | 6 | Additional replication for high-scatter group |
| T7 | 7 | 9.0 | 1600 | 14 |
| T8 | 3 | 9.0 | 1800 | 6 |
| T9 | 7 | 9.0 | 2000 | 10 |
| Validation | V | 7 | 8.0 | 1800 | 14 | Independent verification of predicted combination |
2.5. Pull-Out Test
Pull-out tests were carried out using an electromechanical universal testing machine (CMT4304, MTS Systems (China) Co., Ltd., Shanghai, China). The maximum load capacity of the testing machine was 30 kN, and the accuracy class was 0.5.
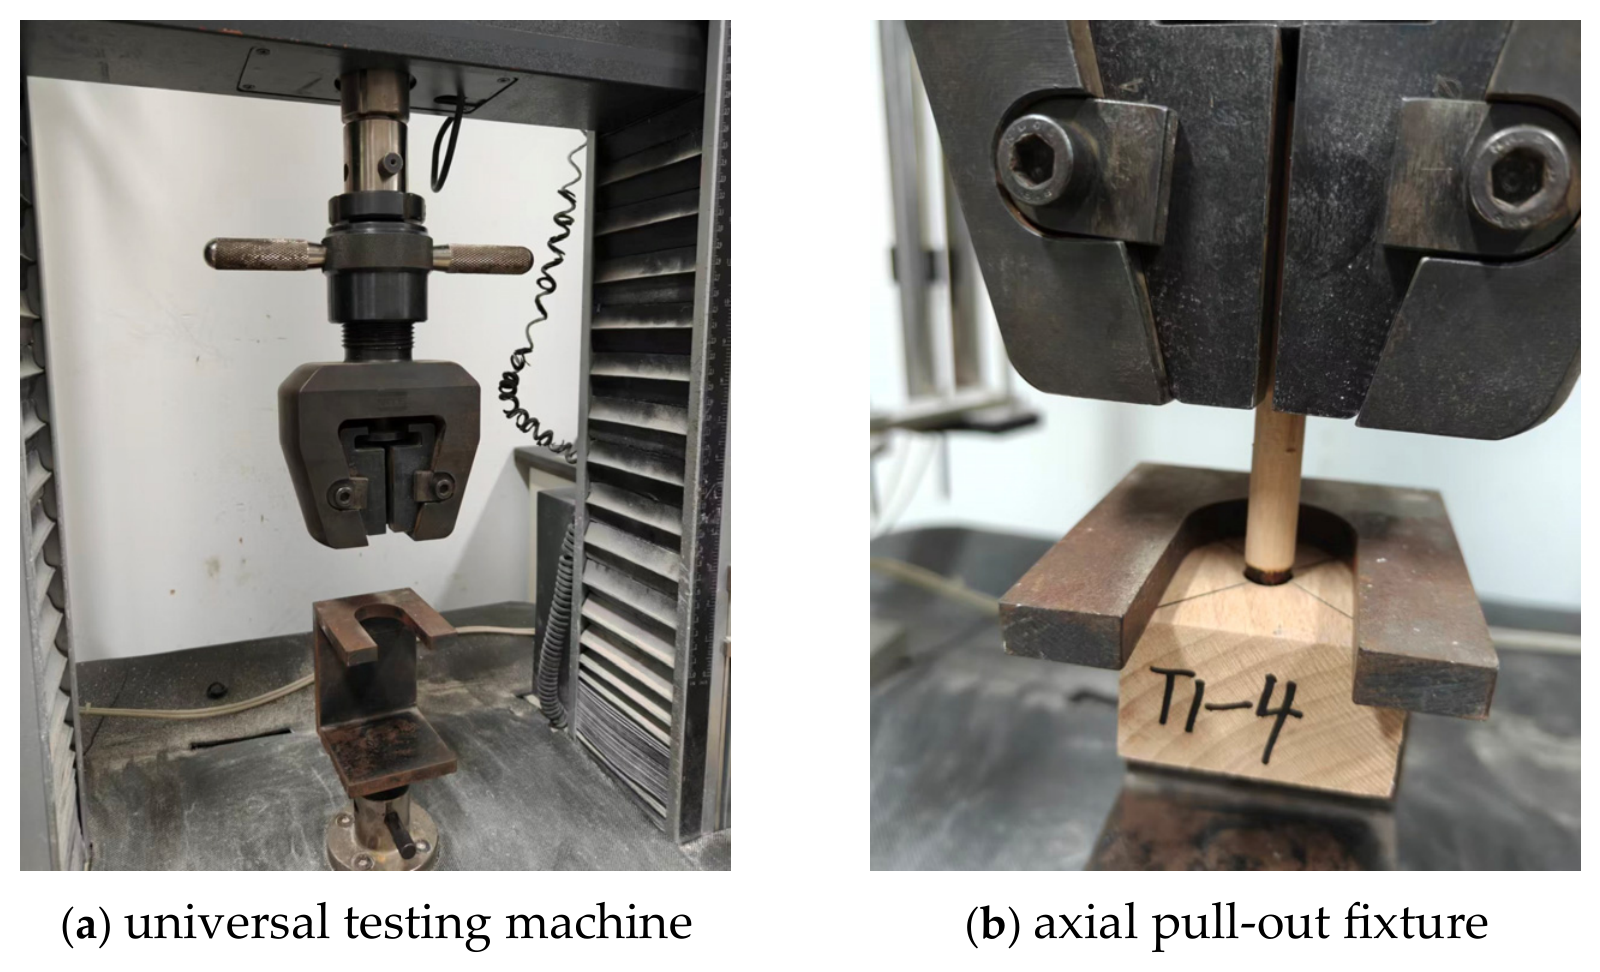
During testing, the wood substrate was fixed using a steel fixture with a central opening, while the upper end of the dowel was clamped by the upper grip of the testing machine. The dowel was pulled out along its axial direction at 2 mm/min. Load and displacement were continuously recorded throughout the test.
The pull-out testing setup is shown in
Figure 1. The steel fixture restricted the vertical movement of the substrate while allowing the dowel to be pulled out through the central opening. This configuration ensured that the measured load mainly reflected the axial pull-out resistance of the welded dowel joint.
For each specimen, the maximum load recorded during the test was defined as the peak pull-out load . The displacement corresponding to was defined as the peak displacement . The complete load–displacement curve was used to evaluate the pull-out capacity, curve shape, and post-peak failure response.
2.6. Post-Pull-Out Surface Inspection and Apparent Welded-Area Analysis
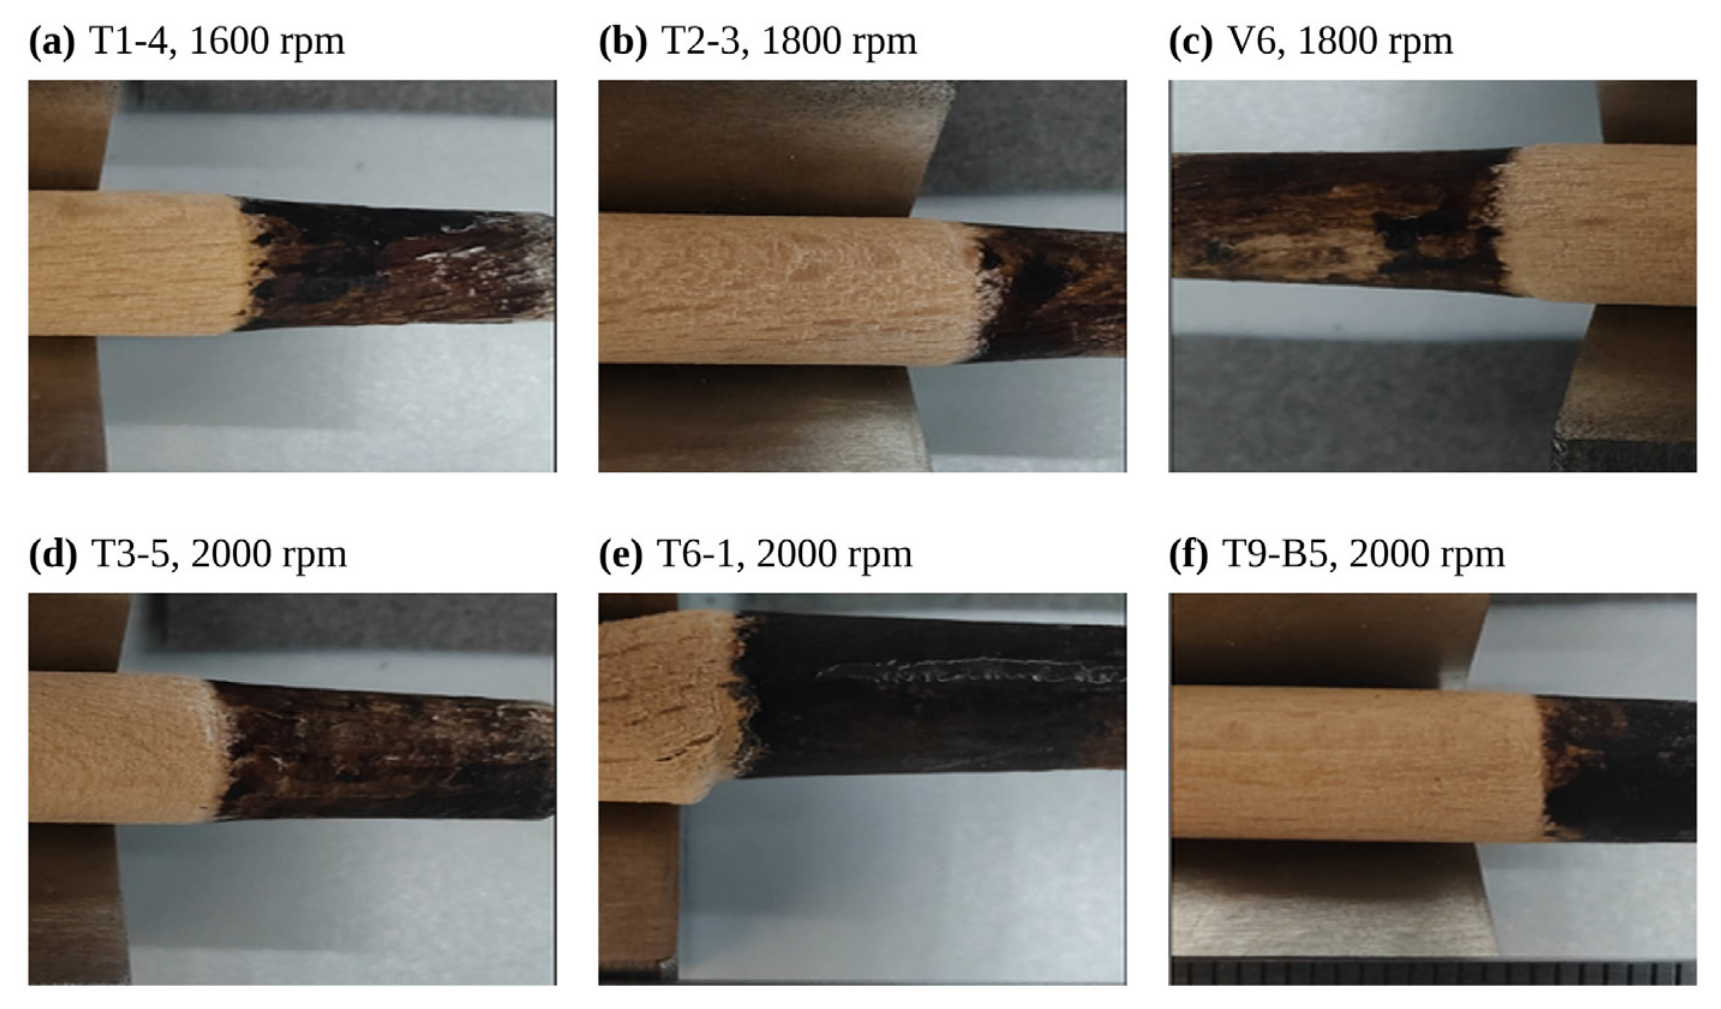
After pull-out testing, the dowels were completely withdrawn, exposing the dowel-side surface of the welded interface. Each extracted dowel was photographed from four circumferential directions at 90° intervals under consistent lighting, camera distance, exposure, white balance, and positioning conditions.
The surfaces were examined for dark-brown thermally modified regions, localized blackened regions, adhered substrate fibers, longitudinal sliding marks, relatively clean separation regions, and discontinuities in the visible interfacial layer. The global failure mode and local interfacial characteristics were classified qualitatively as interfacial separation/sliding, localized wood-fiber failure, or mixed failure.
Apparent welded-area analysis was performed within the 20 mm plunging region. The actual visible projected dowel area was denoted by Ad20, and the dark interfacial area identified using a common grayscale threshold of 0–70 was denoted by Ac20. The apparent welded-area ratio was calculated as R20 = Ac20/Ad20 × 100%.
Only specimens retained in the final effective mechanical dataset were included in the quantitative image analysis. Specimen-level values were normally averaged from four circumferential views. When one view exhibited evident segmentation failure because the binary mask was inconsistent with the visible interface, that view was excluded and the remaining three views of the same dowel were averaged. Specimens with fewer than three valid views were excluded from quantitative analysis. Because the inspection was performed on extracted dowels, the results represent the dowel-side interface; the internal hole-wall surface was not directly examined by destructive sectioning.
2.7. Data Screening and Validity Criteria
Because wood is naturally heterogeneous and rotational friction welding is sensitive to local contact, heat generation, and interface formation, every complete load–displacement curve was examined before statistical analysis. Exclusion was based on a combination of curve-shape evidence and physical plausibility rather than on peak-load magnitude alone.
Specimens were excluded from the effective dataset if they showed one or more of the following abnormal characteristics:
an extremely low peak load together with the absence of a clear load-bearing stage;
premature failure at a very small displacement;
long low-load sliding without a clear load-bearing stage;
sudden early load drop caused by incomplete welding or unstable interface formation;
an abnormal curve shape inconsistent with the principal response pattern of the corresponding group.
A low numerical value alone was not sufficient for exclusion; the complete response had to indicate ineffective or unstable interface formation.
The coefficient of variation was calculated to evaluate the scatter of peak pull-out load in each group:
where s is the standard deviation of peak pull-out load, and
is the mean peak pull-out load of each group.
2.8. Post-Peak Response Analysis
The post-peak response provides information that is not captured by peak load. T2, T3, and T5 combined relatively high capacities with mean Δδ50 values of only 0.039, 0.050, and 0.020 mm, respectively; V had a mean of 0.028 mm. These values indicate a rapid loss of resistance after peak load.
To quantify the post-peak response, the displacement required for the load to decrease from the peak load to 50% of the peak load was used. After the peak load
was reached, the displacement corresponding to the first point where the load decreased to 0.5
was defined as
. The post-peak half-load displacement was then calculated as:
where
is the displacement at peak load. A smaller
indicates a faster post-peak load drop and a more abrupt failure response, whereas a larger
indicates a more gradual sliding or progressive failure process.
This index was used as a supplementary parameter to compare the post-peak behavior of different welding parameter groups and to examine whether high-capacity joints tended to exhibit more sudden failure after reaching the peak load.
2.9. Orthogonal Range Analysis
The effects of hole-to-dowel diameter ratio, rotational speed, and plunging rate on pull-out capacity were evaluated using range analysis based on the screened T1–T9 data. For each group, the mean peak pull-out load was first calculated from the effective specimens. Then, for each factor, the average value at each level was determined.
The level average
was calculated as:
where
is the sum of the mean peak pull-out loads of all groups corresponding to level
, and
is the number of groups at that level.
The range
of each factor was calculated as:
A larger value indicates a stronger influence of the factor on pull-out capacity. The optimal level of each factor was determined according to the highest level average. The predicted optimal parameter combination was then verified using the independent validation group.
2.10. Statistical Analysis
To supplement the orthogonal range analysis and quantify the effects of the three experimental factors, a general linear model was fitted to the final effective specimen-level peak pull-out loads. Hole-to-dowel diameter ratio, rotational speed, and plunging rate were treated as fixed categorical factors.
Because the effective sample numbers were unequal after supplementary testing and specimen screening, Type III sums of squares were used. In this approach, the main effect of each factor is tested after adjustment for the other two factors. The L9 design did not provide independent factor combinations for separating interaction effects; therefore, only the three main effects were evaluated.
For each factor, the F-statistic was calculated as the ratio of the factor mean square to the residual mean square. A larger F-value indicates that variation among the factor levels is large relative to the residual variation within the dataset. The p-value was used to assess the statistical evidence for a main effect, with p < 0.05 considered statistically significant.
Partial eta squared (partial η2) was reported as an effect-size measure and was calculated as partial η2 = SSfactor/(SSfactor + SSerror), where SSfactor is the Type III sum of squares for the factor and SSerror is the residual sum of squares. Partial η2 describes the relative magnitude of a factor effect after accounting for the other factors and therefore complements the significance test based on the p-value.
Statistical analyses were performed using OriginPro (OriginLab Corporation, Northampton, MA, USA).
3. Results
3.1. First-Round Orthogonal Results and Supplementary Tests
The first-round L9 orthogonal tests were conducted with six repeated specimens for each parameter group. The pull-out results before any specimen exclusion are summarized in
Table 4.
Clear differences were observed among the nine groups. T3, T5, and T2 showed relatively high average peak loads of 1902.24 N, 1877.38 N, and 1777.00 N, respectively. In contrast, T7 and T9 showed much lower average values of 651.24 N and 494.64 N.
The first-round results also showed considerable scatter in several groups. The CV values of T1, T7, T8, and T9 were 57.64%, 83.58%, 35.44%, and 47.59%, respectively. The corresponding load–displacement curves indicated that some specimens failed at very low loads or showed premature sliding, suggesting ineffective welded-interface formation in individual specimens.
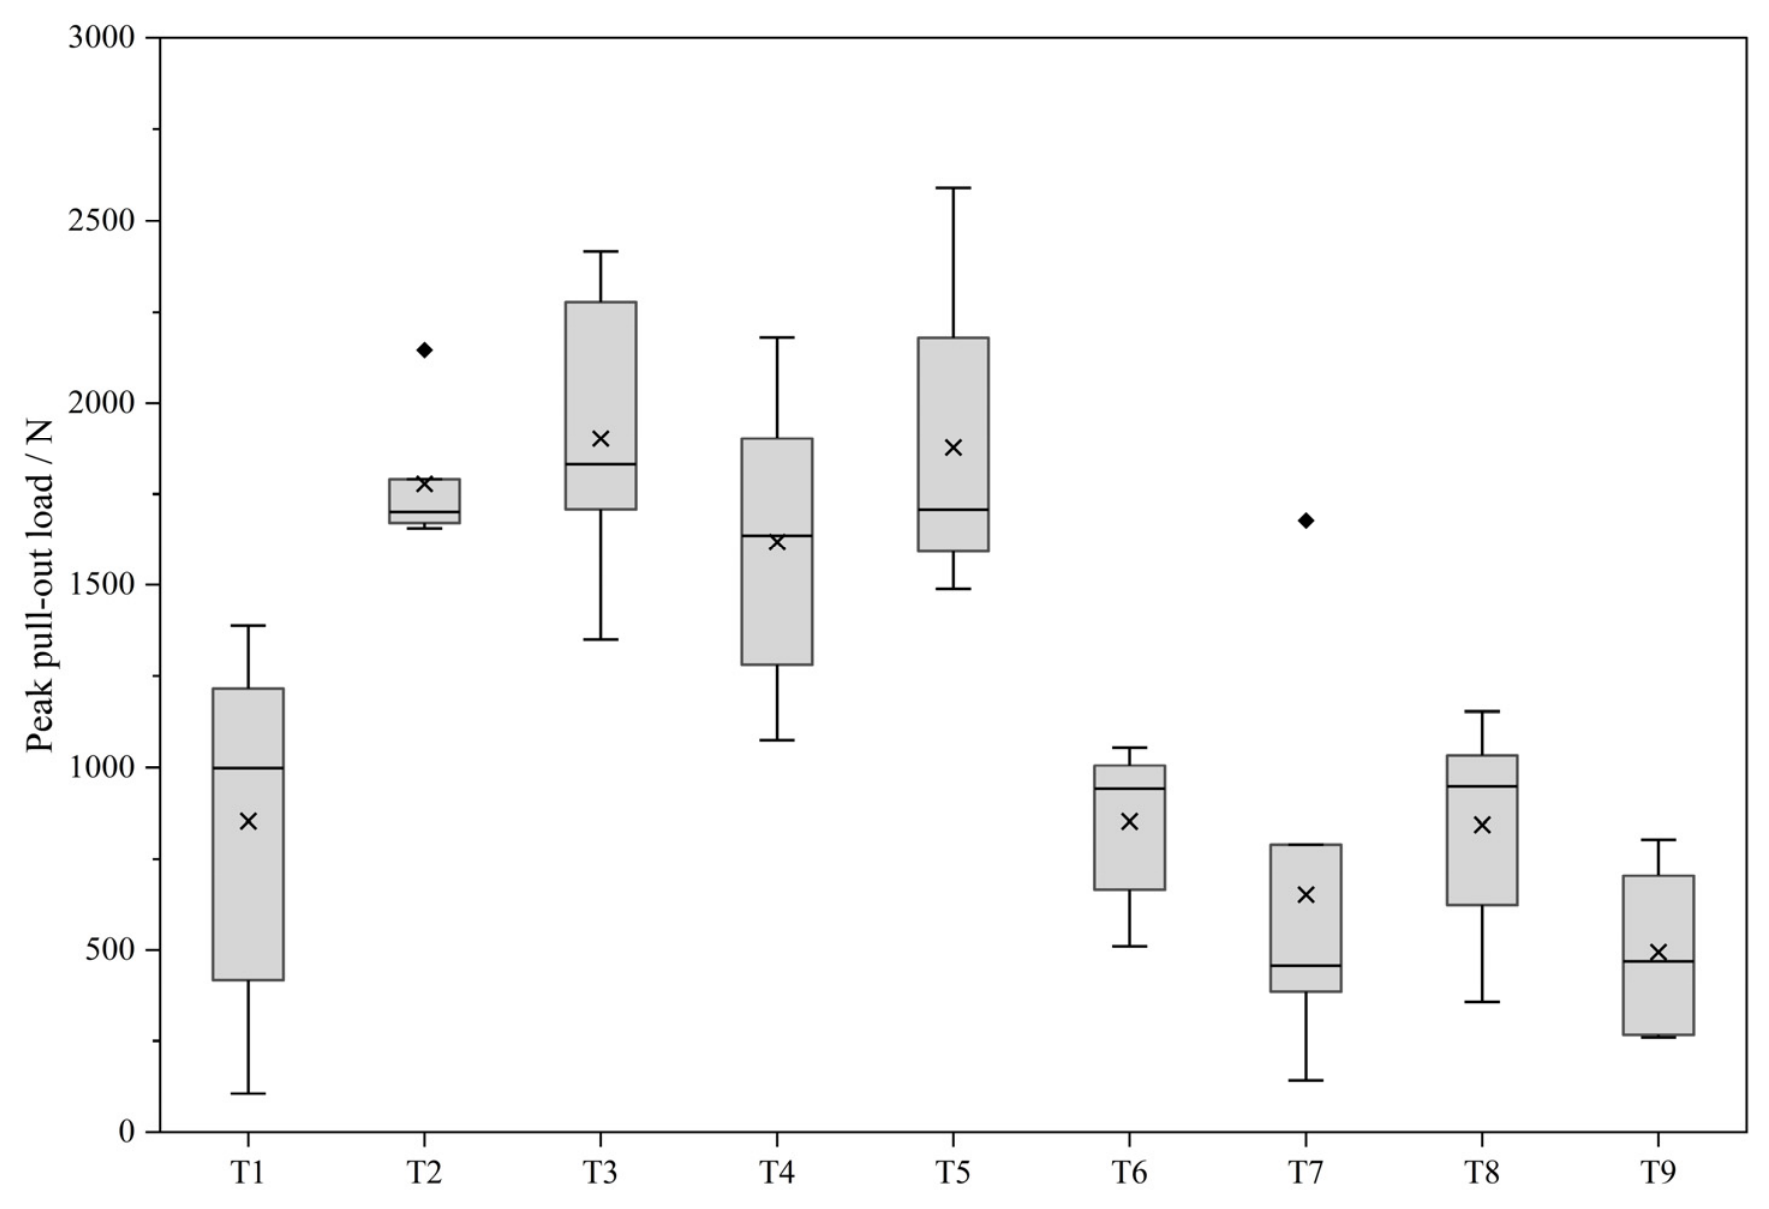
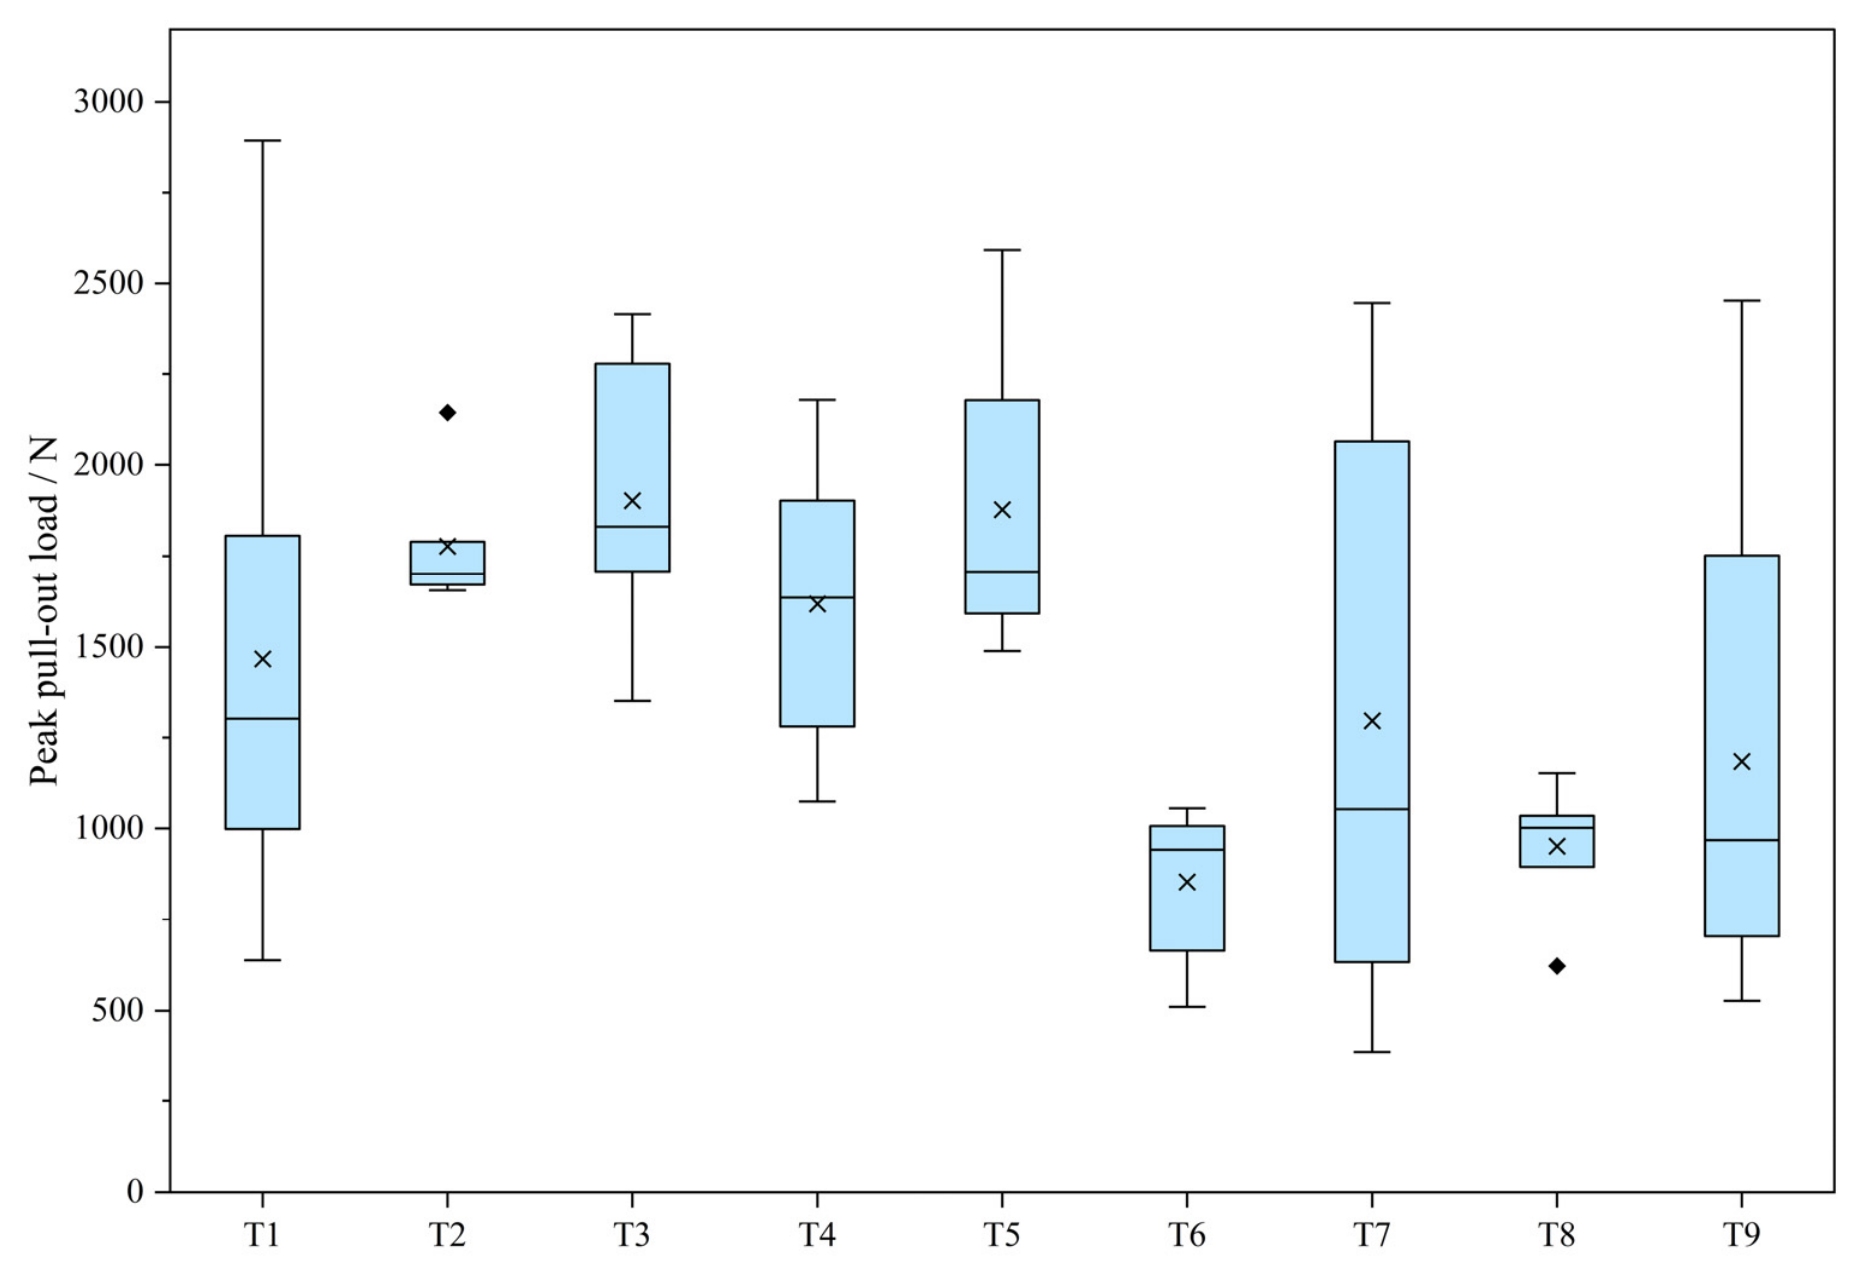
The distribution of the first-round peak pull-out loads is shown in
Figure 2. The box plots further illustrate the large scatter in T1, T7, T8, and T9, which was consistent with their high CV values listed in
Table 4.
Specimens with clearly abnormal load–displacement responses were excluded from the effective dataset. The excluded specimens are listed in
Table 5. These specimens were characterized by extremely low peak load, premature failure, or sliding-dominated response without a clear load-bearing stage.
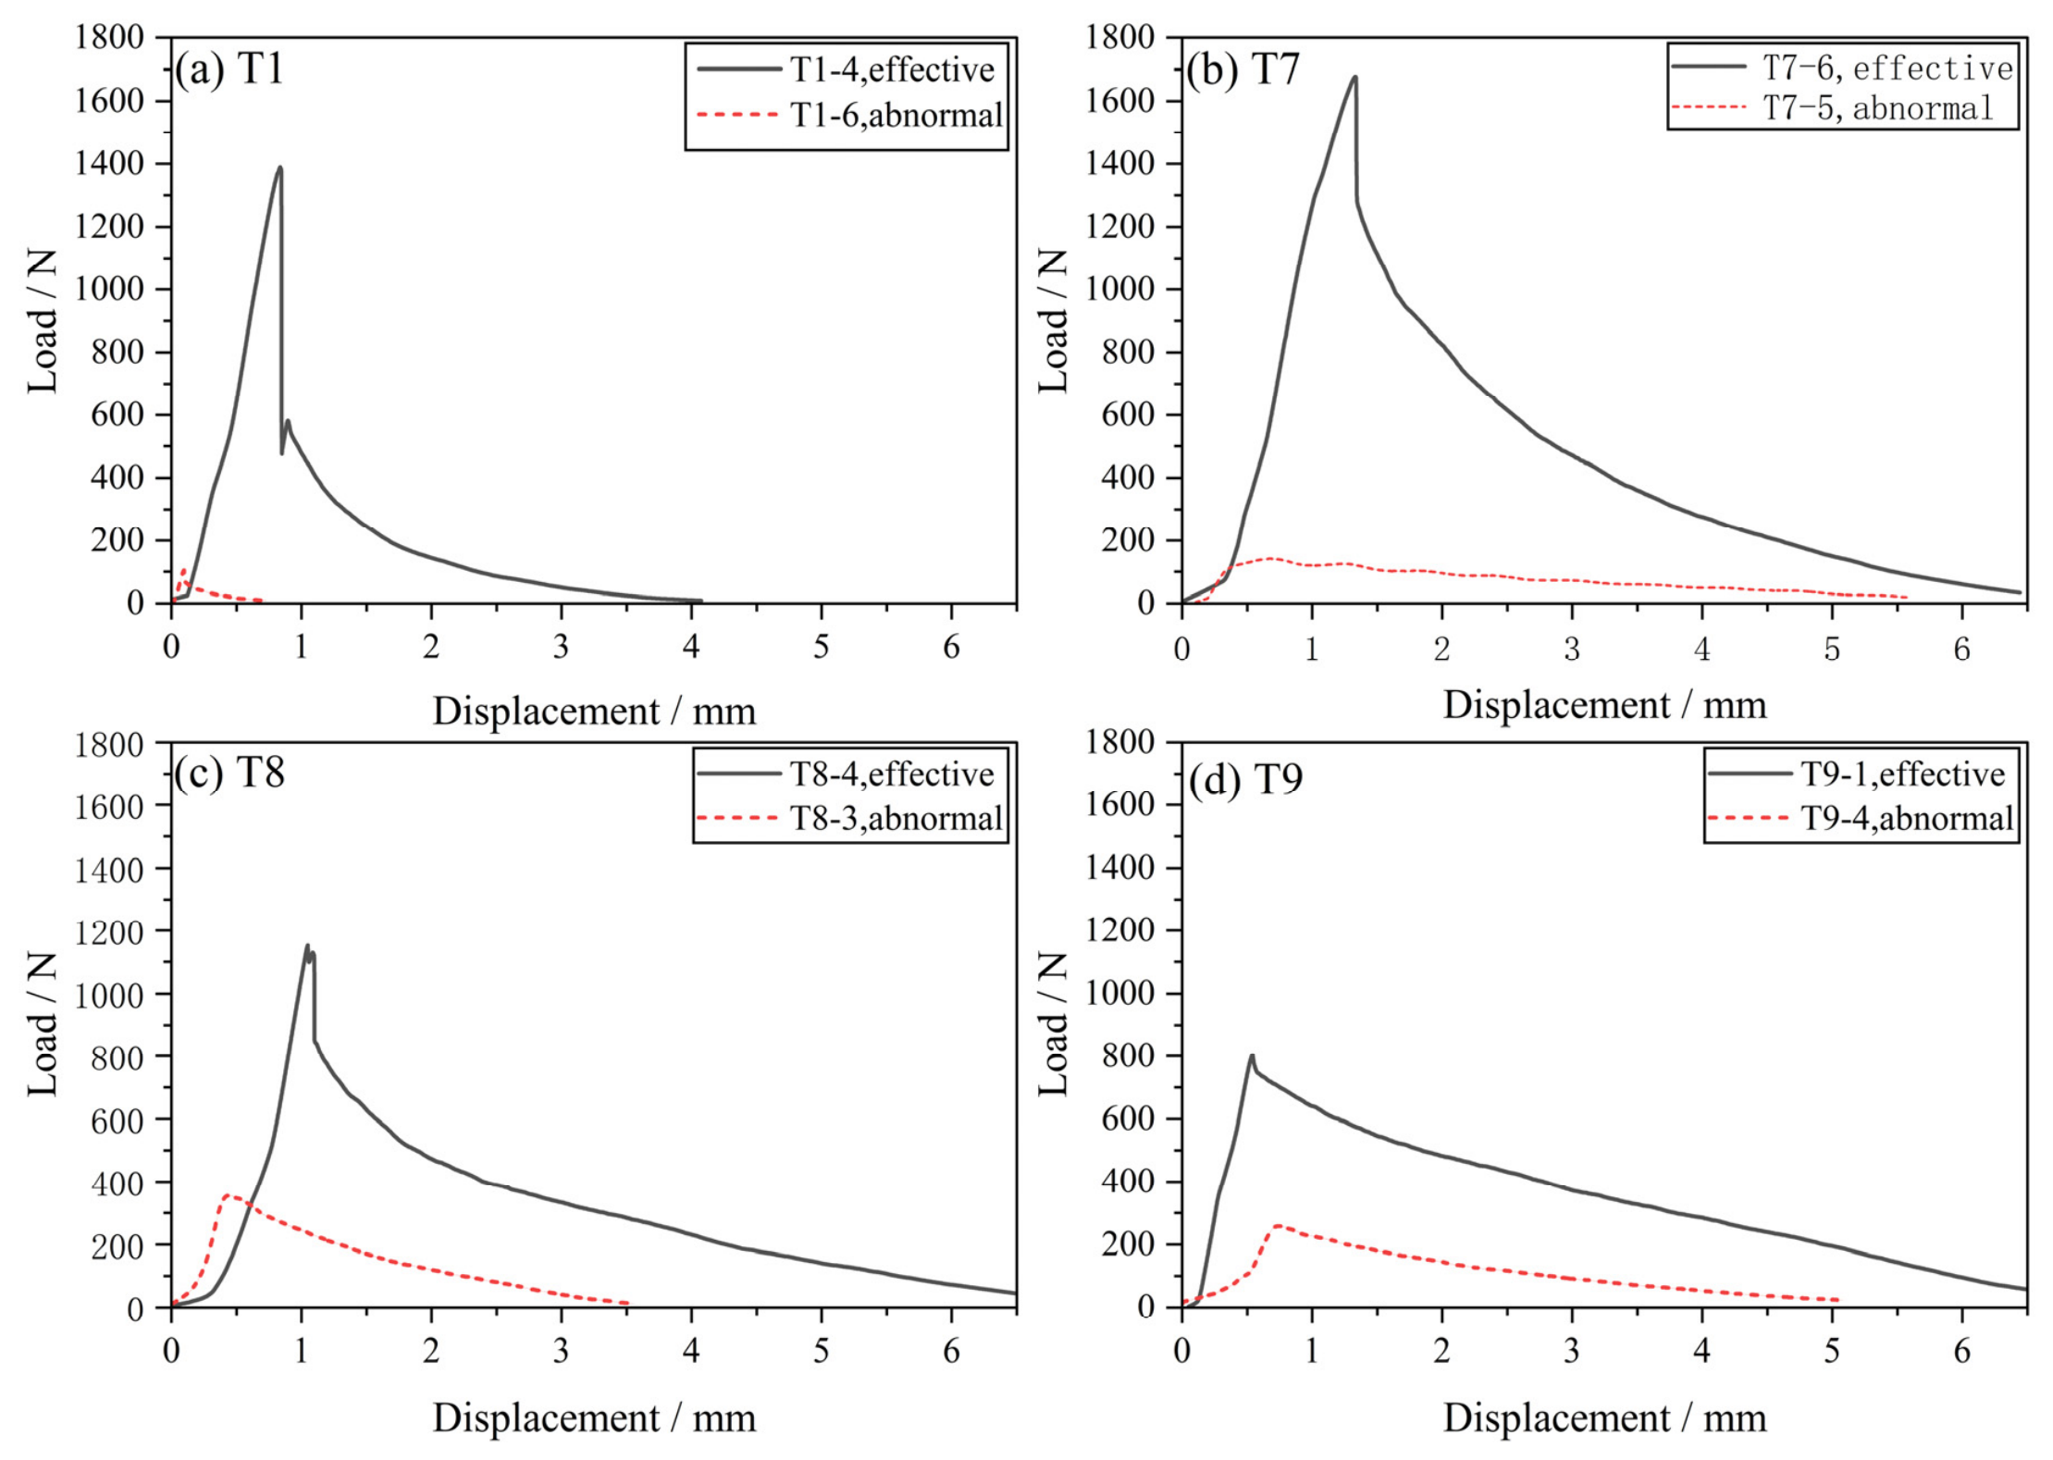
Representative effective and abnormal load–displacement curves are compared in
Figure 3. Compared with the effective specimens from the same parameter groups, the abnormal specimens exhibited premature failure, low-load sliding, or insufficient load-bearing stages. These curve characteristics support the exclusion criteria listed in
Table 5.
Supplementary tests were conducted for T1, T7, T8, and T9. To make the sample accounting transparent,
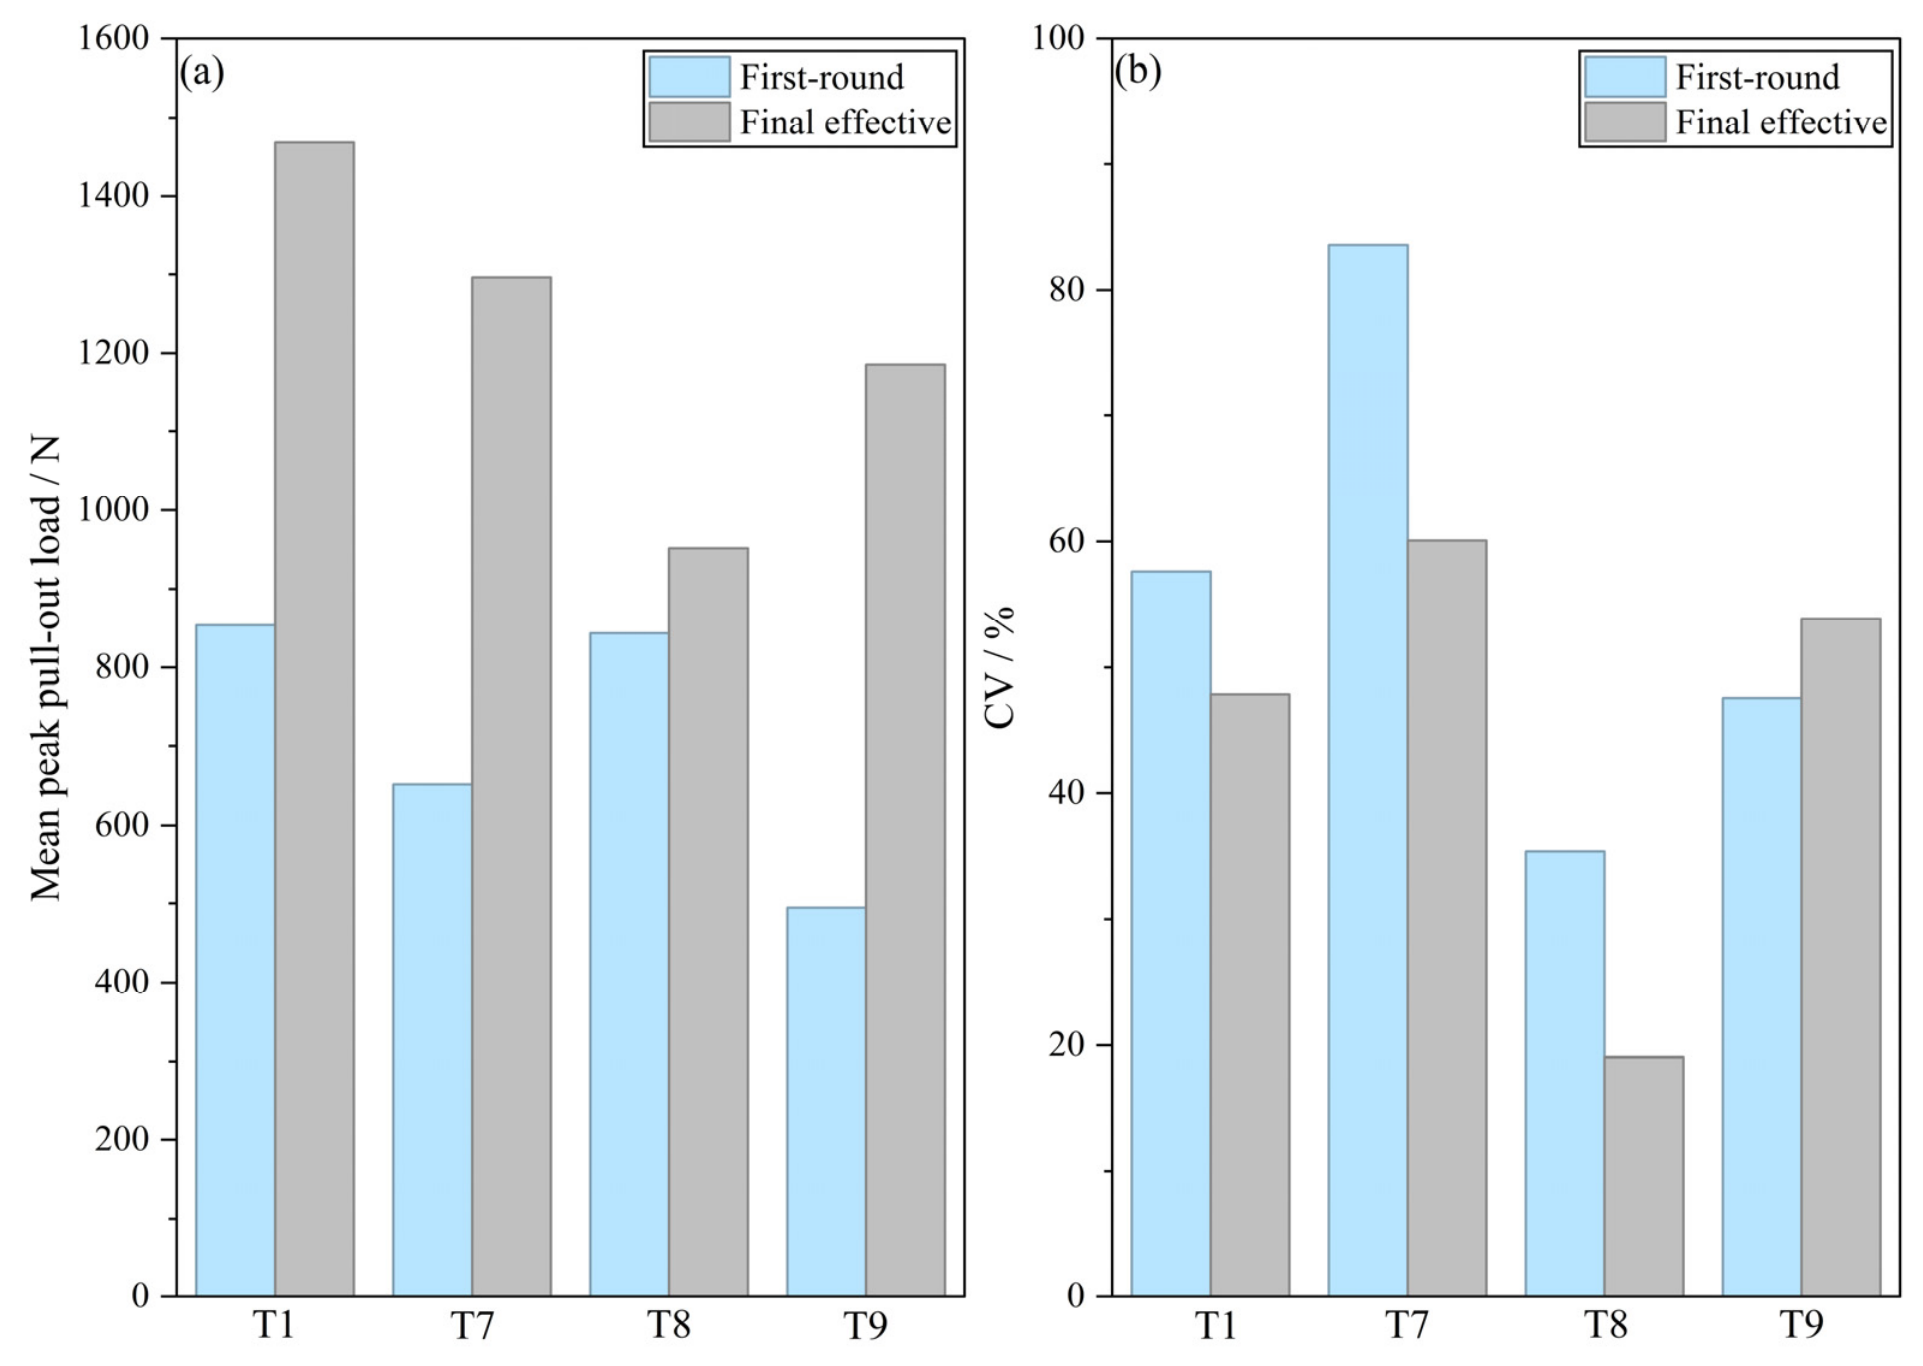
Table 6 reports the first-round sample number, additional specimens, excluded specimens, and final effective sample number. The final datasets contained 8, 12, 6, and 10 specimens for T1, T7, T8, and T9, respectively. These datasets pooled all valid first-round and supplementary observations; low values were not simply replaced by new tests. The CV values of T1, T7, and T8 decreased, whereas that of T9 increased from 47.59% to 53.88%, confirming that additional testing did not automatically reduce scatter.The comparison between the first-round and final effective results is shown in
Figure 4.
Figure 4.
Comparison of first-round and final effective results for the supplemented groups: (a) mean peak pull-out load; (b) coefficient of variation.
Figure 4.
Comparison of first-round and final effective results for the supplemented groups: (a) mean peak pull-out load; (b) coefficient of variation.
3.2. Final Pull-Out Performance and Post-Peak Response
The final effective results of T1–T9 are summarized in
Table 7. Among the nine groups, T3 showed the highest average peak pull-out load of 1902.24 N, followed by T5 (1877.38 N) and T2 (1777.00 N). T6 and T8 showed the lowest average peak loads, 853.28 N and 951.24 N, respectively.
The post-peak half-load displacement, , was used to describe the load degradation after peak load. T2, T3, and T5 had small mean values of 0.039 mm, 0.050 mm, and 0.020 mm, respectively, indicating rapid post-peak load drops. In contrast, T8 and T9 had much larger values of 1.034 mm and 0.999 mm, suggesting more gradual sliding or progressive failure after peak load.
The distribution of the final effective peak pull-out loads is shown in
Figure 5. Compared with the first-round distribution in
Figure 2, the final dataset provides a clearer basis for comparing the pull-out performance of T1–T9 after removing clearly invalid responses and adding supplementary specimens.
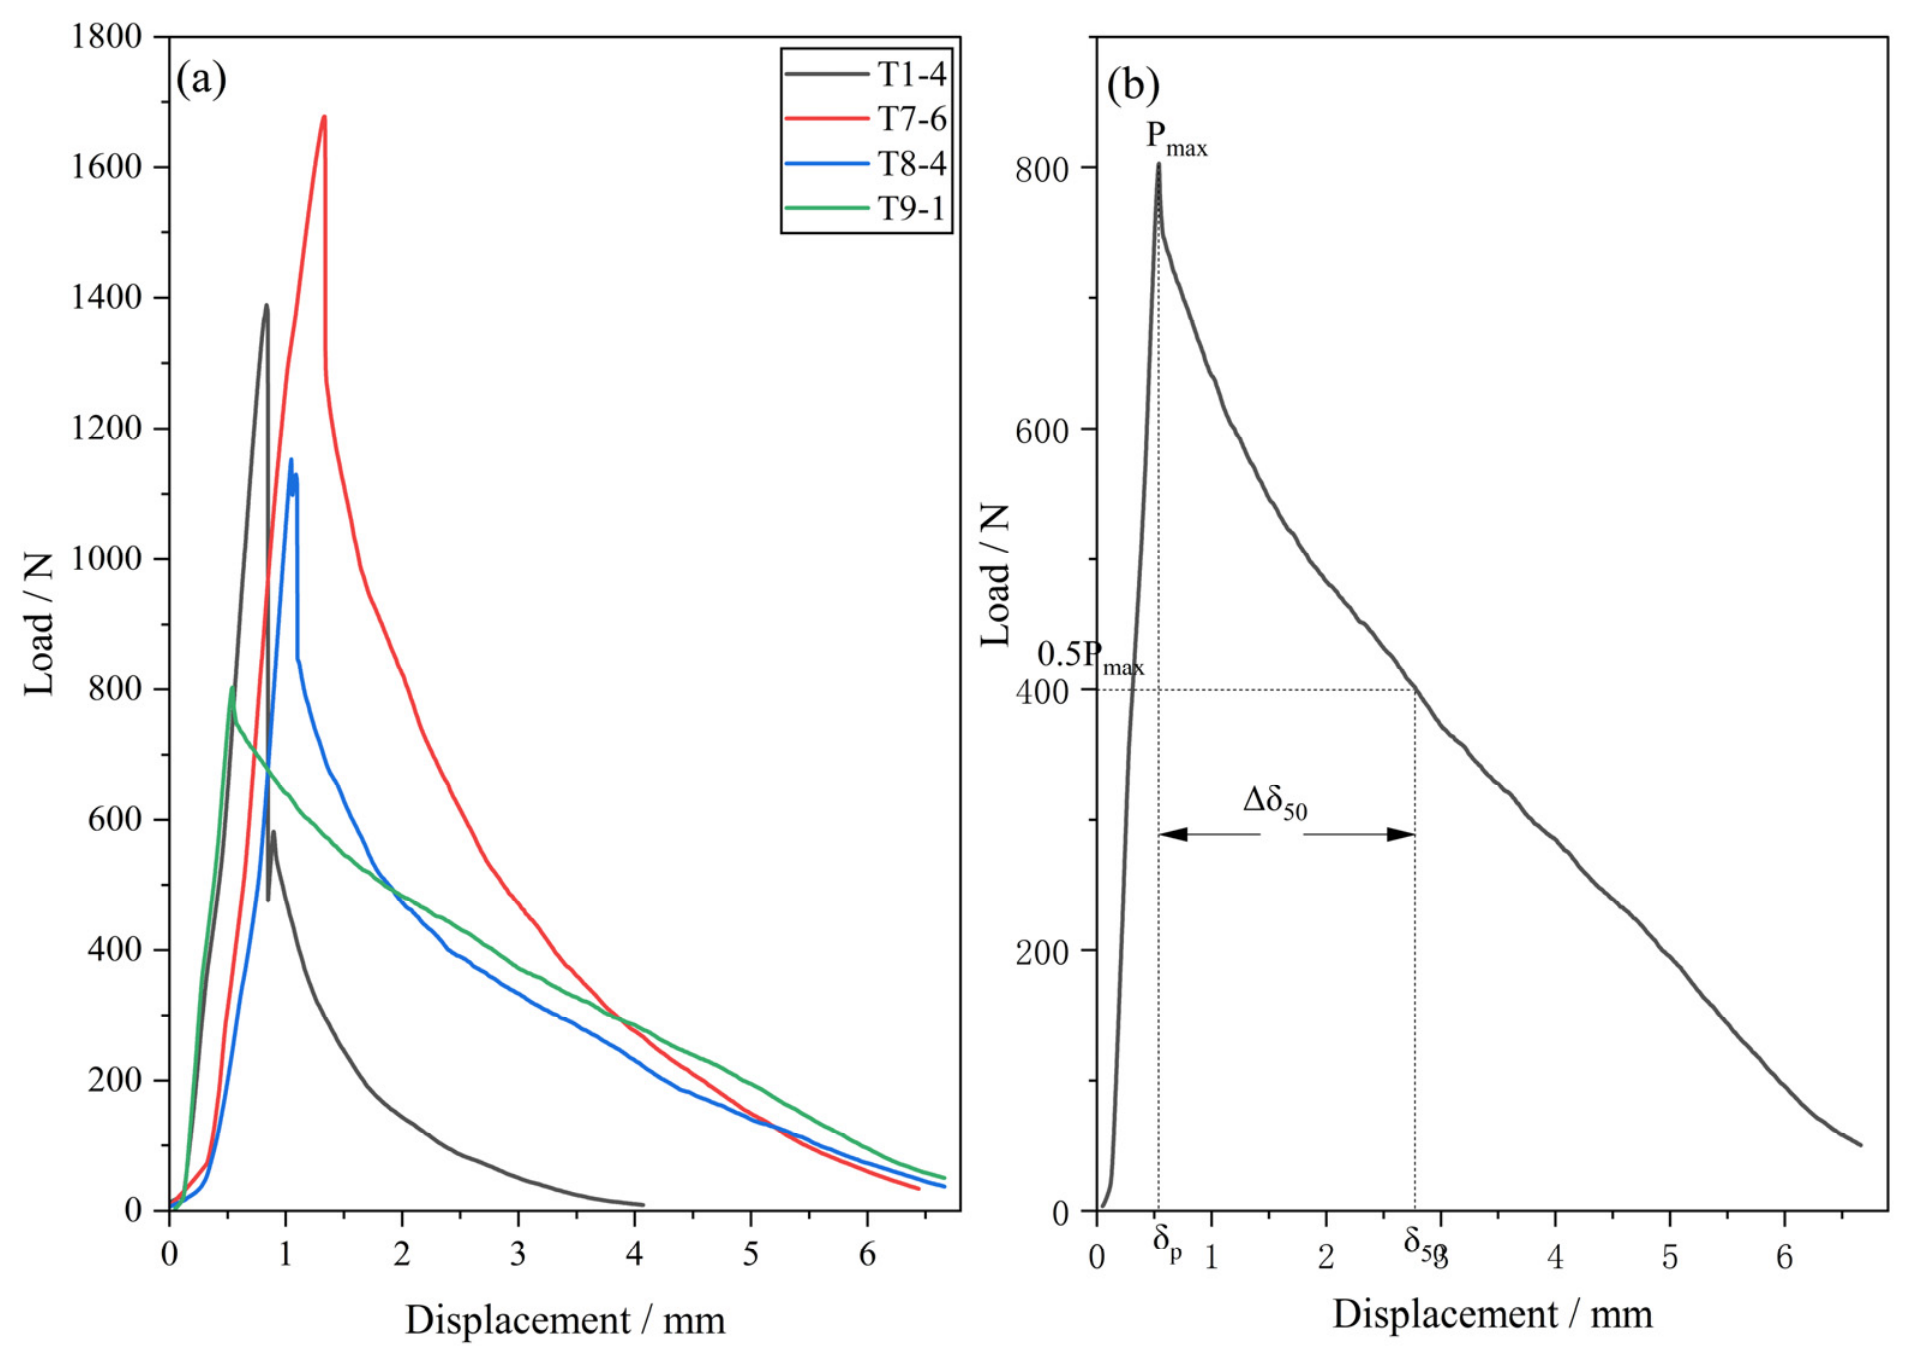
Representative load–displacement curves are shown in
Figure 6a. The selected specimens exhibited different post-peak responses, indicating that peak pull-out load alone could not fully describe the failure behavior of welded dowel joints. Therefore,
was defined as shown in
Figure 6b to quantify the displacement interval between the peak displacement and the point at which the load decreased to 50% of the peak load.
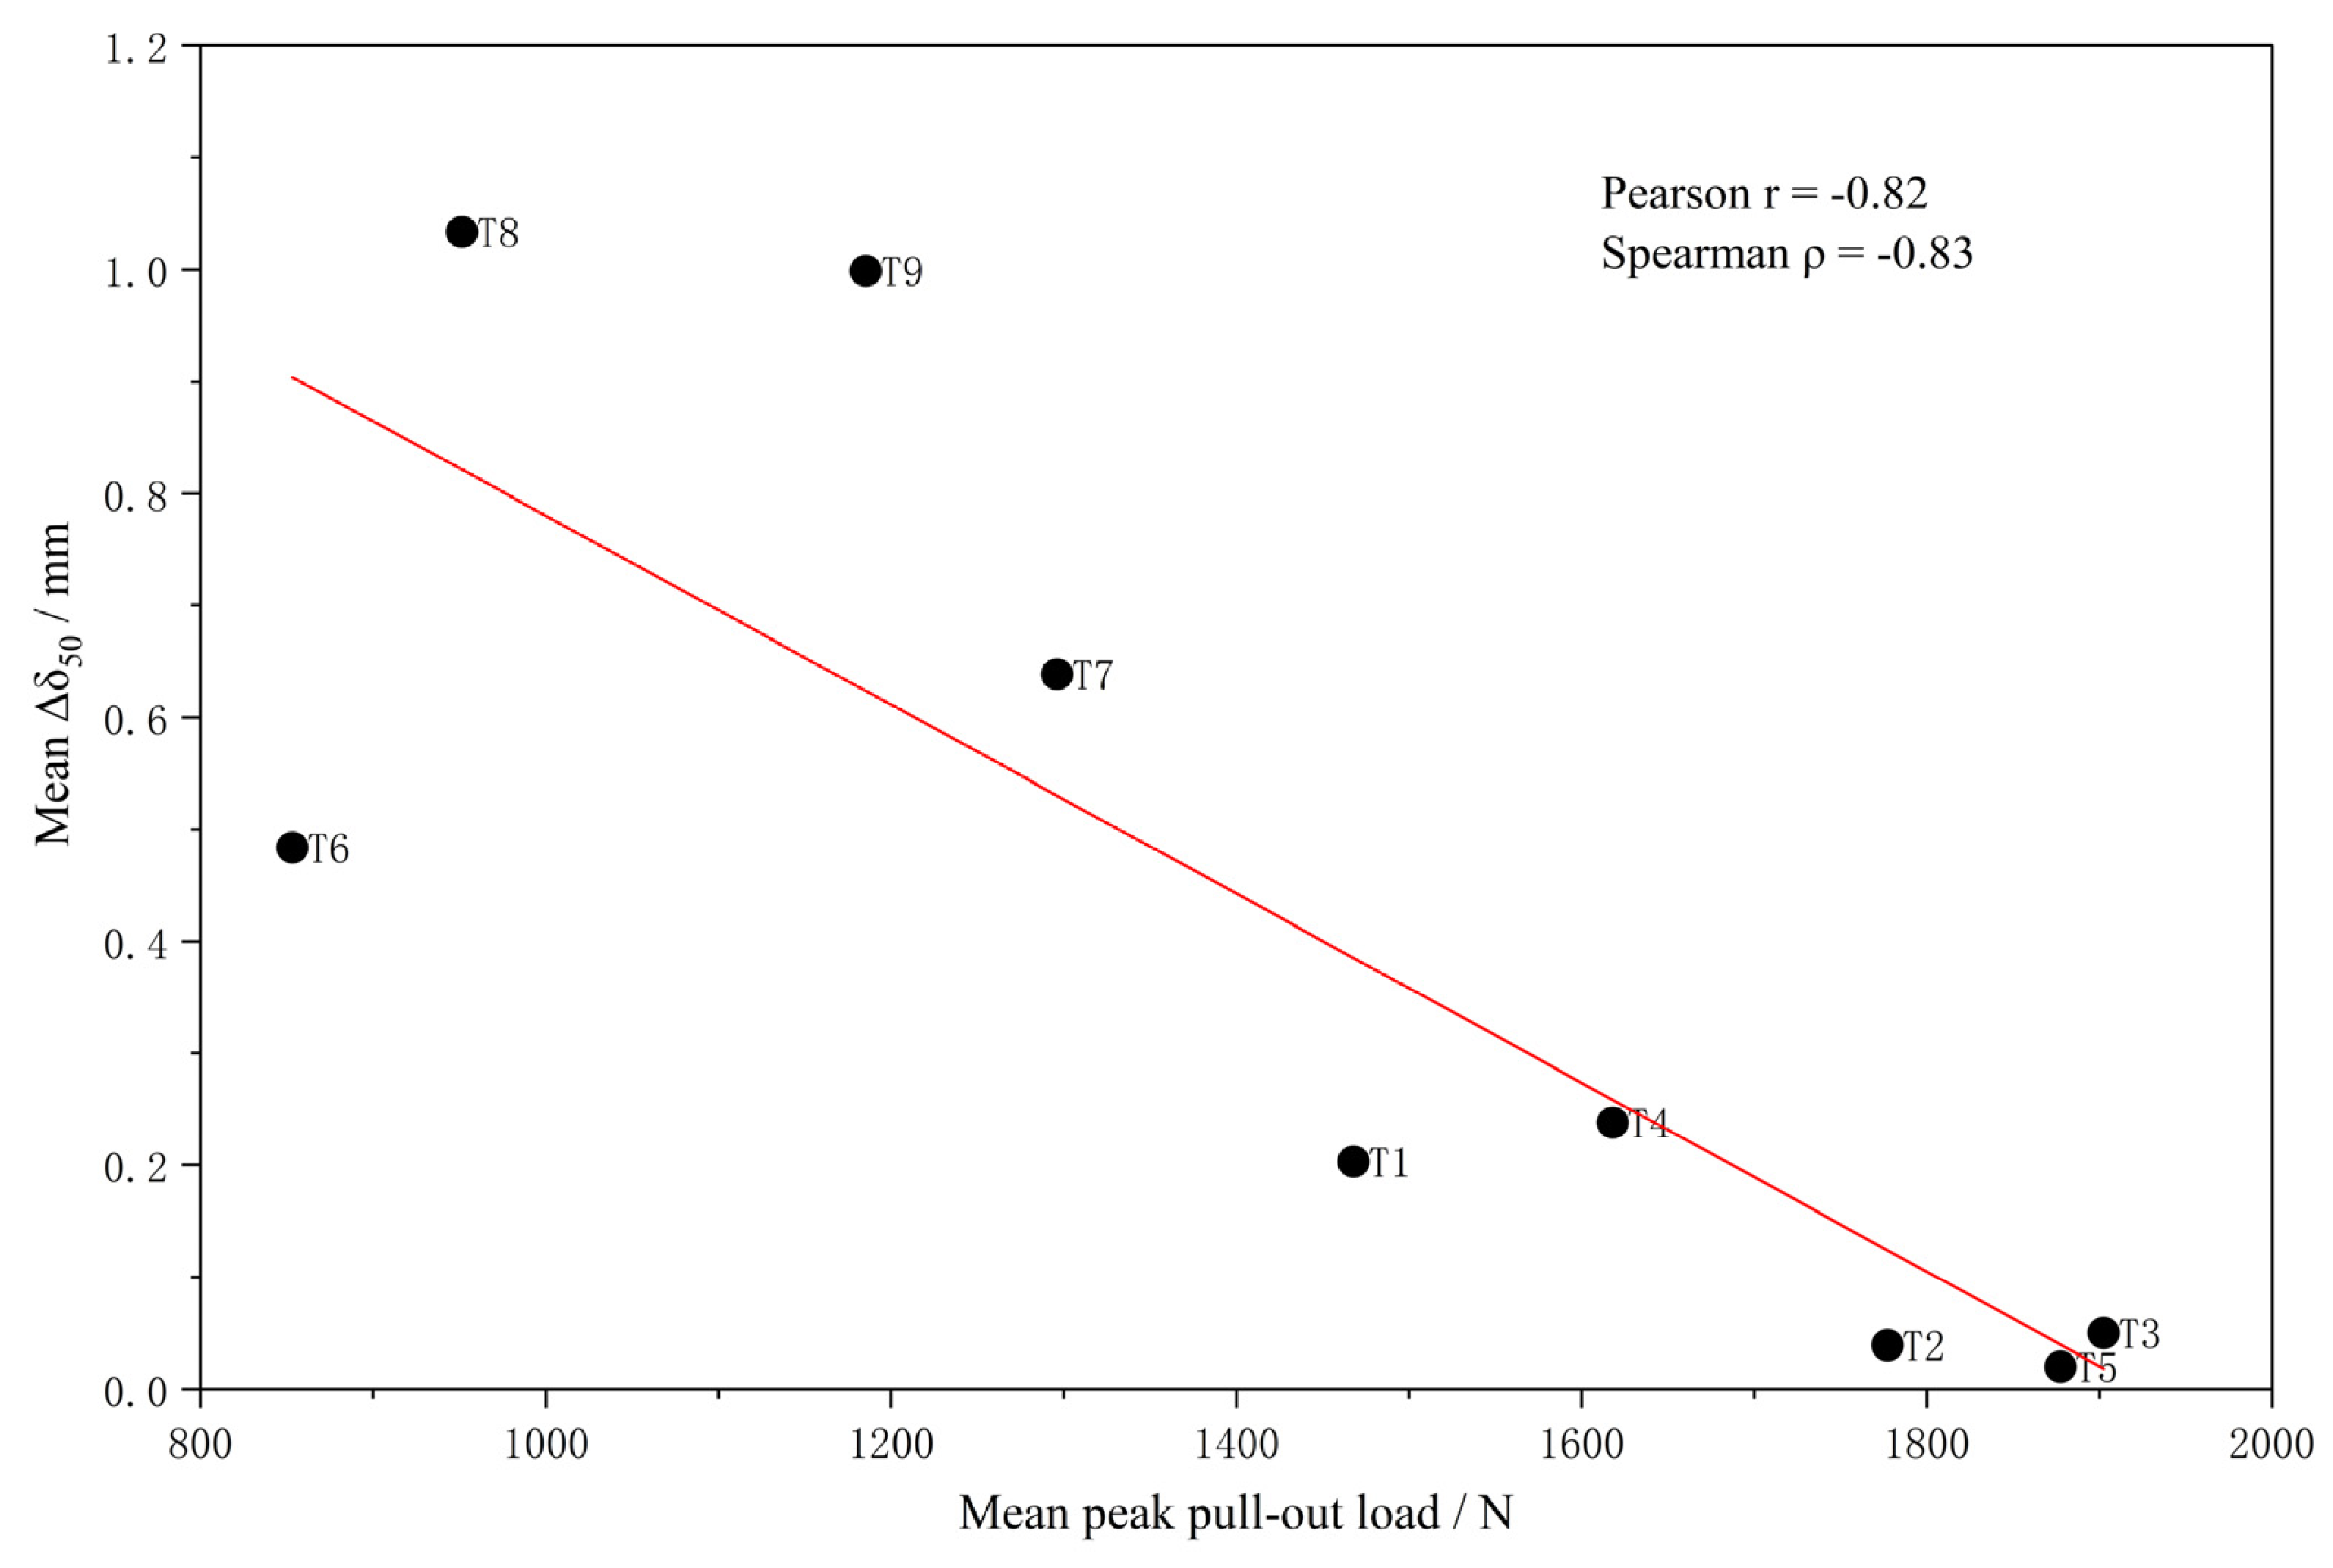
The relationship between the group mean peak pull-out load and the group mean Δδ
50 is shown in
Figure 7. A negative relationship was observed, with a Pearson correlation coefficient of approximately −0.82 and a Spearman rank correlation coefficient of approximately −0.83. This indicates that parameter groups with higher pull-out capacity tended to show smaller post-peak half-load displacement, corresponding to a more abrupt post-peak load drop.
3.3. 3.3. Range Analysis and Main Effects
The final effective T1–T9 group means were used for range analysis. The results are shown in
Table 8.
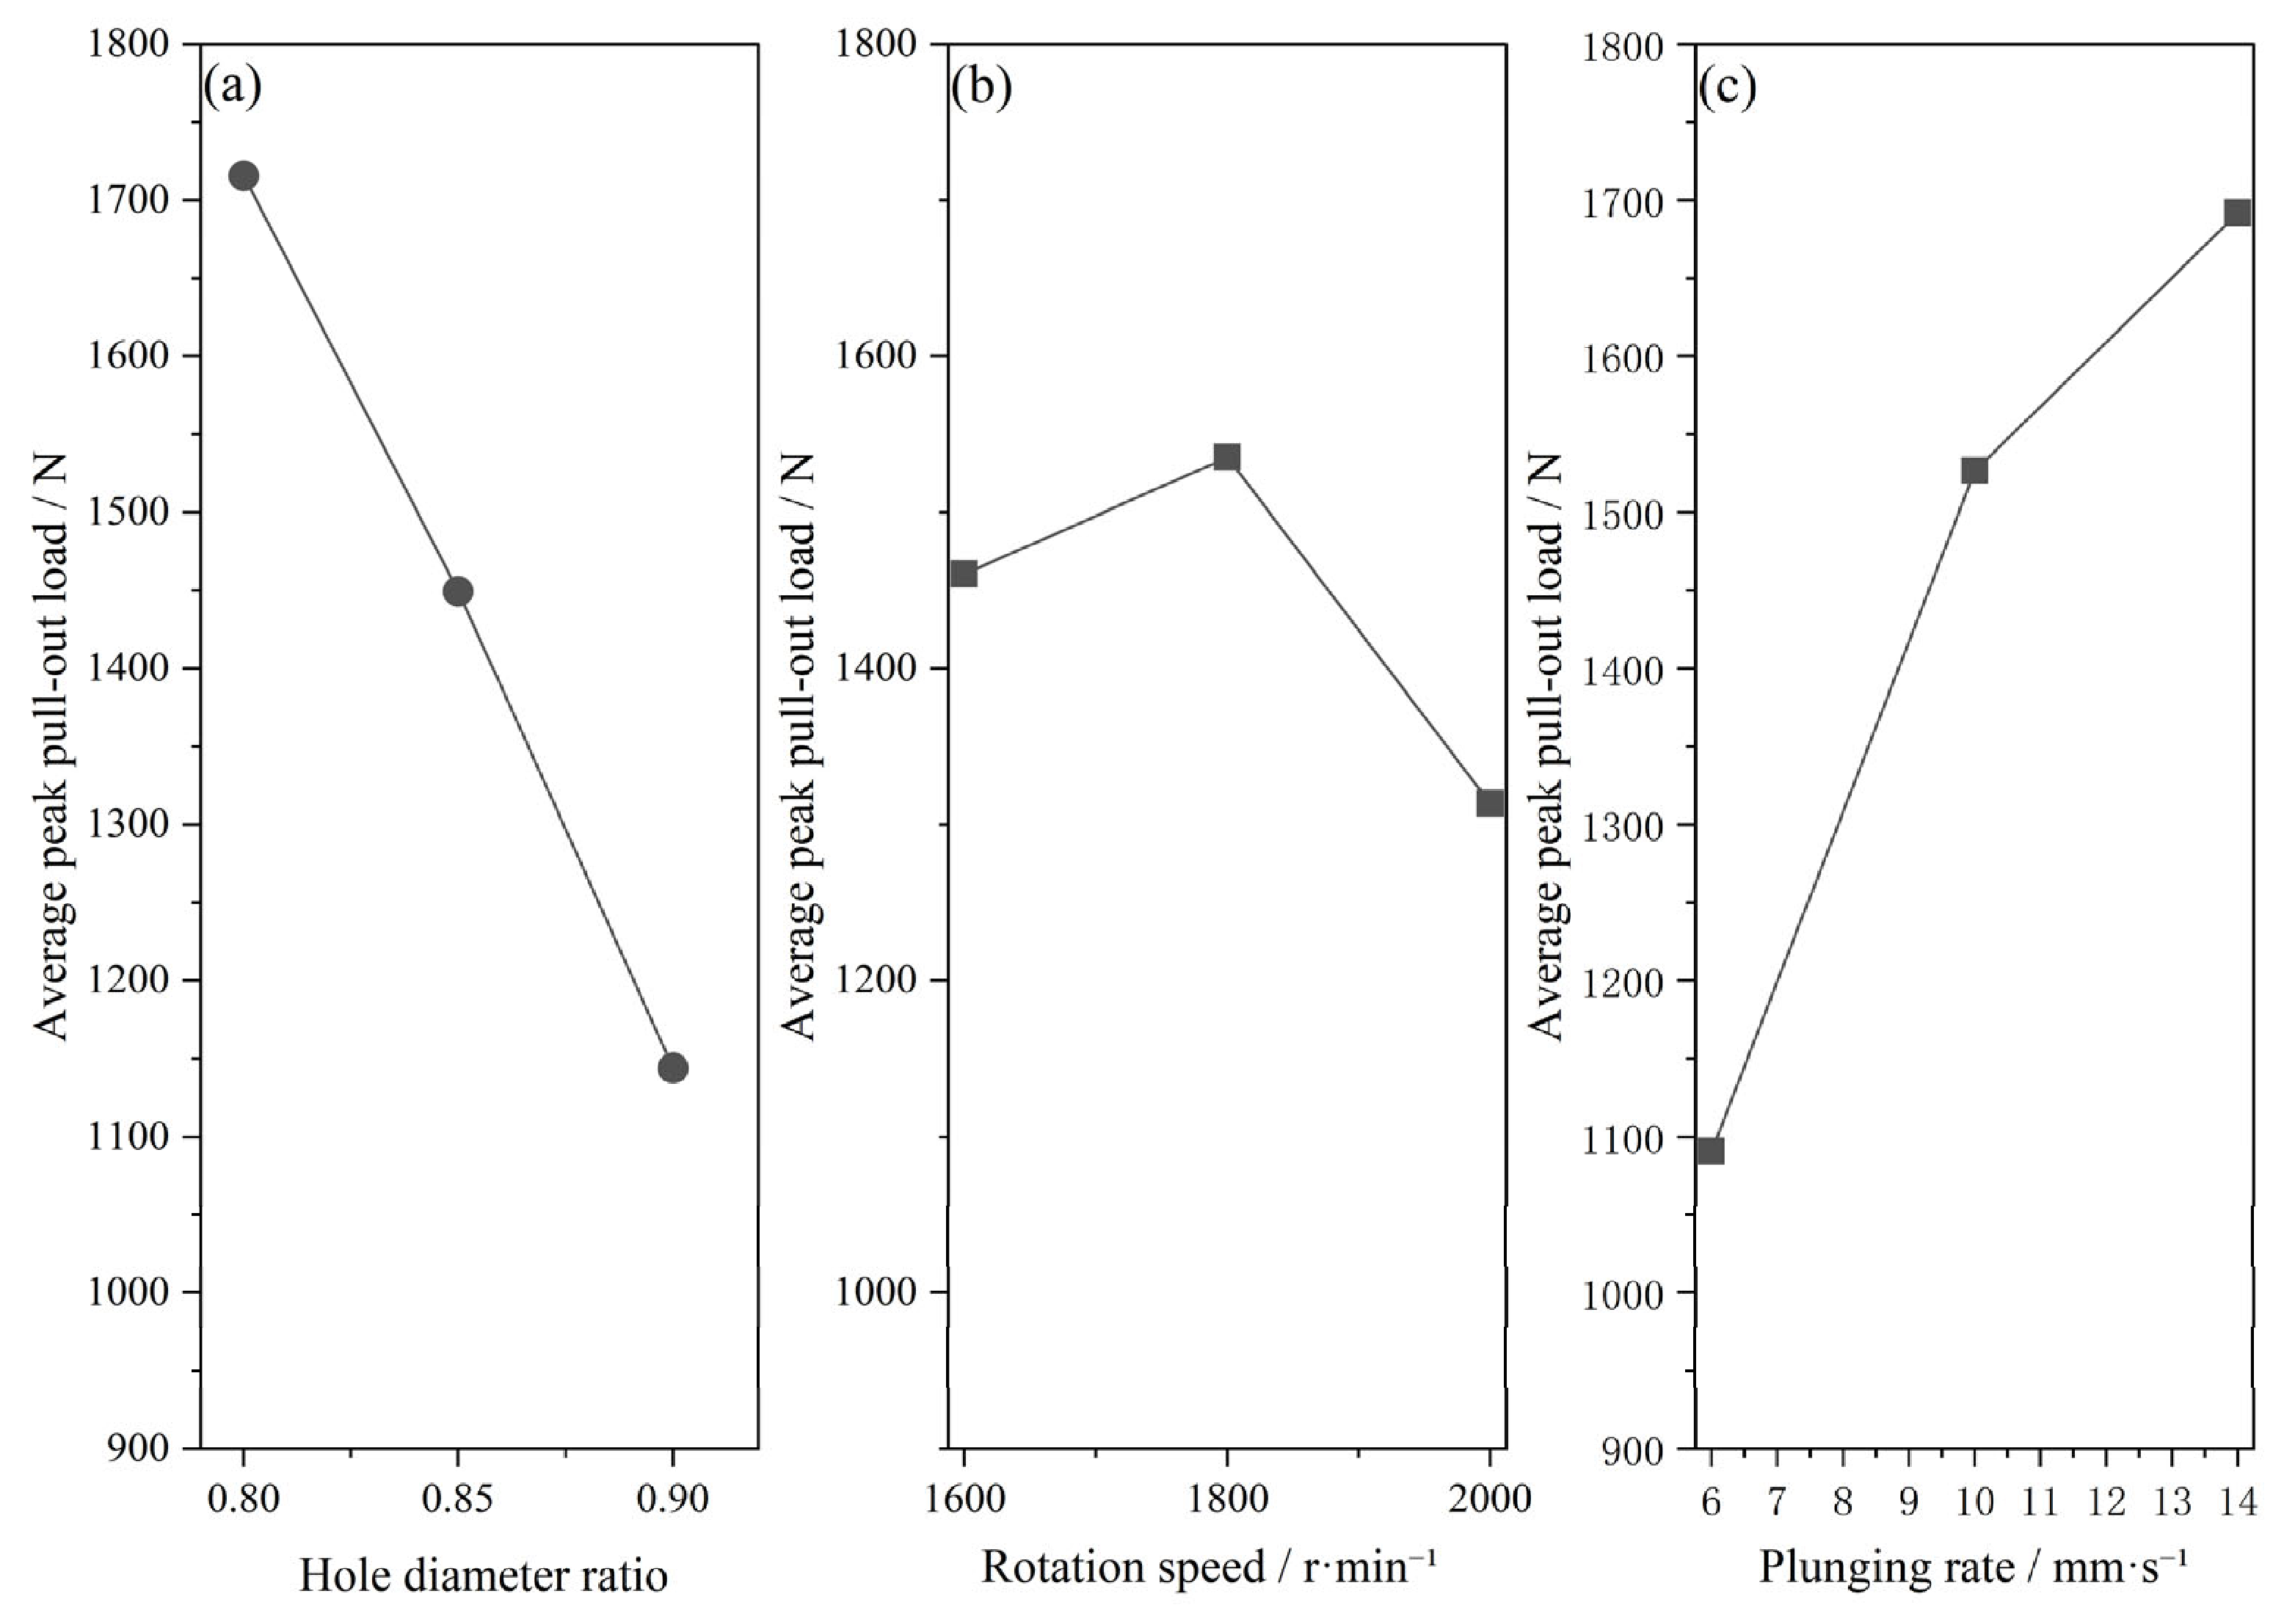
For the hole-to-dowel diameter ratio, the highest level average occurred at A1 (0.80). For rotational speed, the highest level average occurred at B2 (1800 rpm). For plunging rate, the highest level average occurred at C3 (14 mm·s−1).
The range values followed C > A > B, ranking the amplitudes of the level effects as plunging rate, hole-to-dowel diameter ratio, and rotational speed.
The main-effect plots in
Figure 8 show a decreasing response with increasing hole-to-dowel diameter ratio, an increasing response with plunging rate within the investigated range, and a smaller non-monotonic variation with rotational speed.
Type III analysis of variance showed significant main effects of the hole-to-dowel diameter ratio, F(2,59) = 6.78,
p = 0.002, partial η
2 = 0.187, and plunging rate, F(2,59) = 6.19,
p = 0.004, partial η
2 = 0.173. The rotational-speed effect was not significant within 1600–2000 rpm, F(2,59) = 0.73,
p = 0.486, partial η
2 = 0.024.The detailed Type III ANOVA results are listed in
Table 9.
Table 9.
Type III analysis of variance for peak pull-out load based on the final effective T1–T9 dataset.
Table 9.
Type III analysis of variance for peak pull-out load based on the final effective T1–T9 dataset.
| Source | df | Sum of Squares | F | p-Value | Partial η2 |
|---|
| Hole-to-dowel diameter ratio | 2 | 3,994,368 | 6.78 | 0.002 | 0.187 |
| Rotational speed | 2 | 430,243 | 0.73 | 0.486 | 0.024 |
| Plunging rate | 2 | 3,646,079 | 6.19 | 0.004 | 0.173 |
| Error | 59 | 17,372,960 | — | — | — |
Based on the combined level averages, the predicted parameter combination remained A1B2C3: a hole-to-dowel diameter ratio of 0.80, an 8.0 mm predrilled hole, 1800 rpm, and a plunging rate of 14 mm·s−1. Because the rotational-speed main effect was not significant, 1800 rpm is interpreted as the best observed level in the present design rather than a universally superior speed.
3.4. Validation of the Optimized Parameter Combination
Since A1B2C3 was not included in the original L9 design, an independent validation group V was prepared using this predicted combination. The validation results are shown in
Table 10.
The validation group achieved a mean peak pull-out load of 2567.22 N, which was 34.96% higher than that of T3, the highest-performing group in the original L9 design. However, V also exhibited a standard deviation of 922.29 N and a coefficient of variation of 35.93%, indicating considerable specimen-to-specimen variability.
The higher mean value of V provides directional support for the predicted A1B2C3 combination, but the high CV shows that optimization of the mean response did not ensure process consistency. The small mean Δδ50 of 0.028 mm also indicates rapid post-peak degradation. The validation result is therefore interpreted as promising while further improvement in repeatability remains necessary.
3.5. Failure Mode and Dowel-Side Interfacial Appearance
All tested joints ultimately failed by complete axial withdrawal of the dowel from the substrate, and no transverse dowel fracture was observed. Nevertheless, the exposed dowel-side interfaces showed that the local failure morphology was more complex than withdrawal along a clean interface.
Representative surfaces in
Figure 9 contained dark-brown thermally modified regions, longitudinal sliding marks, residual interfacial material, relatively clean separation regions, and locally adhered wood fibers. The failure was therefore classified as predominantly mixed, involving interfacial separation and frictional sliding together with localized cohesive tearing of wood fibers.
The apparent welded-area ratios are summarized in
Table 11. Mean R20 values for T1–T9 ranged from 75.79% to 85.76%, and V reached 85.18%. The dark visible region therefore occupied a substantial part of the 20 mm plunging zone in most groups. However, visible area alone did not determine pull-out capacity. T3, T6, and T9 had similar R20 values of 85.76%, 83.87%, and 84.13%, although their mean peak loads differed markedly.
Dark-brown or locally blackened regions were observed at all three rotational-speed levels, including V at 1800 rpm. The 2000 rpm groups did not consistently exhibit more extensive blackening than lower-speed groups, and the photographs did not show a widespread, visibly carbonized or severely charred layer. The visual evidence therefore does not support attributing the response at 2000 rpm solely to extensive burning.
4. Discussion
4.1. Influence of Hole-to-Dowel Diameter Ratio on Pull-Out Performance
The hole-to-dowel diameter ratio had a significant influence on pull-out performance. The level average decreased as the ratio increased, and A1 = 0.80 produced the highest response. Within the investigated range, a smaller hole generated greater radial interference and was more favorable for load transfer.
This result is attributed primarily to interference fit. Plunging a 10 mm dowel into an 8.0 mm hole increased radial contact pressure, frictional heating, local softening, and densification. Ganne-Chedeville et al. showed that dowel-welding behavior results from interactions among geometric and process variables [
6], while Xu et al. demonstrated that modifying the density and mechanical condition of the dowel can substantially change pull-out resistance [
11]. These studies support the interpretation that interference governs both heat generation and consolidation.
At a ratio of 0.90, lower interference reduced the available contact pressure and increased the likelihood of incomplete or circumferentially discontinuous interface formation. This interpretation is consistent with the high scatter in T7 and T9 and with the clean separation regions observed on some extracted dowels.
The hole-to-dowel diameter ratio should therefore be regarded as a coupled geometric and process parameter rather than a purely dimensional quantity. Nevertheless, a smaller ratio is not universally beneficial: excessive interference may increase insertion resistance, local crushing, and sensitivity to hole circularity or wood anisotropy. The favorable response at 0.80 is specific to the present beech material, dowel diameter, plunging depth, and equipment.
4.2. Influence of Rotational Speed and Plunging Rate
Rotational speed and plunging rate govern the rate of frictional energy input, the duration of sliding contact, and mechanical compaction. The level average was highest at 1800 rpm, but ANOVA did not identify a significant rotational-speed main effect within 1600–2000 rpm. Leban et al. reported that dowel welding depends on rotational speed [
12], while Belleville et al. showed that the favorable rotational speed depends on wood species and interacts with plunging rate [
4]. Thus, 1800 rpm is best interpreted as a promising observed level under the present conditions.
A relatively low speed may provide insufficient heat input, whereas excessive speed under some interference and plunging conditions may promote unstable material flow. However, the post-pull-out photographs did not show systematic extensive burning at 2000 rpm. The lower level-average response at 2000 rpm therefore cannot be attributed solely to overheating or thermal degradation.
Plunging rate had a significant effect and the largest range value. The response increased from 6 to 14 mm·s
−1 within the tested range. Auchet et al. identified plunging rate as an important variable in wood-dowel welding [
13], and Zupcic et al. emphasized the role of welding duration in beech [
14]. In the present tests, increasing plunging rate shortened the nominal plunging duration while increasing instantaneous axial compression, material displacement, and the rate of heat generation.
The favorable response at 14 mm·s−1 therefore likely resulted from a balance between rapid heat generation and effective mechanical consolidation rather than from duration alone. The beneficial trend should not be extrapolated beyond the investigated range, because an excessively high plunging rate may reduce heat accumulation or generate unstable insertion resistance.
Overall, the statistical and physical evidence indicates that plunging rate and interference were the dominant controllable factors in the present design, whereas rotational speed acted in combination with geometry, local wood structure, and transient contact conditions.
4.3. Failure Morphology and Interpretation of Surface Darkening
The intact dowels were withdrawn along the cylindrical interface, but adhered fibers and irregular residual material show that failure was not purely adhesive separation. Instead, the joints exhibited mixed interfacial and cohesive failure, including separation, frictional sliding, and localized tearing of substrate wood fibers.
The dark-brown regions were used to identify the apparent extent of thermally modified material, but color alone cannot distinguish effective softening and densification from excessive degradation. Omrani et al. identified degradation gases and volatile products during friction welding [
7], and Zhu et al. showed that welding duration affects the thermal characteristics of welded material [
9]. These studies confirm that thermal modification occurs, but confirmed carbonization would require chemical, thermal, or microscopic evidence beyond surface photographs.
The similar apparent welded-area ratios of T3, T6, and T9, despite their substantially different pull-out capacities, demonstrate that visible area is not equivalent to effective interface quality. Continuity, consolidation, fiber anchorage, and the strength of the modified material are also critical. Because visible darkening occurred at 1600, 1800, and 2000 rpm, the current evidence does not show that high speed alone caused extensive burning.
The present inspection was limited to the fully exposed dowel-side interface. Although the corresponding hole-wall surfaces were not sectioned, the extracted dowels provided direct evidence of the failure path, fiber adhesion, interface discontinuity, and visible thermal modification.
4.4. Reliability, Process Variability, and Ineffective Interface Formation
Considerable specimen-to-specimen variability remained in several groups. Some curves contained an early low peak followed by prolonged low-load sliding, indicating that an effective load-bearing interface had not developed over a sufficient part of the plunging region. The surface images likewise showed non-uniform interface formation in both the axial and circumferential directions.
Ineffective interface formation was not controlled by a single cause. Local differences in density, grain orientation, moisture distribution, earlywood–latewood structure, and drilling damage can change compressive deformation and frictional response. In addition, solid-wood drilling studies have shown that actual hole diameter dispersion and out-of-roundness depend on tool runout and stiffness, rotational speed, grain direction, moisture content, and measurement position [
19,
20]. Variations in hole circularity, dowel roundness, dimensional tolerance, and spindle concentricity can therefore create non-uniform circumferential pressure even when the nominal dimensions are identical. Actual hole roundness was not measured in the present study, which prevents the geometric and anatomical contributions to scatter from being separated quantitatively.
Process variability provides an additional source of scatter. The welded layer develops through coupled contact pressure, heat generation, softening, flow, and consolidation. Small differences in actual interference, axial resistance, or transient contact can leave some regions insufficiently heated or compacted. The same nominal settings therefore do not necessarily generate an identical effective interface in every specimen. For this reason, specimens were not excluded because their loads were merely low; exclusion required clear curve-shape evidence of ineffective interface formation.
The supplementary tests improved characterization of the high-scatter groups but did not replace valid initial observations or guarantee a smaller CV. The increase in CV for T9 after additional testing demonstrates that the remaining scatter is a property of the process–material combination rather than an artifact that can be removed by increasing replication.
Different interference levels may produce different instability mechanisms. At a ratio of 0.90, low contact pressure can lead to incomplete interface formation, as suggested by T7 and T9. At a ratio of 0.80, mean resistance was higher, but V still had a CV of 35.93%. This high CV shows that optimization of the mean response did not stabilize the process. Because the 0.80 ratio imposed the largest nominal interference, small departures from the 8.0 mm hole diameter, dowel roundness, alignment, or local beech density could produce large changes in actual circumferential pressure and insertion resistance. The present data cannot isolate the relative contributions of geometry and anatomical heterogeneity; future work should record actual hole diameters and roundness at multiple depths together with insertion force or spindle torque.
The apparent welded-area analysis further showed that visible dark area alone could not explain reliability. Interface continuity, consolidation quality, local fiber anchorage, and effective material strength were at least as important as visible area. The remaining scatter is therefore an important result rather than a nuisance to be removed: reliable application requires control of both average resistance and the probability of incomplete interface formation.
4.5. Post-Peak Response and Failure Suddenness
In addition to peak pull-out load, the post-peak response provides important information for evaluating the failure behavior of rotationally friction-welded dowel joints. The results showed that the groups with higher average peak loads generally had smaller values of . For example, T2, T3, and T5 exhibited relatively high pull-out capacities, while their mean values were only 0.039 mm, 0.050 mm, and 0.020 mm, respectively. The validation group also showed a high average peak load and a very small value of 0.028 mm. These results indicate that high-capacity welded joints tended to exhibit a rapid post-peak load drop after reaching their maximum resistance.
A well-consolidated interface can resist pull-out effectively before peak load, but once interfacial cracking or local fiber tearing initiates, the stored elastic energy and strong constraint can promote rapid propagation. By contrast, incomplete interfaces may retain resistance through progressive sliding and friction, producing a lower peak but a more gradual descending branch.
Most previous investigations have emphasized withdrawal strength or capacity prediction. Xu et al. studied the pull-out resistance of densified welded dowels [
11], while Xu et al. developed a model for axially loaded welded joints [
16]. The present Δδ50 index is intended as a supplementary descriptor of failure suddenness rather than a replacement for strength.
The negative group-mean relationship between peak load and Δδ50 suggests a strength–failure-suddenness trade-off. Optimization increased observed mean resistance, but did not necessarily improve ductility, warning, or residual load transfer. In a single-load-path joint, the rapid loss of resistance after peak load would be undesirable because it limits deformation warning and load redistribution. Accordingly, peak capacity alone should not be used as the design criterion for a structural or furniture connection.
Consequently, capacity, variability, and post-peak behavior should be evaluated together. The small Δδ50 of the validation group is particularly relevant for assemblies in which warning, redistribution, or residual resistance is required.
4.6. Practical Implications and Requirements for Application
Rotational friction welding avoids adhesive curing and can be implemented with spindle-based equipment. The present results demonstrate substantial pull-out resistance and identify a promising parameter region for furniture joints, interior wood products, panel assemblies, and other connections in which multiple dowels or redundant load paths are available.
However, optimization of the mean response is not equivalent to establishing engineering reliability. Several groups retained high CV values, and V combined high mean capacity with substantial scatter and abrupt post-peak degradation. A single welded dowel should therefore not yet be treated as a reliably characterized safety-critical structural fastener on the basis of the present tests alone. Where this joining method is used, multiple dowels, alternative load paths, and connection details that permit redistribution should be preferred until characteristic resistance and post-peak performance are established.
Practical production would require tighter control of dowel diameter, hole diameter and circularity, drilling quality, spindle concentricity, grain orientation, moisture condition, rotational speed, and plunging history. Monitoring insertion force, spindle torque, welding duration, or mechanical energy may provide more effective quality control than nominal machine settings alone. Multiple-dowel assemblies may provide redundancy, but group effects and load distribution require separate verification.
The principal practical value of this study is therefore the identification of a promising parameter region and the clarification of factors governing capacity and variability. Before critical structural application, larger sample populations, lower-percentile or characteristic resistance values, repeated production batches, dimensional-tolerance studies, durability exposure, cyclic or sustained loading, and connection-level tests are required.