Article

Application of Biofertilizers as a Strategy to Reduce P-Mineral Fertilization in the Production of Eucalyptus globulus Labill


1
Instituto Superior de Agronomia, Universidade de Lisboa, Tapada da Ajuda, 1349-017 Lisboa, Portugal
2
LEAF-Linking Landscape, Environment, Agriculture and Food Research Center, Associate Laboratory TERRA, Tapada da Ajuda, 1349-017 Lisbon, Portugal
3
Hubel Verde SA, Parque Hubel, Bela Curral, Pechão, 8700-179 Olhão, Portugal
4
The Navigator Company, Av. Fontes Pereira de Melo, 27, 1050-117 Lisboa, Portugal
5
Sustainable Plant Protection, IRTA. Ctra. Cabrils Km 2, 08348 Cabrils, Spain
*
Author to whom correspondence should be addressed.
Forests 2026, 17(7), 780; https://doi.org/10.3390/f17070780
Submission received: 12 May 2026 / Revised: 24 June 2026 / Accepted: 29 June 2026 / Published: 30 June 2026
(This article belongs to the Special Issue Forest Growth, Soil Properties and Climate)

Abstract

Eucalyptus (Eucalyptus globulus Labill.) plays a fundamental role in the Portuguese forestry sector, highlighting the need for sustainable practices that contribute to maintain soil fertility and biodiversity, without compromising productivity. An experiment was conducted, with a low extractable-P soil (<10 mg P2O5 kg−1), to evaluate the use of biofertilizers as a strategy to reduce mineral fertilizers dependency. Eucalyptus trees were inoculated at transplantation, with two commercial inoculants based on Glomus iranicum (an arbuscular mycorrhizal fungus, AMF) and inorganic phosphate-solubilizing bacteria (Pseudomonas putida and Pseudomonas fluorescens), under differential P fertilization conditions. Reducing P fertilization to 70% and 40% of the reference dose did not significantly reduce final aboveground biomass, under the studied conditions. Biofertilizer application enhanced soil P availability, particularly when AMF and Pseudomonas were co-inoculated, suggesting synergistic effects on P mobilization and uptake. Plant physiological performance, assessed through vegetation indices, remained stable across treatments, indicating effective acclimation to reduced P supply, while stomatal conductance suggested improved tolerance to P deficiency in Pseudomonas-inoculated plants. The widespread presence of a well-established native mycorrhizal community, which led to a higher root colonization under low P conditions, highlights the importance of plant–microbe interactions in nutrient-limited environments. Overall, these findings underscore the potential of integrating reduced P fertilization with microbial inoculants to improve P use efficiency and support sustainable eucalyptus production.

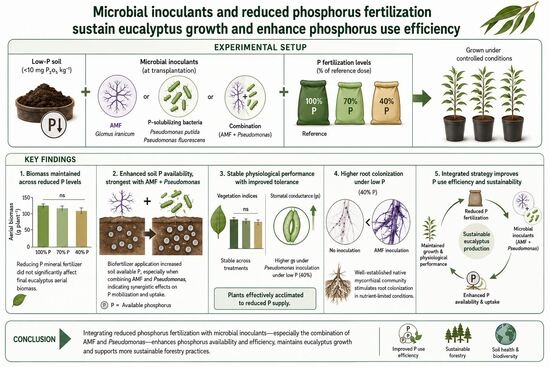
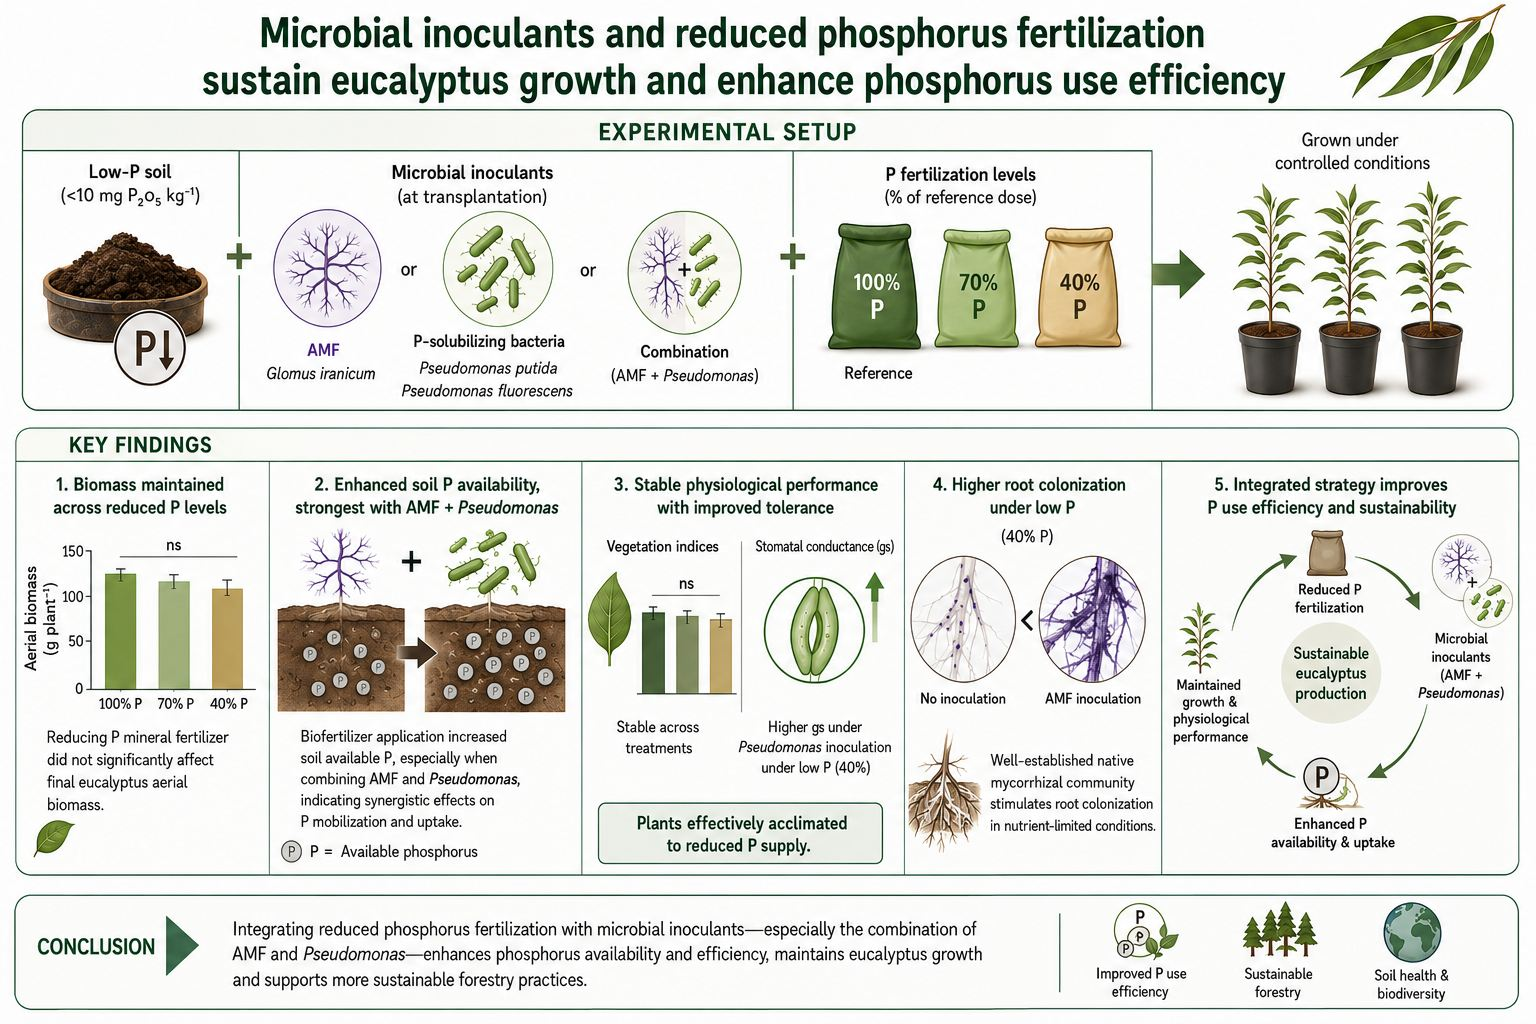
Graphical Abstract

1. Introduction

Arbuscular mycorrhizal fungi (AMF) and plant growth-promoting bacteria (PGPB) are microorganisms that inhabit almost all soils, including forest soils and agroecosystems [1]. These organisms form mutualistic symbioses with plant roots, helping them increase nutrient and water uptake, growth, and stress tolerance through various direct and indirect mechanisms [2,3]. For this reason, some species with scientifically proven effects are commercially available as biofertilizers [3,4].
The legislation applicable to fertilizers in Portugal [5,6] is based on the most recent European Fertilizer Directive, the Regulation (EU) 2019/1009 [7], which integrates their use and clearly establishes the types of products that can be classified as biofertilizers. According to this regulation, a biofertilizer is “a product whose active ingredient is live microorganisms, that promote the nutrition and/or development of plants, without affecting the biological diversity of the soil and the environment”. Indeed, there is a wide diversity of microorganisms that can be used as biofertilizers, but the legislation only refers to products based on: (i) nitrogen-fixing bacteria, (ii) phosphate-solubilizing bacteria, and (iii) mycorrhizal fungi [6].
Eucalyptus is a widely established tree in Portugal, with the predominant species being Eucalyptus globulus Labill., whose wood is mainly used in the pulp and paper industry [8,9]. Eucalyptus forests are managed under a coppice regime (with 10–12 years rotations), currently occupying more than 844,000 hectares in the continental territory, with annual wood yields varying between 6 and 40 m3 ha−1, depending on local soil and climate conditions [10,11]. According to the 6th Portuguese Forest Inventory [10], the area occupied by eucalyptus forests represents approximately 26% of the forest area of the continental territory, reflecting a systematic increase in the area occupied over the last 50 years.
Phosphorus (P) is an essential plant macronutrient, being part of important molecules and participating in vital processes, such as photosynthesis, respiration, and regulation of enzymatic reactions [12]. Although depending on plantation age, typically, P fertilization of eucalyptus results in increased yields [13]. For instance, in response to P limitation, young plants of different Eucalyptus species have shown reduced growth along with decreased photosynthesis and leaf respiration [14]. Due to its low solubility, P is the macronutrient with the lowest availability to plants in soils. Even in well-fertilized systems, plants typically utilize only about 20% of the applied P, as most inorganic P becomes fixed in the soil or incorporated into organic P forms [15]. According to Vance et al. [12], P availability in soil limits crop yields on more than 30% of global arable land, and some projections indicate that readily accessible, low-cost P reserves, extracted from phosphate rock deposits, could be exhausted by around 2050. Although current estimates suggest that reserve depletion may occur more slowly than previously anticipated, there remains a pressing need to reduce P inputs in agriculture [16].
In this context, it is of great interest to identify strategies to enhance P-use efficiency, namely the contributions that the application of biofertilizers might have in increasing plant P acquisition and utilization, essential for the economic viability and environmental sustainability of plant fertilization. Although the use of biofertilizers is already a common practice in the agricultural sector [17], their application in the forestry sector remains limited. However, the challenges faced by the forestry sector, particularly in eucalyptus production, are like those of agriculture: reduce the use of inorganic fertilizers and phytosanitary products, preserve soil fertility and biodiversity, increase productivity, and reduce the biotic and abiotic stress to which eucalyptus trees are exposed [18].
The main aim of this study was to evaluate the use of two commercially available inoculants, based on Glomus iranicum var. tenuihypharum (an AMF) and inorganic phosphate-solubilizing bacteria (Pseudomonas putida and Pseudomonas fluorescens), applied individually and together, as a strategy to reduce the dependence on mineral P-fertilizers in eucalyptus production. The initial hypothesis establishes that the joint inoculation of these organisms will enhance their beneficial effects on the eucalyptus plant, allowing a reduction in mineral P fertilization without losses in productivity and without negative impacts on soil nutritional status and plant physiological parameters.

2. Materials and Methods

2.1. Soil and Biofertilizers Characteristics

The experiment was carried out in 50 L pots at the School of Agriculture, University of Lisbon. To carry out the experiment, a natural soil, with no history of use in forest production, was selected, with low P availability (<10 mg P2O5 kg−1 extractable P, determined by the Egner–Rhiem method). Specifically, the soil was collected in Pegões (Portugal; 38°39′22.9″ N, 8°35′37.3″ W) at a depth of, approximately, 0–50 cm. The soil was coarse-textured (sandy), slightly acidic (pH 5.7; soil ratio 1:2.5, m/v), non-saline (electrical conductivity, EC = 0.02 mS cm−1; soil ratio 1:2, m/v), and characterized by low organic matter (OM) content (0.28%, m/m) and low levels of other nutrients, including potassium (K) (19 mg K2O kg−1 extractable K, determined by the Egner–Rhiem method).
Regarding commercial biofertilizers, a biological inoculum based on an AMF (G. iranicum var. tenuihypharum; market name: MycoUp®, Symborg brand), formulated in a clay mineral substrate, with 1.2 × 10⁴ propagules/100 mL, and another one based on phosphate-solubilizing bacteria (P. putida 108 CFU/mL and P. fluorescens 108 CFU/mL; CFU: colony-forming units; market name: Natiphos®, Hubel Verde SA (Olhão, Portugal), were used.

2.2. Experimental Set-Up

The experiment was carried out in two phases. In the first, young eucalyptus trees, provided by Aliança Nurseries (clone G1202), were transplanted into 3.5 L pots filled with the soil collected in Pegões. During transplantation, which took place on 16 February 2023, 12 plants were inoculated with G. iranicum (Gi), 12 plants with P. putida and P. fluorescens (Pp), and another 12 plants were inoculated with both inoculants (GiPp). Glomus iranicum was applied by preparing a MycoUp® suspension in water and applying a suspension volume calculated to provide 2 g of inoculum per plant. Pseudomonas putida and P. fluorescens were applied by applying 4 mL of Natiphos® inoculum per plant, previously diluted in deionized water. Another 12 non-inoculated plants were used as controls (Cont). Pots were randomly placed in a mobile bench, in a greenhouse without controlled conditions (the temperature and humidity were not controlled), and moved outside whenever the weather was favorable.
The plants were maintained at 70% of the soil’s water-holding capacity throughout the experiment and were watered with deionized water by adjusting the weight of the pots, allowing for a precise control of substrate moisture in this first phase of the experiment.
One week after transplanting and inoculation, plants were fertilized with equal doses of nitrogen (N) and K, and with different doses of P (100%, 70% and 40% of the usual dose of mineral-P, via mineral application, considering the characteristics of the soil, poor in P). To this end, all plants received 47.14 g of a controlled-release fertilizer (N:P:K 14:11:9), this being the lowest dose of P supplied (40% P; 5.2 g P2O5/plant). In treatments with higher doses of P (70% and 100%), supplementation was carried out by applying superphosphate (18% P2O5) in basal fertilization (3.9 and 7.8 g P2O5/plant, respectively, for the 70% and 100% treatments).
Seven weeks after the start of the experiment, the second phase of the study began. The plants were transplanted into 50 L pots using the same type of soil and placed outdoors in a semi-controlled environment, meaning they were not protected from precipitation, temperature, or light. Plants were routinely watered with the same volume of tap water to, approximately, 70% of the soil’s water-holding capacity. The trial continued for 31 weeks.

2.3. Eucalyptus Plant’s Physiological Parameters, Growth Performance and Foliar Analysis

Several plant physiological parameters were periodically evaluated, including the relative chlorophyll index (RCI), measured with a Hansatech CL-01 Chlorophyll Meter (Hansatech Instruments Ltd., Norfolk, UK); the photochemical reflectance index (PRI) and the normalized difference vegetation index (NDVI), measured with the PlantPen PRI 200 and PlantPen NDVI 300 sensors, respectively (PSI—Photon Systems Instruments, Drásov, Czech Republic); and stomatal conductance (gs, mmol m−2 s−1), initially measured using a CIRAS-3 infrared gas analyzer (PP Systems, Amesbury, MA, USA) and subsequently with a LI-600 Porometer/Fluorometer (LI-COR Biosciences, Lincoln, NE, USA). The RCI, PRI, and NDVI are dimensionless indices.
At the end of the experiment (31 weeks after transplanting), the plants were harvested and separated into different parts: trunks, branches, leaves, and roots. A small sub-sample of fine roots was collected (~1–2 g), washed and processed to be further analyzed for the potential mycorrhizal colonization (see Section 2.5). The weight of the fresh and dry biomass (after 48 h of drying at 60 °C) of each part was recorded, and finally, the total dry biomass of the aerial part was determined by their sum. Despite the efforts to separate the whole root biomass, and the repeated washing, it was not possible to guarantee that the sample was completely collected and separated from the soil particles. Therefore, no further processing of the roots was carried out.
The dried leaf samples were ground using a knife mill (Fritsch Pulverisette 15; Fritsch GmbH, Idar-Oberstein, Germany) and used for foliar nutrient analysis. Total N concentration was determined by the Dumas combustion method, using a VELP NDA 702 DUMAS Nitrogen Analyzer equipped with a thermal conductivity detector (TCD) (Fisher Scientific S.L., Madrid, Spain). Total concentrations of P, Mg, K, Ca, Na, S, Fe, Cu, Zn, Mn, and B were determined after aqua regia digestion by inductively coupled plasma optical emission spectrometry (ICP-OES) using an iCAP 7000 Series ICP Spectrometer (Thermo Fisher Scientific S.L., Madrid, Spain), following a methodology adapted from the European Standard [19]. All nutrient concentrations were expressed on a dry matter basis at 105 °C.

2.4. Soil Analysis

At the end of the experiment, a homogenized soil sample was collected from each pot, air-dried at room temperature, and passed through a 2 mm sieve. Soil pH and EC were determined in deionized water extracts prepared at soil-to-water ratios of 1:2.5 (w/v) and 1:2 (w/v), respectively. Total organic carbon (Corg, % w/w) was quantified by combustion at 1200 °C, followed by infrared detection of the evolved CO2 using an elemental analyzer (multi-EA 4000, Analytik Jena, Jena, Germany). Organic matter (OM, %) was estimated assuming an average Corg content of 58%, according to the equation: OM = Corg × 1.724. Mineral N, calculated as the sum of NH4+-N and NO3-N, was determined after extraction with 2 M KCl at a 1:5 (w/v) soil-to-solution ratio for 60 min under agitation, followed by centrifugation at 4000 rpm. The concentrations of NH4+ and NO3 in the supernatant were then quantified using a segmented flow analyzer (San++ System, Skalar Analytical B.V., Breda, The Netherlands). Extractable P and K, expressed as P2O5 and K2O, respectively (mg/kg), were measured by the Egner–Riehm method, using a 1:20 (w/v) extractant of 0.1 M ammonium lactate in 0.4 M acetic acid [20], shaken mechanically for 120 min in an end-over-end shaker, centrifuged for 15 min at 4000 rpm, and quantified in the extraction solution by ICP-OES. This extraction procedure is commonly used in Portugal, well adapted to this type of acidic soils, and interpreted using ranges of concentration studied for the Egner–Riehm extractant [21]. Cation exchange capacity (CEC) was assessed by measuring non-acid exchangeable cations (Na+, K+, Ca2+, and Mg2+) and hydrogen ions (H+). Non-acid exchangeable cations were extracted with 1 M ammonium acetate (1:15 w/v), shaken mechanically in an end-over-end shaker (J.P. Selecta Rotabit, Fisher Scientific S.L., Madrid, Spain), centrifuged at 4000 rpm for 15 min, and measured using by ICP-OES. Acid exchangeable cations were measured as hydrogen ions (H+), extracted using 1 M KCl (1:10 w/v), shaken for 30 min, centrifuged at 4000 rpm, and titrated with 0.05 M NaOH with phenolphthalein indicator. Micronutrients were quantified using the Lakanen and Erviö extraction procedure, with a 1:10 (w/v) solution of 0.5 M ammonium acetate, 0.5 M acetic acid, and 0.02 M EDTA (pH 4.65), agitated for 60 min, centrifuged at 4000 rpm, and measured by ICP-OES. The optical emission spectrophotometer used was an iICP 7000 series equipment (Thermo Fisher Scientific, S.L., Madrid, Spain).

2.5. Mycorrhizal Colonization Analysis

At the end of the experiment, roots were collected, washed thoroughly with tap water to remove attached particles, and a sample of 1–2 g of fine roots was collected at five different spots of the root system, washed again with deionized water, and kept in the fridge at 4 °C, no longer than 48 h before processing. Roots were stained following the protocol of Phillips & Hayman [22]. Briefly, 1 g of fine roots from each plant were cleared in 10% KOH and H2O2, acidified with 1% HCl, and stained with 0.05% trypan blue. The grid-line intersection method was used to determine the percentage of roots colonized by AMF (100 observations were made per plant) [23].

2.6. Statistical Treatment of Data

Descriptive statistics were used to analyze the data (mean and standard deviation). The homogeneity of variance and normality of the data were verified using the Kolmogorov–Smirnov test. Data were subjected to a three-way Factorial ANOVA analysis of variance, to evaluate the effects of the main factors (1–G. iranicum inoculation (Gi), 2–Pseudomonas inoculation (Pp), and 3–phosphate fertilization dose), and their interaction.
Data obtained for the physiological parameters over time (31 weeks) were analyzed using Repeated Measures ANOVA, considering “Time” as the repeated-measure factor.
In cases where a significant effect of the factors or for their interaction was observed (p ≤ 0.05), Tukey HSD test was further used to identify differences between means (p < 0.05). The statistical treatment of the results was performed using STATISTICA 7.0 software (SoftwareTM Inc., Tulsa, OK, USA, 2004).

3. Results

3.1. Effects of the Treatments on Eucalyptus Physiological Parameters and Growth

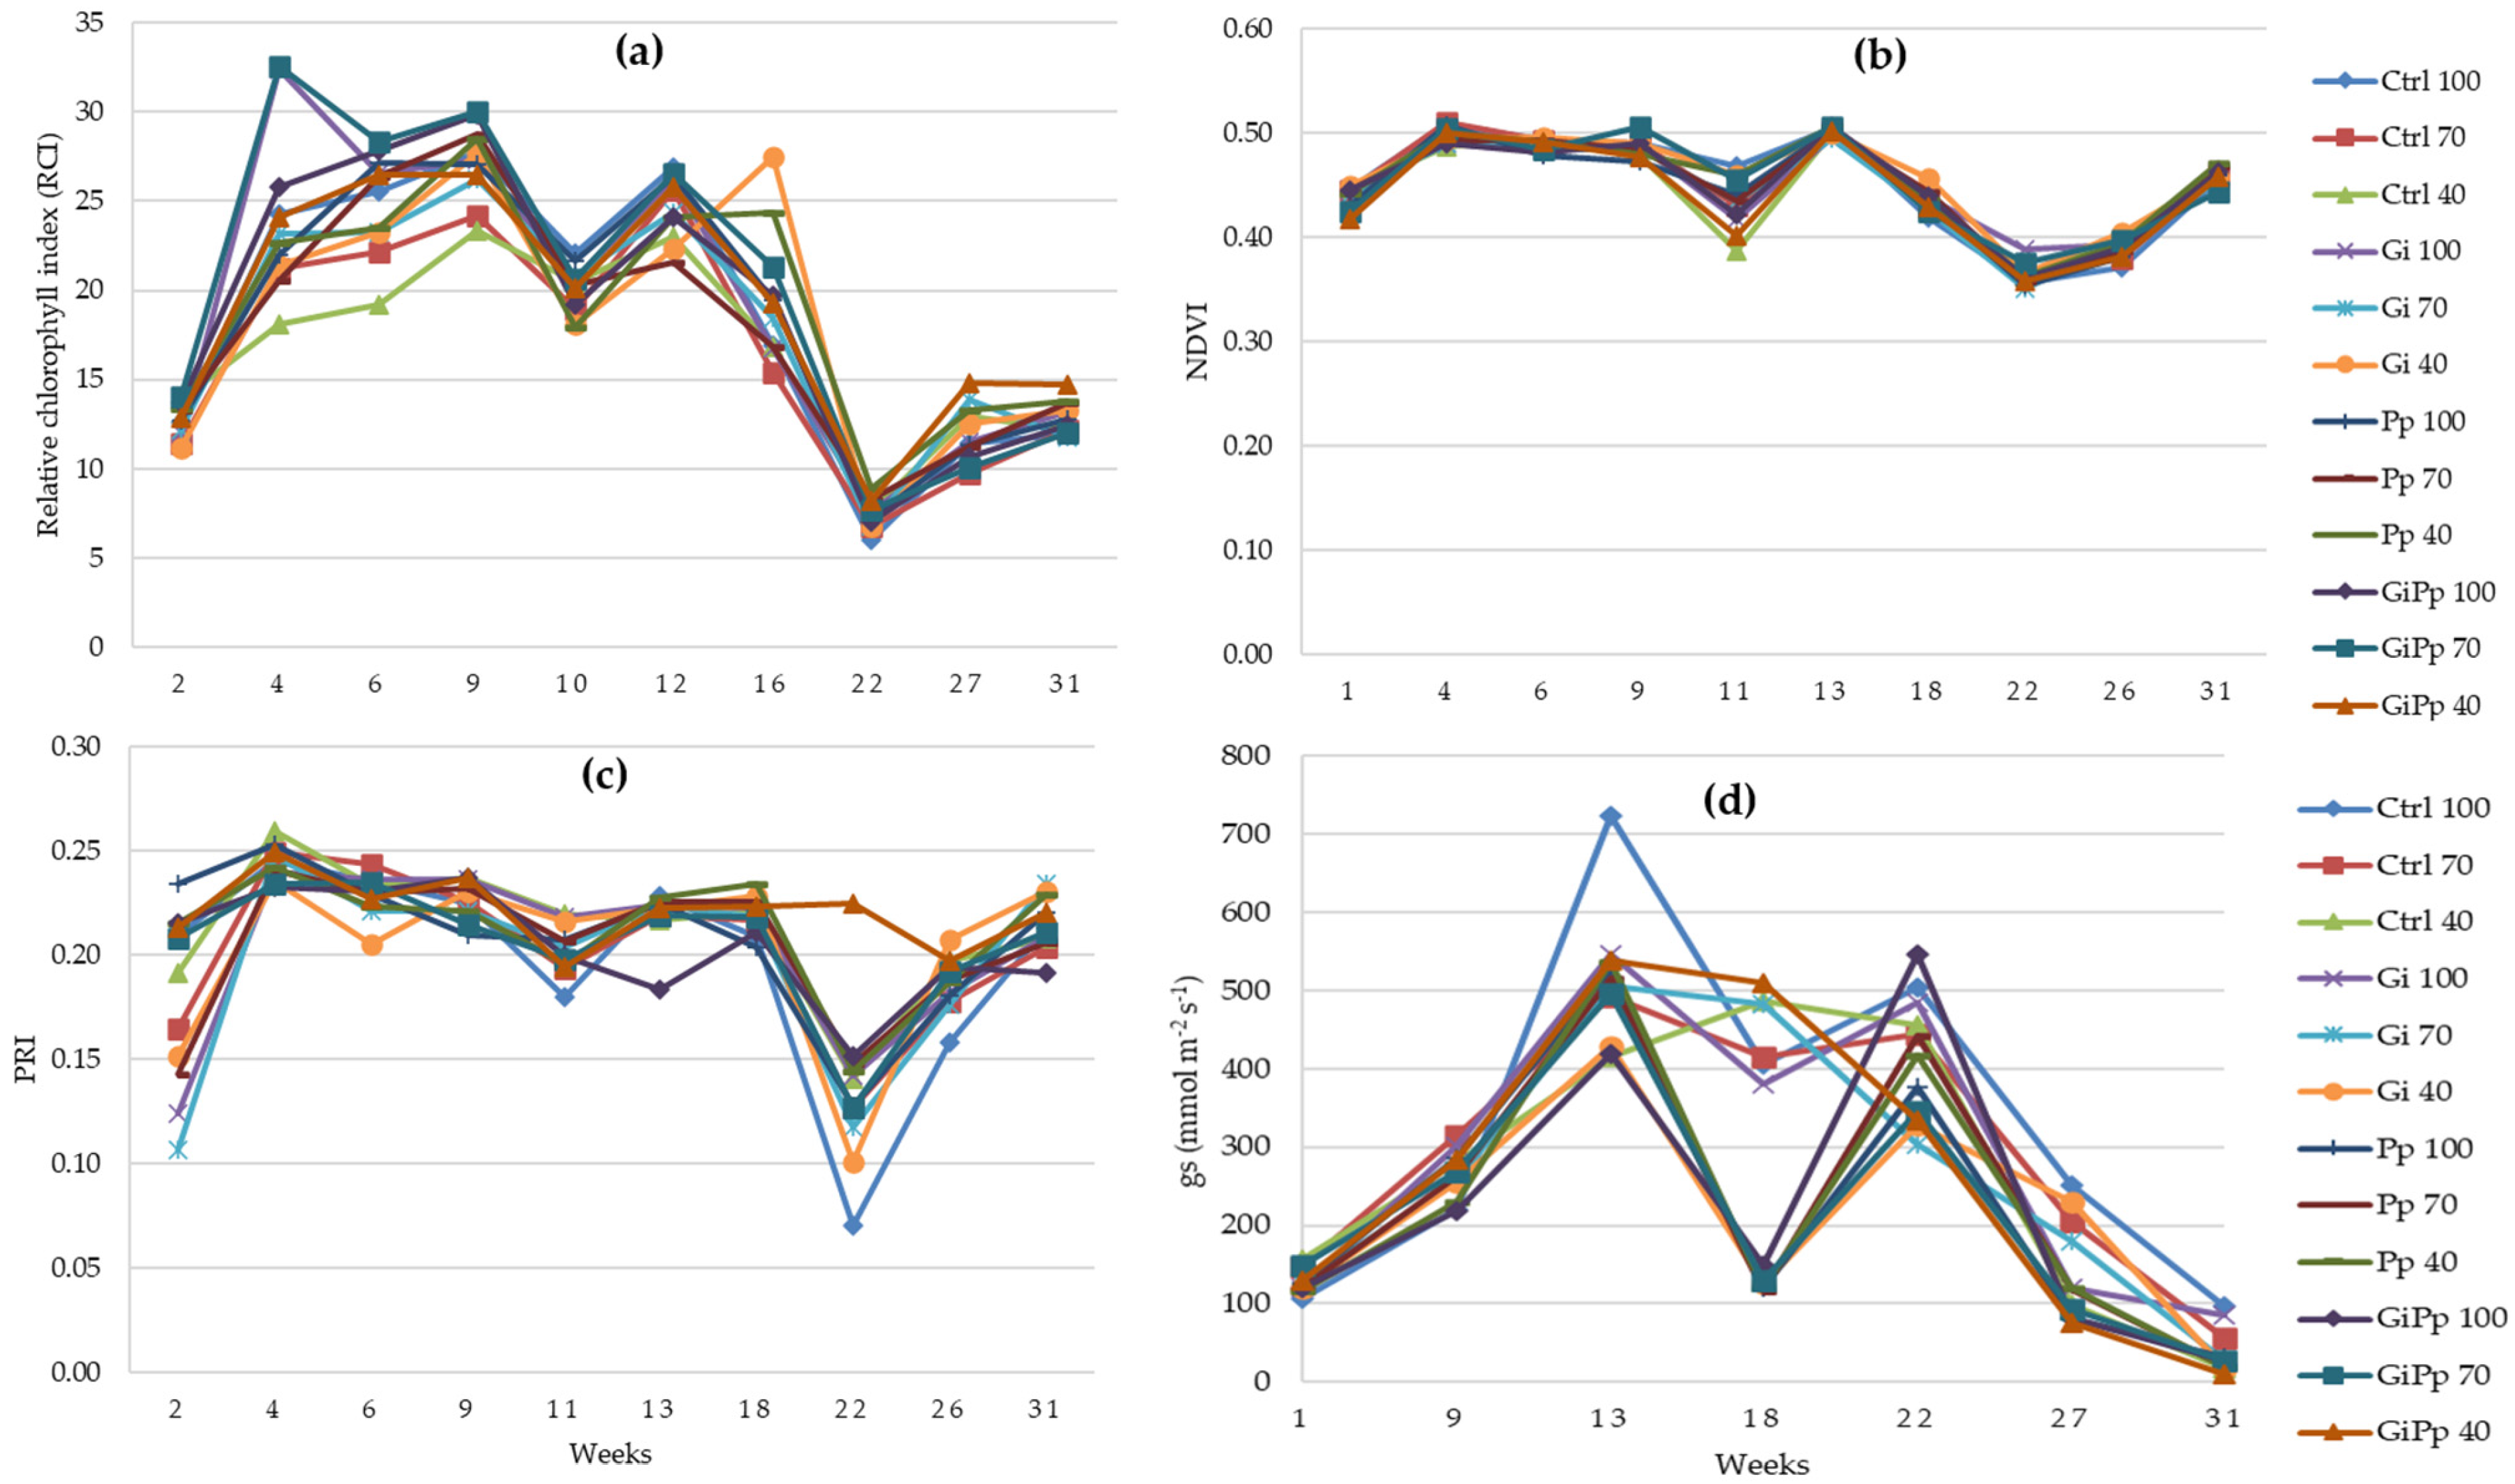
Considering the results obtained for the vegetation indices and stomatal conductance analyzed during the 31 weeks of the experiment (RCI, NDVI, PRI, and gs; Figure 1a, Figure b, Figure c and Figure d, respectively), seasonal variation had a greater effect on the parameters than the treatments. This fact is clearer in the case of NDVI measurements, where all treatments tended to respond in the same way, as indicated by the nearly overlapping lines (Figure 1b), with values ranging between 0.350 and 0.500. In fact, statistical treatment of data evidenced that time had a significant effect on NDVI, without significant interactions with Gi, Pp, or fertilization factors, but with a significant three-way interaction between the main factors (Gi, Pp and fertilization) (Table 1). This indicates that treatment combinations influenced the overall response of NDVI, but not how it changed over time.
A temporal pattern can also be observed for gs (Figure 1d), but with a distinct behavior, observed in week 18, between two groups: a first group maintaining values of about 400 mmol m−2 s−1, including the control treatments—Ctrl100, Ctrl70, and Ctrl40–and some plants inoculated with G. iranicum—Gi100, Gi70, and GiPp40; and a second group, comprising the remaining treatments, whose values were up to five times lower (Figure 1d). Also to be noted, there was a marked reduction in gs during the final weeks of the experiment, reaching values very close to zero in the final measurements, indicative of an accentuated stomata closure. Statistical treatment of data showed that time was the only factor which had a significant effect on gs, without significant interactions with Gi, Pp, or fertilization factors (Table 1), which indicates that stomatal conductance was not influenced by other treatment effects.
Contrastingly, for the RCI and PRI, time did interact significantly with one or more of these main factors, although no consistent or clear trend could be discerned over the measurement period (Figure 1a,c).
To better understand the cumulative effects of the main factors on physiological parameters, an additional statistical analysis was performed, using data collected only at harvest (Table 2A,B). At this time point, no significant effects were observed on RCI, NDVI, and PRI, regarding those factors of variance, nor interactions between treatments (p > 0.05). However, in the case of gs, a significant interaction was found between Pp and the fertilizer dose factors. While in plants non-inoculated with the phosphate solubilizing bacteria a decreasing trend on gs values was observed, as the fertilizer dose was reduced (Table 2A), in inoculated plants, no differences were found in gs measurements among the different P-fertilizer doses.
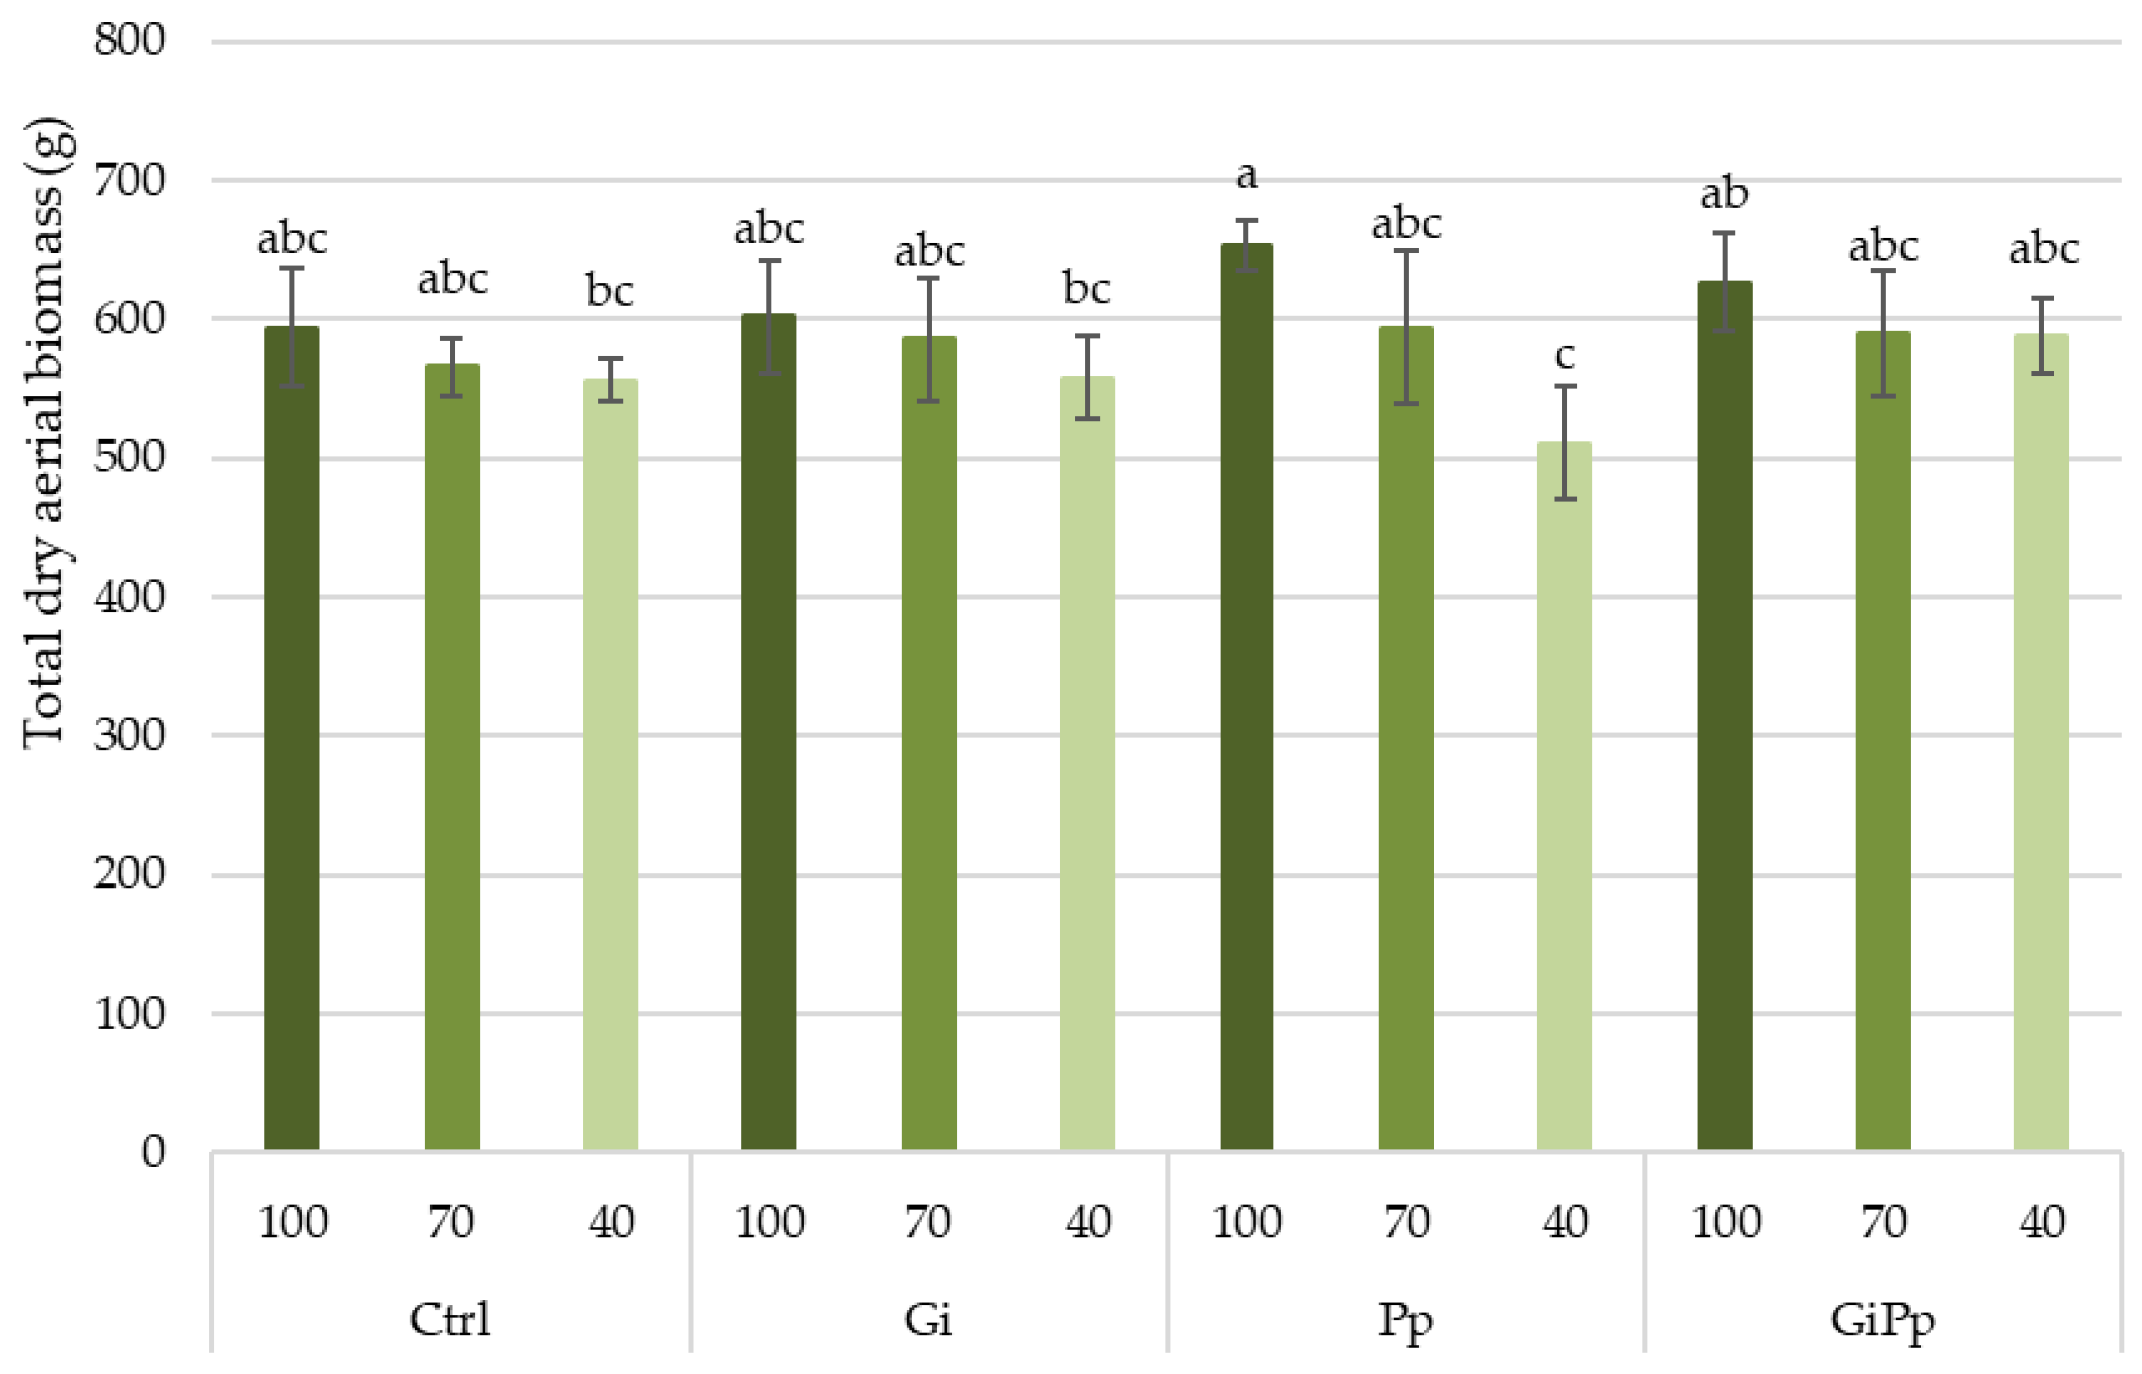
Considering plant biomass at the end of the experiment (31 weeks after inoculation), no significant effects were observed from any of the microbial inoculations—neither Gi nor Pp factors (Table 3). Fertilizer dose was the sole parameter exerting a significant effect on leaf, branch and total aerial biomass. As shown in Figure 2, a reduction trend was observed in total eucalyptus aerial biomass (including leaves, branches, and trunk) as a response to lower fertilizer doses. This trend was especially obvious in Pp-inoculated plants (without Gi), when P fertilization was reduced from 100% to 40% of the reference dose, but more evident because the Gi100 treatment was the one with the higher biomass production. The differences were statistically more distinct for total aerial biomass (Table 3), which showed a significant influence of P fertilization (three-way ANOVA, p < 0.001). A more detailed analysis of the results for eucalyptus total aerial biomass (Figure 2) showed that the effect of applying different P doses was only significant in plants inoculated with Pseudomonas, where plants with 100% P fertilization had significantly higher shoot biomass than plants with 40% P fertilization.

3.2. Mycorrhizal Colonization

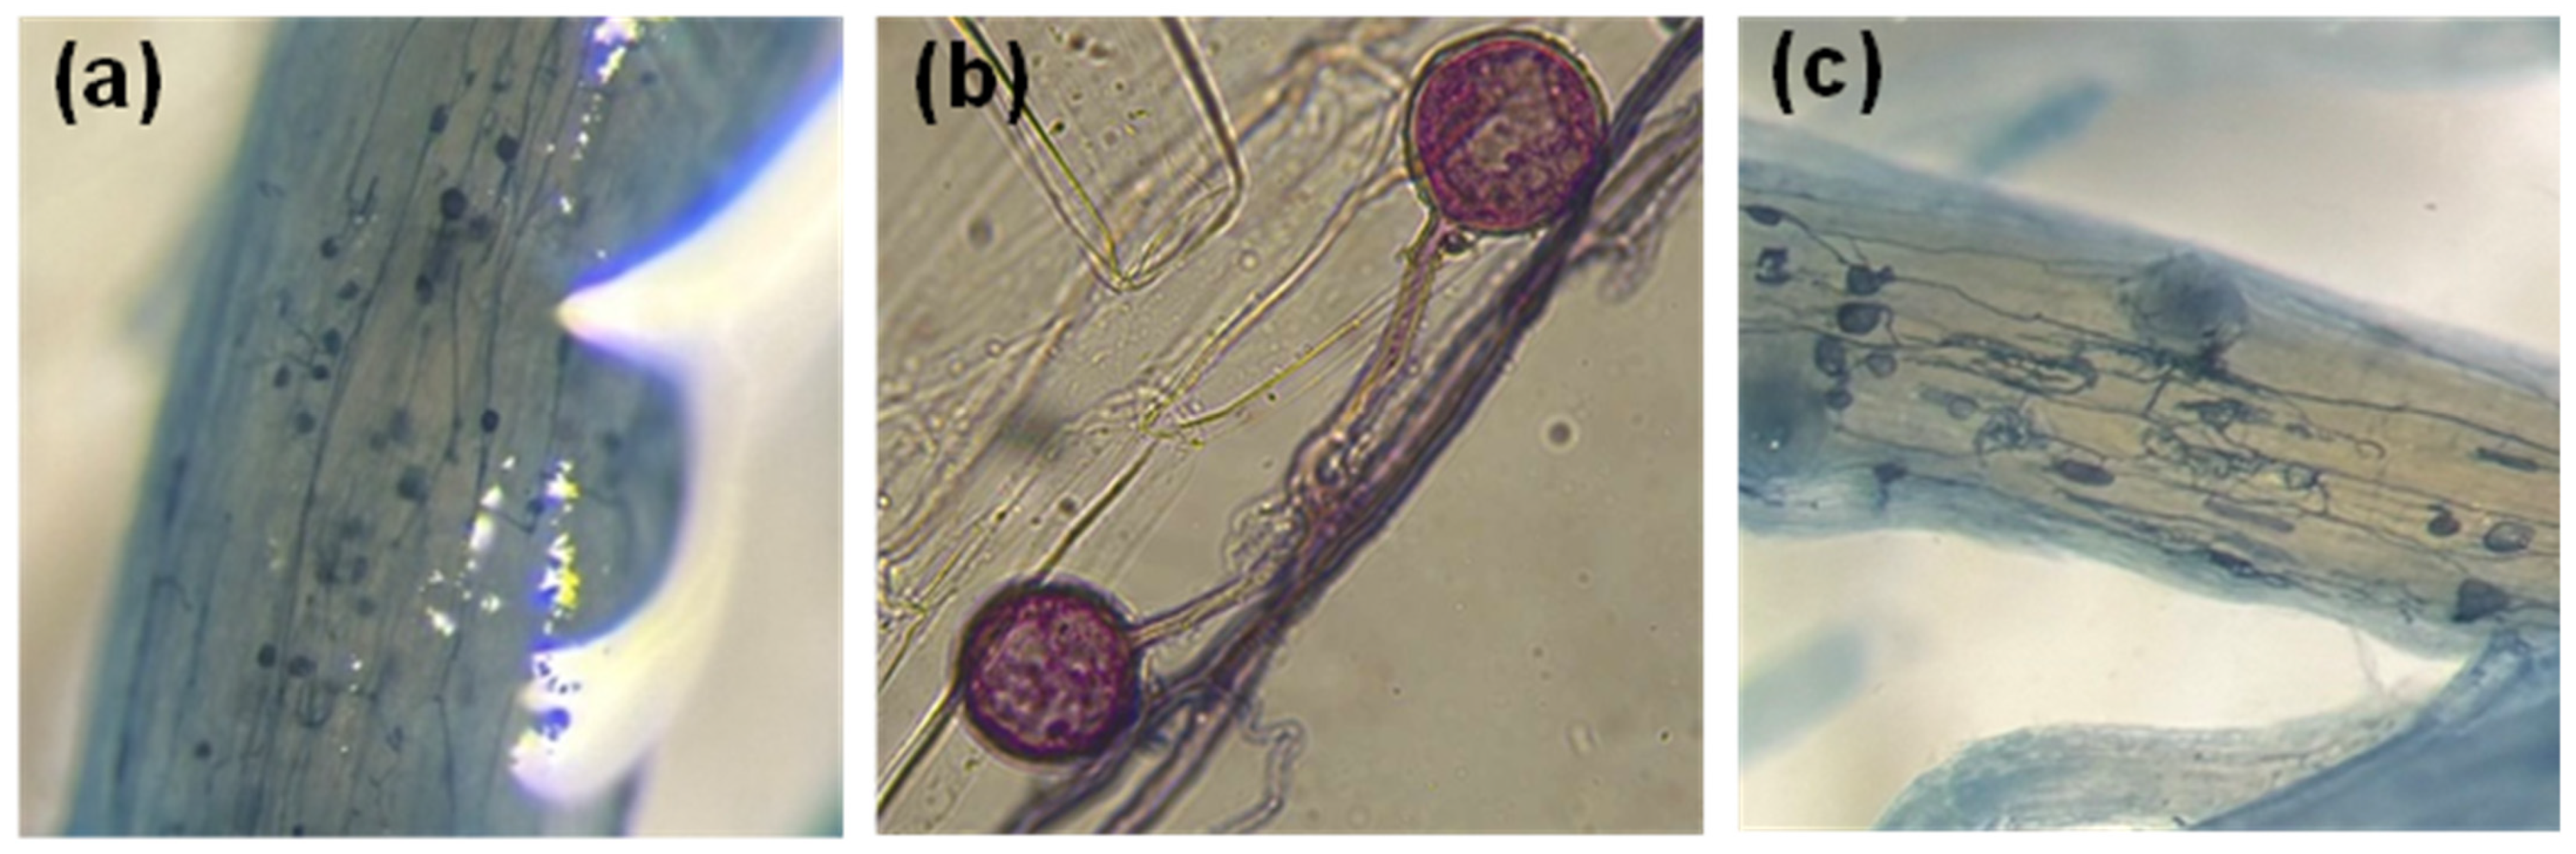
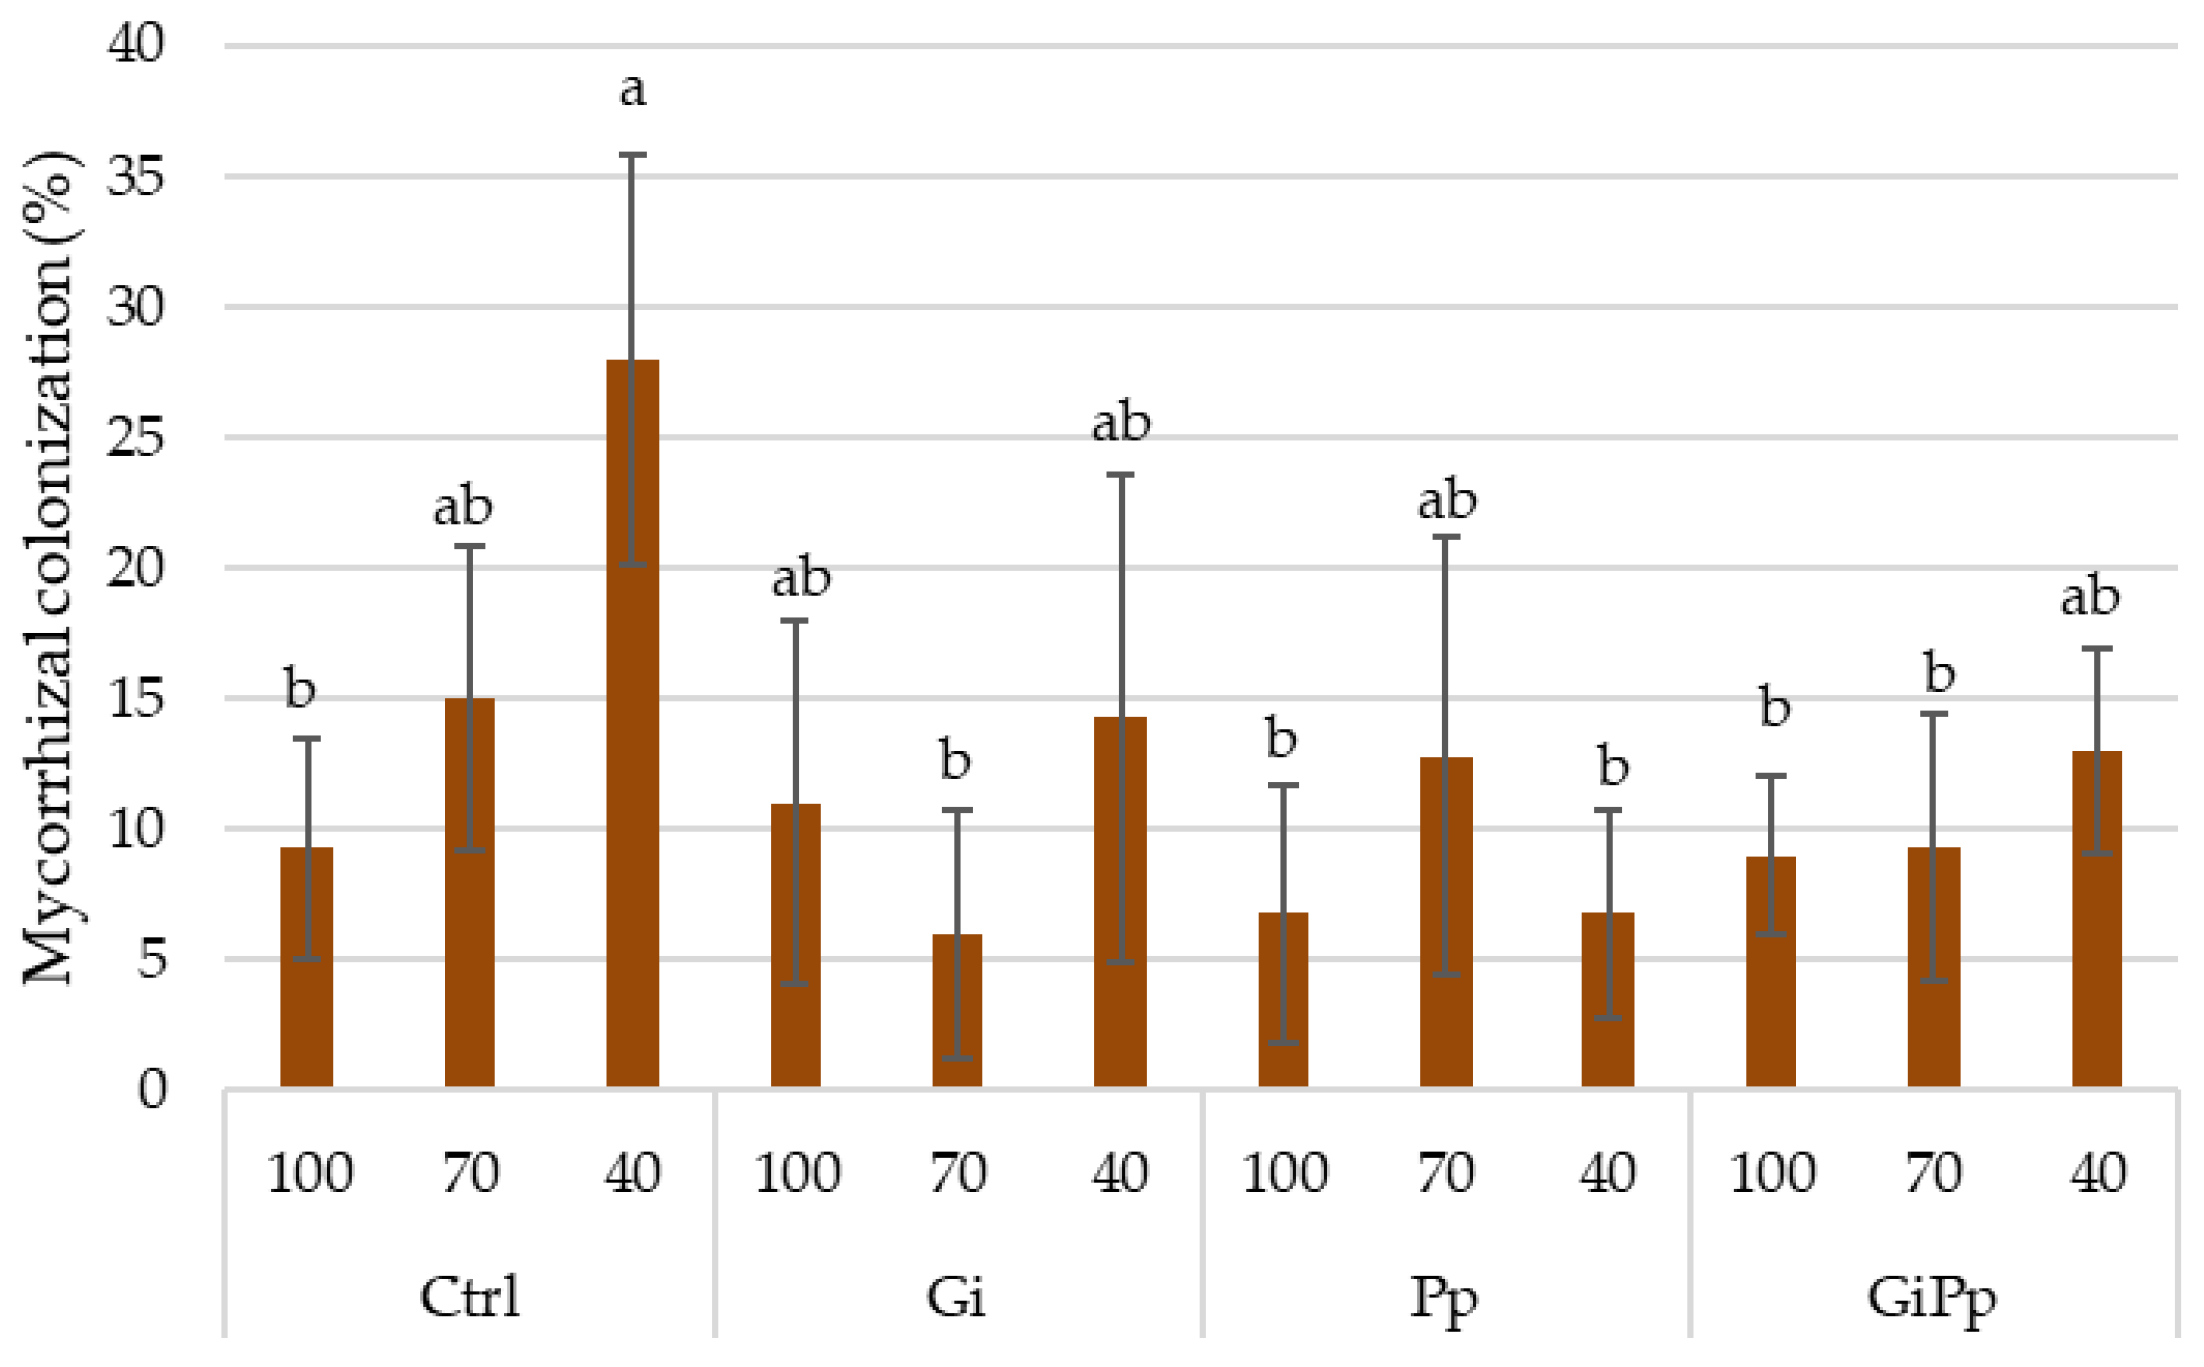
At the end of the experiment, root mycorrhizal colonization was evaluated. All individuals in all treatments were found to be colonized by AMF (Figure 3), but the colonization percentage was relatively low, never exceeding 28%.
A significant interaction was found between Gi and Pp inoculation factors (Table 3). Differences in this parameter were only significant in the non-inoculated control plants, reaching significantly higher values in those that received 40% of the P fertilization dose compared to those that received 100% (Figure 4).

3.3. Effects of the Treatments on Plant Nutritional Status

Regarding foliar macronutrient analysis, while N concentration was not significantly affected by any of the studied factors, P concentration was significantly influenced by the P-fertilizer dose (p < 0.05), and K concentration was influenced by Pp inoculation (Table 4A). However, no significant differences were found between N, P and K foliar mean concentrations obtained in the different treatments (Tukey’s test, p > 0.05). (Table 4B). Comparing the results of the foliar concentrations of N, P, and K with the reference values for eucalyptus trees, up to 4 years old [24], it is possible to observe that, at the end of the 9-month trial, the foliar N concentration could be considered typical of plants with very low (<1.2%) to low N levels (1.2–1.6%), meaning a limiting level of N for plant growth. The foliar P concentrations were also indicative of limiting growth conditions, ranging from low levels (0.5–1.0 mg kg−1) to medium levels (1.0–1.5 mg kg−1), while for K, the foliar concentrations were indicative of adequate growth conditions, with K in the medium concentration range (5.0–7.0 mg kg−1) [24].
In the case of foliar Ca and Mg concentrations, a three-way interaction was found between the three studied factors (Table 4A). The highest foliar Ca concentration was found in Gi-inoculated plants at 70% of the P fertilizer dose, while the lowest ones were found in plants inoculated with both Gi and Pp at the 70 and 40% P fertilizer doses (Table 4B). In these treatments, foliar Ca concentration could be considered medium (3–6 mg kg−1), whereas in all the other treatments Ca foliar concentrations were in the high concentration range (6–12 mg kg−1).
Sulfur foliar concentration was influenced by all three factors: inoculation with Gi and Pp, as well as the dose of P fertilizer (Table 4A). Inoculation with either Gi or Pp resulted in a reduction in leaf S concentration, but without significant differences between the means (Tukey’s test, p > 0.05). Additionally, a decreasing trend in S foliar concentration was observed as the P fertilizer dose was reduced (Table 4B), but only the control group presented statistical differences between the higher and the lower P-fertilizer dose.
Analysis of foliar micronutrient concentrations revealed a significant effect of Pp inoculation on Cu and B levels (Table 5A). In both cases, bacterial inoculation resulted in a decrease in those micronutrient concentrations, comparing Ctrl with Pp-inoculated plants, but differences between the means were not significant (Table 5B). Copper was also affected by Gi inoculation, which led to a decrease in its foliar concentrations, comparing Ctrl with Gi-inoculated plants, but differences between the means were still not significant.
On the other hand, significant interactions between Gi and Pp inoculations were found in Fe and Mn foliar concentrations. In both cases, plants inoculated with Pp and Gi showed a decrease in Fe and Mn concentrations, relatively to the non-inoculated Ctrl plants. Conversely, in plants not inoculated with Pp, Gi inoculation resulted in increased concentrations of Fe and Mn. Foliar Zn concentration, however, was unaffected by any of the treatments or their interactions.
Considering Fe, Zn, Mn, and B foliar concentrations, and comparing their results with the reference values for eucalyptus trees, up to 4 years old [24], it is possible to observe that their concentrations could be considered typical of plants with high foliar concentrations for those micronutrients (concentrations in the ranges 50–100, 12–24, 200–400, and 40–80 mg kg−1, for Fe, Zn, Mn, and B, respectively), even surpassing those ranges in some cases, towards excessive levels. Only Cu foliar concentrations were in the medium range, indicative of adequate growth conditions (2–10 mg kg−1) [24].

3.4. Effects of the Treatments on Soil Physicochemical Properties

Fertilizer dose showed a significant interaction with both Gi and Pp in soil pH (Table 6A). The pH of the soil was acidic to slightly acidic, averaging around 5 (Table 6B), which corresponds to the lower limit for the optimum soil pH value for eucalyptus production [24]. Soil N concentration, OM and EC showed a significant interaction between Gi and Pp inoculations, and additionally, OM was influenced by the fertilizer dose. However, the mean pairwise analysis indicated that differences in OM content among treatments were not significant (Tukey’s test, p > 0.05). Interestingly, extractable B concentrations also followed the same trend concerning the main factor’s influence and interaction, with significant differences only between Pp40 treatment (the lower Bext concentration) and GiPp100 (the higher Bext concentration) (Tukey’s test, p < 0.05) (Table 7A,B).
Soil extractable P concentration (Pext) showed a significant interaction between Gi and P fertilizer doses (Table 6A): while in the Gi-inoculated plants a significant decrease was found in Pext concentration as P fertilizer dose decreased, in plants non-inoculated with Gi, this decrease was not that obvious.
Soil analyses at the end of the experiment confirmed that Pext concentrations in the 100% and 70% P-fertilizer treatments remained in the range for soils with medium fertility level (51–100 mg/kg P2O5) to high fertility level (101–200 mg/kg P2O5) (Table 6B) [21]. In the lowest P-fertilizer treatment (40% of the reference dose), Pext concentrations in soils at the end of the experiment were lower, in the range for low fertility soil level (26–50 mg/kg P2O5) and even significantly lower in the case of Gi inoculation, in the absence of phosphate solubilizing bacteria inoculation (Gi40) (<25 mg/kg P2O5).
Soil Kext concentrations in the soil were significantly affected by Gi inoculation (Table 6A), but their mean values in the different treatments were not significantly different (Tukey’s test, p > 0.05) (Table 6B). Considering Kext concentrations in soils, all treatments presented concentrations typical of soils with a very low fertility level (<25 mg/kg K2O) [21].
In the same way as for soil Kext concentration, Feext concentrations were also significantly affected by Gi inoculation (7A), and for Mnext concentration, there was a significant interaction between Gi inoculation and Pp inoculation, and between Gi inoculation and the P-fertilizer dose. However, mean values for Feext, and Mnext concentration in soil in the different treatments were also not significantly different (Tukey’s test, p > 0.05) (Table 7B). Soil-extractable Zn and Cu concentrations were not affected by any of the factors studied.

4. Discussion

4.1. Biomass and Nutrients Concentrations in Plant and Soil

Given the initial low-P availability in the soil (characteristic of a soil with low fertility level), it is reasonable to infer that P was a limiting factor, and that reducing P fertilizer doses would constrain biomass accumulation in the aerial parts of the plant. Different P fertilizer doses had, in fact, a significant effect on leaf, branch, and total dry aerial biomass, which was translated into a lower overall aboveground biomass as P fertilizer dose decreased. This outcome is consistent with the well-established role of P as an essential macronutrient for plant growth, particularly in fast-growing species such as eucalyptus [13].
Nevertheless, despite the direct proportionality between the fertilizer dose and the total dry aerial biomass, no significant differences were observed between treatments at the end of the experiment, except for the plants inoculated with Pseudomonas, in which significantly higher biomass was recorded at the highest fertilizer dose—Pp100 (the highest-yielding treatment)—than at the lowest P dose—Pp40. Bulgarelli et al. [13] also observed that reducing P fertilization in eucalyptus did not affect growth, either in terms of aboveground biomass production or leaf P concentration. They even considered E. globulus as a non-responsive species to low-P availability, having a high agronomic P-use efficiency. On the contrary, Bichara et al. [25] reported that, while under adequate P availability E. globulus is among the species with the highest aboveground biomass production, when grown under lower P concentrations, it accumulates substantially less aboveground biomass (approximately 40% reduction). Although in this study a significant biomass reduction, of about 20%, was observed between Pp100 and Pp40 treatments, it remains well below the 40% reported by Bichara et al. [25], and the biomass registered in Pp40 treatment was not different from that registered in the control treatments (Ctrl100, Ctrl 70 and Ctrl 40).
Even though foliar P concentration, on its own, cannot constitute a reliable indicator of eucalyptus response to P inputs [13], it showed a similar pattern of variation, and a significant interaction with the fertilizer dose factor (p ≤ 0.05). Therefore, although no significant differences were observed among the means for foliar P concentration, it cannot be concluded that the reduction in P fertilization or the inoculation with AMF and PGPB had no influence on foliar P concentration. These results disagree with the findings of Arriagada et al. [26], who reported significant increases in N, P, and K concentrations in E. globulus tissues in the presence of AMF (Glomus deserticola) under P-limited conditions.
Moreover, the foliar P-concentrations were relatively low, according to the scale proposed by Ferreira & Morais [24], ranging between low (0.5–1.0 mg kg−1) to medium levels (1.0–1.5 mg kg−1), indicative of limiting growth conditions. This result may be associated with the reallocation of this nutrient to younger, more metabolically active tissues, as described by Saur, Nambiar & Fife [27] and Silva et al. [28]. The possibility that this redistribution occurred toward stems or branches cannot be excluded; however, because these plant components were not analyzed, this hypothesis cannot be confirmed.
As for extractable soil P, the response to the treatments was different: the highest extractable soil P values were observed in the treatments receiving biofertilizers, either individually or in combination. The significant interaction between AMF and fertilizer dose resulted in plants inoculated with G. iranicum under high P availability—Gi100 and GiPp100—showing significantly higher values than those under lower P availability—Gi40 and GiPp40. In fact, the higher soil extractable P concentrations were recorded in the GiPp treatment at 100% P dose, while in the control treatment with the same dose, the concentration was significantly lower. This suggests that AMF inoculation may have had a beneficial effect on P availability and uptake, consistent with findings reported by other authors [29,30], despite the lack of a significantly greater growth response associated with biofertilizer application. The mechanisms underlying this could not be verified in this study, although one possible explanation is the secretion of acid phosphatase by AMF hyphae, which can hydrolyze organic P compounds, thus increasing P availability to the plant [31].
Thus, the lack of biomass response to different P inputs may indicate that, under the conditions of this study, the maximum growth potential of the plants was achieved even under reduced P availability. Alternatively, it may reflect a limited capacity of the plants to respond to increased P availability, with no additional growth observed, at least within the duration of the experiment (9 months). It should also be considered that other nutrients may have been limiting plant response to the increase in P availability. The most valid hypothesis is N deficiency, since foliar N concentration at the end of the experiment was typical of plants with very low (<1.2%) to low N levels (1.2–1.6%), while foliar P concentrations, although also indicative of limiting growth conditions, were all ~1 mg kg−1, which is considered a low-to-medium P level [24].
On the other hand, foliar concentrations for all other nutrients, namely K, Ca, Mg, Fe, Cu, Zn, Mn, and B, were within medium-to-high concentration ranges, indicative of adequate growth conditions [24]. As for micronutrients (Fe, Cu, Zn, and Mn), soil acid pH may have helped to increase their extractability in the soil, enhancing availability even in low fertility soils [21]. However, extractable concentrations for K, Fe, Cu, Zn, Mn, and B in soil, in the different treatments, were not significantly different, which hinders a deeper analysis about how they might be affected by the different P fertilizer doses and biofertilizers application.

4.2. Vegetation Indices and Phisiologival Responses to the Treatments

Vegetation indices are indirect indicators of plant vigor and health [32], providing information on photosynthetic activity, photosynthetic pigments, and plant water status. As they are associated with changes in the absorption and reflectance of incident radiation, they are particularly sensitive to seasonal variations, such as those recorded throughout this experiment, especially at the beginning of the summer period. These indices are often determined at forest scale, using remote sensors, which makes a direct comparison with the results obtained in this study difficult. Nevertheless, NDVI is widely used in the assessment of vegetative vigor, and, in the specific case of eucalyptus, an exponential increase in this index is expected during the first two years after planting, ranging from 0.450 to 0.800, which is typical of eucalyptus plantation under optimal water and nutrient availability conditions [33]. In this experiment, this trend was not observed, as values ranged between 0.350 and 0.500, and this was, in fact, the index with the smallest differences among treatments.
Photochemical reflectance index, on the other hand, is a much more sensitive index to general stress conditions in plants, being directly related to the xanthophyll cycle. Few studies have applied this index at leaf scale in eucalyptus because, unlike other indices, PRI value (ranging in the interval −1 to +1) is interpreted primarily in terms of its trend, rather than its absolute value. That is, when light use efficiency is high, an increase in PRI is expected, whereas under stress conditions energy dissipation through non-photochemical pathways occurs and PRI decreases [34]. This dynamic partly explains the greater variation observed on PRI values among treatments, compared with NDVI.
Relative chlorophyll index is commonly used as an estimate of leaf chlorophyll content, with higher RCI values generally associated with greater photosynthetic capacity [35]. In this study, this was the only parameter to respond individually to the inoculation with Gi and Pp, with inoculated groups showing higher RCI values than the control group at an early stage of the experiment, suggesting that beneficial microorganisms may have effectively increased soil P availability and, consequently, chlorophyll content. However, RCI values were comparatively lower than those reported by Pinkard, Patel & Mohammed [36], who recorded RCI values around 40 relative units for E. globulus plants of approximately two years old, with predominantly juvenile foliage. Although potted plants tend, by themselves, to present lower RCI values than field-established plants, the values were considerably lower than expected. Additionally, symbiotic associations, particularly with AMF, impose a metabolic cost to the plant at this early stage of development, with approximately 10 to 20% of photosynthetic assimilates being allocated to the formation and maintenance of these symbiotic structures [37,38].
Overall, the various vegetation indices, RCI, NDVI, and PRI, did not show statistically significant differences among treatments in the final week of measurements, indicating that plants with lower mineral P availability were able to adjust their physiological response without evidence of additional negative impacts on photosynthetic activity and relative chlorophyll content, performing similarly to plants with higher P availability via fertilization.
Stomatal conductance is a more informative parameter regarding the water status of eucalyptus plants. At this active growth stage and without imposed stress, values around 300 mmol m−2 s−1 would be expected [39], as observed until the middle of the experiment, indicating that plants were under adequate water conditions. However, temporary increases in gs were observed in two specific periods, both coincident with a decline in vegetation index values, following high temperature days (May and August measurements). These peaks reflect a transient stomatal opening response, aimed at increasing transpiration rates, a mechanism used to cool leaves under high temperatures [40]. A different behavior was observed later, driven by a heatwave that began in September and extended into the first weeks of October. It is well established that water stress conditions lead to a reduction in gs and, more generally, in plant gas exchange, which was also observed in this experiment; in the final weeks, gs values approached zero, consistent with a response to water stress, as previously reported by Correia et al. [41] and García et al. [39].
Stomatal conductance was the only parameter that exhibited treatment-associated variation at the end of the experiment, particularly in response to Pp-inoculation, fertilizer dose, and their interaction. Phosphorus is a key element in regulating plant physiological responses and enhancing tolerance to abiotic stress factors, such as heat and drought. According to Khan et al. [42], under P deficiency conditions, a reduction in stomatal opening is observed, impacting gs. This explains the differences in gs values in the control group, with significantly higher gs values for Ctrl100, with higher P availability, than for Ctrl40, which responded to the P-deficiency stress closing the stomata and reducing plant’s gas exchange processes. In the treatments with Pp inoculation, the reduction in gs with decreasing P-fertilizer dose was less pronounced, suggesting that the phosphate-solubilizing bacteria may have helped plants coping with P-deficiency stress by improving their ability to regulate stomatal opening. It is possible that these plants do not experience P limitation stress because the inoculated bacteria provide an adequate supply of P, thereby mitigating the nutrient deficiency. Among other advantages, the literature identifies PGPB as organisms capable of influencing physiological processes, including stomatal regulation. Under stress conditions, they may induce changes in stomatal behavior, notably promoting stomatal closure as a mechanism for water conservation and enhanced drought tolerance [43,44]. This may have contributed to the gs values observed in the final week of the experiment, where the control group exhibited higher values than individually inoculated treatments, particularly those with Pseudomonas.
Throughout most of the experiment, measurements of these parameters were taken on juvenile leaves, which transitioned to adult leaves toward the end of the experiment. Younger leaves are characterized by a whitish wax layer on their surface, which provides substantial protection against biotic and abiotic factors. However, as this also increases light reflectance, its potential influence on the obtained values cannot be excluded, as described by Huggins et al. [45].
In summary, for the vegetation indices and physiological parameters, variations were mainly associated with weather conditions, which changed during the experiment, frequently overriding the direct effects of treatments, and consistently exhibited parallel temporal patterns. For instance, the sharp decline on RCI and PRI and increase on gs observed around week 22 coincides with a period of increased heat and drought, highlighting that environmental conditions played a central role in modulating plant physiological responses.

4.3. E. globulus Mycorrhizal Colonization

One of the main findings of this experiment was the detection of mycorrhizal colonization across all groups, including the non-inoculated control, indicating the presence of a functional native mycorrhizal community in the soil (a natural soil). Colonization was particularly high in non-inoculated plants under low P availability. Although AMF can enhance the uptake of available inorganic P through their extraradical hyphae, expanding the uptake area in the soil [46], in this study it was not possible to determine whether inoculation with G. iranicum by itself enhanced P uptake, since all plants presented mycorrhizal colonization and a non-mycorrhizal control was not used for comparison. Interestingly, the colonization percentage was higher in non-inoculated plants, especially when P availability was reduced to 40%. The higher colonization observed under reduced P availability suggests that plants increased their reliance on symbiotic associations under nutrient stress, aligned with previous findings by other authors, highlighting the role of AMF in improving P acquisition in eucalyptus [26,29,47]. On the other hand, the higher colonization percentage in non-inoculated plants may indicate that eucalyptus trees probably have a greater affinity for native AMF in the soil to fulfill the function of absorbing this nutrient. In fact, some authors demonstrate that native strains from both AMF and PGPB are better adapted to the soil and environmental conditions of the site and are more competitive and effective than non-native strains [48,49].
While competition between native and introduced fungi may limit inoculation success, interactions are not necessarily antagonistic. Previous studies have shown that introduced AMF can act synergistically with native communities to enhance plant performance under nutrient-limited conditions [50]. Moreover, increasing evidence supports the use of multispecies inoculum, which tends to provide more consistent benefits than single-species applications, due to functional complementarity [51,52]. It is also important to consider that factors such as land-use history, previously established plant species, and edaphoclimatic conditions can strongly influence the composition and functioning of these communities, thereby affecting inoculation success.
Although it was not possible to directly quantify the success of inoculation with PGPB, it is reasonable to assume that they influenced the mycorrhizal colonization results, given the significant effects detected of Pp inoculation on mycorrhizal colonization. However, although positive outcomes have been reported—such as those by Adesemoye, Torbert & Kloepper [53], who demonstrated increased nutrient-use efficiency from mineral sources under co-inoculation, allowing up to a 30% reduction in recommended fertilizer doses, and by Suri et al. [54]), who reported the possibility of a 15% reduction—the results of the present study do not fully support this trend. In fact, no significant differences in productivity were observed between the control and inoculated groups, nor were productivity gains detected from the combined application of these microorganisms, compared to individual inoculations.
Garbaye [55] explained that the establishment of mycorrhizal symbiosis on plant roots is influenced by other rhizosphere microorganisms, particularly bacteria—creating the concept of “AMF-helper bacteria”—which are not specific to plant hosts but show strong selectivity toward the fungal species they interact with. Although a significant interaction between Pseudomonas and G. iranicum was identified in terms of mycorrhizal colonization, this did not result in an increased colonization percentage, as might be expected based on the mechanisms described in the literature [55,56]. This suggests that such organisms may have acted independently, which is consistent with the absence of interaction effects on plant growth parameters.
It should also be noted that the activity of PGPB regarding P-solubilization is constrained by the amount of mobilizable P existent in the system. In this experimental context, which represents a closed system, the P available pool was limited and soil dynamics were restricted, thereby reducing the expression of bacterial effects. Under these conditions, PGPB may have played a role more closely associated with mitigating water stress, more evident at the end of the experiment, whereas AMF—whether native or introduced—were more influent in P availability and acquisition, as suggested by the significant effect of this factor on extractable soil P. Therefore, the limited evidence of PGPB effects does not necessarily imply lower efficiency, but rather reflects constraints imposed by the experimental conditions.

5. Conclusions

This study demonstrates that reducing P fertilization did not substantially reduce eucalyptus productivity under the conditions tested, even in low-P availability in soil. This showed the resilience of eucalyptus to moderate P limitation, likely supported by rhizosphere microbial interactions.
Biofertilizer application increased soil P availability, indicating improved P mobilization and nutrient-use efficiency. Interactions between AMF and PGPB contributed to maintaining plant performance under reduced fertilizer inputs.
Plants maintained similar photosynthetic performance, despite lower P availability, suggesting physiological acclimation. Inoculation influenced stomatal conductance regulation, potentially improving stress responses under nutrient limitation.
Mycorrhizal colonization occurred even in non-inoculated plants, highlighting the importance of native AMF communities. Results suggest that these native soil microorganisms likely play an important role in plant nutrition, especially under low P conditions.
Overall, these findings highlight the potential of biofertilizers to enhance nutrient availability and support plant performance under reduced fertilization regimes.
Future research should focus on long-term field studies and characterization of native AMF communities, to better understand their ecological and agronomical roles.

Author Contributions

Conceptualization, P.A., M.G.E., H.R., A.N., J.R. and M.M.; methodology, P.A., M.G.E., H.R. and A.N.; validation, P.A., M.G.E., H.R. and A.N.; formal analysis, P.A., M.G.E. and A.N.; investigation, P.A., M.G.E., H.R., M.B. and A.N.; resources, P.A., M.G.E., H.R., M.M. and J.R.; writing—original draft preparation, M.B. and P.A.; writing—review and editing, P.A., M.G.E., H.R. and A.N.; visualization, M.B. and P.A.; supervision, P.A., M.G.E., H.R. and A.N.; project administration, P.A. and M.M.; funding acquisition, P.A. and M.M. All authors have read and agreed to the published version of the manuscript.

Funding

This research was funded by IAPMEI/PRR/Notice 02/C05-i01/2022—Mobilizing Agendas for Business Innovation, project PI.3.6—“BIOMA SOLO: Improving the Soil-Plant Relationship” program.

Data Availability Statement

The original contributions presented in this study are included in the article. Further inquiries can be directed to the corresponding author.

Acknowledgments

We would like to thank the project partners for their support: Hubel Verde for supplying biofertilizers; Viveiros Aliança for supplying eucalyptus clones; and The Navigator Company for providing inorganic fertilizer and technical advice.

Conflicts of Interest

Paula Alvarenga, Margarida Braguês, Amaia Nogales, Henrique Ribeiro and M. Glória Esquível certify that they have NO conflicts of interest to declare. José Rafael is employed by the company “The Navigator Company (Portugal)” and Margarida Mota is employed by the company “Hubel Verde SA”. “The Navigator Company” provided eucalyptus clones and inorganic fertilizer to be used in the experiments, while “Hubel Verde SA” was responsible for supplying commercial biofertilizers. The remaining authors declare that the research was conducted in the absence of any commercial or financial relationships that could be construed as a potential conflict of interest. The funders had no role in the design of the study; in the collection, analyses, or interpretation of data; in the writing of the manuscript; or in the decision to publish the results.

References

  1. Muhammad, M.; Wahab, A.; Waheed, A.; Hakeem, K.R.; Mohamed, H.I.; Basit, A.; Toor, M.D.; Liu, Y.-H.; Li, L.; Li, W.-J. Navigating Climate Change: Exploring the dynamics between plant–soil microbiomes and their impact on plant growth and productivity. Glob. Change Biol. 2025, 31, e70057. [Google Scholar] [CrossRef] [Scilit]
  2. Smith, S.E.; Read, D.J. Mycorrhizal Symbiosis, 3rd ed.; Academic Press: London, UK, 2008. [Google Scholar]
  3. Backer, R.; Rokem, J.S.; Ilangumaran, G.; Lamont, J.; Praslickova, D.; Ricci, E.; Subramanian, S.; Smith, D.L. Plant growth-promoting rhizobacteria: Context, mechanisms of action, and roadmap to commercialization of biostimulants for sustainable agriculture. Front. Plant Sci. 2018, 9, 1473. [Google Scholar] [CrossRef] [Scilit] [PubMed]
  4. Ribeiro, H. Biofertilizantes. O que são e que benefícios têm para a agricultura? Rev. Assoc. Port. Hortic. 2021, 145, 26–27. [Google Scholar]
  5. Presidência do Conselho de Ministros. Decreto-Lei No. 30/2022, de 11 de Abril, Estabelece as Regras a Que Deve Obedecer a Colocação no Mercado de Matérias Fertilizantes. Diário da República, 1.ª Série—No.71—11 de Abril de 2022; Presidência do Conselho de Ministros: Lisbon, Portugal, 2022; pp. 2–22. [Google Scholar]
  6. Ministérios da Economia e Mar, Ambiente e Ação Climática e Agricultura e Alimentação. Portaria No. 185/2022, de 21 de Julho, Aprova os Tipos de Matérias Fertilizantes não Harmonizadas. Diário da República, 1.ª Série—No.140—21 de Julho de 2022; Ministérios da Economia e Mar, Ambiente e Ação Climática e Agricultura e Alimentação: Lisbon, Portugal, 2022; pp. 5–44. [Google Scholar]
  7. Regulation (EU) 2019/1009 of the European Parliament and of the Council of 5 June 2019 Laying Down Rules on the Making Available on the Market of EU Fertilising Products and Amending Regulations (EC) No 1069/2009 and (EC) No 1107/2009 and Repealing Regulation (EC) No 2003/2003. Available online: https://eur-lex.europa.eu/eli/reg/2019/1009/oj (accessed on 16 December 2024).
  8. Reboredo, F.; Pais, J. Evolution of forest cover in Portugal: A review of the 12th–20th centuries. J. For. Res. 2014, 25, 249–256. [Google Scholar] [CrossRef] [Scilit]
  9. Malico, I.; Gonçalves, A.C. Eucalyptus globulus Coppices in Portugal: Influence of Site and Percentage of Residues Collected for Energy. Sustainability 2021, 13, 5775. [Google Scholar] [CrossRef] [Scilit]
  10. ICNF. 6° Inventário Florestal Nacional—Relatório Final; Instituto da Conservação da Natureza e das Florestas: Lisbon, Portugal, 2019. [Google Scholar]
  11. Reboredo, F.H.; Pelica, J.; Lidon, F.C.; Pessoa, M.F.; Silva, M.M.; Guerra, M.; Leitão, R.; Ramalho, J.C. The tolerance of Eucalyptus globulus to soil contamination with arsenic. Plants 2021, 10, 627. [Google Scholar] [CrossRef] [Scilit] [PubMed]
  12. Vance, C.P.; Uhde-Stone, C.; Allan, D.L. Phosphorus acquisition and use: Critical adaptations by plants for securing a non-renewable resource. New Phytol. 2003, 157, 423–447. [Google Scholar] [CrossRef] [Scilit] [PubMed]
  13. Bulgarelli, R.G.; de Oliveira Silva, F.M.; Bichara, S.; Andrade, S.A.L.; Mazzafera, P. Eucalypts and low phosphorus availability: Between responsiveness and efficiency. Plant Soil 2019, 445, 349–368. [Google Scholar] [CrossRef] [Scilit]
  14. Bahar, N.H.A.; Gauthier, P.P.G.; O’Sullivan, O.S.; Brereton, T.; Evans, J.R.; Atkin, O.K. Phosphorus deficiency alters scaling relationships between leaf gas exchange and associated traits in a wide range of contrasting Eucalyptus species. Funct. Plant Biol. 2018, 45, 813–826. [Google Scholar] [CrossRef] [Scilit] [PubMed]
  15. Neumann, G. The role of ethylene in plant adaptations for phosphate acquisition in soils—A Review. Front. Plant Sci. 2016, 6, 1224. [Google Scholar] [CrossRef] [Scilit] [PubMed]
  16. Chowdhury, R.B.; Moore, G.A.; Weatherley, A.J.; Arora, M. Key sustainability challenges for the global phosphorus resource, their implications for global food security, and options for mitigation. J. Clean. Prod. 2017, 140, 945–963. [Google Scholar] [CrossRef] [Scilit]
  17. O’Callaghan, M.; Ballard, R.A.; Wright, D. Soil microbial inoculants for sustainable agriculture: Limitations and opportunities. Soil Use Manag. 2022, 38, 1340–1369. [Google Scholar] [CrossRef] [Scilit]
  18. Tomé, M.; Almeida, M.H.; Barreiro, S.; Branco, M.R.; Deus, E.; Pinto, G.; Silva, J.S.; Soares, P.; Rodríguez-Soalleiro, R. Opportunities and challenges of Eucalyptus plantations in Europe: The Iberian Peninsula experience. Eur. J. For. Res. 2021, 140, 489–510. [Google Scholar] [CrossRef] [Scilit]
  19. EN 13650:2001; Soil Improvers and Growing Media—Extraction of Aqua Regia Soluble Elements. European Committee for Standardization (CEN): Brussels, Belgium, 2001.
  20. Riehm, H. Die Ammoniumlaktatessigsaure-Methode Zur Bestimmung Der Leichtloeslichen Phosphosaure in Karbonathaltigen Boden. Agrochimica 1958, 3, 49–65. [Google Scholar]
  21. Veloso, A.; Sempiterno, C.; Calouro, F.; Rebelo, F.; Pedra, F.; Castro, I.; Gonçalves, M.C.; Marcelo, M.E.; Pereira, P.; Fareleira, P.; et al. Manual de Fertilização das Culturas, 3rd ed.; Instituto Nacional de Investigação Agrária e Veterinária—INIAV: Oeiras, Portugal, 2022; ISBN 978-972-579-063-2. (In Portuguese) [Google Scholar]
  22. Phillips, J.M.; Hayman, D.S. Improved procedures for clearing roots and staining parasitic and vesicular-arbuscular mycorrhizal fungi for rapid assessment of infection. Trans. Br. Mycol. Soc. 1970, 55, 158–161, IN16–IN18. [Google Scholar] [CrossRef] [Scilit]
  23. Giovannetti, M.; Mosse, B. An evaluation of techniques for measuring vesicular arbuscular Mycorrhizal infection in roots. New Phytol. 1980, 84, 489–500. [Google Scholar] [CrossRef] [Scilit]
  24. Ferreira, D.; Morais, S. Nutrição do Eucalipto. Manual de Apoio à Gestão Nutricional; RAIZ: São Paulo, Brazil, 2021; 114p. (In Portuguese) [Google Scholar]
  25. Bichara, S.; Mazzafera, P.; de Andrade, S.A.L. Root morphological changes in response to low phosphorus concentration in eucalypt species. Trees 2021, 35, 1933–1943. [Google Scholar] [CrossRef] [Scilit]
  26. Arriagada, C.; Sampedro, I.; Garcia-Romera, I.; Ocampo, J. Improvement of growth of Eucalyptus globulus and soil biological parameters by amendment with sewage sludge and inoculation with arbuscular mycorrhizal and saprobe fungi. Sci. Total Environ. 2009, 407, 4799–4806. [Google Scholar] [CrossRef] [Scilit] [PubMed]
  27. Saur, E.; Nambiar, E.K.S.; Fife, D.N. Foliar nutrient retranslocation in Eucalyptus globulus. Tree Physiol. 2000, 20, 1105–1112. [Google Scholar] [CrossRef] [Scilit] [PubMed]
  28. Silva, F.M.O.; Bulgarelli, R.G.; Mubeen, U.; Caldana, C.; Andrade, S.A.L.; Mazzafera, P. Low phosphorus induces differential metabolic responses in eucalyptus species improving nutrient use efficiency. Front. Plant Sci. 2022, 13, 989827. [Google Scholar] [CrossRef] [Scilit] [PubMed]
  29. Berbara, R.; Adriano De Souza, F.; Fonseca, H. III-Fungos micorrízicos arbusculares: Muito além da nutrição. In Nutrição Mineral de Plantas; Fernandes, M.S., Ed.; SBCS: Viçosa, Brazil, 2006; pp. 54–79. [Google Scholar]
  30. Sangwan, S.; Prasanna, R. Mycorrhizae helper bacteria: Unlocking their potential as bioenhancers of plant–arbuscular mycorrhizal fungal associations. Microb. Ecol. 2021, 84, 1–10. [Google Scholar] [CrossRef] [Scilit] [PubMed]
  31. Sato, T.; Hachiya, S.; Inamura, N.; Ezawa, T.; Cheng, W.; Tawaraya, K. Secretion of acid phosphatase from extraradical hyphae of the arbuscular mycorrhizal fungus Rhizophagus clarus is regulated in response to phosphate availability. Mycorrhiza 2019, 29, 599–605. [Google Scholar] [CrossRef] [Scilit] [PubMed]
  32. Vélez, S.; Martínez-Peña, R.; Castrillo, D. Beyond Vegetation: A Review Unveiling Additional Insights into Agriculture and Forestry through the Application of Vegetation Indices. J 2023, 6, 421–436. [Google Scholar] [CrossRef] [Scilit]
  33. le Maire, G.; Marsden, C.; Nouvellon, Y.; Grinand, C.; Hakamada, R.; Stape, J.L.; Laclau, J.P. MODIS NDVI time-series allow the monitoring of Eucalyptus plantation biomass. Remote Sens. Environ. 2011, 115, 2613–2625. [Google Scholar] [CrossRef] [Scilit]
  34. Zhang, C.; Filella, I.; Liu, D.; Ogaya, R.; Llusià, J.; Asensio, D.; Peñuelas, J. Photochemical Reflectance Index (PRI) for detecting responses of diurnal and seasonal photosynthetic activity to experimental drought and warming in a Mediterranean shrubland. Remote Sens. 2017, 9, 1189. [Google Scholar] [CrossRef] [Scilit]
  35. Vishwakarma, M.; Kulhare, P.S.; Tagore, G.S. Estimation of Chlorophyll Using SPAD meter. Int. J. Environ. Clim. Change 2023, 13, 1901–1912. [Google Scholar] [CrossRef] [Scilit]
  36. Pinkard, E.A.; Patel, V.; Mohammed, C. Chlorophyll and nitrogen determination for plantation-grown Eucalyptus nitens and E. globulus using a non-destructive meter. For. Ecol. Manag. 2006, 223, 211–217. [Google Scholar]
  37. Jakobsen, I.; Rosendahl, L. Carbon flow into soil and external hyphae from roots of mycorrhizal cucumber plants. New Phytol. 1990, 115, 77–83. [Google Scholar] [CrossRef] [Scilit]
  38. Olsson, P.A.; Rahm, J.; Aliasgharzad, N. Carbon dynamics in mycorrhizal symbioses is linked to carbon costs and phosphorus benefits. FEMS Microbiol. Ecol. 2010, 72, 125–131. [Google Scholar] [CrossRef] [PubMed]
  39. García, L.Y.; Rubilar, R.; Valverde, J.C.; Emhart, V.; Bascuñán, L.; Medina, A.; Bozo, D. Morphological, physiological and carbon balance response of Eucalyptus genotypes under water stress. New For. 2024, 55, 441–457. [Google Scholar]
  40. Urban, J.; Ingwers, M.W.; McGuire, M.A.; Teskey, R.O. Increase in leaf temperature opens stomata and decouples net photosynthesis from stomatal conductance in Pinus taeda and Populus deltoides x nigra. J. Exp. Bot. 2017, 68, 1757–1767. [Google Scholar] [CrossRef] [Scilit] [PubMed]
  41. Correia, B.; Pintó-Marijuan, M.; Neves, L.; Brossa, R.; Dias, M.C.; Costa, A.; Castro, B.B.; Araújo, C.; Santos, C.; Chaves, M.M.; et al. Water stress and recovery in the performance of two Eucalyptus globulus clones: Physiological and biochemical profiles. Physiol. Plant. 2014, 150, 580–592. [Google Scholar] [PubMed]
  42. Khan, F.; Siddique, A.B.; Shabala, S.; Zhou, M.; Zhao, C. Phosphorus plays key roles in regulating plants’ physiological responses to abiotic stresses. Plants 2023, 12, 2861. [Google Scholar] [CrossRef] [Scilit] [PubMed]
  43. Vurukonda, S.S.K.P.; Vardharajula, S.; Shrivastava, M.; SkZ, A. Enhancement of drought stress tolerance in crops by plant growth promoting rhizobacteria. Microbiol. Res. 2016, 184, 13–24. [Google Scholar] [CrossRef] [Scilit] [PubMed]
  44. Savastano, N.; Bais, H. Synergism or antagonism: Do arbuscular mycorrhizal fungi and plant growth-promoting rhizobacteria work together to benefit plants? Int. J. Plant Biol. 2024, 15, 944–958. [Google Scholar] [CrossRef] [Scilit]
  45. Huggins, T.D.; Mohammed, S.; Sengodon, P.; Ibrahim, A.M.H.; Tilley, M.; Hays, D.B. Changes in leaf epicuticular wax load and its effect on leaf temperature and physiological traits in wheat cultivars (Triticum aestivum L.) exposed to high temperatures during anthesis. J. Agron. Crop Sci. 2018, 204, 49–61. [Google Scholar]
  46. Bhantana, P.; Rana, M.S.; Sun, X.C.; Moussa, M.G.; Saleem, M.H.; Syaifudin, M.; Shah, A.; Poudel, A.; Pun, A.B.; Bhat, M.A.; et al. Arbuscular mycorrhizal fungi and its major role in plant growth, zinc nutrition, phosphorous regulation and phytoremediation. Symbiosis 2021, 84, 19–37. [Google Scholar] [CrossRef] [Scilit]
  47. Arriagada, C.A.; Herrera, M.A.; Ocampo, J.A. Beneficial effect of saprobe and arbuscular mycorrhizal fungi on growth of Eucalyptus globulus co-cultured with Glycine max in soil contaminated with heavy metals. J. Environ. Manag. 2007, 84, 93–99. [Google Scholar] [CrossRef] [Scilit]
  48. Kizilkaya, R. Yield response and nitrogen concentrations of spring wheat (Triticum aestivum) inoculated with Azotobacter chroococcum strains. Ecol. Eng. 2008, 33, 150–156. [Google Scholar] [CrossRef] [Scilit]
  49. Efthimiadou, A.; Katsenios, N.; Chanioti, S.; Giannoglou, M.; Djordjevic, N.; Katsaros, G. Effect of foliar and soil application of plant growth promoting bacteria on growth, physiology, yield and seed quality of maize under Mediterranean conditions. Sci. Rep. 2020, 10, 21060. [Google Scholar] [CrossRef] [Scilit] [PubMed]
  50. Pessoa, A.; Antoniolii, Z.; Della-Justina, M.; Figueiredo, L. Fungos micorrízicos nativos e Glomus clarun no rendimento de trevo vesiculoso cultivado em condições naturais e modificadas pela calagem e aplicação de fósforo. Ciência Rural 1997, 27, 61–66. [Google Scholar] [CrossRef] [Scilit]
  51. Crossay, T.; Majorel, C.; Redecker, D.; Gensous, S.; Medevielle, V.; Durrieu, G.; Cavaloc, Y.; Amir, H. Is a mixture of arbuscular mycorrhizal fungi better for plant growth than single-species inoculants? Mycorrhiza 2019, 29, 325–339. [Google Scholar] [CrossRef] [Scilit] [PubMed]
  52. Godoy, R.; Acuña, L.; Silva-Flores, P.; Aguilera, P.; Marín, C. Native arbuscular mycorrhizal fungi improved Araucaria araucana growth over commercial inoculum under greenhouse and field conditions. J. Soil Sci. Plant Nutr. 2023, 23, 6459–6468. [Google Scholar] [CrossRef] [Scilit]
  53. Adesemoye, A.O.; Kloepper, J.W. Plant-microbes interactions in enhanced fertilizer-use efficiency. Appl. Microbiol. Biotechnol. 2009, 85, 1–12. [Google Scholar] [CrossRef] [Scilit] [PubMed]
  54. Suri, V.K.; Choudhary, A.K.; Chander, G.; Verma, T.S. Influence of vesicular-arbuscular mycorrhizal fungi and applied phosphorus on root colonization in wheat and plant nutrient dynamics in a phosphorus-deficient acid Alfisol of Western Himalayas. Soil Sci. Plant Anal. 2011, 42, 1177–1186. [Google Scholar] [CrossRef] [Scilit]
  55. Garbaye, J. Tansley Review No. 76 Helper bacteria—A new dimension to the mycorrhizal symbiosis. New Phytol. 1994, 128, 197–210. [Google Scholar] [CrossRef] [Scilit] [PubMed]
  56. Frey-Klett, P.; Garbaye, J.; Tarkka, M. The Mycorrhiza Helper Bacteria Revisited. New Phytol. 2007, 176, 22–36. [Google Scholar] [CrossRef] [Scilit] [PubMed]
Figure 1. Results obtained for the vegetation indices throughout 31 weeks of experiment: (a) relative chlorophyll index (RCI); (b) normalized difference vegetation index (NDVI); (c) photochemical reflectance index (PRI); and stomatal conductance (gs; in mmol m−2 s−1) (d). Ctrl: control; Gi: G. iranicum; Pp: Pseudomonas, GiPp: inoculation with G. iranicum and Pseudomonas.
Forests 17 00780 g001
Figure 2. Total dry biomass of the aboveground parts of eucalyptus (leaves, branches, and trunk) at the end of the trial (mean ± standard deviation, n = 4). Columns marked with the same letter (a, b, or c) are not significantly different (Tukey’s test, p > 0.05). Ctrl: control; Gi: G. iranicum; Pp: Pseudomonas; GiPp: inoculation with G. iranicum and Pseudomonas.
Forests 17 00780 g002
Figure 3. Arbuscular mycorrhizal structures (a) intraradical hyphae and spores observed under a stereomicroscope (Olympus, Shinjuku City, Tokyo, Japan; 40× amplification); (b) spores observed under a microscope (Leica DM500; 40× amplification); (c) arbuscules observed under a stereomicroscope (40× amplification).
Forests 17 00780 g003
Figure 4. Mycorrhizal colonization percentage in eucalyptus roots at the end of the trial (mean ± standard deviation, n = 4). Columns with the same letter are not significantly different (Tukey’s test, p > 0.05). Ctrl: control; Gi: G. iranicum; Pp: Pseudomonas; GiPp: inoculation with G. iranicum and Pseudomonas spp.
Forests 17 00780 g004
Table 1. F-statistics values of the Repeated Measures Analysis of Variance (rANOVA), for the effects of the fixed factors “Gi”, “Pp” and “Fertilizer”, and the repeated-measure factor “Time”, as well as their interactions, on eucalyptus physiological parameters.
Repeated Measures ANOVA (F Values)
Main Factors and
Interactions
RCINDVIPRIgs
(mmol m−2 s−1)
Gi13.24 ***0.04 ns0.23 ns0.27 ns
Pp12.14 **0.15 ns1.35 ns1.12 ns
Fertilizer1.88 ns0.06 ns0.96 ns0.30 ns
Gi × Pp0.46 ns1.32 ns0.02 ns0.07 ns
Gi × Fertilizer1.24 ns0.12 ns0.15 ns0.81 ns
Pp × Fertilizer3.98 *1.06 ns0.03 ns0.21 ns
Gi × Pp × Fertilizer1.27 ns5.67 **0.42 ns0.85 ns
Time161.16 ***178.23 ***35.98 ***93.17 ***
Time × Gi2.44 *0.72 ns0.73 ns0.66 ns
Time × Pp1.03 ns0.47 ns2.22 *0.88 ns
Time × Fertilizer2.10 **0.47 ns0.76 ns0.88 ns
Time × Gi × Pp0.90 ns0.84 ns1.78 ns0.30 ns
Time × Gi × Fertilizer0.51 ns1.11 ns1.00 ns0.80 ns
Time × Pp × Fertilizer0.87 ns0.42 ns0.31 ns0.78 ns
Time × Gi × Pp × Fertilizer1.59 ns1.45 ns0.31 ns1.03 ns
Gi: G. iranicum; Pp: Pseudomonas; RCI: relative chlorophyll index; NDVI: normalized difference vegetation index; PRI: photochemical reflectance index; gs: stomatal conductance; ns: not significant; *, **, ***: significant with p ≤ 0.05, p ≤ 0.01, and p ≤ 0.001, respectively. ×: represents the interaction among factors.
Table 2. (A) F-statistics of the factorial ANOVA analysis for the effects of the factors “Gi”, “Pp”, and “Fertilization”, as well as their interactions, on RCI, NDVI, PRI, and gs values; (B) RCI, NDVI, PRI, and gs values obtained with the different microbial inoculation and P-fertilization treatments (mean ± standard deviation, n = 4). Results in a column marked with the same letter (a, b, or c) are not significantly different (Tukey’s test, p > 0.05).
(A)RCINDVIPRIgs
(mmol m−2 s−1)
Main FactorsFactorial ANOVA (F Values)
Gi0.025 ns2.483 ns0.082 ns1.649 ns
Pp1.053 ns0.479 ns0.114 ns17.36 ***
Fertilization0.712 ns0.674 ns0.738 ns15.01 ***
Interactions
Gi × Pp0.428 ns0.994 ns2.167 ns0.747 ns
Gi × Fertilization0.606 ns1.590 ns1.190 ns0.050 ns
Pp × Fertilization0.283 ns0.204 ns0.247 ns7.060 **
Gi × Pp × Fertilization0.070 ns0.393 ns0.012 ns1.086 ns
(B)TreatmentP-Fertilizer
(%)
RCINDVIPRIgs
(mmol m−2 s−1)
Ctrl10012 ± 40.455 ± 0.0090.21 ± 0.0298 ± 66 a
7012 ± 30.461 ± 0.0080.20 ± 0.0357 ± 33 abc
4012 ± 30.462 ± 0.0070.21 ± 0.0318 ± 17 b
Gi10013 ± 30.458 ± 0.0260.21 ± 0.0585 ± 16 ab
7012 ± 30.453 ± 0.0200.23 ± 0.0227 ± 11 b
4013 ± 30.459 ± 0.0120.23 ± 0.0219 ± 10 b
Pp10013 ± 40.460 ± 0.0170.22 ± 0.0332 ± 11 bc
7014 ± 10.468 ± 0.0040.21 ± 0.0320 ± 11 b
4014 ± 30.471 ± 0.0140.23 ± 0.0221 ± 5 b
GiPp10012 ± 20.463 ± 0.0150.19 ± 0.0528 ± 8 b
7012 ± 10.443 ± 0.0080.21 ± 0.0328 ± 4 b
4015 ± 20.459 ± 0.0180.22 ± 0.0310 ± 5 b
Ctrl: control; Gi: G. iranicum; Pp: Pseudomonas; GiPp: inoculation with G. iranicum and Pseudomonas; RCI: relative chlorophyll index: NDVI: normalized difference vegetation index; PRI: photochemical reflectance index; gs: stomatal conductance; ns: not significant; **, ***: significant with p ≤ 0.01, and p ≤ 0.001, respectively. ×: represents the interaction among factors.
Table 3. F statistic value of the factorial ANOVA analysis for the effects of the factors “Gi”, “Pp” and “Fertilization”, as well as their interactions, on the dry biomass of eucalyptus plants at the end of the trial (leaves, branches, trunk, and total aboveground biomass) and on mycorrhizal colonization by AMF (n = 4).
Factorial ANOVA (F Values)
Origin of the VariationLeaf
Dry Biomass
Branch
Dry Biomass
Trunk
Dry Biomass
Total Dry Aerial
Biomass
Mycorrhizal
Colonization Percentage
Main factors
Gi0.068 ns0.272 ns1.187 ns1.43 ns1.765 ns
Pp1.134 ns0.208 ns0.777 ns2.60 ns4.661 *
Fertilizer4.718 *4.125 *2.886 ns12.82 ***3.744 *
Interactions
Gi × Pp2.936 ns0.307 ns2.476 ns0.07 ns4.661 *
Gi × Fertilizer1.665 ns0.726 ns0.261 ns1.80 ns1.481 ns
Pp × Fertilizer0.248 ns2.335 ns0.500 ns1.82 ns3.125 ns
Gi × Pp × Fertilizer1.986 ns0.557 ns2.816 ns2.70 ns2.122 ns
Ctrl: control; Gi: G. iranicum; Pp: Pseudomonas; ns: not significant; *, ***: significant with p ≤ 0.05 and p ≤ 0.001, respectively. ×: represents the interaction among factors.
Table 4. (A) F-statistics of the factorial ANOVA analysis for the effects of the factors “Gi”, “Pp”, and “Fertilization”, as well as their interactions, on foliar macronutrient concentrations (N, P, K, Ca, Mg and S); (B) N, P, K, Ca, Mg and S foliar concentrations values obtained with the different microbial inoculation and P-fertilization treatments (mean ± standard deviation, n = 4). Results in a column marked with the same letter (a, b, c, d, e, or f) are not significantly different (Tukey’s test, p > 0.05).
(A)N
(%)
P
(g kg−1)
K
(g kg−1)
Ca
(g kg−1)
Mg
(g kg−1)
S
(g kg−1)
Main FactorsFactorial ANOVA (F Values)
Gi0.28 ns0.01 ns2.60 ns7.91 **2.23 ns10.24 **
Pp0.53 ns4.02 ns20.12 ***89.36 ***48.83 ***20.76 ***
Fertilization0.36 ns4.95 *0.86 ns17.70 ***0.57 ns12.66 ***
Interactions
Gi × Pp3.67 ns1.25 ns0.83 ns21.14 ***27.78 ***0.77 ns
Gi × Fertilization1.16 ns1.27 ns0.85 ns1.59 ns1.41 ns0.84 ns
Pp × Fertilization1.25 ns0.96 ns0.53 ns6.07 **6.65 **1.69 ns
Gi × Pp × Fertilization0.24 ns0.81 ns1.86 ns5.87 **7.37 **2.52 ns
(B)TreatmentP-Fertilizer
(%)
N
(%)
P
(g kg−1)
K
(g kg−1)
Ca
(g kg−1)
Mg
(g kg−1)
S
(g kg−1)
Ctrl1001.12 ± 0.101.07 ± 0.126.4 ± 0.58.0 ± 0.6 ab2.28 ± 0.11 ab1.63 ± 0.08 a
701.10 ± 0.121.03 ± 0.166.2 ± 0.88.0 ± 0.5 abc2.32 ± 0.08 ab1.59 ± 0.09 ab
401.13 ± 0.020.89 ± 0.045.8 ± 0.37.0 ± 0.6 bcde2.25 ± 0.10 ab1.41 ± 0.02 bcd
Gi1001.14 ± 0.091.02 ± 0.105.8 ± 0.57.7 ± 0.8 abcd2.25 ± 0.15 ab1.48 ± 0.07 abc
701.22 ± 0.141.11 ± 0.106.3 ± 0.58.4 ± 0.4 a2.50 ± 0.15 a1.52 ± 0.06 abc
401.19 ± 0.050.99 ± 0.066.1 ± 0.47.6 ± 0.5 abcd2.51 ± 0.14 a1.46 ± 0.05 abcd
Pp1001.19 ± 0.091.05 ± 0.105.8 ± 0.77.4 ± 0.4 abcd2.26 ± 0.07 ab1.54 ± 0.07 abc
701.08 ± 0.090.93 ± 0.085.4 ± 0.46.6 ± 0.1 de2.15 ± 0.09 b1.43 ± 0.06 bcd
401.19 ± 0.060.94 ± 0.085.7 ± 0.46.7 ± 0.4 cde2.27 ± 0.10 ab1.40 ± 0.14 bcd
GiPp1001.14 ± 0.090.99 ± 0.145.4 ± 0.66.9 ± 0.6 bcde2.14 ± 0.13 b1.46 ± 0.05 abcd
701.11 ± 0.060.97 ± 0.145.4 ± 0.65.9 ± 0.6 e2.03 ± 0.18 bc1.36 ± 0.14 cd
401.09 ± 0.140.86 ± 0.084.8 ± 0.64.5 ± 0.4 f1.79 ± 0.12 c1.26 ± 0.07 d
Ctrl: control; Gi: G. iranicum; Pp: Pseudomonas; GiPp: inoculation with G. iranicum and Pseudomonas; ns: not significant; *, **, ***: significant with p ≤ 0.05, p ≤ 0.01, and p ≤ 0.001, respectively. ×: represents the interaction among factors.
Table 5. (A) F-statistics of the factorial ANOVA analysis for the effects of the factors “Gi”, “Pp”, and “Fertilization”, as well as their interactions, on foliar micronutrient concentrations (Fe, Cu, Zn, Mn, and B); (B) Fe, Cu, Zn, Mn, and B foliar concentrations values obtained with the different microbial inoculation and P-fertilization treatments (mean ± standard deviation, n = 4). Results in a column marked with the same letter (a, b, c, d, or e) are not significantly different (Tukey’s test, p > 0.05).
(A)Fe
(mg kg−1)
Cu
(mg kg−1)
Zn
(mg kg−1)
Mn
(mg kg−1)
B
(mg kg−1)
Main FactorsFactorial ANOVA (F Values)
Gi4.21 *8.79 **0.450.44 ns2.37ns
Pp4.77 *19.86 ***0.8025.57 ***13.33 ***
Fertilization2.23 ns2.68 ns2.9316.16 ***1.40 ns
Interactions
Gi × Pp18.76 ***2.28 ns0.5924.71 ***2.54 ns
Gi × Fertilization0.02 ns0.76 ns0.440.77 ns0.66 ns
Pp × Fertilization1.96 ns0.15 ns0.582.86 ns0.69 ns
Gi × Pp × Fertilization1.16 ns0.77 ns0.562.41 ns0.70 ns
(B)TreatmentP-Fertilizer
(%)
Fe
(mg kg−1)
Cu
(mg kg−1)
Zn
(mg kg−1)
Mn
(mg kg−1)
B
(mg kg−1)
Ctrl10082 ± 10 abc6.9 ± 0.2 ab18.6 ± 3.3661 ± 49 abc79 ± 14
7087 ± 12 abc7.2 ± 0.7 ab17.7 ± 3.8620 ± 35 abcd88 ± 7
4079 ± 8 abc7.6 ± 0.5 a15.5 ± 1.6533 ± 15 cde85 ± 5
Gi10094 ± 20 ab6.5 ± 1.1 ab19.7 ± 5.1680 ± 60 ab79 ± 6
7088 ± 6 abc5.9 ± 0.7 b18.8 ± 2.0707 ± 57 a85 ± 8
4097 ± 30 ab6.7 ± 0.9 ab17.8 ± 4.2632 ± 53 abcd88 ± 11
Pp100105 ± 23 a6.0 ± 0.6 ab18.1 ± 2.7668 ± 87 abc73 ± 8
7082 ± 7 abc5.7 ± 0.5 b16.8 ± 0.6562 ± 16 bcde79 ± 8
4090 ± 17 abc6.6 ± 0.6 ab16.4 ± 2.4580 ± 88 abcd83 ± 8
GiPp10077 ± 12 abc6.0 ± 0.6 b20.8 ± 5.2604 ± 42 abcd73 ± 7
7062 ± 7 bc5.7 ± 0.7 b14.7 ± 1.0510 ± 58 de67 ± 8
4055 ± 6 c5.8 ± 0.6 b15.5 ± 6.0428 ± 46 e69 ± 15
Ctrl: control; Gi: G. iranicum; Pp: Pseudomonas; GiPp: inoculation with G. iranicum and Pseudomonas; ns: not significant; *, **, ***: significant with p ≤ 0.05, p ≤ 0.01, and p ≤ 0.001, respectively. ×: represents the interaction among factors.
Table 6. (A) F-statistics of the factorial ANOVA analysis for the effects of the factors “Gi”, “Pp”, and “Fertilization”, as well as their interactions, on soil general physicochemical properties; (B) results for the soil general physicochemical properties obtained with the different microbial inoculation and P-fertilization treatments (mean ± standard deviation, n = 4). Results in a column marked with the same letter (a, b, c, d, or e) are not significantly different (Tukey’s test, p > 0.05).
(A)pHEC
(mS cm−1)
OM
(g kg−1)
Nmin
(mg kg−1)
Pext
(mg P2O5 kg−1)
Kext
(mg K2O kg−1)
Main FactorsFactorial ANOVA (F Values)
Gi16.36 ***0.13 ns3.20 ns1.89 ns7.84 **4.99 *
Pp6.96 *0.02 ns1.07 ns0.63 ns1.76 ns0.18 ns
Fertilization0.40 ns0.60 ns3.52 *2.43 ns47.60 ***0.52 ns
Interactions
Gi × Pp0.03 ns5.99 *5.37 *5.82 *0.80 ns2.33 ns
Gi × Fertilization5.23 *0.85 ns1.80 ns1.10 ns5.12 *0.32 ns
Pp × Fertilization3.62 *0.40 ns2.40 ns0.39 ns0.75 ns0.24 ns
Gi × Pp × Fertilization1.14 ns0.04 ns0.12 ns1.69 ns0.80 ns1.45 ns
(B)TreatmentP-Fertilizer
(%)
pHEC
(mS cm−1)
OM
(g kg−1)
Nmin
(mg kg−1)
Pext
(mg K2O kg−1)
Kext
(mg K2O kg−1)
Ctrl1004.90 ± 0.08 ab0.10 ± 0.023.9 ± 0.810.1 ± 0.570 ± 17 bcde18 ± 2
704.83 ± 0.10 b0.08 ± 0.023.4 ± 0.212.3 ± 5.262 ± 14 cde21 ± 5
404.90 ± 0.00 ab0.07 ± 0.013.5 ± 0.210.3 ± 0.938 ± 9 de19 ± 1
Gi1005.00 ± 0.12 ab0.07 ± 0.024.2 ± 0.813.8 ± 3.9115 ± 36 ab23 ± 8
704.98 ± 0.10 ab0.06 ± 0.034.3 ± 1.19.5 ± 5.267 ± 21 bcde19 ± 4
404.93 ± 0.05 ab0.07 ± 0.045.0 ± 0.26.0 ± 0.221 ± 4 e18 ± 2
Pp1004.83 ± 0.05 b0.07 ± 0.015.1 ± 0.510.7 ± 2.492 ± 22 abc19 ± 3
704.95 ± 0.10 ab0.06 ± 0.013.9 ± 0.68.0 ± 0.955 ± 15 cde17 ± 2
405.03 ± 0.10 ab0.06 ± 0.033.9 ± 0.88.7 ± 1.631 ± 8 de17 ± 2
GiPp1005.03 ± 0.05 ab0.08 ± 0.044.7 ± 1.014.1 ± 3.9127 ± 26 a22 ± 5
705.10 ± 0.08 a0.08 ± 0.033.6 ± 0.313.8 ± 5.577 ± 20 bcd23 ± 4
404.98 ± 0.10 ab0.09 ± 0.044.3 ± 1.212.0 ± 7.038 ± 25 de23 ± 7
Ctrl: control; Gi: G. iranicum; Pp: Pseudomonas; GiPp: inoculation with G. iranicum and Pseudomonas; ns: not significant; *, **, ***: significant with p ≤ 0.05, p ≤ 0.01, and p ≤ 0.001, respectively. ×: represents the interaction among factors.
Table 7. (A) F-statistics of the factorial ANOVA analysis for the effects of the factors “Gi”, “Pp”, and “Fertilization”, as well as their interactions, on extractable micronutrients concentrations in soil (Feext, Cuext, Znext, Mnext, and Bext); (B) extractable micronutrients concentrations in soil (Feext, Cuext, Znext, Mnext, and Bext) obtained with the different microbial inoculation and P-fertilization treatments (mean ± standard deviation, n = 4). Results in a column marked with the same letter (a or b) are not significantly different (Tukey’s test, p > 0.05).
(A)Feext
(mg kg−1)
Cuext
(mg kg−1)
Znext
(mg kg−1)
Mnext
(mg kg−1)
Bext
(mg kg−1)
Main FactorsFactorial ANOVA (F Values)
Gi4.32 *0.226 ns1.855 ns2.53 ns0.08 ns
Pp0.56 ns0.283 ns1.076 ns0.30 ns1.12 ns
Fertilization0.11 ns0.406 ns0.641 ns1.09 ns5.82 ***
Interactions
Gi × Pp1.62 ns0.003 ns1.120 ns4.89 *6.62 **
Gi × Fertilization1.82 ns 0.259 ns0.650 ns3.76 *1.14 ns
Pp × Fertilization0.77 ns1.191 ns0.767 ns0.56 ns0.95 nd
Gi × Pp × Fertilization0.23 ns0.426 ns0.928 ns0.81 ns0.43 ns
(B)TreatmentP-Fertilizer
(%)
Feext
(mg kg−1)
Cuext
(mg kg−1)
Znext
(mg kg−1)
Mnext
(mg kg−1)
Bext
(mg kg−1)
Ctrl1007.8 ± 0.20.177 ± 0.0110.19 ± 0.031.2 ± 0.30.24 ± 0.02 ab
707.8 ± 0.90.166 ± 0.0100.16 ± 0.041.2 ± 0.10.24 ± 0.08 ab
407.6 ± 0.50.169 ± 0.0080.23 ± 0.010.8 ± 0.20.22 ± 0.03 ab
Gi1007.4 ± 1.10.184 ± 0.0560.36 ± 0.161.1 ± 0.20.23 ± 0.02 ab
707.4 ± 0.90.171 ± 0.0180.17 ± 0.070.7 ± 0.40.21 ± 0.02 ab
407.9 ± 0.50.169 ± 0.0070.44 ± 0.381.3 ± 0.50.20 ± 0.02 ab
Pp1008.7 ± 0.50.179 ± 0.0110.15 ± 0.090.9 ± 0.10.22 ± 0.03 ab
708.2 ± 0.70.180 ± 0.0180.22 ± 0.060.9 ± 0.50.19 ± 0.01 ab
407.6 ± 0.60.166 ± 0.0110.23 ± 0.190.6 ± 0.20.19 ± 0.01 b
GiPp1007.3 ± 0.90.165 ± 0.0120.31 ± 0.121.3 ± 0.20.27 ± 0.03 a
707.6 ± 0.70.194 ± 0.0540.22 ± 0.041.1 ± 0.30.21 ± 0.01 ab
407.5 ± 0.90.175 ± 0.0160.35 ± 0.151.1 ± 0.50.20 ± 0.03 ab
Ctrl: control; Gi: G. iranicum; Pp: Pseudomonas; GiPp: inoculation with G. iranicum and Pseudomonas; ns: not significant; *, **, ***: significant with p ≤ 0.05, p ≤ 0.01, and p ≤ 0.001, respectively. ×: represents the interaction among factors.
Disclaimer/Publisher’s Note: The statements, opinions and data contained in all publications are solely those of the individual author(s) and contributor(s) and not of MDPI and/or the editor(s). MDPI and/or the editor(s) disclaim responsibility for any injury to people or property resulting from any ideas, methods, instructions or products referred to in the content.