


Abstract
Picea koraiensis Nakai is a precious tree species in Northeast China with excellent traits, but research on thinning effects on its growth remains limited, especially regarding soil-thinning–growth interactions. This study focused on a 50-year-old Picea koraiensis plantation in the Mengjiagang Forest Farm, Jiamusi. Four thinning intensities were set: CK (no thinning), T1 (10%–20%), T2 (20%–30%), and T3 (40%–50%). Short-term (1–3 years) stand growth, soil properties, microbial biomass, and extracellular enzyme activities were measured, with stand volume and large-diameter timber yield estimated via self-established equations. Results showed that T3 significantly promoted average DBH (1.98 × CK) and tree height growth (1.60 × CK). T2 achieved the highest increases in stand volume (38.07 m3/ha) and large-diameter timber yield (56.02 m3/ha), exceeding other treatments by 1.20–7.12 m3/ha and 5.60–11.64 m3/ha, respectively. Stand growth indices were positively correlated with thinning intensity, soil microbial biomass carbon, and soil C/P ratio; DBH and height also correlated with soil catalase activity. Thinning intensity has a direct effect on stand growth. Meanwhile, observational data show that it is significantly correlated with changes in soil organic carbon fractions and soil extracellular enzyme activity, and these correlations may constitute potential pathways that indirectly affect stand growth. Moderate-intensity thinning (20%–30%) is recommended for scientific tending and large-diameter timber cultivation of middle-aged Picea koraiensis plantations in this region.
1. Introduction
Picea koraiensis—a precious tree species used for timber plantation in Northeast China—is known for its cold tolerance, shade tolerance, excellent wood quality, and straight bole [1]. The tree height of the Picea koraiensis can exceed 30 m. This species features strong adaptability and can be planted across diverse regions, yet its growth height and stand volume vary with growing regions [2]. Since the 1960s and 1970s, large-scale artificial afforestation of Picea koraiensis has been carried out in this region [3]. Currently, these stands have generally entered the middle-aged stage and become the main resource for future large-diameter log cultivation and forest resource succession [4]. However, spruces are classified as slow-growing or medium-growing trees, with a rotation period as long as 50–80 years [5,6]. Their growth process differs significantly from that of fast-growing tree species such as Larix and Populus, and their responses to management measures often exhibit obvious lag and persistence characteristics [7,8]. The middle-aged stage is a critical period when stand structure differentiates and tree competition intensifies, and it is also an important period for adjusting stand density and optimizing growth space through human intervention [9]. As the most widely used density regulation method in plantation management, tending thinning can effectively reduce competition among trees, improve the living space of reserved trees, and thereby promote diameter growth and volume accumulation [10]. Nevertheless, due to the long rotation period of Picea koraiensis plantations, current research on Picea koraiensis mostly focuses on seedling cultivation and afforestation techniques in the young forest stage. There is a lack of studies on the variation patterns of tree growth characteristics in the short term after thinning and their responses to thinning intensities. Conducting research on the short-term growth effects of thinning on Picea koraiensis is of great theoretical and practical significance for guiding the precise tending and scientific management of middle-aged Picea koraiensis plantations in the region.
Planting artificial forests is one of the important measures used to mitigate global climate change. However, compared with natural forests, artificial forests are more vulnerable to pressures from both biotic and abiotic factors. Large-scale artificial forests that are not scientifically managed will significantly exacerbate these effects [11,12]. Thinning has always been an important measure in intensive forest management. A large number of studies have shown that reasonable thinning can effectively alleviate intraspecific competition, optimize resource allocation, increase forest productivity and carbon storage, reduce tree mortality, and enhance the trees’ resistance to extreme climates [13,14,15,16,17,18]. The genus Picea, as a major climax community-forming species in high-latitude and high-altitude vegetation zones in both the northern and southern hemispheres, is widely distributed in Europe, Asia, and North America. Recent studies have also found that fertilization and stand density affect the growth of Picea abies (L.) H. Karst., Picea mariana (Mill.) Britton, Sterns & Poggenb., and Picea obovata Ledeb. [19,20,21]. However, due to the relatively short history of the red spruce as a timber tree species, there are few reports on its tending management. Moreover, tree growth is a complex process that is influenced not only by human management measures but also by environmental factors [22]. Thinning can directly alter soil physical and chemical properties by changing stand structure, species diversity, and litter input, and regulating the microclimate within the forest, thereby enhancing soil nutrient cycling capacity and improving forest ecological functions [23]. Aun et al. [24] found that thinning increased soil nutrients by changing the understory temperature in Grevillea robusta forests. Existing research on thinning mostly focuses on its impact on tree growth [25], while there are relatively few studies on how large-diameter logs change after thinning, especially regarding the relationship between tree growth and changes in soil physical and chemical properties, microbial biomass, and extracellular enzyme activity under different thinning intensities [26], as well as how these factors ultimately affect the yield of large-diameter logs.
Given the current research gaps in middle-aged Picea koraiensis forests, combined with the distribution characteristics of Picea koraiensis in eastern Northeast China and the demand for large-diameter timber cultivation, this study takes middle-aged Picea koraiensis forests in eastern Northeast China as the research object. By measuring and calculating the DBH, tree height, stand volume, and large-diameter timber yield in the short term under different thinning intensity treatments, this study explores the effects of soil physicochemical properties and microbiological characteristics on tree growth, evaluates the external controlling factors affecting tree growth and their mechanisms of action in the short term after thinning, and screens out the suitable thinning intensity for cultivating large-diameter timber in middle-aged Picea koraiensis forests, aiming to provide a theoretical basis and technical support for the cultivation of large-diameter Picea koraiensis plantations.
2. Materials and Methods
2.1. Characteristics of the Study Site
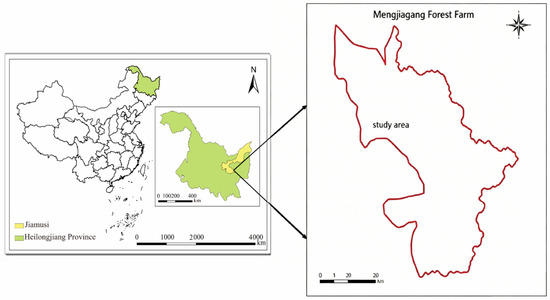
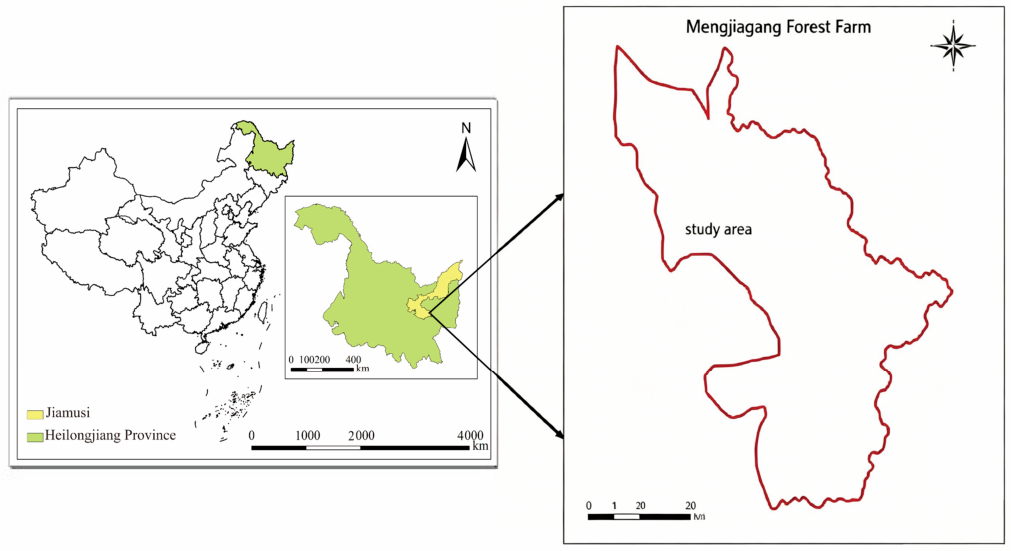
The Picea koraiensis plantations studied are located in the Mengjiagang Forest Farm, Jiamusi City, with geographical coordinates ranging from 130°32′42″~130°52′36″ E, 46°20′16″~46°30′50″ N (Figure 1). Situated at the western foot of the Wanda Mountains and bordering the Sanjiang Plain, the forest farm has an elevation of 168–575 m (average elevation 250 m) with gentle slopes, mostly between 10° and 20°. The terrain is higher in the northeast and lower in the southwest. The area has the continental monsoon climate of East Asia, with an annual average temperature of 2.7 °C, an extreme maximum temperature of 35.6 °C, and an extreme minimum temperature of −34.7 °C. The annual accumulated temperature ≥ 10 °C is 2547 °C, and the annual average precipitation is 550 mm [27]. The annual sunshine duration is 1955 h, and the frost-free period is approximately 120 days. The main tree species include Larix gmelinii (Rupr.) Kuzen., Pinus sylvestris L., Picea asperata Mast., Pinus koraiensis Siebold & Zucc., etc. The dominant soil type is dark brown soil, with typical dark brown soil being the most widely distributed, followed by bleached dark brown soil. Small areas of gleyed dark brown soil, primitive dark brown soil, and meadow dark brown soil are also present. The forest farm focuses on the management and utilization of commercial plantations, with the primary task of protecting and developing natural ecological public welfare forests. With a forest coverage rate of 81.7%, this is the largest plantation base in the Sanjiang Plain. The tending of the thinning of plantations in the farm began in 1968. The total area of plantations is 9482 ha, with an annual output of 20,000 m3 of coniferous timber.
Figure 1.
Overview of the Study Area.
2.2. Plot Setting for Harvesting and Determination of Growth Indicators
2.2.1. Thinning Plot Establishment
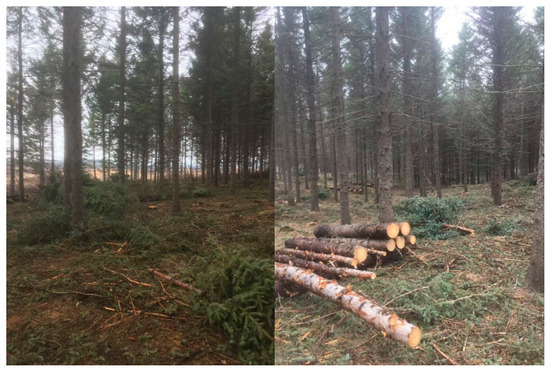
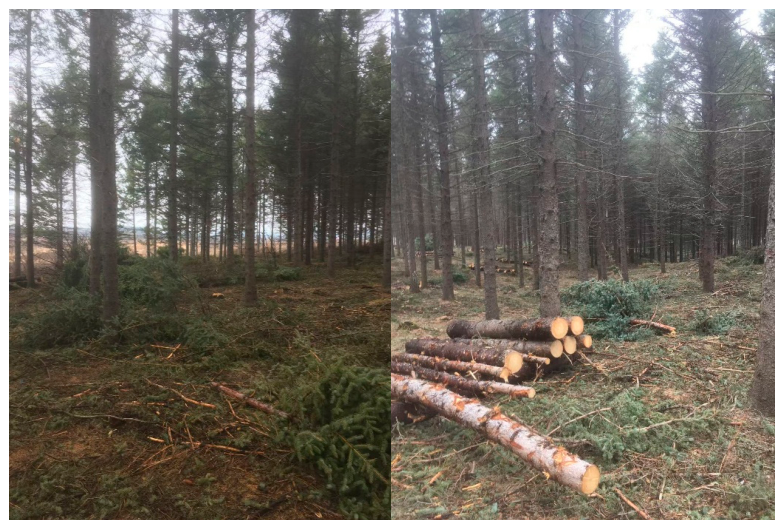
Middle-aged Picea koraiensis stands planted in the spring of 1972 were selected as the research object, with an initial planting density of 4400 trees/ha. The first low-intensity thinning (understory thinning) was conducted in 2000, and the second low-intensity thinning in winter 2017. In September 2022, 37 permanent plots ranging from 0.06 to 0.10 ha were randomly established, representing four treatments: CK (control, no thinning), T1 (low-intensity thinning, 10%–20%), T2 (moderate-intensity thinning, 20%–30%), and T3 (high-intensity thinning, 40%–50%). Due to variations in stand distribution across the study area, random sampling was applied to ensure experimental accuracy. Each treatment included 4–17 plots (17 for CK, 7 for T1, 7 for T2, and 6 for T3, totaling 37). Individual tree measurements were conducted within each plot. Based on field surveyors’ practical experience, understory thinning was implemented in the same winter, ensuring no large canopy gaps were created (basic stand characteristics before and after thinning are shown in Table 1, and thinning operations are illustrated in Figure 2).
Table 1.
Stand conditions of plots pre- and post-thinning under different intensity treatments. CK, unthinned control; T1, low-intensity thinning (10%–20%); T2, medium-intensity thinning (20%–30%); T3, high-intensity thinning (40%–50%). Different lowercase letters within the same column denote significant differences among treatments at p < 0.05, the same below.
Figure 2.
Thinning Operation Site.
2.2.2. Tree Growth Metrics Survey and Calculation
Annual surveys were conducted in the thinning year and the subsequent three years to record growth indicators of each tree in sample plots, including DBH, tree height, crown width, ground diameter, and diameter at 2 m. DBH was measured with a diameter tape; tree height was measured using a Swedish Haglof ultrasonic height meter; ground diameter and diameter at 2 m were measured with a high-precision vernier caliper. Each tree was measured three times, and the average value was taken to reduce human error.
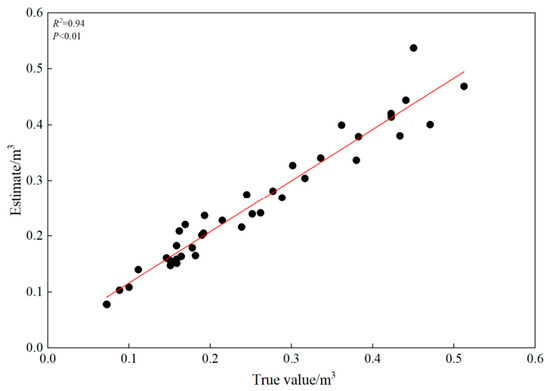
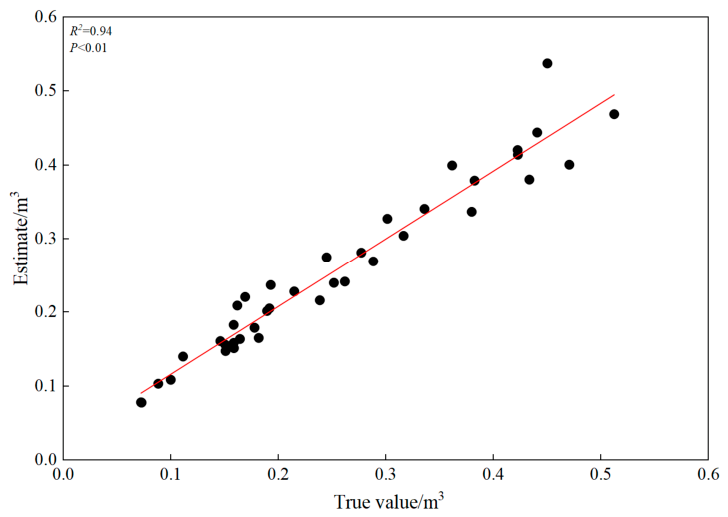
A total of 120 felled Picea koraiensis trees during thinning were selected as sample trees. After felling, diameters at different heights were measured, and the sectional volume formula was used to estimate individual tree volume. A total of 70% of the data were randomly selected to establish a one-way volume equation (R2 = 0.93). The remaining 30% of the data were used as validation samples to verify the established equation, and the validation results are shown in Figure 3. Stand volume was calculated using the data from individual tree measurements combined with the self-established one-way standing tree volume model.
where: V is the volume of standing tree; D is the diameter at breast height (DBH).
V = 0.000275598D2.32835
Figure 3.
Validation of One-Variable Volume Equation.
2.2.3. Stand Timber Yield Estimation
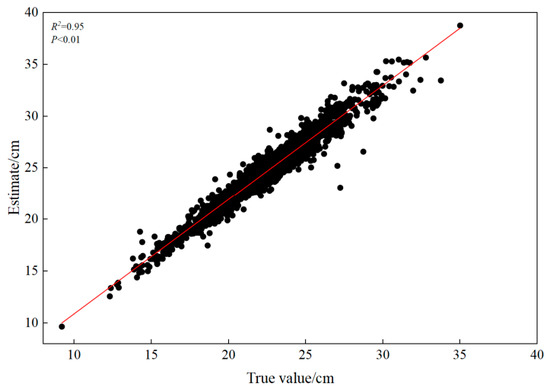
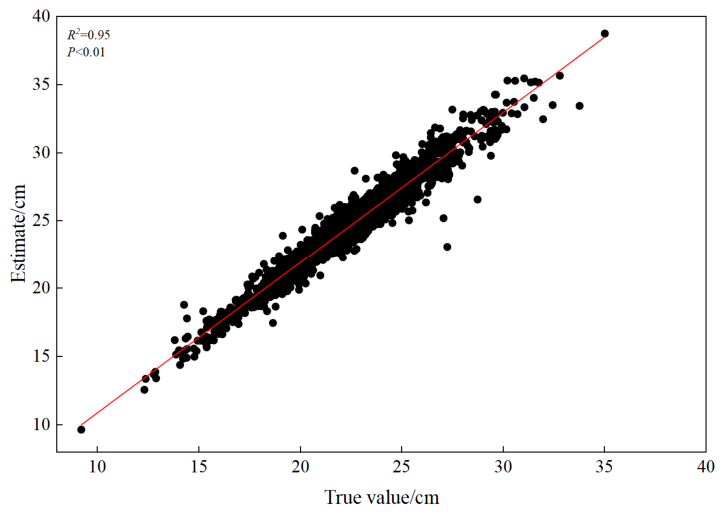
Four commonly used taper equations in forestry were selected as base models [28,29,30,31] (Equations (1)–(4)). Diameter measurements at 1 m intervals along the stem of felled trees were used to develop taper equations for Picea koraiensis. Based on model goodness-of-fit results, the optimal model was selected using evaluation metrics including the coefficient of determination (R2) and root mean square error (MSE). Equation (2) was determined as the best-performing taper equation for this study, with parameter estimates presented in Table 2. The accuracy of the taper equation was validated using actual diameter measurements at 2 m height, and the validation results are shown in Figure 4.
where d is the stem diameter at height h (cm); DBH is the diameter at breast height; H is the total tree height; ph is the relative height, defined as ph = h/H; and β0, β1, β2, β3 are model parameters.
Table 2.
Soil physical properties under different treatments three years after thinning. Values in the table are presented as mean ± standard deviation. CK, control; T1, low-intensity thinning; T2, medium-intensity thinning; T3, high-intensity thinning. Different lowercase letters in the same rowindicate significant differences among different treatments at p < 0.05. The same applies below.
Figure 4.
Verification of Taper Equation.
The taper equation (Table 3.) was used to calculate the volume of large-diameter logs, defined as logs with a small-end diameter ≥ 18 cm, based on the Technical Regulation for Picea koraiensis Cultivation (LY/T 1901-2010) [32] and Guidelines for Cultivation of Large-diameter log Forests (LY/T 2118-2013) [33], combined with local production practices. The volume was computed using a sectional volume integration method incorporating DBH and tree height.
Table 3.
Parameter Estimates of the Taper Equation for Picea koraiensis.
2.3. Soil Sample Collection and Measurement
2.3.1. Soil Sample Collection
At the end of the 2025 growing season, soil samples were collected in standard plots using the five-point sampling method (each sample was a mixture of soils from 5 sampling points), with three replicates. First, the surface litter at each sampling point was removed, and undisturbed soil samples were collected using a cutting ring. Meanwhile, soil samples were placed in aluminum boxes for the determination of physical properties such as soil bulk density and water content. Topsoil samples (0–20 cm depth) were collected at each sampling point in the plot. All topsoil samples from the same plot were thoroughly mixed and placed in self-sealing bags, and impurities such as plant roots and gravel were removed. The mixed samples were then passed through a 2 mm sieve and divided into two parts: one part was stored in a −4 °C refrigerator for the determination of soil extracellular enzyme activities, and the other part was air-dried and ground for the analysis of soil chemical properties and microbial biomass. The basic information of soil is shown in Table 4 and Table 5.
Table 4.
Soil chemical properties under different treatments three years after thinning. Different lowercase letters in the same rowcolumn indicate significant differences among different treatments at p < 0.05.
Table 5.
Soil microbial biomass and extracellular enzyme activity under different treatments three years after thinning. Different lowercase letters in the same rowcolumn indicate significant differences among different treatments at p < 0.05.
2.3.2. Soil Physicochemical Properties, Microbial Biomass, and Extracellular Enzyme Activity Measurements
Soil physical properties were mainly determined as follows [34]: soil moisture content was measured using the oven-drying method; soil bulk density and porosity were determined using the cutting ring method.
Soil chemical properties and their analytical methods [34] included: soil pH measured by potentiometry with a water extraction method (water-to-soil ratio of 2.5:1) using a pH meter (PHS-3C, LEICI, Shanghai, China); organic carbon content determined by the potassium dichromate heating method; total carbon and total nitrogen analyzed using an elemental analyzer; total phosphorus content measured by the sulfuric-perchloric acid molybdenum-antimony colorimetric method; available phosphorus extracted by the sodium bicarbonate-molybdenum-antimony colorimetric method and quantified using a spectrophotometer (UV2600, SHIMADZU, Tokyo, Japan); ammonium and nitrate nitrogen contents determined using a continuous flow analyzer (RKCF-200, RayKol, Xiamen, China); and alkaline-hydrolyzable nitrogen measured by the alkaline diffusion method.
Soil enzyme activities and their measurement methods [35] included: sucrase activity assayed by the 3,5-dinitrosalicylic acid colorimetric method; β-glucosidase activity determined by the nitrophenol colorimetric method; urease activity measured by the phenol-hypochlorite colorimetric method; protease activity assayed by the copper salt colorimetric method; acid phosphatase activity determined by the disodium phenyl phosphate colorimetric method; and catalase activity measured by the potassium permanganate titration method.
Soil microbial biomass measurements [35]: soil microbial carbon, nitrogen, and phosphorus were determined using the chloroform fumigation extraction method.
2.4. Statistical Analysis
One-way analysis of variance (ANOVA) was performed using SPSS 27.0 to evaluate the effects of different thinning intensities on forest growth. The significance level was set at p < 0.05, and the least significant difference (LSD) method was used for multiple comparisons. Normality and homogeneity of variance tests were conducted before multiple comparisons: all results met p > 0.05; thus, the null hypotheses were accepted, indicating that the data conformed to normal distribution and satisfied homogeneity of variance. Pearson correlation analysis was adopted to analyze the correlations between stand growth, soil factors, and microbiological properties. The PROC MIXED [36] procedure in SAS 9.4 software was used to screen and establish the taper equation of Picea koraiensis Nakai; the lavaan [37] package in R 4.5.3 was used to construct the structural equation among thinning intensity, soil factors, and stand growth. In the analysis, each sample plot was treated as an independent biological replicate to avoid the problem of spatial pseudo replication at the plot level. For continuously surveyed growth data, this study mainly focused on the overall differences among treatments, and repeated measures ANOVA was not performed. Instead, the cumulative value and annual average value in the third year after thinning were reported separately as the main basis for comparison.
3. Results
3.1. Effects of Thinning on Stand Growth of Middle-Aged Picea koraiensis Forests
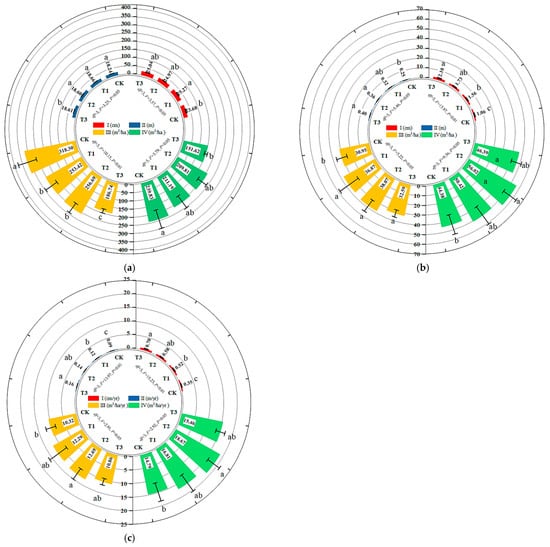
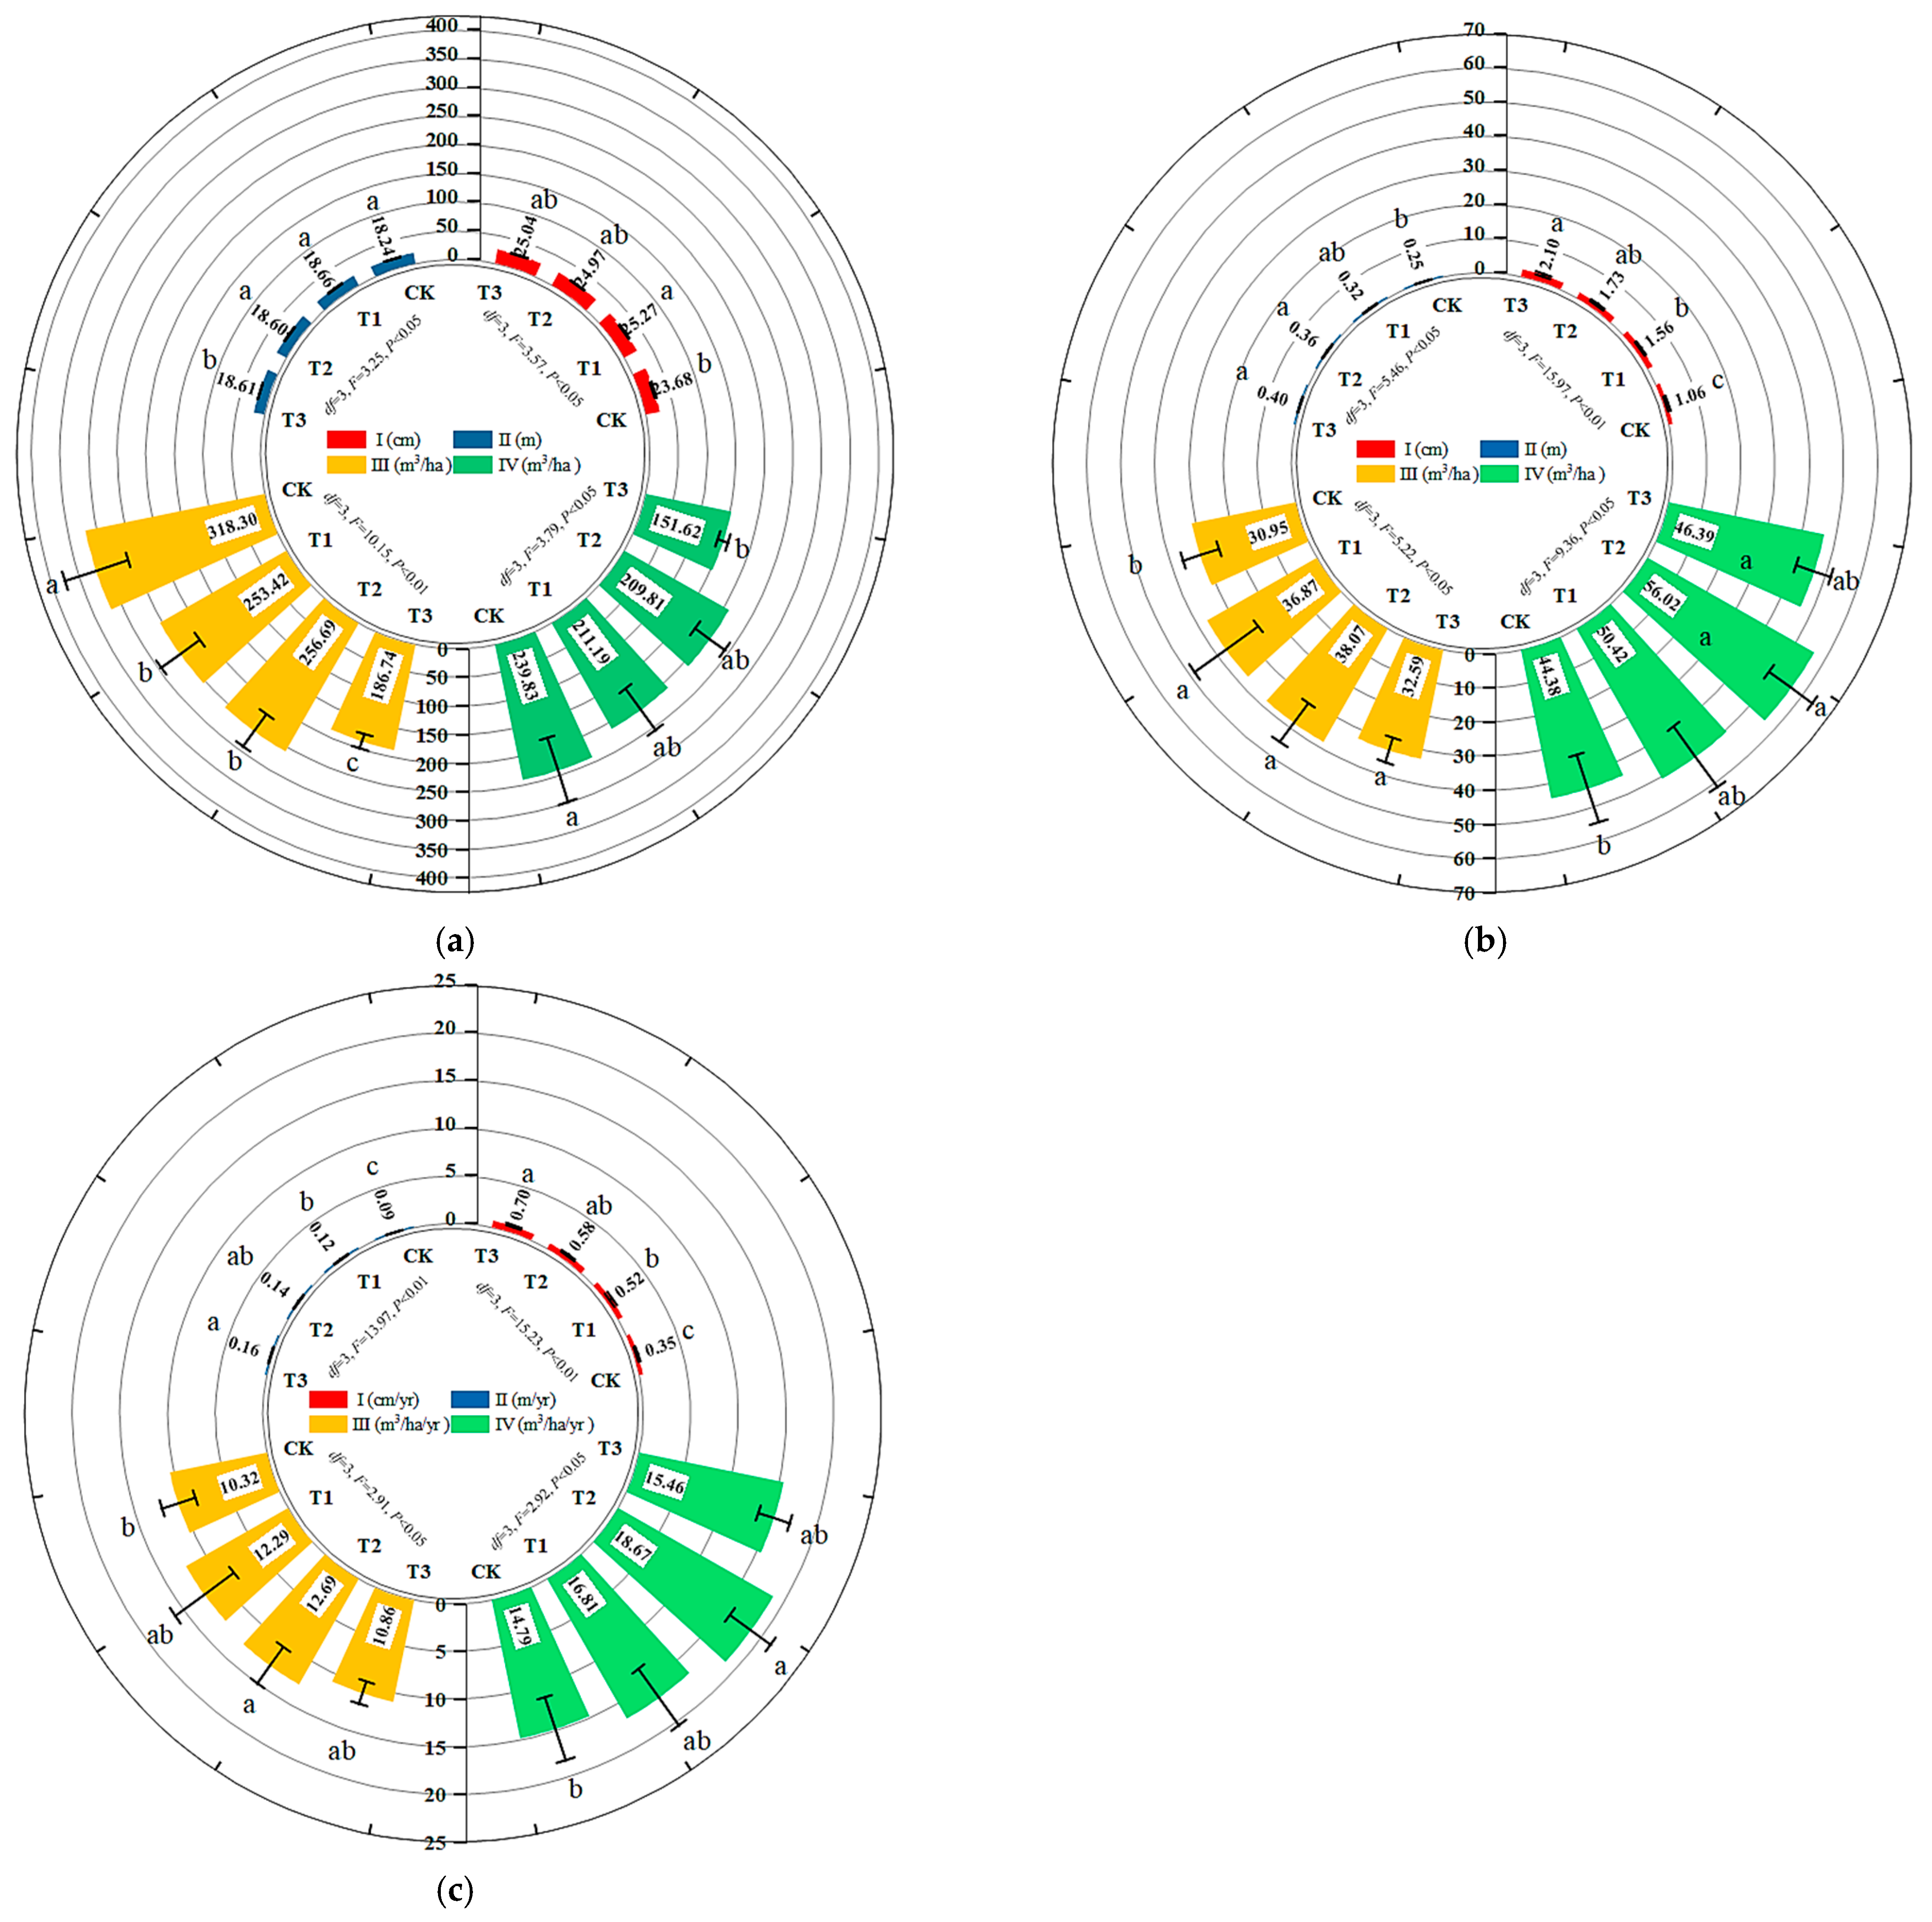
As shown in Figure 5, after three years of thinning, the mean diameter at breast height (25.27 cm) in the low-intensity thinning treatment (T1) was higher than that in other thinning treatments (24.97–25.04 cm) and significantly higher than that of the control (CK) treatment (23.68 cm). The average tree heights of the three thinning treatments (T1, T2, T3) were 18.66 m, 18.60 m, and 18.61 m, respectively, all significantly higher than that of the CK treatment (18.24 m). The stand volume of the CK treatment increased to 318.30 m3/ha, which was significantly higher than that of the different intensity thinning treatments (186.74–256.69 m3/ha). Meanwhile, the stand volume of the T3 treatment (186.74 m3/ha) was significantly different from that of the T1 and T2 treatments (253.42 and 256.69 m3/ha). These results indicate that although thinning can promote the growth of individual trees, the overall stand volume will be lower than that of unthinned stands in the short term due to the reduction in the number of trees, and the higher the thinning intensity, the more obvious the decrease in stand volume. Although the output of large-diameter logs (top diameter ≥ 18 cm) in the CK treatment (239.83 m3/ha) was higher than that in the different intensity thinning treatments (151.62–211.19 m3/ha), there was no significant difference in the output of large-diameter logs between the different thinning treatments (except for the T3 treatment, 151.62 m3/ha) and the CK treatment.
Figure 5.
Effects of thinning on stand growth of mid-aged Picea koraiensis plantations. (a) Stand growth status 3 years after thinning; (b) total growth increment; (c) mean growth increment. I, Mean DBH; II, Mean Tree Height; III, Stand Volume; IV, Large-diameter Sawlog Yield. CK, control; T1, light thinning (10%–20%); T2, moderate thinning (20%–30%); T3, heavy thinning (40%–50%). Different lowercase letters indicate significant differences among treatments at p < 0.05.
From the perspective of total stand growth (Figure 5b), three years after thinning, the total growth of DBH and tree height under different thinning intensities (1.56–2.10 cm for DBH, 0.32–0.40 m for tree height) was higher than that of the CK treatment (1.06 cm for DBH, 0.25 m for tree height), and both increased with the increase of thinning intensity. Among them, the total DBH growth of stands under thinning treatments was significantly higher than that of the CK treatment, and the total growth of DBH and tree height reached the peak under the T3 treatment (2.10 cm, 0.40 m). The total growth of stand volume and large-diameter logs under different thinning intensities (32.59–38.07 m3/ha for stand volume, 46.39–56.02 m3/ha for large-diameter logs) was also higher than that of the CK treatment (30.95 m3/ha for stand volume, 44.38 m3/ha for large-diameter logs). The T2 treatment showed the highest total growth of stand volume and large-diameter logs (38.07 m3/ha, 56.02 m3/ha), which was significantly higher than that of the CK treatment. The mean annual growth of trees under different thinning intensities was higher than that of the CK treatment (Figure 5c). The mean annual growth of DBH and tree height under different thinning intensities (0.52–0.70 cm/yr for DBH, 0.12–0.16 m/yr for tree height) was significantly higher than that of the CK treatment (0.35 cm/yr for DBH, 0.09 m/yr for tree height), and both increased with the increase of thinning intensity. In this study, the observed annual increment of tree height ranged from 0.09 to 0.16 m/yr, which was higher than the minimum precision of the height measuring instrument “0.1 m”. Therefore, the impact of measurement error on the results is negligible. The mean annual growth of DBH and tree height were the highest under the T3 treatment (0.70 cm/yr, 0.16 m/yr). Regarding the mean annual growth of stand volume and large-diameter logs, the mean annual growth of stand volume and large-diameter logs under different thinning intensities (10.86–12.69 m3/ha/yr for stand volume, 15.46–18.67 m3/ha/yr for large-diameter logs) was also higher than that of the CK treatment (10.32 m3/ha/yr for stand volume, 14.79 m3/ha/yr for large-diameter logs). The T2 treatment had the highest mean annual growth of stand volume and large-diameter logs (12.69 m3/ha/yr, 18.67 m3/ha/yr), which was significantly higher than that of the CK treatment.
3.2. Relationships Between Stand Growth and Soil Physicochemical Properties, Microbial Biomass, and Extracellular Enzyme Activities
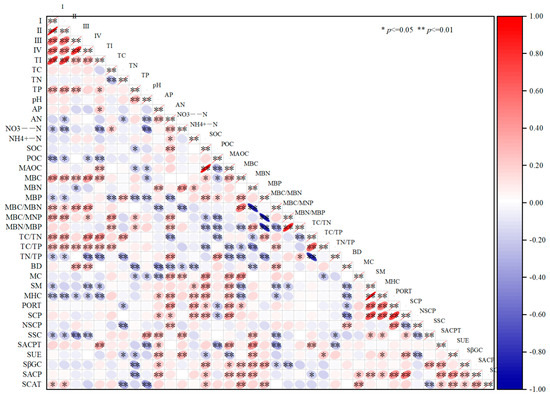
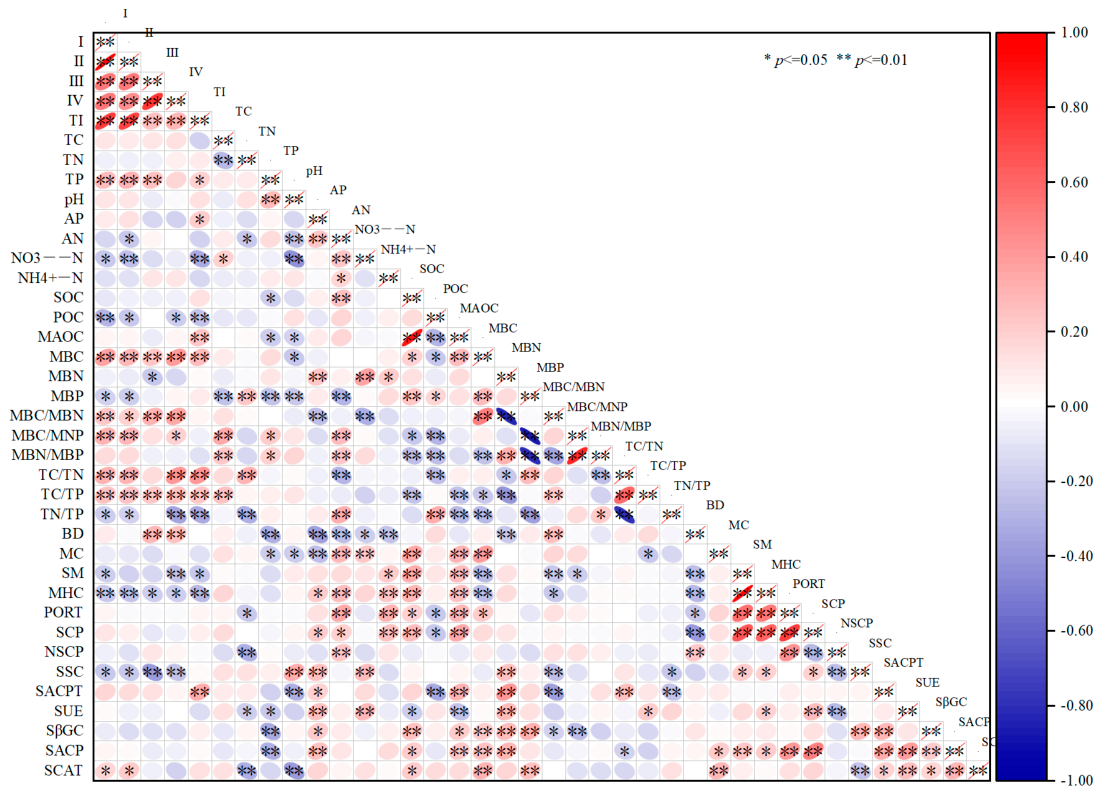
Correlation analysis between the mean annual growth of stand growth indicators and soil physicochemical properties, as well as microbial activities (Figure 6), showed that the mean annual growth of stand DBH, tree height, stand volume, and large-diameter logs was significantly positively correlated with thinning intensity (TI), soil microbial biomass carbon (MBC) content (p < 0.01), microbial biomass carbon-to-nitrogen ratio (MBC/MBN, p < 0.01), and total carbon-to-total phosphorus ratio (TC/TP, p < 0.01). Meanwhile, the mean annual growth of stand DBH, tree height, and stand volume was also significantly positively correlated with soil total phosphorus (TP, p < 0.01). The mean annual growth of stand DBH, tree height, and large-diameter logs was significantly positively correlated with soil total carbon-to-total nitrogen ratio (TC/TN, p < 0.01) and microbial biomass carbon-to-nitrogen ratio (MBC/MBN, p < 0.01). The mean annual growth of stand volume and large-diameter logs was significantly positively correlated with soil bulk density (BD, p < 0.01). The mean annual growth of stand DBH and tree height was significantly positively correlated with soil catalase (SCAT) activity (p < 0.01). In contrast, the mean annual growth of stand DBH, tree height, stand volume, and large-diameter logs was significantly negatively correlated with soil capillary water holding capacity (MHC) and invertase (SSC) activity (p < 0.01). The mean annual growth of DBH, tree height, and large-diameter logs was also significantly negatively correlated with soil particulate organic carbon (POC, p < 0.01) content and total nitrogen-to-total phosphorus ratio (TN/TP, p < 0.01). The mean annual growth of DBH and tree height was significantly negatively correlated with soil nitrate nitrogen (NO3−-N, p < 0.01) and microbial biomass phosphorus (MBP, p < 0.01) content. The mean annual growth of DBH and large-diameter logs was significantly negatively correlated with soil saturated moisture content (SM, p < 0.01). The mean annual growth of tree height was significantly negatively correlated with alkaline-hydrolyzable nitrogen (AN, p < 0.01). The mean annual growth of stand volume was significantly negatively correlated with soil microbial biomass nitrogen (MBN) content (p < 0.01).
Figure 6.
Correlation Analysis Between Mean Annual Stand Growth and Soil Physicochemical Properties, Microbial Biomass, and Extracellular Enzyme Activities. I: Mean annual growth of stand average DBH; II: Mean annual growth of stand average tree height; III: Mean annual growth of stand volume; IV: Mean annual growth of stand large-diameter log; TI: Thinning intensity; pH: Soil pH; TC: Soil total carbon content; TN: Soil total nitrogen content; TP: Soil total phosphorus content; AP: Soil available phosphorus content; AN: Soil alkaline-hydrolyzable nitrogen content; NO3——N: Soil nitrate nitrogen content; NH4+—N: Soil ammonium nitrogen content; SOC: Soil organic carbon content; POC: Soil particulate organic carbon content; MAOC: Soil mineral-associated organic carbon content; MBC: Soil microbial biomass carbon content; MBN: Soil microbial biomass nitrogen content; MBP: Soil microbial biomass phosphorus content; MBC/MBN: Soil microbial biomass carbon-to-nitrogen ratio; MBN/MBP: Soil microbial biomass nitrogen-to-phosphorus ratio; TC/TN: Soil carbon-to-nitrogen ratio; TC/TP: Soil carbon-to-phosphorus ratio; TN/TP: Soil nitrogen-to-phosphorus ratio; BD: Soil bulk density; MC: Soil moisture content; SM: Soil saturated moisture content; MHC: Soil capillary water holding capacity; PORT: Soil total porosity; SCP: Soil capillary porosity; NSCP: Soil non-capillary porosity; SSC: Soil sucrase; SACPT: Soil protease; SUE: Soil urease; SβGC: Soil β-glucosidase; SACP: Soil acid phosphatase; SCAT: Soil catalase.
3.3. Response Mechanism of Stand Growth After Thinning
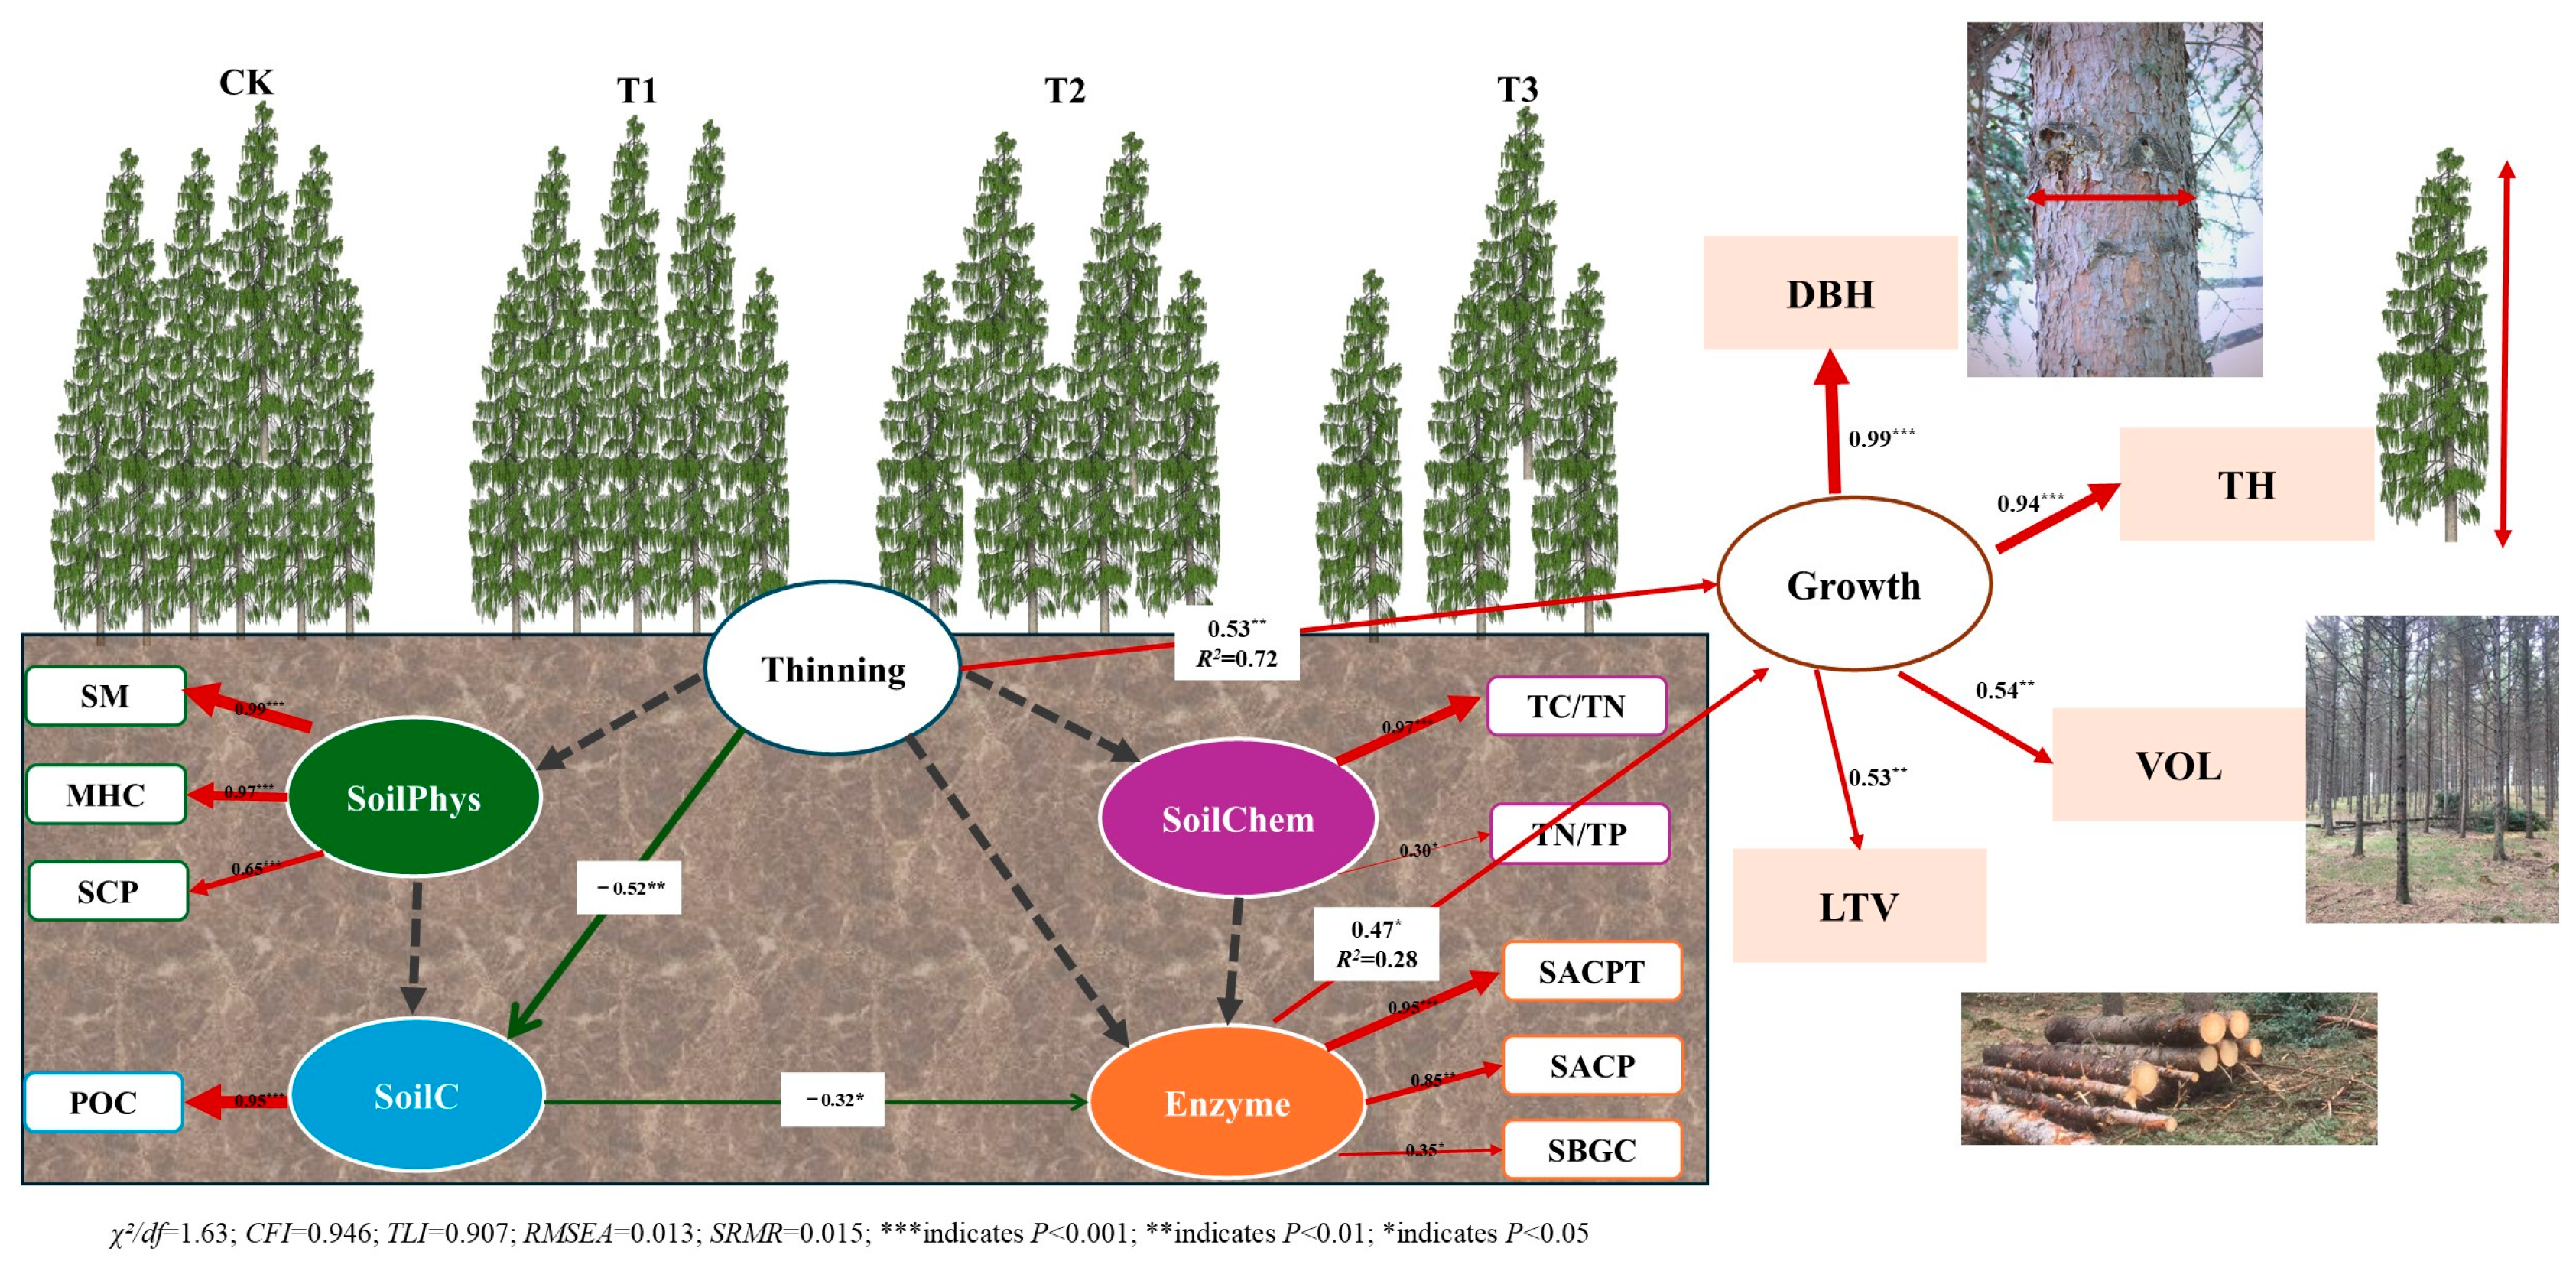
The structural equation model (SEM) was constructed with thinning intensity, soil physicochemical properties, and microbial activity as independent variables, and mean annual stand growth (including DBH, tree height, stand volume, and large-diameter log output) as dependent variables. Path analysis was conducted to quantify the direct and indirect relationships among variables (Figure 7). The model exhibited good fit indices (χ2/df = 1.63, CFI = 0.946, TLI = 0.907, RMSEA = 0.013, SRMR = 0.015), verifying the rationality of the preset paths. The total effect of thinning intensity on stand growth was significant, with the direct effect contributing the most, and the indirect effects of variables related to soil physicochemical properties further amplified the regulatory effect of thinning. Thinning intensity had a significant positive direct effect on stand growth, with a standardized path coefficient of 0.53 (R2 = 0.72). This indicates that moderate thinning can directly promote radial growth, height growth, and stand volume increment by improving light conditions, nutrient availability, and spatial competition patterns within the stand. Meanwhile, soil physicochemical properties, as important mediating variables between thinning intensity and stand growth, exerted indirect effects on stand growth. The path coefficient of thinning intensity on soil organic carbon (SoilC) was −0.52**, and soil physical properties further affected extracellular enzyme activity (Enzyme) with a path coefficient of −0.32*. Notably, thinning significantly altered soil particulate organic carbon (POC), which in turn affected the activities of soil protease (SACPT), β-glucosidase (SβGC), and acid phosphatase (SACP), ultimately indirectly regulating stand growth with a path coefficient of 0.47*.
Figure 7.
Structural Equation Model of Growth, Soil Factors, and Microbial Activity in Middle—Aged Picea koraiensis Forests. CK: Control; T1: Low—intensity thinning; T2: Medium—intensity thinning; T3: High—intensity thinning; DBH: Mean annual growth of diameter at breast height; TH: Mean annual growth of tree height; VOL: Mean annual growth of stand volume; LTV: Mean annual growth of large—diameter log; POC: Soil particulate organic carbon; MBC: Soil microbial biomass carbon; TC/TN: Soil carbon—to—nitrogen ratio; TN/TP: Soil nitrogen—to—phosphorus ratio; SM: Soil saturated moisture content; MHC: Soil capillary water holding capacity; SCP: Soil capillary porosity; SACPT: Soil protease; SβGC: Soil β—glucosidase; SACP: Soil acid phosphatase. * indicates significance at the 0.05 level, ** indicates significance at the 0.01 level, *** indicates significance at the 0.001 level. In the figure, the solid arrows indicate a significant correlation between the two indicators, while the dashed arrows indicate a non-significant correlation. The green arrows represent a negative correlation between the two variables, the red arrows represent a positive correlation, and the stronger the correlation, the thicker the arrow will be.
4. Discussion
4.1. Effects of Thinning on Stand Growth
Tending thinning is a core management measure for optimizing plantation structure, enhancing productivity, and cultivating large-diameter log yields. Its effects are not only reflected in the direct response of tree growth but also in the indirect regulation of stand growth by altering the stand microenvironment and driving changes in soil physicochemical and biological properties [38,39]. As an important timber species in the eastern mountainous areas of Northeast China, Picea koraiensis plantations in the middle-aged stage exhibit slow growth, intense competition, and delayed responses to management interventions. Moreover, systematic research on the “thinning intensity-soil environment-stand growth” mechanism has long been lacking. Accurate estimation of stand volume and large-diameter log output is crucial for evaluating the effects of thinning on stand growth [40]. Current studies on stand growth mostly use existing models for estimation, leading to large errors in volume and output estimation, which makes it difficult to reflect the true effects of thinning. In contrast, this study established more targeted one-way volume equations and taper equations for Picea koraiensis based on actual felled trees in sample plots, resulting in more accurate growth data. This allows for a more realistic and accurate revelation of the regulatory effects of thinning on stand growth, providing a reliable basis for the precise management of plantations and the cultivation of large-diameter logs.
The results of this study showed that three years after thinning, the total growth of DBH and tree height under different thinning intensities (1.56–2.10 cm and 0.32–0.40 m) was higher than that of the control (CK) treatment (1.06 cm, 0.25 m), and showed an increasing trend with increasing thinning intensity. The total growth of DBH and tree height (2.10 cm, 0.40 m) under high-intensity thinning (T3) treatment was the most significantly improved. This indicates that thinning effectively promotes the radial and height growth of individual trees by alleviating competition for light, nutrients, and space within the stand. Within a certain range, the higher the thinning intensity, the more significant the promoting effect on individual tree growth, which is consistent with the views of most scholars [41,42]. It is worth noting that some scholars believe that the effect of thinning on tree height is not significant in the short term [43]. However, the results of this study found that the total tree height growth under thinning treatments was significantly higher than that of the CK treatment, indicating that thinning has a significant impact on the tree height growth of middle-aged Picea koraiensis forests. This difference may be due to the biological characteristics of spruce. As a shade-tolerant species, its tree height growth is still sensitive to light conditions in the middle-aged stage. The significant increase in light intensity within the stand after thinning effectively relieves the inhibition of apical dominance, thereby accelerating tree height growth [44]. In addition, the improvement of soil nutrient availability after thinning also provides sufficient material basis for tree height growth [45].
From the perspective of dynamic changes in stand volume and large-diameter log output, the stand volume and large-diameter log output of the control stand are currently higher than those of the thinning treatment stands. However, the total growth of stand volume and large-diameter logs under different thinning intensities (32.59–38.07 m3/ha, 46.39–56.02 m3/ha) was higher than that of the CK treatment (30.95 m3/ha, 44.38 m3/ha). This indicates that although thinning leads to lower stand volume in the short term due to the reduction in the number of trees, from the perspective of growth efficiency, thinning significantly increases the growth rate of reserved trees, thereby promoting the improvement of overall stand growth efficiency. Benedetti-Ruiz et al. [42] also found in their study that thinning, as an effective afforestation intervention, is conducive to producing high-quality timber when carried out gradually and multiple times in plantations. At the same time, the medium-intensity thinning (T2) treatment performed best in terms of stand volume and large-diameter log growth, which can effectively promote the growth of individual trees while maintaining a high stand growth rate. This is consistent with the research conclusion of Güney et al. [46]; that is, medium-intensity thinning can achieve an optimal balance between promoting individual growth and maintaining stand growth rate. In addition, from the perspective of the tree growth cycle, the promoting effect of thinning on stand growth takes a long time to be reflected in stand volume. The short-term decrease in stand volume is an inevitable process of stand structure adjustment. With the increase in the number of years after thinning, the stand volume of thinning treatment stands will gradually recover to the level before thinning and eventually exceed that of unthinned stands.
4.2. Dominant Factors Affecting Stand Growth and Their Mechanisms
Stand growth is significantly correlated with thinning intensity, soil physicochemical properties, and microbial activity. Among them, thinning intensity, as an important factor, changes the resource allocation pattern of light, water, etc., by reducing stand density [47], which not only directly promotes stand growth [48] but also changes soil physicochemical properties [45]. Soil microbial biomass carbon (MBC), carbon-to-nitrogen ratio (TC/TN), total phosphorus (TP), and other indicators are significantly positively correlated with stand growth. This reveals that soil microbial activity—as the core driving force of ecosystem material cycling—its biomass, and stoichiometric ratio can directly reflect the soil nutrient supply capacity and microbial community functional status, which is an important material basis for supporting stand growth [49]. In contrast, soil bulk density (BD), capillary water holding capacity (MHC), and other indicators are significantly negatively correlated with stand growth. This is because appropriately reducing soil BD can improve soil aeration and promote root respiration and growth, while excessively high MHC and BD may lead to poor soil aeration and inhibit root activity [50]. The activity of soil extracellular enzymes, as key functional components involved in organic matter decomposition and nutrient cycling, can reflect microbial metabolic capacity and nutrient demand [51]. This study found that soil catalase (SCAT) activity is significantly positively correlated with stand DBH and tree height, indicating that the enhancement of SCAT activity can improve the soil redox capacity, promote the transformation and supply of nutrients, and thus promote tree growth. However, soil sucrase (SSC) activity is significantly negatively correlated with most growth indicators, which may be because the increase in SSC activity means that soil microorganisms have an increased demand for carbon sources, competing with trees for available carbon sources, thereby inhibiting tree growth.
This study employed a simplified structural equation model with a sample size of 37. The model was validated using the Bootstrap method (1000 repetitions). The results showed that the model fit was good (RMSEA = 0.013, CFI = 0.946), indicating that the sample size had little impact on the results. The structural equation model further indicates that the improvement in stand growth observed after thinning may be partially attributed to the synergistic changes of soil factors. Thinning intensity significantly affects the activities of soil protease (SACPT), β-glucosidase (SβGC), and acid phosphatase (SACP) by changing the content of soil particulate organic carbon (POC), thereby promoting stand growth. This path indicates that thinning may create favorable conditions for stand growth by optimizing soil structure, improving soil nutrient availability, and enhancing carbon cycling efficiency. Among them, soil organic carbon (SoilC), as a core node, is not only directly regulated by thinning intensity [45] but also indirectly affects stand growth by influencing soil enzyme activity [4,51]. At the same time, there is a negative correlation between soil physical properties and soil enzyme activity, reflecting that the improvement of soil structure can reduce microbial metabolic resistance, improve enzyme activity efficiency, and thus amplify the promoting effect of thinning on stand growth [52].
4.3. Limitations of the Study
The growth promotion observed in the first three years after thinning likely stems from rapid release of site resources from inter-tree competition, but the long-term persistence of this accelerated growth remains uncertain, with growth rates expected to decline following canopy re-closure. Medium-intensity thinning has more robust advantages for stand volume accumulation and large-diameter timber increment over longer rotations. This study only assessed short-term responses to different thinning regimes: soil property improvements require more time to translate into tree growth gains, and long-term ecological legacies of microenvironmental changes from varying thinning intensities may not appear until 5, 10, or more years post-treatment. While high-intensity thinning (T3) stimulates early individual tree growth, its larger canopy gaps intensify understory competition and may reduce stand stability and timber quality. By contrast, medium-intensity thinning (T2) balances individual growth, total stand yield, and large-diameter production, showing greater potential for long-term high-value silviculture, though this needs long-term monitoring validation.
The recommended optimal thinning intensity here is preliminary, based on short-term data. Permanent plots with over 10 years of continuous monitoring will be needed in future work to quantify the long-term ecological and productive benefits of different treatments, providing a robust scientific basis for the precision management of Picea koraiensis plantations over their full rotation.
5. Conclusions
Thinning significantly promotes the growth of individual trees and reduces stand volume in the short term, but is beneficial to the growth of large-diameter logs. The growth of stand DBH and tree height both increase with the increase of thinning intensity, and high-intensity thinning (40%–50%) has the most prominent promoting effect on DBH and tree height growth. However, due to the reduction in the number of trees, the stand volume growth under different thinning intensity treatments is lower than that of the unthinned control stand in the short term. Although the control stand has the highest output of large-diameter logs (top diameter ≥ 18 cm), there is no significant difference between the thinning treatments (except for the high-intensity T3 treatment) and the control. In terms of growth increment, medium-intensity thinning (20%–30%) performs best in the growth increment of stand volume and large-diameter log output, which is significantly higher than that of the control treatment, indicating that moderate thinning can more effectively accelerate the formation of large-diameter logs while maintaining a certain wood yield.
Stand growth is significantly correlated with thinning intensity, soil fertility, and microbial activity. The growth of stand DBH, tree height, stand volume, and large-diameter log yield is significantly positively correlated with thinning intensity, soil microbial biomass carbon content, and soil carbon-to-phosphorus ratio. In addition, the growth of DBH and tree height is also significantly positively correlated with soil catalase activity. This indicates that thinning may not only promote growth by directly reducing competition but also improves the stand environment and affects soil organic matter turnover and microbial activity, thereby enhancing soil fertility and further promoting tree growth. Medium-intensity thinning is the suitable intensity to achieve tree growth, stand volume growth, and large-diameter log cultivation. Comprehensive comparison of various growth indicators shows that high-intensity thinning (40%–50%) has the strongest promoting effect on the growth of individual trees but causes a large loss of stand volume; low-intensity thinning (10%–20%) has a limited promoting effect and structural adjustment effect. In the short term after thinning, moderate-intensity thinning (20%–30%) has the strongest correlation with a positive performance in promoting individual tree growth, stand volume, and large-diameter timber increase. Therefore, moderate-intensity thinning can be used as a reference for a potential suitable intensity for middle-aged Picea koraiensis forests in this region, which balances the goals of tree growth, stand productivity, and large-diameter timber cultivation.
In conclusion, tending thinning is an effective measure to regulate the growth of middle-aged Picea koraiensis forests and cultivate large-diameter logs in a targeted manner. Based on short-term observations after thinning, thinning promotes stand growth through two paths: directly alleviating tree competition and indirectly improving soil microbial environment and nutrient cycling. It is recommended that medium thinning intensity of 20%–30% be adopted in middle-aged Picea koraiensis plantations in eastern Northeast China, which can be used as a key technical reference for the scientific management of plantations and the improvement of wood quality and value.
Author Contributions
Q.W. and M.C. (Mengnan Cao) conceived and designed the experiments; drafted the manuscript. Y.L. and S.Y. conducted field data collections and performed data visualization. L.S., J.W. and M.C. (Meixuan Chen) carried out laboratory experiments and data processing. Z.S. edited the manuscript. All authors have read and agreed to the published version of the manuscript.
Funding
This work was supported by the “14th Five-Year Plan” National Key Research and Development Program of the Ministry of Science and Technology of the People’s Republic of China (No. 2022YFD2201001-05).
Data Availability Statement
The data are available on reasonable request.
Acknowledgments
We would like to express our sincere gratitude to the Topic of The National Key Research and Development Program of China during the 14th Five-Year Plan Period (No. 2022YFD2201001-05) for the financial support of this study. We also extend our heartfelt thanks to the numerous staff members of Mengjiagang Forest Farm for their invaluable assistance throughout the research process.
Conflicts of Interest
The authors declare no conflicts of interest.
References
- Wang, Q.Y.; Jia, H.B.; Shang, J. Geographic variation and genetic performance of Picea koraiensis in growth and timber characteristics. J. For. Res. 2005, 16, 93–96. [Google Scholar] [CrossRef] [Scilit]
- Zhang, Y.T. Ecological and biological characteristics of Picea koraiensis plantations. South Cent. Agric. Sci. Technol. 2024, 45, 248–250. (In Chinese) [Google Scholar] [CrossRef]
- Wang, M.Y.; Zheng, Y.; Huang, C.Q.; Meng, R.; Pang, Y.; Jia, W.; Zhao, F. Assessing Landsat-8 and Sentinel-2 spectral-temporal features for mapping tree species of northern plantation forests in Heilongjiang Province, China. For. Ecosyst. 2022, 9, 344–356. [Google Scholar] [CrossRef] [Scilit]
- Zhao, C.H.; Su, N.E.; Wang, H.; Xing, H.L.; Shen, H.L.; Yang, L. Effects of thinning on soil nutrient availability and fungal community composition in a plantation medium-aged pure forest of Picea koraiensis. Sci. Rep. 2023, 13, 2492. [Google Scholar] [CrossRef] [Scilit] [PubMed]
- Xu, G.B.; Chen, T.; Liu, X.T.; Wen, T.; Wang, W.Z.; Wang, X.C.; Zhao, C.M. Spruce trees have stronger drought sensitivity at low- than high-elevation sites across China’s aridity zones. Glob. Ecol. Conserv. 2024, 53, e03000. [Google Scholar] [CrossRef] [Scilit]
- Zhu, H.Y.; Weng, Y.H.; Zhang, H.G.; Meng, F.R.; Major, J.E. Comparing fast- and slow-growing provenances of Picea koraiensis in biomass, carbon parameters and their relationships with growth. For. Ecol. Manag. 2013, 307, 178–185. [Google Scholar] [CrossRef] [Scilit]
- Zhang, W.G.; Gou, X.H.; Zhang, F.; Liu, W.H.; Zhang, Y.; Gao, L.L. Divergent responses of Qinghai spruce (Picea crassifolia) to recent warming along elevational gradients in the central Qilian Mountains, Northwest China. J. Geogr. Sci. 2023, 33, 151–168. [Google Scholar] [CrossRef] [Scilit]
- Maaten, T.; Kiviste, A.; Vysotska, N.; Drenkhan, R.; Metslaid, M.; Maaten, T.D.; Metslaid, S. Growth performance and quality traits of Norway spruce Baltic provenances in Estonia. Scand. J. For. Res. 2026, 41, 232–249. [Google Scholar] [CrossRef] [Scilit]
- Tu, J.; Zhao, Z.W.; Chai, Z.Z. The Short-Term Impact of Logging Intensity on the Stand State of Middle-Aged Masson Pine (Pinus massoniana Lamb.) Plantations. Forests 2025, 16, 183. [Google Scholar] [CrossRef] [Scilit]
- Zhao, D.H.; Bullock, P.B.; Wang, M.L.; Kinane, M.S.; Queiroz, T.L. Growth and structural responses of loblolly pine plantations to first and second thinning, and post-thinning treatments in the southeastern US. For. Ecol. Manag. 2025, 594, 122975. [Google Scholar] [CrossRef] [Scilit]
- Ariza Salamanca, A.J.; Navarro-Cerrillo, R.M.; Bonet-García, F.J.; Pérez-Palazón, M.J.; Polo, M.J. Integration of a Landsat Time-Series of NBR and Hydrological Modeling to Assess Pinus pinaster Aiton. Forest Defoliation in South-Eastern Spain. Remote Sens. 2019, 11, 2291. [Google Scholar] [CrossRef] [Scilit]
- Gong, S.S.; Liu, S.; Li, F.F.; Xu, G.X.; Chen, J.; Jia, L.; Shi, Z.M. Natural forests vs. plantations: A meta-analysis of consequences for soil organic carbon functional fractions. J. Environ. Manag. 2025, 377, 124673. [Google Scholar] [CrossRef] [Scilit] [PubMed]
- Jiménez, M.N.; Navarro, F.B.; Sánchez-Miranda, A.; Ripoll, M.A. Using stem diameter variations to detect and quantify growth and relationships with climatic variables on a gradient of thinned Aleppo pines. For. Ecol. Manag. 2019, 442, 53–62. [Google Scholar] [CrossRef] [Scilit]
- Àngela, M.A.; Santiago, B.; Miquel, T.B.; Julio, C.J. Increased Post-Drought Growth after Thinning in Pinus nigra Plantations. Forests 2021, 12, 985. [Google Scholar] [CrossRef] [Scilit]
- Navarro-Cerrillo, R.M.; Ruiz-Gómez, F.J.; Camarero, J.J.; Castillo, V.; Barberá, G.G.; Palacios-Rodríguez, G.; Navarro, F.B.; Blanco, J.A.; Imbert, J.B.; Cachinero, V.A.M.; et al. Long-Term Carbon Sequestration in Pine Forests under Different Silvicultural and Climatic Regimes in Spain. Forests 2022, 13, 450. [Google Scholar] [CrossRef] [Scilit]
- Navarro-Cerrillo, R.M.; Cachinero-Vivar, A.M.; Pérez-Priego, Ó.; Aspizua, C.R.; Begueria, S.; Julio, C.J. Developing alternatives to adaptive silviculture: Thinning and tree growth resistance to drought in a Pinus species on an elevated gradient in Southern Spain. For. Ecol. Manag. 2023, 537, 120936. [Google Scholar] [CrossRef] [Scilit]
- Du, X.; Lei, X.D.; Xiang, W.H.; Liu, D.; Yang, L.; Guo, H.; Li, S.J. Thinning partially offsets climate change-induced decline of Pinus koraiensis volume in broadleaf-Korean pine mixed forest in Northeast China based on transition matrix growth model simulations. Trees For. People 2026, 25, 101239. [Google Scholar] [CrossRef] [Scilit]
- Wang, Z.C.; Zhang, Z.Y.; Zhou, J.Q.; Li, Y.X.; Wang, G.Y. Thinning promotes forest carbon stocks by optimizing tree growth and soil properties. For. Ecol. Manag. 2026, 604, 123494. [Google Scholar] [CrossRef] [Scilit]
- Bergh, J.; Nilsson, U.; Allen, H.L.; Johansson, U.; Fahlvik, N. Long-term responses of Scots pine and Norway spruce stands in Sweden to repeated fertilization and thinning. For. Ecol. Manag. 2014, 320, 118–128. [Google Scholar] [CrossRef] [Scilit]
- Kholdaenko, Y.A.; Belokopytova, L.V.; Zhirnova, D.F.; Upadhyay, K.K.; Tripathi, S.K.; Koshurnikova, N.N.; Vaganov, E.A. Stand density effects on tree growth and climatic response in Picea obovata Ledeb. plantations. For. Ecol. Manag. 2022, 519, 120349. [Google Scholar] [CrossRef] [Scilit]
- Lesven, J.A.; Dayras, M.D.; Cazabonne, J. Future impacts of climate change on black spruce growth and mortality: Review and challenges. Environ. Rev. 2024, 32, 214–230. [Google Scholar] [CrossRef] [Scilit]
- Jucker, T.; Fischer, J.F.; Chave, J.; Coomes, D.A.; Caspersen, J.; Ali, A.; Zimmermann, N.E. The global spectrum of tree crown architecture. Nat. Commun. 2025, 16, 4876. [Google Scholar] [CrossRef] [Scilit] [PubMed]
- Erkan, N.; Guner, S.T.; Aydin, A.C. Thinning effects on stand growth, carbon stocks, and soil properties in Brutia pine plantations. Carbon Balance Manag. 2023, 18, 6. [Google Scholar] [CrossRef] [Scilit] [PubMed]
- Aun, K.; Kukumägi, M.; Varik, M.; Becker, H.; Aosaar, J.; Uri, M.; Uri, V. Short-term effect of thinning on the carbon budget of young and middle-aged silver birch (Betula pendula Roth) stands. For. Ecol. Manag. 2021, 480, 118660. [Google Scholar] [CrossRef] [Scilit]
- Bai, H.S.; Dempsey, R.; Reverchon, F.; Blumfield, T.J.; Ryan, S.; Cernusak, L.A. Effects of forest thinning on soil-plant carbon and nitrogen dynamics. Plant Soil 2017, 411, 437–449. [Google Scholar] [CrossRef] [Scilit]
- Fan, C.W.; Zhou, G.Y.; Chen, H.Y.; Du, Z.G.; Liu, R.Q.; He, Y.H.; Zhou, X.H. Thinning intensity influences the C:N:P stoichiometry in forest ecosystems: A global synthesis. Geoderma 2025, 460, 117435. [Google Scholar] [CrossRef] [Scilit]
- Yue, Y.; Men, X.L.; Sun, Z.H.; Chen, X.W. Effects of Larix olgensis Henry Stumps and Coarse Roots on Phosphorus Fractions and Availability in Plantation Microsite Soils. Forests 2022, 13, 2166. [Google Scholar] [CrossRef] [Scilit]
- Zeng, W.S.; Liao, Z.Y. A study on taper equation. Sci. Silvae Sin. 1997, 33, 32–37. (In Chinese) [Google Scholar]
- Khalid, A.H.; Matthias, S.; Heyns, K. Parameter-Parsimonious taper functions for describing stem profiles. Sci. Silvae Sin. 2008, 44, 20–26. [Google Scholar]
- Hu, C.X.; Yang, S.L.; Jia, W.W. Stem form models and variable parameters of Larix plantations. Chin. J. Appl. Ecol. 2011, 22, 1695–1701. (In Chinese) [Google Scholar] [CrossRef]
- Zhao, D.H.; Lynch, B.T.; Westfall, J.; Coulston, J.; Kane, M.; Adams, W.E. Compatibility, Development, and Estimation of Taper and Volume Equation Systems. For. Sci. 2019, 65, 1–13. [Google Scholar] [CrossRef] [Scilit]
- LY/T 1901-2010; Technical Regulations for Cultivation of Picea koraiensis. China Standard Press: Beijing, China, 2010. (In Chinese)
- LY/T 2118-2013; Guidelines for Cultivation of Large-Diameter Timber Forests. China Standard Press: Beijing, China, 2013. (In Chinese)
- Bao, S.D. Soil and Agricultural Chemistry Analysis, 3rd ed.; China Agriculture Press: Beijing, China, 2000. (In Chinese) [Google Scholar]
- Alef, K.; Nannipieri, P. Methods in Applied Soil Microbiology and Biochemistry; Academic Press: Cambridge, MA, USA, 1995; pp. 569–576. [Google Scholar] [CrossRef] [Scilit]
- Littell, R.C.; Milliken, G.A.; Stroup, W.W.; Wolfinger, R.D.; Schabenberger, O. SAS for Mixed Models, 2nd ed.; SAS Institute Inc.: Cary, NC, USA, 2006. [Google Scholar]
- Rosseel, Y. lavaan: An R Package for Structural Equation Modeling. J. Stat. Softw. 2012, 48, 1–36. [Google Scholar] [CrossRef] [Scilit]
- Niemistö, P.; Valkonen, S. Growth response to thinning in two-storied mixed stands of Scots pine and Norway spruce. Scand. J. For. Res. 2021, 36, 448–459. [Google Scholar] [CrossRef] [Scilit]
- Catherine, C.; Sébastien, D.; Alexandre, M.B.; Hervé, J.; Alexis, A.; Guillaume, M. Potential of thinning to increase forest resilience and resistance to drought, pest, windstorm and fire: A meta-analysis. For. Ecol. Manag. 2025, 590, 122788. [Google Scholar] [CrossRef] [Scilit]
- Ozcelik, R.; Broks, J.R. Compatible volume and taper models for economically important tree species of Turkey. Ann. For. Sci. 2012, 69, 105–118. [Google Scholar] [CrossRef] [Scilit]
- Zhang, H.L.; Liu, S.R.; Yu, J.Y.; Li, J.W.; Shangguan, Z.P.; Deng, L. Thinning increases forest ecosystem carbon stocks. For. Ecol. Manag. 2024, 555, 121702. [Google Scholar] [CrossRef] [Scilit]
- Benedetti-Ruiz, S.; Loewe-Muñoz, V.; Rodrigo, R.D.; Claudia, D.; Luis, B.; Mónica, B. Effect of thinning on growth and shape of Castanea sativa adult tree plantations for timber production in Chile. For. Ecol. Manag. 2023, 530, 120762. [Google Scholar] [CrossRef] [Scilit]
- Deng, C.; Zhang, S.G.; Lu, Y.C.; Froese, R.E.; Xu, X.J.; Zeng, J.; Ming, A.A.; Liu, X.Z.; Xie, Y.S.; Li, Q.F. Thinning effects on forest evolution in Masson pine (Pinus massoniana Lamb.) conversion from pure plantations into mixed forests. For. Ecol. Manag. 2020, 477, 118503. [Google Scholar] [CrossRef] [Scilit]
- Christian, K.; Aaron, R.W.; Robert, G.W.; Brian, E.R. Development and evaluation of individual tree- and stand-level approaches for predicting spruce-fir response to commercial thinning in Maine, USA. For. Ecol. Manag. 2016, 376, 84–95. [Google Scholar] [CrossRef] [Scilit]
- Lee, J.Y.; Zhou, X.; Lee, T.S.; Yang, Y.A.; Yun, J.G.; Lee, H.H.; Kang, H. Thinning enhances forest soil C storage by shifting the soil toward an oligotrophic condition. Sci. Total Environ. 2024, 925, 171745. [Google Scholar] [CrossRef] [Scilit] [PubMed]
- Güney, D.; Atar, F.; Turna, B.; Günlü, A. Effects of precommercial thinning intensity on growth of Fagus orientalis Lipsky stands over 6 years. J. For. Res. 2022, 33, 937–947. [Google Scholar] [CrossRef] [Scilit]
- Liu, X.; Jiao, L.; Cheng, D.; Cheng, D.; Liu, J.B.; Li, Z.S.; Li, Z.L.; Gao, G.Y. Light thinning effectively improves forest soil water replenishment in water-limited areas: Observational evidence from Robinia pseudoacacia plantations on the Loess Plateau, China. J. Hydrol. 2024, 637, 131408. [Google Scholar] [CrossRef] [Scilit]
- Darío, M.B.; Miren, D.R.; Ingo, H.; Gerhard, H.; Isabel, C. Response of climate-growth relationships and water use efficiency to thinning in a Pinus nigra afforestation. For. Ecol. Manag. 2009, 259, 967–975. [Google Scholar] [CrossRef] [Scilit]
- Yu, J.T.; Zhang, X.N.; Xu, C.Y.; Hao, M.H.; Choe, C.H.; He, H.J. Thinning can increase shrub diversity and decrease herb diversity by regulating light and soil environments. Front. Plant Sci. 2022, 13, 948648. [Google Scholar] [CrossRef] [Scilit] [PubMed]
- Lipiec, J.; Hatano, R. Quantification of compaction effects on soil physical properties and crop growth. Geoderma 2003, 116, 107–136. [Google Scholar] [CrossRef] [Scilit]
- Zhang, X.L.; Chen, L.W.; Ying, J.P.; Hu, Y.T.; Ouyang, S.; Wu, H.L.; Lei, P.F.; Kuzyakov, Y.; Xiang, W.H. Plantations thinning: A meta-analysis of consequences for soil properties and microbial functions. Sci. Total Environ. 2023, 877, 162894. [Google Scholar] [CrossRef] [Scilit] [PubMed]
- Xu, H.W.; Gan, Q.; Huang, L.L.; Pan, X.Y.; Pan, T.W.; Wang, R.Y.; Xu, Z.F. Effects of forest thinning on soil microbial biomass and enzyme activity. Catena 2024, 239, 107938. [Google Scholar] [CrossRef] [Scilit]

Disclaimer/Publisher’s Note: The statements, opinions and data contained in all publications are solely those of the individual author(s) and contributor(s) and not of MDPI and/or the editor(s). MDPI and/or the editor(s) disclaim responsibility for any injury to people or property resulting from any ideas, methods, instructions or products referred to in the content. |
© 2026 by the authors. Licensee MDPI, Basel, Switzerland. This article is an open access article distributed under the terms and conditions of the Creative Commons Attribution (CC BY) license.