1. Introduction
As a key mineral resource for China’s energy sector, uranium is fundamental to the development of the nuclear industry. Given the ongoing development and exploitation of uranium resources, it is imperative to precisely assess the influence of uranium mining regions on vegetation ecology. This assessment is crucial for maintaining ecological stability in mining zones and achieving sustainable mineral resource utilization.
The Xiangshan Uranium Mine, located in Fuzhou, Jiangxi Province, stands as China’s largest volcanic rock-type uranium mining deposit and a significant uranium extraction site in southern China. Vegetation in the mining area forms a critical ecosystem surrounding uranium deposits. Soil changes associated with mineralization may affect vegetation growth and canopy structure, leading to unique remote sensing signals. These signatures not only function as vital indicators for ecological monitoring of vegetation in mining areas but also lay a fundamental theoretical groundwork for remote sensing-based mineral prospecting.
At present, scholars across the globe have undertaken comprehensive research on vegetation ecological monitoring in a diverse array of mining regions, encompassing coal mines, metal mines, rare earth mines, and various other mineral categories. In the specific realm of uranium mining, Cai et al. [
1] have summarized the distinctive features and metallogenic patterns of uranium resources in China, emphasizing the ongoing necessity for ecological preservation throughout the process of uranium mining development. Meanwhile, Jin et al. [
2] utilized remote sensing technology to examine the spatiotemporal variations in vegetation coverage both prior to and following the commencement of operations at a uranium mine, revealing a notable decline in vegetation coverage during the mining development phase, followed by a gradual recovery over time.
In the realm of coal and metal mining, Zhao et al. [
3] delved into the spatio-temporal evolution patterns of vegetation greenness in the Xilinhot open-pit coal mining region. Their research uncovered that mining activities led to a substantial decrease in vegetation coverage; however, vegetation greenness rebounded following the implementation of pertinent ecological restoration initiatives. Liu et al. [
4] adeptly employed machine learning algorithms to categorize the vegetation encircling the Anshan iron mining area. Furthermore, in their investigation on vegetation coverage monitoring and spatio-temporal change analysis in the vicinity of the Anshan iron mining site [
5], they quantitatively evaluated the vegetation coverage around the mining area by integrating remote sensing imagery with ground-measured data and GIS technology, thereby furnishing robust data support for ecological restoration endeavors in the mining region. Wei et al. [
6] conducted a time-series analysis of the NDVI and vegetation coverage indices for the spoil ground of the Haizhou open-pit coal mine in China, utilizing remote sensing technology. Their findings demonstrated that these two indices could effectively serve as indicators for assessing vegetation restoration conditions in mining areas.
However, most existing studies rely on time-series remote sensing, focusing on vegetation changes before/after mining and restoration effectiveness. Few studies integrate multi-source data or systematically compare canopy structure between mining and non-mining areas, limiting our understanding of how uranium deposits affect vegetation. Furthermore, systematic investigations leveraging multi-source remote sensing data are still relatively scarce. Additionally, there is a dearth of studies that systematically compare the disparities in forest stand structure of surface vegetation between undeveloped mining regions and non-mining areas. This gap hinders our ability to fully elucidate the potential impact of mining deposits themselves on vegetation ecology.
In addition, diverse vegetation indices are widely used for vegetation ecological monitoring in mining areas. However, Single vegetation indices are easily affected by natural factors such as location and climate. Hui et al. [
7] compared the accuracy of NDVI for monitoring vegetation coverage in open-pit coal mines and confirmed that NDVI shows severe errors in coal-covered areas inside mines, which proves the inherent limitations of single vegetation indices for precise vegetation ecological monitoring. Taking Central Asian grasslands as the research object, Muminov et al. [
8] explored the effects of land use changes on grassland health under three typical human disturbances, including streams, roads, and mining areas, and further proved that a single NDVI cannot effectively distinguish vegetation response discrepancies caused by natural and anthropogenic disturbances. To overcome the weakness of a single NDVI in identifying vegetation ecological anomalies, Hede et al. [
9] proposed the Vegetation Index for Physiological Status (VIGS) derived from reflectance spectra of Landsat ETM+ imagery. This method expands the application scope of remote sensing mineral prospecting from traditional arid and semi-arid regions to densely vegetated areas.
Current studies concerning the Xiangshan uranium mining field have formed a relatively complete technical system covering mining deposit identification and ecological monitoring. Zhuo et al. [
10] carried out mineral prospecting practices by integrating geological, geophysical, geochemical, and remote sensing methods in the Luopo area of Xiangshan uranium mining field, and confirmed that integrated remote sensing approaches can greatly improve prospecting efficiency. Zhong et al. [
11] established a comprehensive information prospecting model for the study area, providing theoretical and practical references for uranium exploration in the adjacent Yuhua Mountain area. Xu et al. [
12] extracted remote sensing mineralization-alteration anomalies in vegetation-covered areas of the Zhuguang Mountain region and conducted prospecting prediction via remote sensing techniques. The results showed that uranium deposits are highly consistent with mineralization-alteration anomaly information, and favorable prospecting areas feature well-developed surface alteration with great potential for further uranium exploration. Zhu et al. [
13] employed InSAR satellite technology to monitor surface deformation across the Xiangshan uranium mining field, verifying that satellite remote sensing is capable of large-scale and long-term surface deformation monitoring, which compensates for the spatial limitations of traditional ground surveys. Despite remarkable progress achieved with advanced remote sensing technologies, the existing prospecting and monitoring system for the Xiangshan uranium mines still faces challenges, including poor regional adaptability of prospecting models and accuracy constraints of vegetation characteristic parameters.
To address the aforementioned constraints, certain scholars have put forward monitoring approaches that integrate multi-source remote sensing data with computational algorithms. Li [
14] conducted a thorough exploration into the utilization of multi-source remote sensing data for constructing a framework aimed at vegetation monitoring in mining regions, thereby establishing a solid foundation for subsequent research predicated on multi-source data fusion. Li et al. [
15] amalgamated satellite remote sensing, unmanned aerial vehicle (UAV) remote sensing, and information technology, complemented by geological surveys, geophysical exploration, and drilling activities, to devise an ecological environment restoration and monitoring model specifically tailored to the Jugeng mining area, yielding favorable application results. Shi et al. [
16] extracted hyperspectral remote sensing prospecting information based on vegetation spectral anomalies, confirming the existence of spectral disparities between analogous vegetation in mining and non-mining areas. These studies offer invaluable prior knowledge for harnessing machine learning algorithms to probe into the impact of mining activities on vegetation ecology, and present novel viewpoints on leveraging the detection of vegetation ecological anomalies as indicator factors for remote sensing prospecting.
Although numerous studies have verified the great potential and advantages of multi-source remote sensing data fusion in vegetation ecological monitoring across various regions, this method has not yet been systematically applied to the Xiangshan Uranium Mining Area in Jiangxi Province. Current research fails to effectively reveal the ecological differences in vegetation between this uranium mining area and ordinary vegetation zones, which further restricts the scientific and efficient development of mineral exploration. Against this background, this study takes the Xiangshan Uranium Mining Area as the core research area and focuses on exploring the potential impacts of uranium deposits on local vegetation growth and canopy structure. By fusing multi-source remote sensing data and adopting the random forest machine learning algorithm, this study retrieves canopy structure parameters and carries out a comprehensive analysis combined with optical vegetation indices. The research results can provide a scientific basis for ecological monitoring, vegetation restoration, and green development in Xiangshan Uranium Mining Area.
2. Methodology
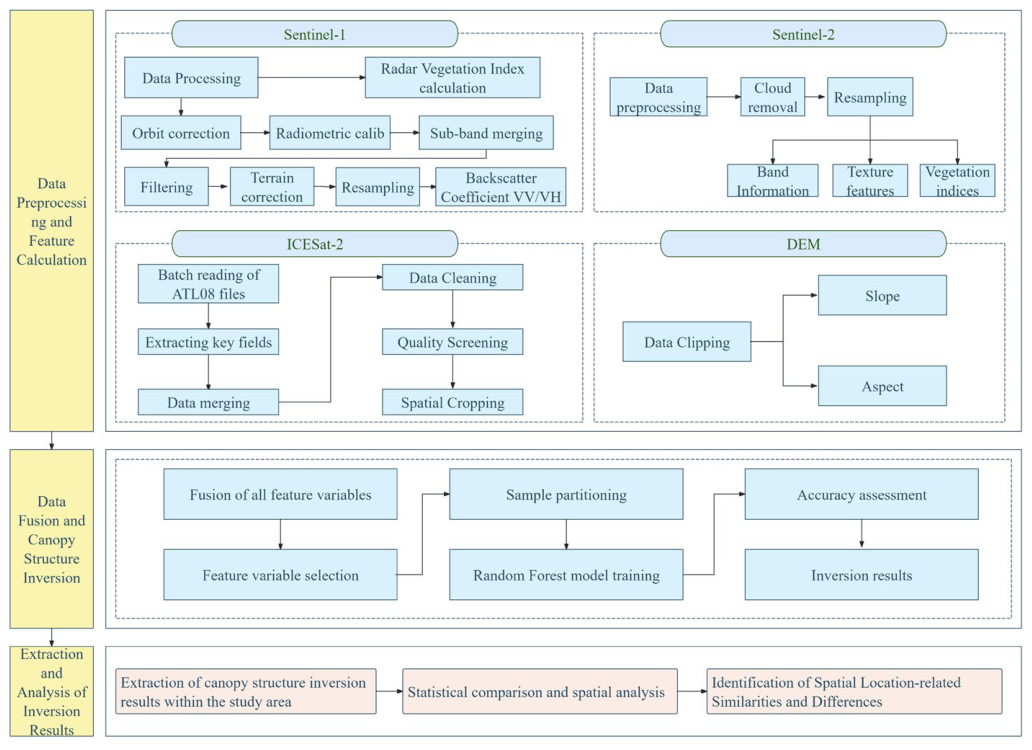
The technical workflow employed in this study is illustrated in
Figure 1. Initially, diverse data types undergo preprocessing to yield valid datasets within the designated target area. Subsequently, RVI is computed from Sentinel-1 data, while slope and aspect are extracted from DEM data. Following the extraction of band information from Sentinel-2 data, vegetation indices and texture features are calculated, and valid data from ICESat-2 are meticulously screened.
Subsequently, all processed results are integrated and screened, then imported into the inversion model as feature variables to invert canopy height and canopy openness in leaf-on and leaf-off periods, thereby eliminating the interference of seasonal factors.
Finally, vegetation indices and canopy structure parameters are extracted from both mining and non-mining areas. Through a combination of statistical comparison and spatial analysis, similarities and disparities in vegetation characteristics across different regions linked to mining deposit locations are discerned.
2.1. Data Preprocessing
To ensure the consistency and compatibility of data from different sources, all datasets were subjected to preprocessing, including cloud masking, radiometric calibration, band extraction, unified projection, and image clipping. Sentinel-1 and Sentinel-2 data were resampled to a uniform spatial resolution of 30 m. The Extract Multi Values to Points tool in ArcGIS10.8 was used to match sample points with feature variables to ensure consistent data spatial scales.
2.1.1. Sentinel-2 Data
Sentinel-2 Level-2A optical remote sensing images were downloaded from the European Space Agency (ESA) Copernicus Data Space Ecosystem. The Level-2A products have been geometrically and radiometrically corrected and resampled to a spatial resolution of 30 m for consistency with Sentinel-1 and DEM data.
2.1.2. Sentinel-1 Data
Two scenes of Sentinel-1 IW SLC data were procured from the ESA Copernicus Data Space Ecosystem. Data preprocessing was executed using SNAP 13.0.0 software, encompassing procedures such as orbit correction, radiometric calibration, band merging, multilooking, and terrain correction. Subsequently, the processed data were exported in ENVI5.6 format.
2.1.3. DEM Data
The DEM was precisely clipped using the boundary vector data of the study area to isolate data pertinent to the target region. Following this, terrain analysis tools within ArcGIS10.8 software were employed to generate terrain factor layers, including slope and aspect.
2.1.4. ICESat-2 LiDAR Data
Priority was given to selecting valid photon data with high quality, along with associated canopy height, canopy openness, and other pertinent information. The data were then clipped to align with the study area boundary. Subsequently, the data were classified into leaf-off period samples (January to March) and leaf-on period samples (August to October), so as to fuse characteristic variables for subsequent model training.
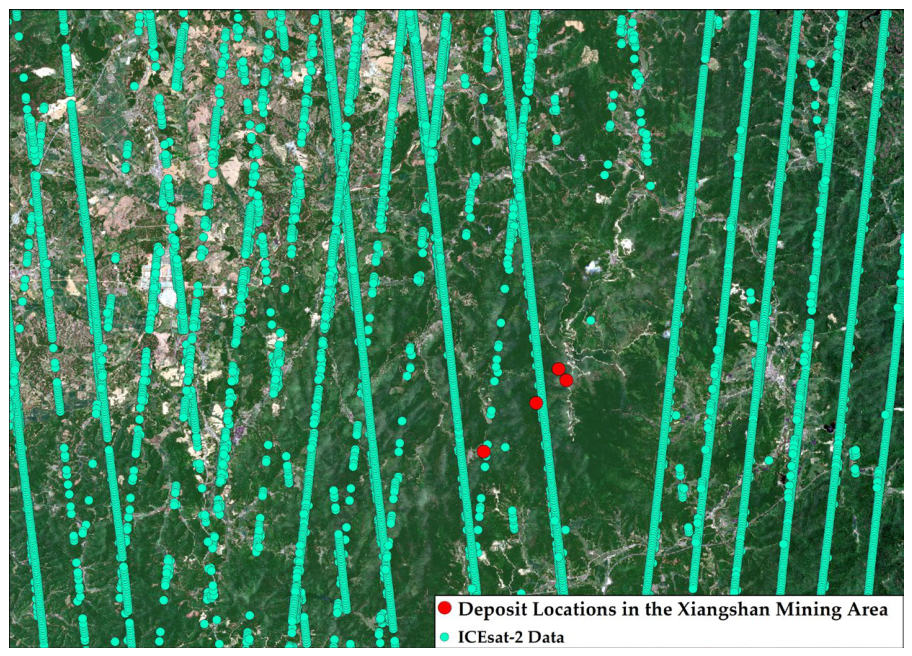
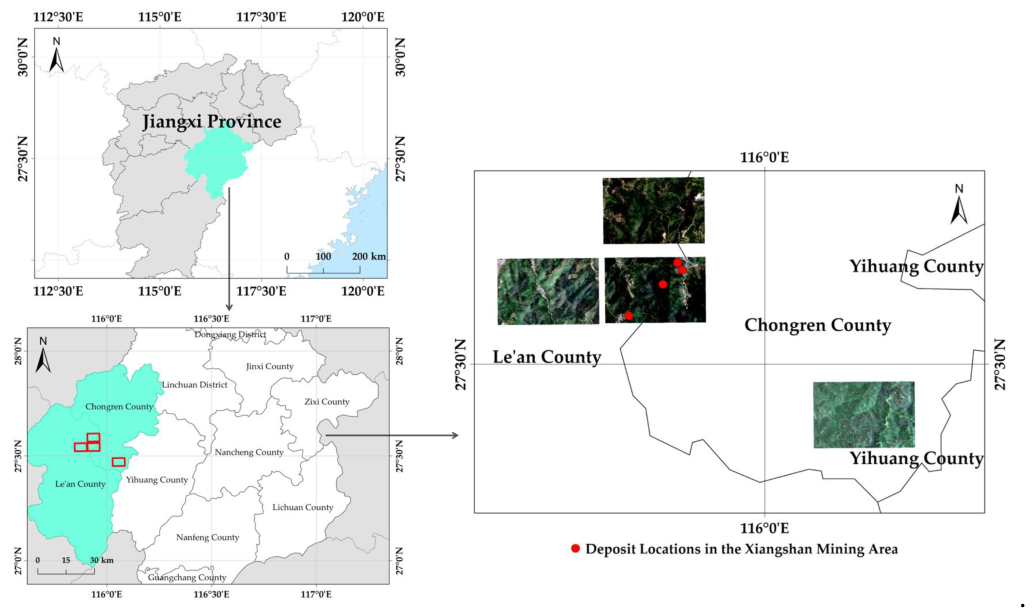
Figure 2 illustrates the spatial distribution of high-quality, valid photon data points within the study area. As evident from
Figure 2, the valid photon data points are uniformly dispersed across the study area with an appropriate density.
2.2. Vegetation Index Calculation
Vegetation indices serve as crucial metrics for monitoring vegetation growth status through remote sensing technology. These indices are generated by applying mathematical combination operations to spectral reflectance values obtained from various bands captured by sensors [
17]. This approach effectively mitigates interference from external factors such as the atmosphere and soil. Given the specific vegetation types and data characteristics of the Xiangshan mining area, seven representative optical vegetation indices and microwave vegetation indices were carefully selected [
18]. The calculation formulas for these indices are detailed in
Table 1.
In the table, Bi (i = 2, 3, 4, 5, 6, 8, 8A) represents the blue, green, red, red edge 1, red edge 2, near-infrared 1, and near-infrared 2 bands of Sentinel-2, respectively. and denote the VH-polarized and VV-polarized backscattering coefficients of Sentinel-1, respectively.
2.3. Canopy Structure Parameter Inversion
2.3.1. Random Forest Regression Model
The Random Forest is an ensemble learning algorithm that comprises multiple decision trees and is employed for both classification and regression tasks. Renowned for its robust resistance to overfitting, effective handling of high-dimensional data, and high computational efficiency [
25], the Random Forest algorithm has found widespread application in remote sensing feature inversion. It operates by randomly and independently extracting sub-sample sets and constructing decision trees independently for computation. During the construction of each decision tree, a random subset of features is selected at each node, from which the optimal feature is chosen for splitting. This approach not only enhances the model’s predictive capability but also demonstrates good tolerance to noise and outliers, mitigates overfitting to a certain extent, and effectively integrates feature variables such as spectral data, texture, and terrain.
In this study, the Random Forest algorithm was implemented using the sklearn library in PyCharm 2023.2.3, a powerful and extensively utilized machine learning library that offers a diverse range of algorithm implementations for tasks including classification, regression, and clustering, encompassing the Random Forest algorithm [
24]. High-quality sample points were selected from valid photon data. Utilizing the extraction and analysis tools within ArcGIS, feature variable values corresponding to each discrete sample point were extracted. The data were subsequently partitioned into training and test sets in an 8:2 ratio for model training, parameter optimization, and accuracy validation. The number of decision trees was configured to 200, and the number of random features was set to one-third of the total independent variables [
26,
27,
28]. Although the inversion model exhibits limited stability in complex terrain scenarios and, due to constraints in the number of valid photon samples, the prediction accuracy carries a degree of uncertainty, the inversion results can still be utilized for relative comparative analysis between regions.
2.3.2. Feature Selection
From the preprocessed optical remote sensing data and SRTM DEM data, 17 feature variables were selected [
26]. The specific descriptions of each feature variable are shown in
Table 2.
Image texture features refer to the characteristics extracted from spectral images that can reflect the spatial structure and spectral information of the image [
29]. In this study, the gray-level co-occurrence matrix (GLCM) was used to extract the mean and dissimilarity texture features of Bands B3, B5, B6, and B8A from Sentinel-2 images. The extraction window was set to 3 × 3, with a direction of 45° (southeast).
2.3.3. Feature Variable Selection Based on Correlation Analysis
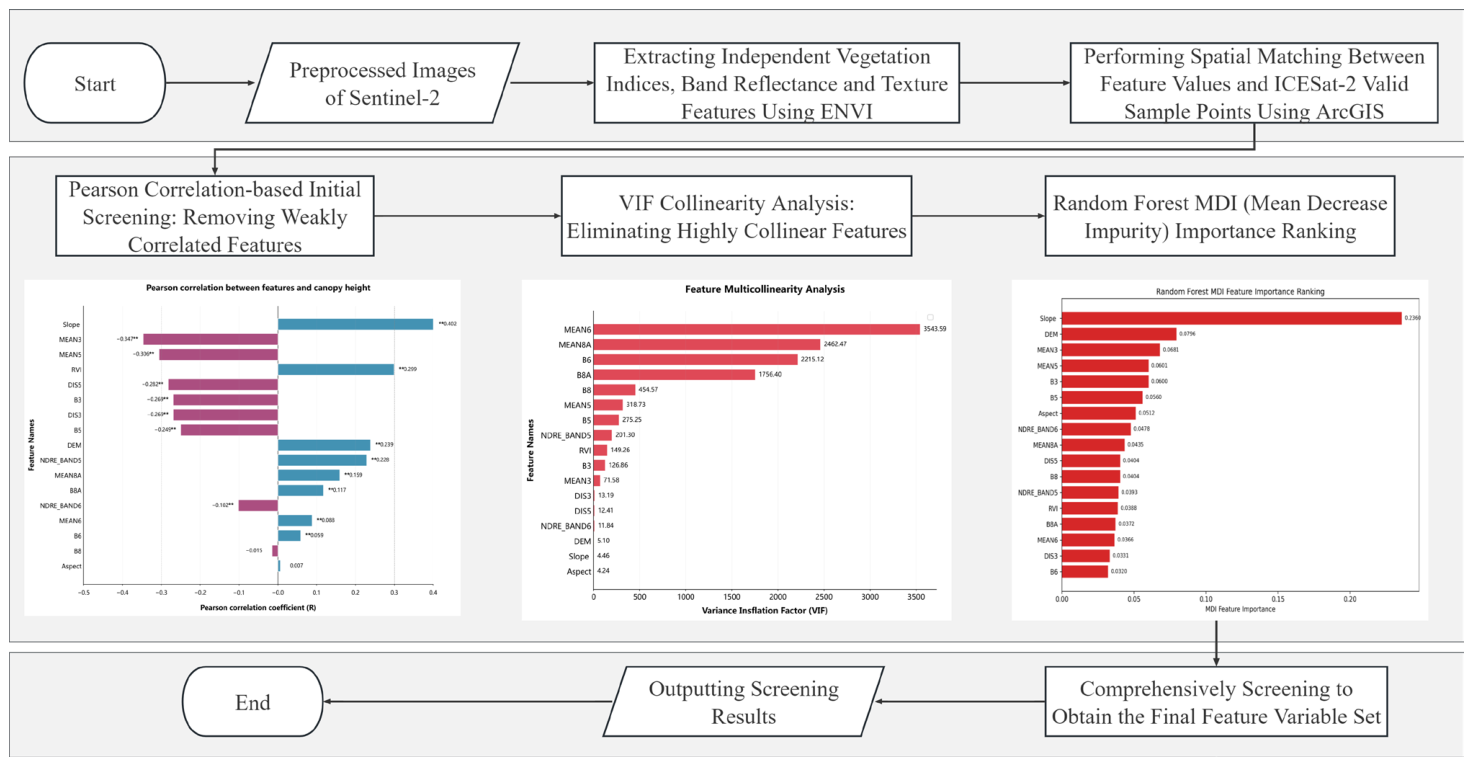
Redundancy among feature variables can compromise the accuracy of the inversion model and its resultant outputs, potentially giving rise to overfitting or diminishing model stability. Consequently, it becomes imperative to filter multi-source remote sensing feature variables prior to their integration into the inversion model. The filtering procedure is illustrated in
Figure 3.
Initially, Pearson correlation analysis was employed to compute the Pearson correlation coefficients between each feature and forest canopy height as well as canopy openness. This process facilitated the elimination of redundant features exhibiting weak correlations while retaining those strongly correlated with canopy height and canopy openness as the candidate feature set. Subsequently, the Variance Inflation Factor (VIF) was utilized to evaluate the extent of multicollinearity among features, leading to the removal of those with excessively high collinearity.
Leveraging the random forest algorithm, feature importance was quantified and ranked using the Mean Decrease Impurity (MDI) method, thereby pinpointing core features that exert a significant influence on the inversion results [
26]. Ultimately, a comprehensive evaluation of the outcomes from these three dimensions was conducted, culminating in the selection of eight feature variables, including slope, DEM, RVI, NDRE_BAND6, MEAN3, DIS5, B3, and B5, as the definitive feature variables for input into the random forest inversion model.
2.3.4. Accuracy Metrics
When evaluating the inversion accuracy of canopy height and canopy openness, the coefficient of determination (R
2) and root mean square error (RMSE) are adopted for assessment. The calculation formulas are presented as follows:
where
is the true observed value,
is the model-predicted value,
is the mean of the true observed values, and
is the total number of samples.
4. Discussion
4.1. Analysis of Error Sources and Limitations
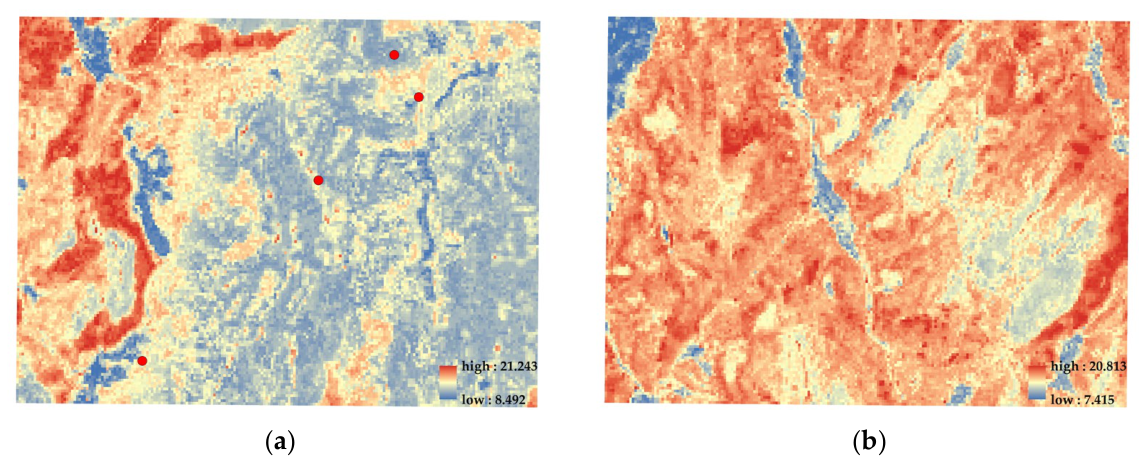
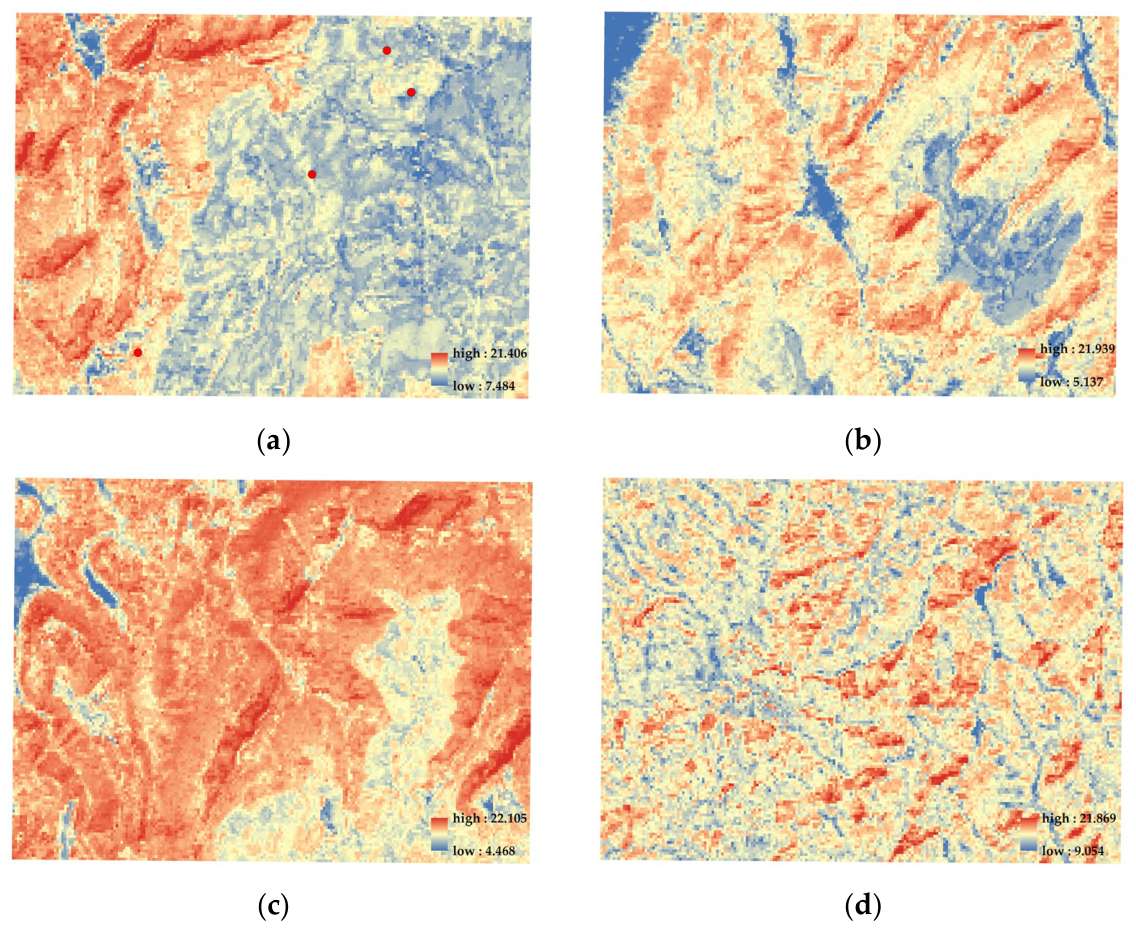
Statistical comparison of inversion results shows that the Xiangshan area has a lower mean canopy height and canopy openness than the Comparison Areas, exhibiting an overall relatively short and dense canopy structure. However, the model achieves limited accuracy on the independent test set, which is consistent with the conclusions of existing studies. Tian et al. [
32] conducted forest canopy height mapping by combining ICESat-2 and Landsat-8 data, with an average canopy height inversion accuracy of R
2 = 0.467 and RMSE = 2.848 m, confirming that differences in vegetation and terrain conditions lead to reduced accuracy. Zhang et al. [
33] further verified that canopy height inversion in areas with vegetation coverage greater than 80% yields R
2 = 0.5 and RMSE = 4.6 m. Wang [
26] systematically validated forest canopy height inversion accuracy, showing that steeper slopes and higher vegetation coverage result in larger errors. When the slope exceeds 20°, R
2 = 0.35 and RMSE = 6.52 m; when vegetation coverage is greater than 80%, R
2 = 0.51 and RMSE = 4.53 m. These studies collectively demonstrate that an R
2 value between 0.3 and 0.5 is a common outcome of current technical approaches for canopy structure inversion in regions with high vegetation coverage and complex terrain. The inversion accuracy of this study is therefore within a reasonable range, though it limits the results to spatial trend analysis rather than supporting precise quantitative assessment.
In addition, due to insufficient valid samples, this study employed Sentinel-2 data from January 2025 (leaf-off period) and August 2025 (leaf-on period), combined with ICESat-2 data from corresponding seasons between 2020 and 2025 for parameter inversion. Temporal mismatches between multi-period LiDAR data and optical imagery may introduce uncertainties into the inversion results. Future research can further improve inversion accuracy by incorporating data with higher temporal and spatial matching precision and integrating field sampling.
4.2. Complementary Analysis of Optical Vegetation Indices and Vegetation Structural Parameters
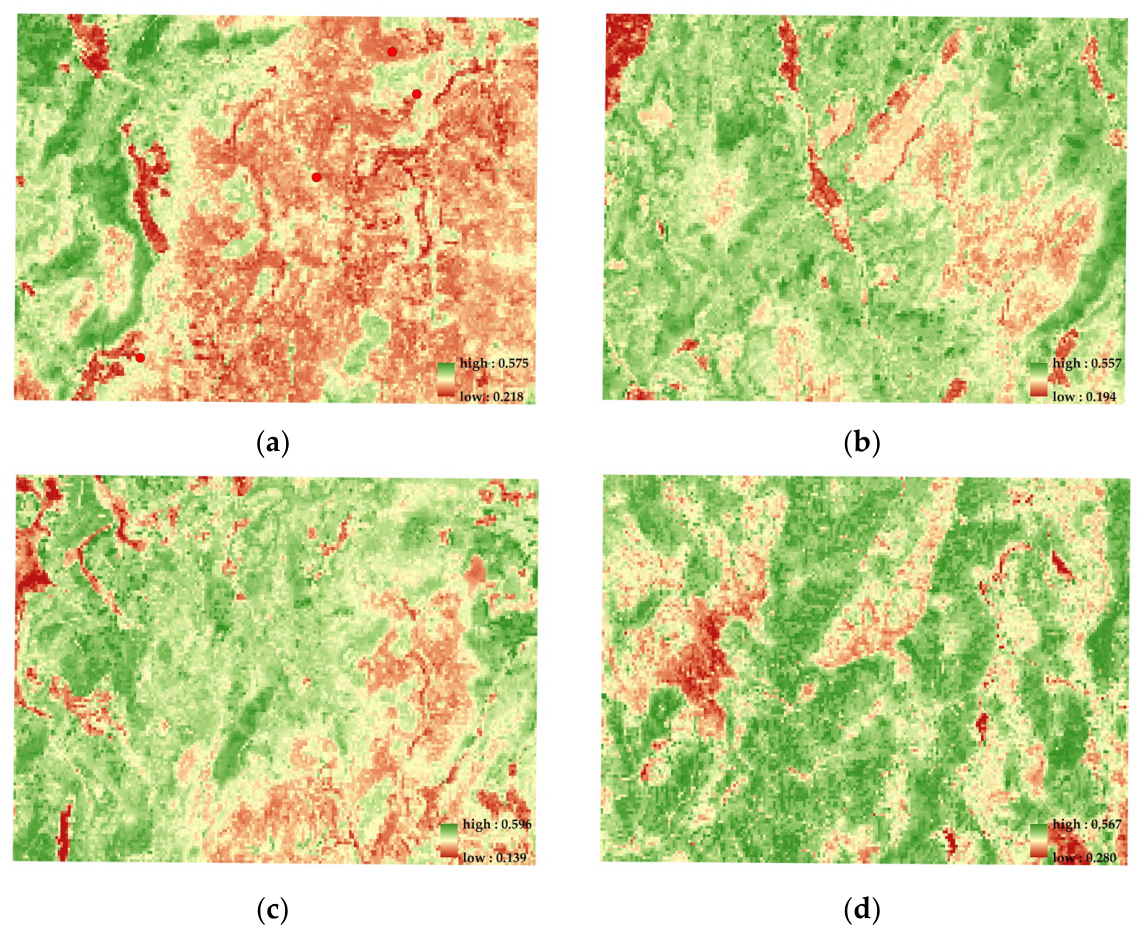
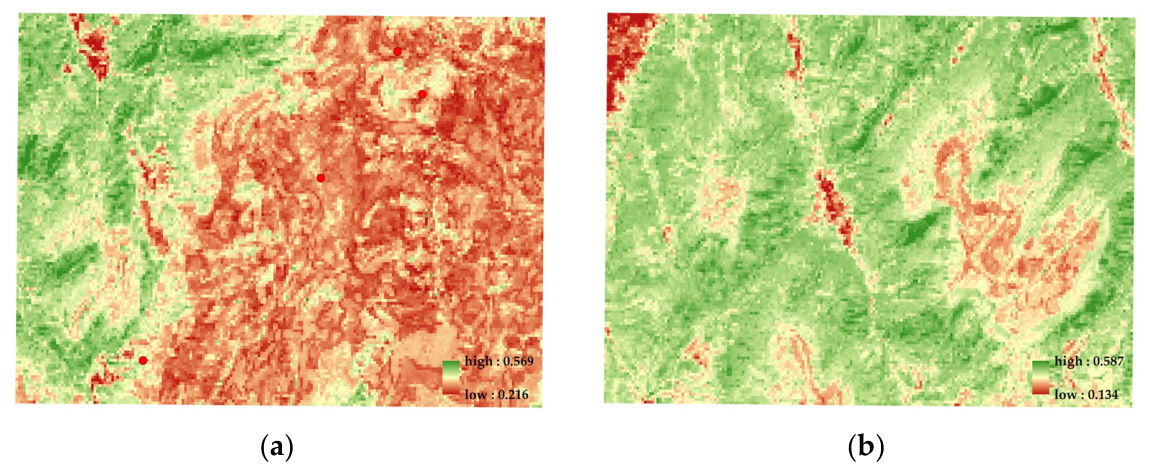
Three categories of vegetation indices with high research value for the study area were selected in this paper: visible-near-infrared vegetation indices (NDVI, EVI), red-edge vegetation indices (CIG, CIRE), and the microwave-based RVI. The aim was to comprehensively analyze the vegetation ecology of the study area from the perspectives of spectral characteristics, physiological status, and structural features. However, the experimental results show no significant differences in optical vegetation indices between the Xiangshan mining area and the Comparison Areas, indicating that the threshold ranges of optical indices alone cannot reveal vegetation structural differences, while RVI exhibits notable disparities. Therefore, two parameters reflecting canopy physical structure—canopy height and canopy openness—were introduced to verify structural variations in the study area.
Existing vegetation anomaly detection methods, such as the Vegetation Index considering Greenness and Shortwave infrared (VIGS), primarily rely on the spectral response of shortwave infrared bands to mineral alteration and vegetation stress to identify anomalies. The method adopted in this study complements such approaches: it performs quantitative inversion by integrating LiDAR data, while also incorporating RVI as supplementary information. Notably, when optical indices (e.g., NDVI, EVI) show no anomalies, structural parameters and RVI already exhibit remarkable differences. This suggests that monitoring schemes incorporating physical structural data may offer greater potential for early anomaly detection than those relying solely on optical indices. A systematic comparative validation of the two approaches can be explored in future research.
4.3. Relationship Between Vegetation Structural Anomalies and Mining Deposit Distribution
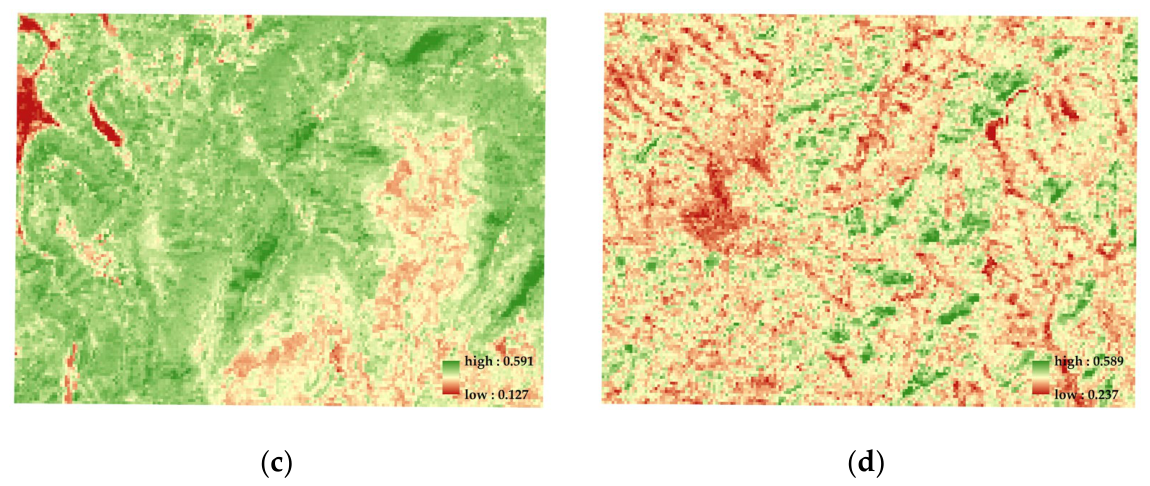
Combining the complementary advantages of optical vegetation indices and vegetation structural parameters, this study confirms that the vegetation in the Xiangshan mining area is characterized by low canopy height and dense canopy structure, which presents a spatially aggregated distribution rather than a random distribution. Despite the limited inversion accuracy, the low-value zones of canopy height and canopy openness maintain consistent spatial aggregation in both leaf-on and leaf-off periods, and such aggregation features are not observed in adjacent areas and primary forest zones.
Restricted by objective conditions, this study has not carried out field verification, and the analysis is mainly based on publicly available spaceborne remote sensing data. In follow-up research, interference from natural conditions, including terrain factors and human activities, should be further eliminated. Combined with field sampling and in situ measurement, the formation mechanism of vegetation ecological anomalies in the mining area can be deeply explored, so as to improve the reliability of applying vegetation ecological differences as an auxiliary indicator for concealed uranium deposit exploration.
5. Conclusions
The Xiangshan Uranium Mining Area in Jiangxi Province stands as a pivotal uranium resource hub in southern China. Nevertheless, there is a relative scarcity of multi-source remote sensing studies focusing on vegetation ecology within this mining area. This scarcity poses challenges in uncovering the potential influence of mining deposits on vegetation ecology and in precisely discerning the disparities in vegetation ecological characteristics between the mining area and typical vegetation zones. As a result, it hampers the ability to offer robust scientific backing for mineral exploration activities in the region.
In view of this, this study adopts multi-source remote sensing data fusion combined with the random forest machine learning algorithm. Firstly, multi-source remote sensing data are preprocessed to obtain valid data covering the entire study area. Afterward, various vegetation indices, spectral band texture features, and topographic factors are extracted to serve as characteristic variables and vegetation ecological evaluation indicators. Core characteristic variables are screened out through correlation analysis and a multicollinearity test. On this basis, a random forest inversion model is constructed to invert canopy structure parameters across the study area, and a comprehensive analysis is carried out on vegetation indicators and inversion results.
The research results demonstrate that there are no significant differences in optical vegetation indices, including NDVI, EVI, and FVC, between the Xiangshan Uranium Mining Area and Comparison Areas, and no obvious disparities are found in vegetation growth status and vegetation coverage. By contrast, RVI in the mining area is distinctly lower. Since RVI is sensitive to canopy structure and soil environment conditions, its low values may indicate damaged vegetation structural integrity or altered soil properties in mining areas, which need to be verified by field survey data in subsequent studies.
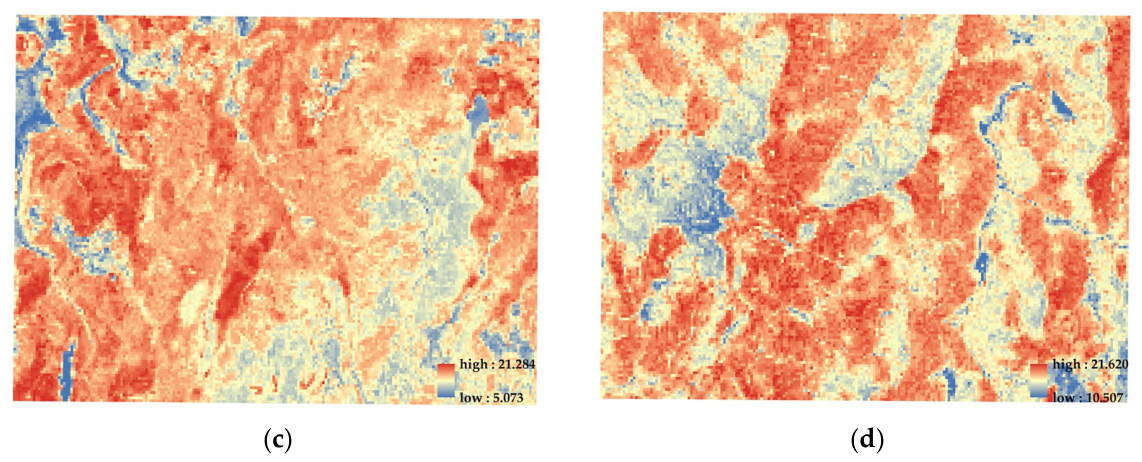
Further analysis on canopy structure indicates that after excluding the interference of climatic factors and within the acceptable range of model accuracy, canopy structure parameters present obvious spatial distribution differences between mining areas and Comparison areas, and such differences are consistent in both leaf-on and leaf-off periods. The inversion results of the Xiangshan mining area show an obvious positive spatial aggregation trend. The low-value zones of canopy height and canopy openness are spatially consistent with the distribution of the Youjiashan deposit, Zoujia deposit, and other mineral deposits, which indicates that vegetation in mining areas tends to grow shorter and denser. In addition, the mining area has a larger proportion of regions with medium and low canopy height and canopy openness values compared with ordinary vegetation areas, proving that identifiable ecological differences exist in canopy structure between vegetation around mining deposits and conventional vegetation zones.
To gain a better understanding of the practical significance of using vegetation in mining areas as an indicator for mineral exploration, future research can continue along this path by further improving data accuracy and conducting more precise analyses of vegetation ecological differences. At the same time, field sampling should be integrated to further examine specific changes in vegetation physiological characteristics and to delve into the underlying reasons for the impact of mining deposits on vegetation ecology.