


Abstract
Plant functional traits help us understand forest carbon storage. We quantified eight functional traits that reflect plant life history strategies: leaf area (LA), specific leaf area (SLA), leaf dry matter content (LDMC), leaf carbon (LC), nitrogen (LN), phosphorus (LP), leaf carbon–nitrogen ratio (LCNR), and wood density (WD). But their role across successional stages is still unclear. We set up sixteen permanent plots in Pu’er, Yunnan, China. Each plot was 60 m × 60 m. The plots covered four successional stages. Stage one was early-successional Simao pine forests. Stage two was mid-successional mixed forests. Stage three was mid-to-late-successional mature mixed forests. Stage four was late-successional mature broad-leaved forests. We measured aboveground carbon storage (CS). We measured carbon growth rates (CAR). We also measured plant traits, soil nutrients, and topography. Carbon storage increased step by step during succession. It became stable in the late stage. Carbon accumulation rate stayed similar across all stages. A key trait axis (LPC2) directly increased carbon storage. LPC2 represents the trade-off between nitrogen use efficiency and leaf construction costs. Environmental factors only affected carbon storage indirectly. They influenced traits first. These results support the metabolic trade-off hypothesis. They also support the leaf economics spectrum theory. Early-successional traits help forests gain biomass quickly. Late-successional traits help forests store carbon for a long time. We suggest protecting mature forests. We also suggest using pioneer species in restoration. This dual strategy can enhance carbon sequestration in subtropical production forests.
1. Introduction
Forests, constituting the largest terrestrial ecosystem by area, possess a vast carbon reservoir and are highly productive. They play an essential role in regulating the global carbon balance, mitigating rising concentrations of greenhouse gases such as CO2, and maintaining global climate stability [1,2]. Forests and their soils store approximately 45% of all terrestrial carbon and are responsible for nearly half of the net primary productivity of terrestrial ecosystems [3]. Over the past three decades, extensive research has established that forest ecosystems function as critical carbon sinks [4]. By absorbing and storing atmospheric carbon dioxide, forests represent a vital tool in combatting climate change; atmospheric carbon is transformed into plant biomass and soil organic carbon [5]. Although soils contain substantial carbon reserves, soil carbon sequestration is exceedingly slow, making short-term monitoring difficult. By contrast, forest biomass accumulation, driven by net primary productivity, serves as the primary driver of overall carbon sequestration and sink capacity [2,6]. Therefore, measuring aboveground carbon stocks and carbon accumulation rates is a viable approach to study forest carbon cycles. This approach allows the quantification of carbon stores in forest ecosystems. It also improves our understanding of carbon flux dynamics.
Compared with biodiversity [7], functional traits can integrate the physiological, morphological and phenological characteristics of plants, and can more sensitively identify ecological processes along a succession gradient [8,9]. They can accurately predict the impact of environmental changes on aboveground carbon storage, and have become a core tool for revealing the mechanism of carbon sink formation. Plant functional traits, such as leaf dry matter content and specific leaf area, mediate adaptive plant strategies in specific environments and are vital for plant growth, reproduction, and survival [10]. The metabolic trade-off hypothesis posits that plants, under conditions of limited resources, must allocate resources among growth, defense, and reproduction [11]. Meanwhile, the leaf economics spectrum describes a continuum of leaf traits ranging from “fast investment–high turnover” to “slow investment–long retention [12]. Functional traits also directly affect carbon cycling dynamics, including the bidirectional regulation of carbon inputs (i.e., scale, form, and retention time) and carbon outputs (i.e., quantity, form, and rate) [13,14]. Species richness and evenness do not fully explain observed variation in forest carbon sinks, likely because these diversity metrics ignore interspecific differences in plant morphology and physiology. In this regard, functional traits may be more useful, as they influence forest biomass and carbon storage efficiency more directly and reveal plant resource acquisition, allocation, and utilization strategies [3,5]. Acquisitive traits promote aboveground carbon accumulation but suppress long-term carbon sequestration [15], whereas conservative traits have the opposite effect. Consequently, as succession progresses, aboveground plant traits associated with rapid resource acquisition are gradually replaced by traits adapted for resource conservation [16,17,18,19]. However, in artificial subtropical mixed forests, acquisitive traits are significantly less common under environmental stress [20]. This suggests that environmental factors significantly regulate plant traits during succession [18]. Furthermore, resource-acquisitive plant species may preferentially allocate carbon to aboveground parts to enhance photosynthesis [21]. By managing root non-structural support long-term growth, these species continuously accumulate aboveground carbon. Overall, the impact of acquisitive versus conservative plant traits on forest carbon sequestration remains contentious. This is particularly true across different successional stages.
Forest succession involves age-dependent shifts in both stand structure and species composition. These transformations are driven by abiotic factors (e.g., climatic and soil properties) and biotic factors (e.g., interspecific competition), which together strongly shape forest carbon sequestration capacity [19,22,23]. In the early stages of succession, trait variation is largely regulated by abiotic factors [24], with trait-environment correlations strengthening as succession progresses [25]. However, the mechanisms driving carbon sink dynamics in subtropical forests remain controversial. Stand structure and tree age are known determinants of aboveground carbon biomass [26]. Meanwhile, species diversity and functional dominance may also promote carbon storage [27]. These latter effects persist even after controlling for forest age and confounding environmental factors. By contrast, in other systems, environmental filtering plays a more decisive role than biotic competition during succession [8]. These discrepancies among studies may arise from interactions between plant communities and environmental factors. Our current understanding of plant functional traits and ecological strategies in evergreen broad-leaved forests remains incomplete [28], particularly in regard to spatiotemporal variation in functional traits in subtropical monsoon evergreen broad-leaved forests and interactions with environmental factors. This constrains in-depth investigations of the mechanisms influencing carbon sink dynamics. These forests are widely distributed across several southern Chinese provinces, including Guangdong [6] and Yunnan [29], where their rich species diversity and complex community structure confer significant carbon sequestration capacity. However, human activities have degraded primary monsoon evergreen broad-leaved forests in the Pu’er region of Yunnan, resulting in communities of different successional stages. While the destruction of primary forests threatens regional ecosystem functioning [6,29], it also offers an opportunity to study carbon dynamics across successional stages.
In this study, we investigated communities at different successional stages in the monsoon evergreen broad-leaved forests of Pu’er, Yunnan. Using a space-for-time substitution approach and long-term monitoring data, we analyzed the distribution of plant functional traits and environmental factors within these forests. Our goal was to explore how these variables mediate carbon sequestration across successional stages. Understanding these relationships not only helps reveal forest carbon sink mechanisms but also provides theoretical support for species selection in industrial forestry, carbon management in bioenergy forests, and the restoration of degraded stands. Guided by the Metabolic Trade-off Hypothesis and Leaf Economics Spectrum theory, this study hypothesizes that: (1) forest carbon storage increases with succession, whereas carbon accumulation rate peaks in mid-succession then stabilizes; (2) plant traits shift from acquisitive to conservative strategies along the successional gradient; and (3) environmental factors indirectly affect carbon accumulation through traits rather than exerting direct control. Our primary research questions were: (1) how do carbon stocks and carbon accumulation rates vary across successional stages in monsoon evergreen broad-leaved forests; (2) how do plant survival strategies shift across successional stages; and (3) how do plant functional traits and environmental factors influence carbon accumulation rates and carbon stocks at different successional stages?
2. Materials and Methods
2.1. Study Area
This study was conducted in the Pu’er Vocational Education Center Training Forest (22.84° N, 100.96° E), Taiyanghe Provincial Nature Reserve (22.58° N, 101.13° E), and the Wanzhangshan Forest Farm in Simao District (22.55° N, 101.28° E), all located within Pu’er City, in Yunnan Province, China. These sites are situated at elevations between 1350 m and 1580 m. The region experiences a subtropical monsoon climate, with a mean annual temperature of 17.7 °C and total annual precipitation of 1548 mm, most of which falls between May and October [30]. The dominant soil type in the area is mountainous red soil.
Within the study area, monsoon evergreen broad-leaved forests are the dominant vegetation type. Human disturbance has led to the formation of evergreen broad-leaved forest communities at various successional stages. In these forests, the canopy layer is largely composed of Castanopsis echinocarpa, Schima wallichii, and Castanopsis hystrix. The shrub layer is primarily composed of Vaccinium exaristatum and Phyllanthus emblica, and the herbaceous layer is dominated by Sclerialevis, with ferns also present. Epiphytes are diverse, primarily consisting of Orchidaceae species and ferns. After human disturbance, monsoon evergreen broad-leaved forests typically transition to Simao pine forests. Through natural succession, the Simao pine forests gradually revert to monsoon evergreen broad-leaved forests.
2.2. Experimental Design
In early 2014, we established permanent monitoring plots at three sites, the Pu’er Vocational Education Center Training Forest, the Taiyanghe Provincial Nature Reserve, and the Wanzhangshan Forest Farm, each comprising different successional stages. The plots included four successional stages defined by stand age: Simao pine forest (early succession, SMPF, stand age < 30 years), mixed coniferous-broadleaf forest (mid-succession, MCF, stand age 30–40 years), old-growth mixed coniferous-broadleaf forest (mid-to-late succession, OMCF, stand age 40–70 years), and old-growth monsoon evergreen broadleaf forest (late succession, OBF, stand age > 70 years). Each succession stage consists of 4 sample plots, each with an area of 60 × 60 square meters. To minimize spatial autocorrelation among plots, all plots were separated by a minimum distance of 100 m. During field surveys, we followed the methodology of Hao et al. [31] and excluded all woody plants with a diameter at breast height (DBH) < 5 cm, as they contribute minimally to forest biomass and produce significant errors in growth equation modeling. All woody plants with DBH ≥ 5 cm were individually measured, and we recorded the species name, DBH, tree height, and location. We also recorded several environmental factors for each plot, including the latitude, longitude, elevation, slope gradient, aspect, slope position, and canopy closure. Soil samples were collected from the 0–20 cm depth [32], as previous studies in this region indicated that >80% of soil organic carbon in these forest soils is concentrated in the surface layer due to rapid litter decomposition and shallow root distribution. For each plot, five cores were taken from five points (four corners + center) and mixed into one composite sample. In 2024, we resurveyed the study plots established in 2014, collecting both vegetation and environmental measurements.
2.3. Functional Trait Determination
We selected eight functional traits that reflect plant life history strategies: the leaf area (LA, mm2), specific leaf area (SLA, mm2 g−1), leaf dry matter content (LDMC, mg g−1), leaf carbon concentration (LC, mg g−1), leaf nitrogen concentration (LN, mg g−1), leaf phosphorus concentration (LP, mg g−1), leaf carbon–nitrogen ratio (LCNR), and wood density (WD, g cm−3). The biological and ecological significance of each trait is summarized in Table 1.
Table 1.
Ecological significance of functional traits examined in this study.
To obtain leaves for functional trait determination, within each plot, we randomly selected 10 individuals for each tree species present, and from each selected tree we collected two fully developed, intact, sun-exposed leaves. For plots with fewer than 10 trees, we uniformly sampled all trees and collected no fewer than 20 leaves in total. We transported the leaves to the laboratory, where the petioles were removed. After weighing, we scanned the leaves to obtain an image of each leaf, which was analyzed using SigmaScan Pro 5.0 (Systat Software Inc., San Jose, CA, USA) to determine the leaf area. The leaves were dried at 60 °C until a constant weight, and then the dry weight was recorded. We pooled the dried leaves by species and used an elemental analyzer to determine their carbon, nitrogen, and phosphorus content. The SLA was calculated as the ratio of the leaf area to the leaf dry weight, while LDMC was the ratio of the leaf dry weight to the water-saturated fresh leaf weight. To avoid damaging sampled trees in the study plots, we estimated stem wood density using branch wood density as a proxy. At the time of leaf sampling, we also collected three to five two-year-old branches from each species. After debarking, we determined the branch volume using the water displacement method. We then dried the branches at 105 °C until a constant weight, then measured the dry weight. Branch density was calculated as the ratio of the dry weight to the volume.
2.4. Soil Sampling
We measured a number of soil physicochemical properties, including the soil organic matter (SOM, g kg−1), pH, total nitrogen (TN, g kg−1), available nitrogen (AN, mg kg−1), total phosphorus (TP, g kg−1), available phosphorus (AP, mg kg−1), total potassium (TK, g kg−1), and available potassium (AK, mg kg−1). We determined the soil pH using an SG2 glass electrode potentiometer in a 1:2.5 (w:v) soil suspension and the soil organic matter (SOM) content using the potassium dichromate-concentrated sulfuric acid method. Total nitrogen was measured using an automatic Kjeldahl nitrogen analyzer, while available nitrogen was assessed via the alkaline diffusion method. Finally, we measured the total phosphorus and available phosphorus using the molybdenum-antimony method and total potassium and available potassium via flame photometry.
2.5. Determination of Forest Carbon Stocks and Carbon Accumulation Rates
Using biomass models specific to the Pu’er region of Yunnan, China, based on DBH and tree height [33,34], along with biomass-to-carbon conversion coefficients [35], we calculated and analyzed changes in carbon stocks (CS, Mg C ha−1) and the carbon accumulation rate (CAR, Mg C ha−1yr−1) across taxonomic levels (species, genus, family) during forest succession.
Based on field measurements of DBH (cm) and height (H, m), we used established allometric equations developed for the study area to estimate the aboveground biomass (AGB) of all individuals with DBH ≥ 5 cm within each plot for both study years (2014 and 2024) [33,34]. In applying these equations, branch wood density was used as a proxy for stem wood density—a practical and common approach in forest biomass estimation, albeit with the recognized limitation that it may not fully capture potential intra-individual variation between these compartments.
Based on this, Aboveground carbon storage (AGC) was then derived by applying a standard carbon conversion factor (0.5) to the aboveground biomass [36]: . The allometric growth equations are provided in Table 2.
Table 2.
Allometric growth equations for the aboveground parts of key woody species.
This study calculates the temporal variation of aboveground carbon storage (CS) to assess the carbon accumulation rate (CAR), thereby reflecting the dynamic efficiency of carbon storage accumulation during different forest succession stages:
The carbon accumulation rate (CAR) was calculated as the net change in aboveground carbon storage (CS) over the 10-year period between the initial survey (CSini; 2013–early 2014) and the resurvey (CSre; 2024). This net change integrates the combined effects of all demographic processes occurring during the monitoring period, including: (1) biomass growth of surviving trees (DBH ≥ 5 cm); (2) biomass accumulation from newly recruited trees that reached the DBH threshold (≥5 cm); and (3) biomass loss due to tree mortality. Therefore, CAR represents the actual net rate of carbon stock change in the forest community over the decade.
2.6. Data Analysis
Prior to analysis, we tested all residuals for normality and homogeneity of variance using Shapiro–Wilk and Levene’s tests, respectively [37]. Data that violated normality assumptions were log-transformed.
We assessed functional trait differences among plant communities by calculating community-weighted mean (CWM) trait values [38]. To compare plant functional traits and environmental factors across successional stages, we used univariate analyses of variance (ANOVAs) and Levene’s tests for homogeneity of variance. Following confirmation of homogeneity of variance, we ran post hoc Tukey’s HSD tests. We generated box plots using R (version 4.3.2, R Foundation for Statistical Computing, Vienna, Austria) to visualize variation in plant functional traits, carbon storage, and carbon accumulation rates across successional stages, and we performed a principal component analysis (PCA) to identify key plant functional traits at each stage. All CWM values were computed using the R package ‘dbFD’, while the one-way ANOVAs and PCA were performed in R using the ‘base’ and ‘ade4’ packages, respectively.
Using PCA, we identified functional traits and environmental factors exhibiting high collinearity within each successional stage; these were excluded from the following analysis. We employed structural equation modeling (SEM) [26,39,40] to quantify the direct and indirect contributions of plant functional traits and environmental factors to carbon accumulation rates and carbon storage across successional stages. In the SEM, we fit model parameters using maximum likelihood estimation, then evaluated model fit based on multiple criteria: the chi-square statistic (x2), the root mean square error of approximation (RMSEA), and the Tucker–Lewis Index (TLI). A good model fit is indicated by a non-significant x2 test (p > 0.05), RMSEA < 0.08, and TLI > 0.90. The Akaike Information Criterion (AIC) was also used for reference, with lower values indicating better fit. We calculated Pearson correlations and performed the SEM using the ‘base’ and ‘lavaan’ packages in R (version 4.3.2), respectively.
3. Results
3.1. Carbon Sequestration Across Successional Stages
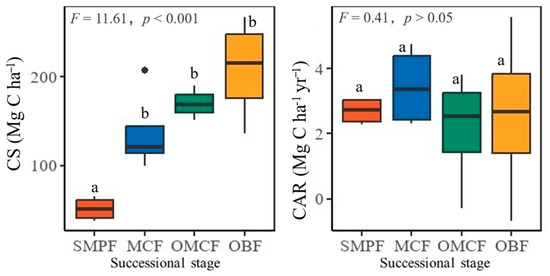
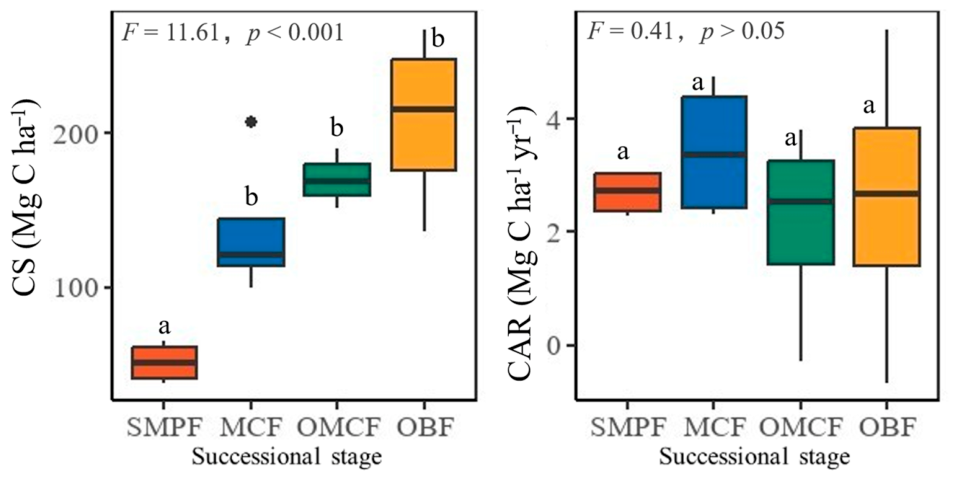
In Figure 1, aboveground carbon storage varied with successional stage, increasing from 51.17 ± 13.26 Mg C ha−1 in early succession to 208.67 ± 58.26 Mg ha−1 in late succession, a 307.8% increase (F = 11.63, p < 0.001). Despite the significant increase in carbon storage, the carbon accumulation rate remained relatively stable across successional stages (p > 0.05), with an average value of 2.60 ± 1.61 Mg Cha−1yr−1 throughout the succession process.
Figure 1.
Aboveground carbon storage and carbon accumulation rates for each successional stage. Note: CS = carbon storage, represents a one-time measurement from field surveys conducted in 2024; CAR = carbon accumulation rate; SMPF = Pinus kesiya var. langbianensis forest; MCF = mixed conifer-broadleaf forest; OMCF = old-growth mixed conifer-broadleaf forest; OBF = old-growth broadleaf forest. Different lowercase letters (a, b) indicate significant differences at p < 0.05.
3.2. Functional Trait and Environmental Variation Across Successional Stages
3.2.1. Functional Trait Variation
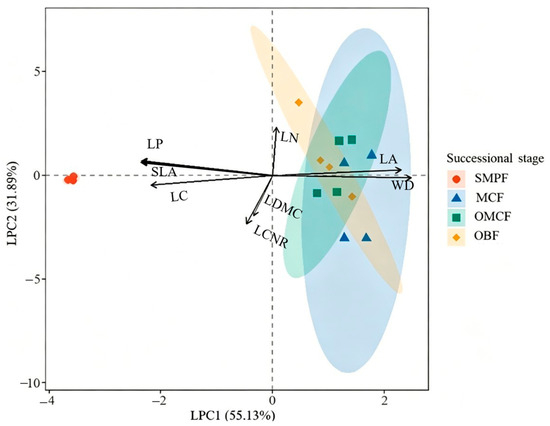
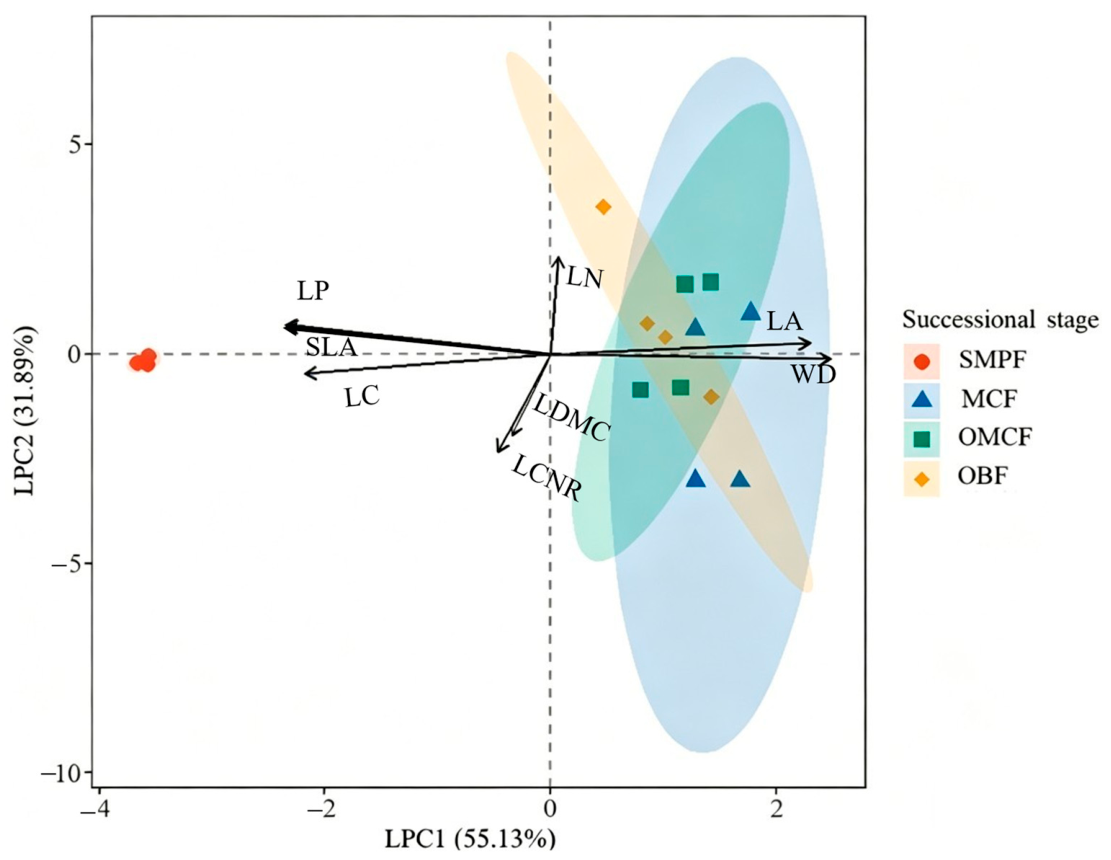
In the PCA (Figure 2), the first two principal components explained 87.01% of the total variance. The first axis (LPC1, Leaf Principal Component 1) represented the resource acquisition-conservation trade-off spectrum. Early succession samples had negative LPC1 values and were characterized by high LC, LP, and SLA; by contrast, samples from later successional stages had positive LPC1 values and exhibited high LA and WD. The second axis (LPC2, Leaf Principal Component 2) captured the trade-off between nitrogen-use efficiency and leaf construction costs. Positive LPC2 values were associated with high LN, which may be correlated with elevated soil nitrogen availability. Negative LPC2 values were associated with low LCNR and LDMC, suggesting enhanced nitrogen-use efficiency and reduced leaf construction costs, both possible adaptations to nutrient-limited environments.
Figure 2.
Principal component analysis (PCA) based on plant functional traits across successional stages; factor loadings are illustrated by arrows in the ordination plot. Note: LA = leaf area; SLA = specific leaf area; LDMC = leaf dry matter content; LC = leaf carbon content; LN = leaf nitrogen content; LP = leaf phosphorus content; LCNR = leaf carbon-to-nitrogen ratio; WD = wood density; SMPF = Pinus kesiya var. langbianensis forest; MCF = mixed conifer-broadleaf forest; OMCF = old-growth mixed conifer-broadleaf forest; OBF = old-growth broadleaf forest; PCA based on community-weighted means of plant functional traits.
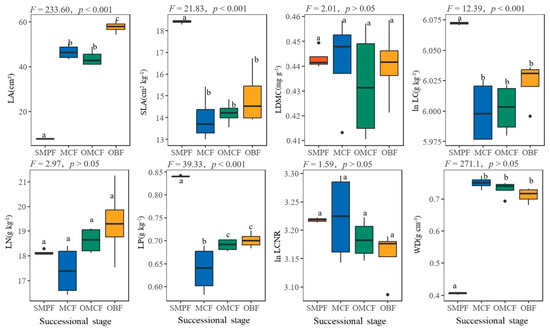
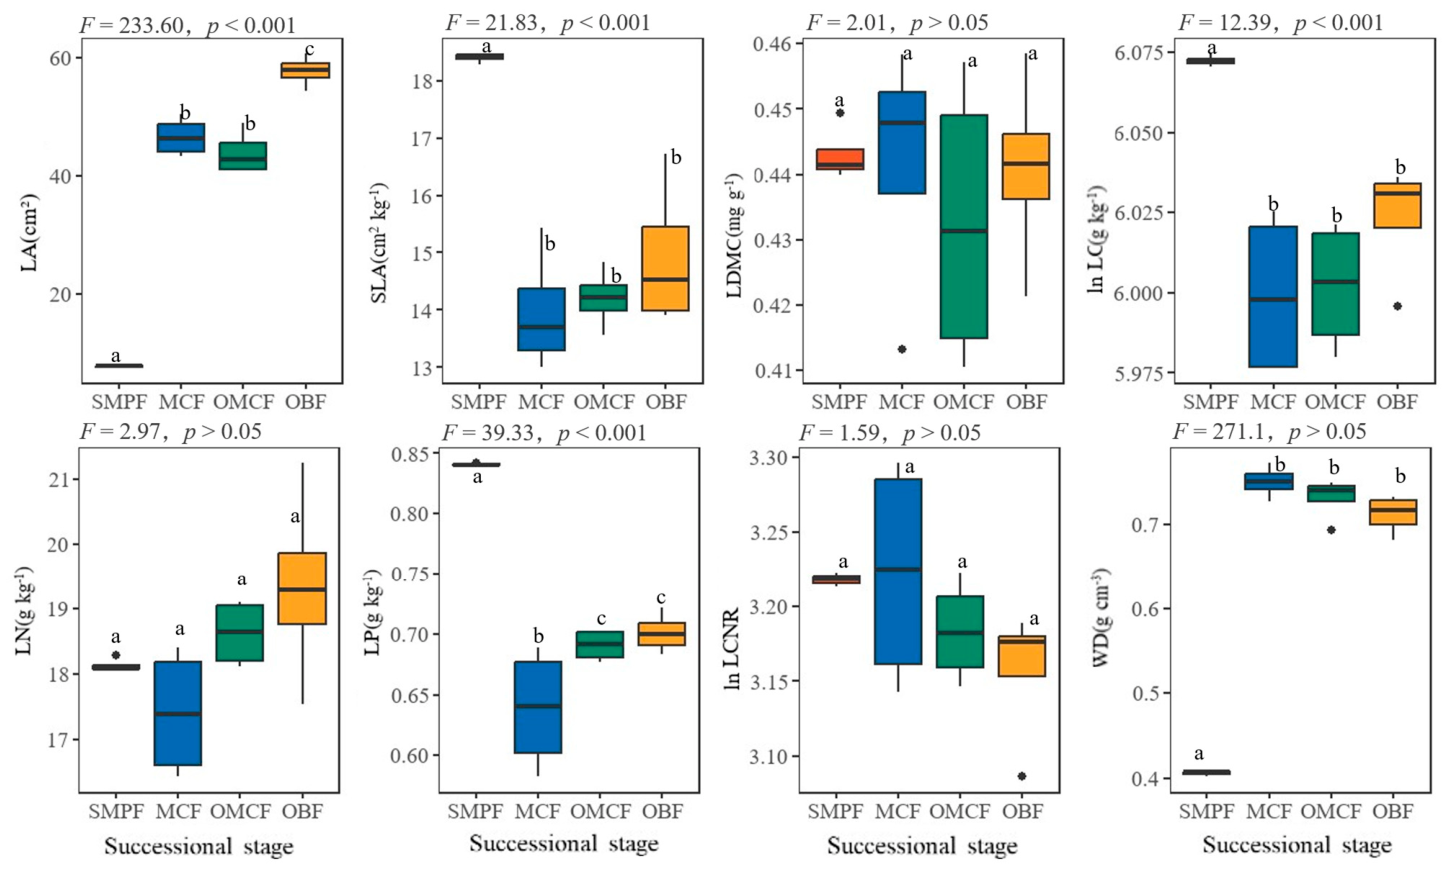
Most functional traits varied significantly across successional stages (p < 0.05), with the exception of LCNR, LDMC, and LN (Figure 3). Both LA and WD increased substantially from early succession to later successional stages, whereas LP and SLA showed the opposite pattern. Trait values in the mid-successional and mid-to-late successional stages tended to be intermediate between early and late succession values but were more closely aligned with late succession values. Notably, LN (17.40 ± 1.00 g kg−1) was minimized in mid-succession samples, whereas LCNR (24.14 ± 2.00) and LDMC (0.44 ± 0.02 mg g−1) were maximized.
Figure 3.
Boxplots illustrating variation in key functional traits across successional stages. Note: Different lowercase letters above boxplots indicate statistically significant differences among successional stages based on one-way ANOVA followed by Tukey’s HSD post hoc test (p < 0.05). LA = leaf area; SLA = specific leaf area; LDMC = leaf dry matter content; LC = leaf carbon content; LN = leaf nitrogen content; LP = leaf phosphorus content; LCNR = leaf carbon-to-nitrogen ratio; WD = wood density; SMPF = Pinus kesiya Royle ex Gordonforest; MCF = mixed conifer-broadleaf forest; OMCF = old-growth mixed conifer-broadleaf forest; OBF = old-growth broadleaf forest.
3.2.2. Environmental Variation
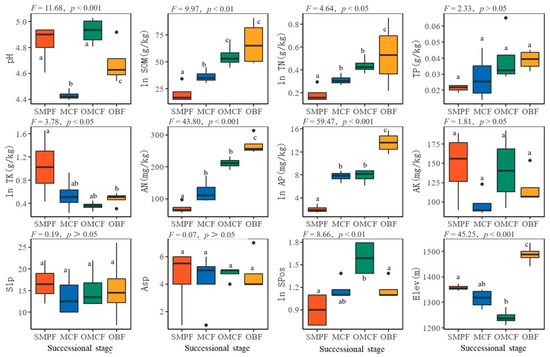
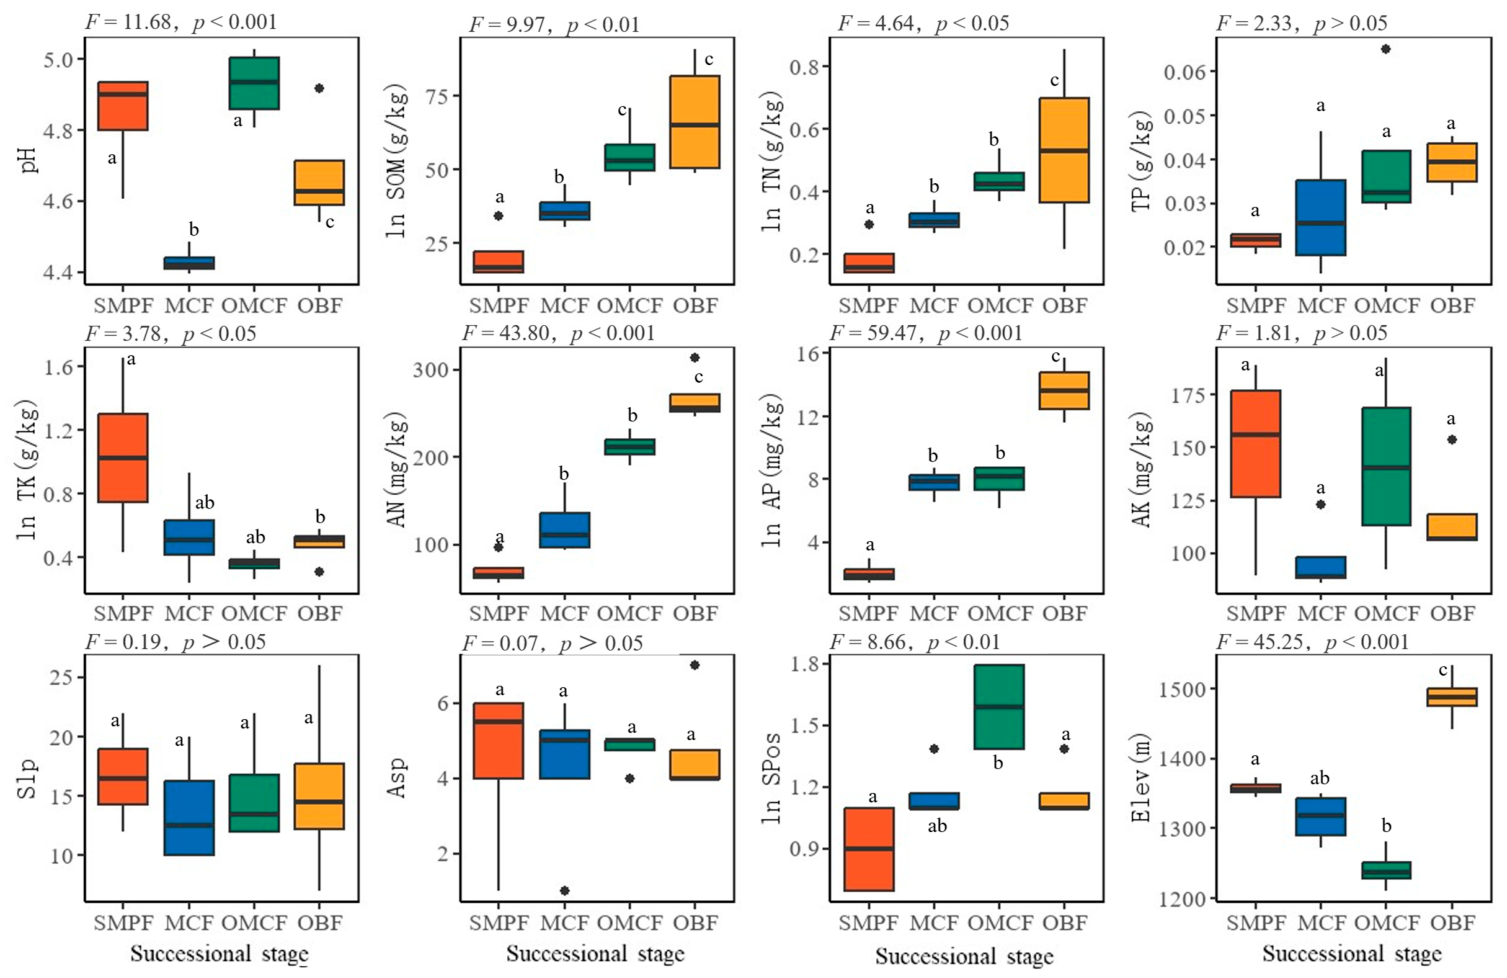
Except for TP (all stages: 6.82 ± 0.45 g kg−1), all other soil factors differed significantly across successional stages (p < 0.001; Figure 4). Specifically, the soil pH and TK were higher in early succession than in the later successional stages (F = 42.42 and 17.07), whereas AN, AP, SOM, and TN showed the opposite pattern (F = 47.74–130.60). Notably, soil pH and AK decreased significantly in the mid-successional stage (p < 0.05), before recovering to early-succession levels in the mid-to-late successional stage (p > 0.05). This pattern reflects the ecological requirements of the pioneer tree species Simao pine (Pinus kesiya var. langbianensis). In terms of topographic factors, the slope (Slp) and aspect (Asp) did not differ among successional stages, whereas the slope position (SPos) and elevation (Elev) varied significantly (F = 8.66 and 45.25, p < 0.01). Specifically, SPos (mid-to-late: 4.00 ± 1.15) differed between the mid-to-late and early/late successional stages, revealing distinct stage-specific characteristics. Elevation (early: 1357.50 ± 11.68 m; mid-to-late: 1241.75 ± 29.94 m; late: 1488.00 ± 37.56 m) first decreased from the early to mid-to-late successional stage, before then increasing in late succession (relative to the other stages).
Figure 4.
Boxplots illustrating variation in key environmental factors across successional stages. Note: Different lowercase letters above boxplots indicate statistically significant differences among successional stages based on one-way ANOVA followed by Tukey’s HSD post hoc test (p < 0.05). SOM = soil organic matter; TN = total nitrogen; TP = total phosphorus; TK = total potassium; AN = available nitrogen; AP = available phosphorus; AK = available potassium; Slp = slope; Asp = aspect; SPos = slope position; Elev = elevation; SMPF = Pinus kesiya var. langbianensis forest; MCF = mixed conifer-broadleaf forest; OMCF = old-growth mixed conifer-broadleaf forest; OBF = old-growth broadleaf forest.
3.3. Relationships Among Key Functional Traits, Environmental Factors, and Carbon Storage
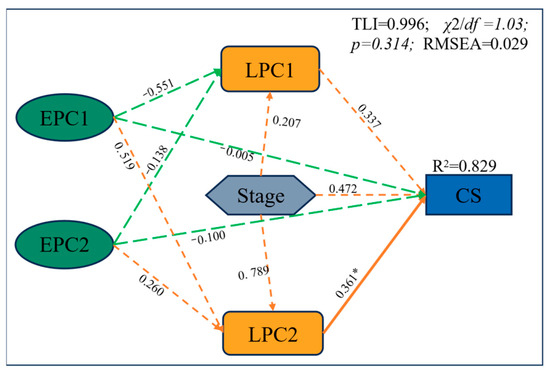
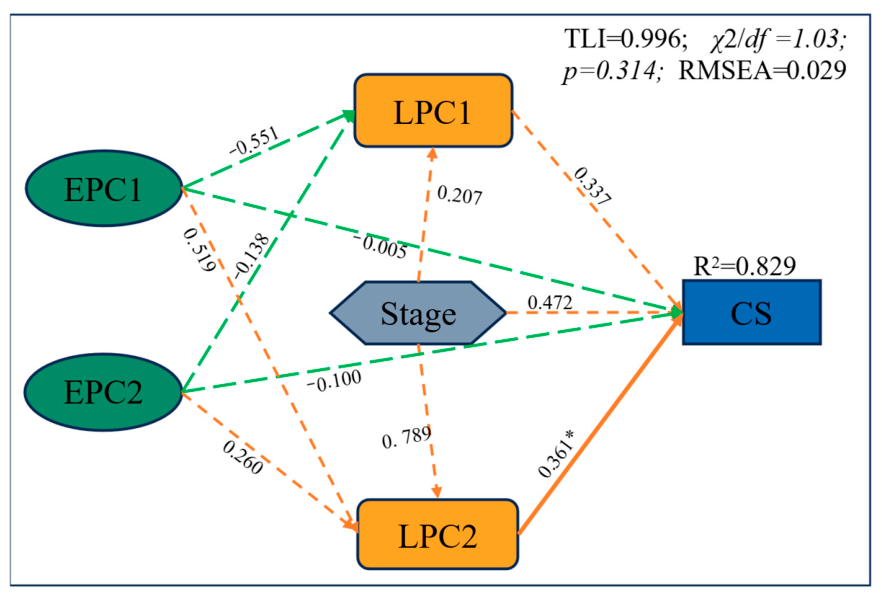
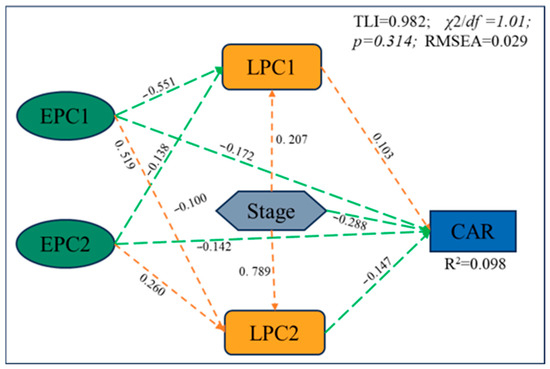
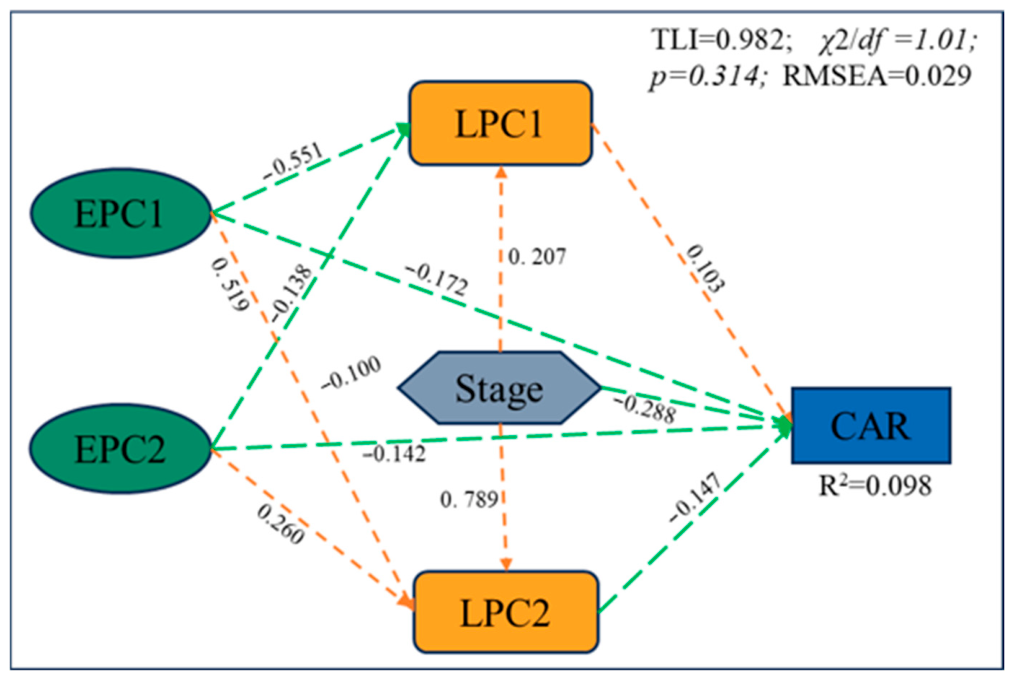
Structural equation modeling (SEM; Figure 5 and Figure 6) resulted in a good model fit (RMSEA < 0.08; TLI > 0.9). The model explained 82.9% of the variance in carbon storage (CS) and 9.8% of the variance in the carbon accumulation rate (CAR). For CS, the plant functional trait axis LPC2 (nitrogen nutrition vs. construction cost trade-off) showed a statistically significant positive direct effect (β = 0.361, p < 0.05). The effect of LPC1 (acquisition-conservation gradient) was positive but did not reach statistical significance at the p < 0.05 level (β = 0.337, p > 0.05). The direct effects of successional stage (Stage: β = 0.472, p > 0.05) and the environmental principal components EPC1 (soil fertility) and EPC2 (soil acidity-extractable k gradient) were non-significant. For CAR, none of the hypothesized direct pathways were statistically significant (p > 0.05).
Figure 5.
Structural equation model of carbon storage in forests of different successional stages. EPC1 (environmental principal component 1) represents a soil fertility gradient; EPC2 represents a soil acidity-extractable k gradient (see Supplementary Material Figure S1 for full interpretation). LPC1 represents an acquisition–conservation gradient. LPC2 represents a nitrogen nutrition vs. construction cost trade-off. PCA was applied to reduce dimensionality and collinearity among original variables. Orange lines indicate positive effects, while green lines indicate negative effects. Solid lines represent significant paths, and dashed lines represent non-significant paths. Model fit was good as indicated by RMSEA < 0.05, TLI > 0.90, and 1 < x2/df < 3. Note: * p < 0.05.
Figure 6.
Structural equation model of carbon growth in forests of different successional stages. EPC1 (environmental principal component 1) represents a soil fertility gradient; EPC2 represents a soil acidity-extractable k gradient (see Supplementary Material Figure S1 for full interpretation). LPC1 represents an acquisition–conservation gradient. LPC2 represents a nitrogen nutrition vs. construction cost trade-off. PCA was applied to reduce dimensionality and collinearity among original variables. Orange lines indicate positive effects, while green lines indicate negative effects. Solid lines represent significant paths, and dashed lines represent non-significant paths. Model fit was good as indicated by RMSEA < 0.05, TLI > 0.90, and 1 < x2/df < 3.
4. Discussion
4.1. Changes in Carbon Sequestration During Succession
Based on our findings, we observed that the rate of carbon accumulation (CAR) in the monsoon evergreen broad-leaved forest did not differ significantly across successional stages (p > 0.05). This observation differs from the conventional theory that predicts a “mid-succession peak” in forest carbon accumulation [41]. Structural equation modeling (SEM) further indicated that the constructed model had limited explanatory power for CAR variation (R2 = 0.098), and none of the hypothesized direct pathways—including the effect of carbon storage on CAR—were statistically significant (p > 0.05). In contrast, Carbon storage (CS), however, increased significantly during succession (F = 11.63, p < 0.001), rising by 307.8% from early to late stages. The SEM model explained most CS variation (R2 = 0.829), with plant functional trait axis LPC2 showing a significant positive direct effect (β = 0.361, p > 0.05). LPC1 had a positive but non-significant effect (β = 0.337, p > 0.05). Successional stage and other predictors (EPC1, EPC2) showed no significant direct effects on CS.
The stability of CAR may be explained by regional hydrothermal stability [42] and the increasing dominance of stand structure over species diversity during later succession [43,44]. Concurrently, plant communities shifted from resource-acquisitive to conservative strategies along the successional gradient. This functional convergence, combined with optimal resource utilization during mid-succession [45], likely contributed to maintaining a consistent carbon accumulation rate throughout succession.
These patterns align with the metabolic trade-off hypothesis [11], where plants balance resources among growth, defense, and reproduction. In late succession, stabilized ecosystem functions and intensified competition may constrain further increases in carbon accumulation, leading to resource reallocation toward reproduction and defense [46]. Nevertheless, continuous carbon storage accumulation highlights the critical role of mature forests in long-term carbon sequestration.
For forest restoration, our findings emphasize dual priorities: protecting mature forests for their carbon storage value and enhancing early-successional strategies to boost carbon sink potential. The substantial carbon gains during early to mid-succession suggest that targeted pioneer species selection and diversity promotion could effectively accelerate both carbon sequestration and successional development [8,47].
4.2. Changes in Plant Functional Traits and Resource Utilization Strategies During Succession
During the succession of subtropical monsoon evergreen broad-leaved forests, plant functional traits and resource-use strategies closely interacted with environmental factors. PCA revealed that loadings on LPC1 and LPC2 reflected a trade-off spectrum from resource-acquisitive to conservative strategies, with early stages characterized by high LC, LP, and SLA, and later stages by high LA and WD (Figure 2). In early succession, pioneer species exhibited high trait homogeneity and rapid growth through high LC, LP, and SLA, supporting high growth rates [18,48]. However, soils at this stage had higher pH and TK but lower AN, AP, SOM, and TN, potentially limiting nitrogen and phosphorus uptake [49].
As succession advanced, plant strategies shifted from acquisitive to conservative [50,51], accompanied by a marked increase in soil fertility (AN, AP, SOM, and TN) (Figure 4). Concurrently, LA and WD increased, enhancing light capture [52], while LP and SLA decreased, indicating a shift toward long-term conservative strategies [53,54]. The consistent rise in LA also highlighted the persistent importance of photosynthetic efficiency and light use throughout succession [55,56].
Aboveground carbon storage in late succession reached 208.67 ± 58.26 Mg C ha−1, representing a 307.8% increase from early stages, largely driven by higher LA and WD. Unlike some previous studies [46,57], LDMC did not vary significantly across succession stages in this study and was highest in mid-succession (0.44 ± 0.02 mg g−1), while LN was lowest at this stage (17.40 ± 1.00 g kg−1). This pattern may be linked to the observed mid-successional decline and subsequent recovery in soil pH and AK. High LDMC is typically associated with efficient resource use in nutrient-poor soils [7], here, the high LCNR and LDMC in mid-succession may reflect maintained conservative strategies even under increased nitrogen availability.
4.3. Plant Functional Trait and Environmental Effects on Carbon Sequestration During Succession
Plant functional traits significantly influenced CS, with LPC2 emerging as a core positive predictor of CS (β = 0.361, p < 0.05). This finding corroborates the leaf economics spectrum theory and underscores the pivotal role of nitrogen-use efficiency in the trade-off captured by LPC2 [55]. It also suggests that plants in this system may adopt a strategy that emphasizes enhanced nitrogen-use efficiency under nutrient-limited conditions (as indicated by negative LPC2 values), rather than a uniform increase in LN, which was minimized in mid-succession (17.40 ± 1.00 g kg−1).
Furthermore, environmental factors, particularly soil properties, likely influenced CS indirectly through their effects on plant functional traits, as suggested by the PCA where soil fertility (e.g., AN, AP, SOM, TN) was associated with shifts along the trait axes (Figure 2 and Figure 4). Accordingly, the constructed SEM (Figure 5) did not show statistically significant direct effects from the environmental composite variables EPC1 and EPC2 to CS (p > 0.05). The non-significance of these and other pathways likely stems from complex, nonlinear interactions among multiple biotic and abiotic factors, the integrated effects of which can obscure the role of any single variable or path [56,57]. Notably, the direct effect of successional stage on CS was not statistically significant (β = 0.472, p > 0.05), suggesting that its influence on carbon storage was likely mediated indirectly through pathways such as long-term shifts in plant functional strategies and stand structure development [43,44]. It should be noted that the SEM analysis in this study has a limitation: constrained by the sample size (n = 16), we could only test a single parsimonious model based on strong theoretical priors, and were unable to systematically compare the merits of multiple competing models. Future research with larger sample sizes could validate or extend the path model proposed here.
5. Conclusions
This study reveals an association between successional stage, leaf functional traits, and aboveground carbon storage in subtropical monsoon evergreen broad-leaved forests. Aboveground carbon storage increased substantially from early to late succession (by 307.8%). This increase covaries with a shift in plant functional traits toward resource-conservative strategies, particularly along the nitrogen-use efficiency axis (LPC2). These patterns are consistent with both the metabolic trade-off hypothesis and leaf economics spectrum theory. In contrast, the carbon accumulation rate did not differ significantly across successional stages, which does not support the conventional mid-succession peak theory. Structural equation modeling suggests that functional traits are more strongly associated with carbon storage dynamics than successional stage or environmental factors in this model. The findings highlight the potential importance of mature forests for long-term carbon sequestration and imply that restoration efforts could benefit from both the protection of late-successional forests and strategic enhancement of early-successional stands to maximize carbon sink potential.
Supplementary Materials
The following supporting information can be downloaded at: https://www.mdpi.com/article/10.3390/f17060660/s1. Figure S1. Principal component analysis (PCA) based on environmental factors across successional stages; factor loadings are illustrated by arrows in the ordination plot.
Author Contributions
F.D.: Writing—review & editing, Methodology, Investigation. J.Q.: Writing—original draft, Investigation, Formal analysis, Conceptualization, Software. Y.Z.: Formal analysis, Data curation. W.L.: Writing—review & editing, Funding acquisition, Conceptualization. All authors have read and agreed to the published version of the manuscript.
Funding
This work was funded by the Basic Research Funding of the Chinese Academy of Forestry (CAFYBB2025ZA017-04), the Yunnan Key Research and Development Program (202403AC100028), and the Research on Carbon Sequestration and Emission Reduction Technologies for Artificial Forests and Grasslands in the Central Yunnan Region (4530000HT202314770), and Scientific Research and Innovation Project of Postgraduate Students in the Academic Degree of Yunnan University (KC-24249290).
Data Availability Statement
Data will be made available on request.
Acknowledgments
We thank the field assistants and laboratory staff for their help with data collection and sample analysis.
Conflicts of Interest
The authors declare that they have no known competing financial interests or personal relationships that could have appeared to influence the work reported in this paper.
References
- Pan, S.; Yu, P.T.; Wang, Y.H.; Wang, Z.; Yuan, C.X.; Yu, Z.J.; Hu, Y.Q.; Xiong, W.; Xu, L. Spatial distribution of carbon density for forest vegetation and the influencing factors in Liupan Mountains of Ningxia, NW China. Acta Ecol. Sin. 2014, 34, 6666–6677. [Google Scholar] [CrossRef] [Scilit]
- Zhang, Y.; Yi, A.J. Forest Carbon Sink Value Accounting and Related Issues Study in Chengde City. Innov. Sci. Technol. 2022, 22, 83–92. [Google Scholar] [CrossRef]
- McGarvey, J.C.; Thompson, J.R.; Epstein, H.E.; Shugart, H.H. Carbon storage in old-growth forests of the Mid-Atlantic: Toward better understanding the eastern forest carbon sink. Ecology 2015, 96, 311–317. [Google Scholar] [CrossRef] [Scilit] [PubMed]
- Friedlingstein, P.; O’Sullivan, M.; Jones, M.W.; Andrew, R.M.; Hauck, J.; Olsen, A.; Peters, G.P.; Peters, W.; Pongratz, J.; Sitch, S.; et al. Global Carbon Budget 2020. Earth Syst. Sci. Data 2020, 12, 3269–3340. [Google Scholar] [CrossRef] [Scilit]
- Augusto, L.; Boca, A. Tree functional traits, forest biomass, and tree species diversity interact with site properties to drive forest soil carbon. Nat. Commun. 2022, 13, 1097. [Google Scholar] [CrossRef] [Scilit] [PubMed]
- Yang, S.; Ma, L.; Chen, Y.; Tang, X. Characteristics of Soil Bacteria Community in Forests Along Monsoon Evergreen Broadleaved Forest Successional Sequence in Dinghushan National Nature Reserve. Ecol. Environ. Sci. 2022, 31, 2275–2282. [Google Scholar] [CrossRef]
- Liu, X.; Trogisch, S.; He, J.-S.; Niklaus, P.A.; Bruelheide, H.; Tang, Z.; Erfmeier, A.; Scherer-Lorenzen, M.; Pietsch, K.A.; Yang, B.; et al. Tree species richness increases ecosystem carbon storage in subtropical forests. Proc. R. Soc. B Biol. Sci. 2018, 285, 20181240. [Google Scholar] [CrossRef] [Scilit]
- Han, T.; Ren, H.; Hui, D.; Zhu, Y.; Lu, H.; Guo, Q.; Wang, J. Dominant ecological processes and plant functional strategies change during the succession of a subtropical forest. Ecol. Indic. 2023, 146, 109885. [Google Scholar] [CrossRef] [Scilit]
- Klumpp, K.; Soussana, J.-F. Using functional traits to predict grassland ecosystem change: A mathematical test of the response-and-effect trait approach. Glob. Change Biol. 2009, 15, 2921–2934. [Google Scholar] [CrossRef] [Scilit]
- Poorter, L.; Bongers, F. Leaf traits are good predictors of plant performance across 53 rain forest species. Ecology 2006, 87, 1733–1743. [Google Scholar] [CrossRef] [Scilit]
- Wang, M.; Lu, N.; An, N.; Fu, B. A Trait-Based Approach for Understanding Changes in Carbon Sequestration in Semi-Arid Grassland During Succession. Ecosystems 2022, 25, 155–171. [Google Scholar] [CrossRef] [Scilit]
- Matsuo, T.; Martinez-Ramos, M.; Onoda, Y.; Bongers, F.; Lohbeck, M.; Poorter, L. Light competition drives species replacement during secondary tropical forest succession. Oecologia 2024, 205, 1–11. [Google Scholar] [CrossRef] [Scilit]
- Díaz, S.; Cabido, M. Vive la différence: Plant functional diversity matters to ecosystem processes. Trends Ecol. Evol. 2001, 16, 646–655. [Google Scholar] [CrossRef] [Scilit]
- Wang, P.; Sheng, L.X.; Yan, H.; Zhou, D.W.; Song, Y.T. Plant functional traits influence soil carbon sequestration in wetland ecosystem. Acta Ecol. Sin. 2010, 30, 6990–7000. [Google Scholar] [CrossRef]
- Rada, F.; Sarmiento, L.; Garcia-Varela, S. Plant functional traits along an old-field succession in the high tropical andes. Acta Oecol. 2021, 111, 103738. [Google Scholar] [CrossRef] [Scilit]
- An, H. Generality of leaf traits relationships of dominant species along the secondary succession in the Loess Plateau of China. Afr. J. Biotechnol. 2012, 11, 12240–12248. [Google Scholar] [CrossRef] [Scilit]
- Bauters, M.; Vercleyen, O.; Vanlauwe, B.; Six, J.; Bonyoma, B.; Badjoko, H.; Hubau, W.; Hoyt, A.; Boudin, M.; Verbeeck, H.; et al. Long-term recovery of the functional community assembly and carbon pools in an african tropical forest succession. Biotropica 2019, 51, 319–329. [Google Scholar] [CrossRef] [Scilit]
- Reich, P.B. The world-wide “fast-slow” plant economics spectrum: A traits manifesto. J. Ecol. 2014, 102, 275–301. [Google Scholar] [CrossRef] [Scilit]
- Suter, M.; Edwards, P.J. Convergent succession of plant communities is linked to species’ functional traits. Perspect. Plant Ecol. Evol. Syst. 2013, 15, 217–225. [Google Scholar] [CrossRef] [Scilit]
- Li, Y.P.; Pan, L.J.; Chen, J.; Xu, H.; Yang, L.X. Response and influencing factors of leaf functional traits to forest succession in subtropical mixed plantations. Biodivers. Sci. 2024, 32, 6–18. [Google Scholar] [CrossRef] [Scilit]
- Zhang, P.; Ding, J.; Wang, Q.; McDowell, N.G.; Kong, D.; Tong, Y.; Yin, H. Contrasting coordination of non-structural carbohydrates with leaf and root economic strategies of alpine coniferous forests. New Phytol. 2024, 243, 580–590. [Google Scholar] [CrossRef] [Scilit]
- Li, Y.; Yang, F.; Ou, Y.; Zhang, D.; Liu, J.; Chu, G.; Zhang, Y.; Otieno, D.; Zhou, G. Changes in Forest Soil Properties in Different Successional Stages in Lower Tropical China. PLoS ONE 2013, 8, e81359. [Google Scholar] [CrossRef] [Scilit]
- Satdichanh, M.; Ma, H.; Yan, K.; Dossa, G.G.O.; Winowiecki, L.; Vagen, T.G.; Gassner, A.; Xu, J.; Harrison, R.D. Phylogenetic diversity correlated with above-ground biomass production during forest succession: Evidence from tropical forests in southeast Asia. J. Ecol. 2019, 107, 1419–1432. [Google Scholar] [CrossRef] [Scilit]
- Douma, J.C.; de Haan, M.W.A.; Aerts, R.; Witte, J.P.M.; van Bodegom, P.M. Succession-induced trait shifts across a wide range of NW European ecosystems are driven by light and modulated by initial abiotic conditions. J. Ecol. 2012, 100, 366–380. [Google Scholar] [CrossRef] [Scilit]
- Campetella, G.; Botta-Dukat, Z.; Wellstein, C.; Canullo, R.; Gatto, S.; Chelli, S.; Mucina, L.; Bartha, S. Patterns of plant trait-environment relationships along a forest succession chronosequence. Agric. Ecosyst. Environ. 2011, 145, 38–48. [Google Scholar] [CrossRef] [Scilit]
- Ali, A.; Yan, E.R.; Chen, H.Y.H.; Chang, S.X.; Zhao, Y.T.; Yang, X.D.; Xu, M.-S. Stand structural diversity rather than species diversity enhances aboveground carbon storage in secondary subtropical forests in Eastern China. Biogeosciences 2016, 13, 4627–4635. [Google Scholar] [CrossRef] [Scilit]
- Li, Y.; Bao, W.; Bongers, F.; Chen, B.; Chen, G.; Guo, K.; Jiang, M.; Lai, J.; Lin, D.; Liu, C.; et al. Drivers of tree carbon storage in subtropical forests. Sci. Total Environ. 2019, 654, 684–693. [Google Scholar] [CrossRef] [Scilit]
- Wang, N.; Lv, T.; Wang, L.; Chen, S.; Xie, L.; Fang, Y.; Ding, H. Leaf functional traits and ecological strategies of common plant species in evergreen broad-leaved forests on Huangshan Mountain. J. For. Res. 2024, 35, 130. [Google Scholar] [CrossRef] [Scilit]
- Wang, M.; Chen, Z.; Li, S.; Huang, X.; Lang, X.; Hu, Z.; Shang, R.; Liu, W. Spatial pattern of dominant species with different seed dispersal modes in a monsoon evergreen broad-leaved forest in Pu’er, Yunnan Province. Biodivers. Sci. 2023, 31, 23147. [Google Scholar] [CrossRef] [Scilit]
- Li, S.; Lang, X.; Huang, X.; Wang, Y.; Tang, R.; Liu, W.; Xu, C.; Su, J. Effects of plant diversity and big-sized trees on ecosystem function in a tropical montane evergreen broad-leaved forest. Front. Ecol. Evol. 2023, 11, 1188161. [Google Scholar] [CrossRef] [Scilit]
- Hao, M.; Dai, Y.; Yue, Q. Relationship between functional diversity of broadleaved Korean pine forest and forest carbon sink function. J. Beijing For. Univ. 2022, 44, 68–76. [Google Scholar] [CrossRef]
- Jiang, Q.; Jia, L.; Chen, Y.; Yang, Z.; Chen, S.; Xiong, D.; Liu, X.; Wang, X.; Yao, X.; Chen, T.; et al. Substrate and adenylate limit subtropical tree fine-root respiration under soil warming. Plant Cell Environ. 2023, 46, 2827–2840. [Google Scholar] [CrossRef] [Scilit]
- Wu, Z.L.; Dang, C.L. Biomass of the Pinus kesiya Royle ex Gordonforest in the Pu’er region of Yunnan, China. J. Yunnan Univ. 1992, 14, 119–127. [Google Scholar]
- Dang, C.L.; Wu, Z.L. Study on Biomass of the Castanopsis echidnocarpa Community in Monsoon Evergreen Broad-Leaved Forests. J. Yunnan Univ. 1992, 14, 95–107. [Google Scholar]
- Zhai, K.Y.; Yin, P.; Revillini, D.; Chen, X.L.; Liu, S.E.; Lou, Y.L.; Zhang, W.; Wang, S.; Zhou, G.; Delgado-Baquerizo, M. Subordinate tree species diversity explains carbon stock better than dominant tree diversity after decades of forest rewilding. J. Appl. Ecol. 2025, 62, 604–616. [Google Scholar] [CrossRef] [Scilit]
- Luo, W.; Kim, H.S.; Zhao, X.; Ryu, D.; Jung, I.; Cho, H.; Harris, N.; Ghosh, S.; Zhang, C.; Liang, J. New forest biomass carbon stock estimates in Northeast Asia based on multisource data. Glob. Change Biol. 2020, 26, 7045–7066. [Google Scholar] [CrossRef] [Scilit]
- Le Bagousse-Pinguet, Y.; Gross, N.; Maestre, F.T.; Maire, V.; de Bello, F.; Fonseca, C.R.; Kattge, J.; Valencia, E.; Leps, J.; Liancourt, P. Testing the environmental filtering concept in global drylands. J. Ecol. 2017, 105, 1058–1069. [Google Scholar] [CrossRef] [Scilit]
- Deng, F.; Xiao, L.; Huang, J.; Luo, H.; Zang, R. Changes in Leaf Functional Traits Driven by Environmental Filtration in Different Monsoon Tropical Forest Types. Forests 2023, 14, 2101. [Google Scholar] [CrossRef] [Scilit]
- Schweiger, A.K.; Schutz, M.; Risch, A.C.; Kneubuhler, M.; Haller, R.; Schaepman, M.E. How to predict plant functional types using imaging spectroscopy: Linking vegetation community traits, plant functional types and spectral response. Methods Ecol. Evol. 2017, 8, 86–95. [Google Scholar] [CrossRef] [Scilit]
- van der Sande, M.T.; Pena-Claros, M.; Ascarrunz, N.; Arets, E.J.M.M.; Licona, J.C.; Toledo, M.; Poorter, L. Abiotic and biotic drivers of biomass change in a Neotropical forest. J. Ecol. 2017, 105, 1223–1234. [Google Scholar] [CrossRef] [Scilit]
- Pan, Y.; Birdsey, R.A.; Fang, J.; Houghton, R.; Kauppi, P.E.; Kurz, W.A.; Phillips, O.L.; Shvidenko, A.; Lewis, S.L.; Canadell, J.G.; et al. A large and persistent carbon sink in the world’s forests. Science 2011, 333, 988–993. [Google Scholar] [CrossRef] [Scilit] [PubMed]
- Wen, D.; He, N. Forest carbon storage along the north-south transect of eastern China: Spatial patterns, allocation, and influencing factors. Ecol. Indic. 2016, 61, 960–967. [Google Scholar] [CrossRef] [Scilit]
- Ali, A.; Lin, S.; He, J.; Kong, F.; Yu, J.; Jiang, H. Big-sized trees overrule remaining trees’ attributes and species richness as determinants of aboveground biomass in tropical forests. Glob. Change Biol. 2019, 25, 2810–2824. [Google Scholar] [CrossRef] [Scilit]
- Lohbeck, M.; Poorter, L.; Martinez-Ramos, M.; Bongers, F. Biomass is the main driver of changes in ecosystem process rates during tropical forest succession. Ecology 2015, 96, 1242–1252. [Google Scholar] [CrossRef] [Scilit] [PubMed]
- Loreau, M.; Hector, A. Partitioning selection and complementarity in biodiversity experiments. Nature 2001, 413, 548. [Google Scholar] [CrossRef] [Scilit]
- Kelemen, A.; Tothmeresz, B.; Valko, O.; Miglecz, T.; Deak, B.; Torok, P. New aspects of grassland recovery in old-fields revealed by trait-based analyses of perennial-crop-mediated succession. Ecol. Evol. 2017, 7, 2432–2440. [Google Scholar] [CrossRef] [Scilit] [PubMed]
- Chai, Y.; Dang, H.; Yue, M.; Xu, J.; Zhang, L.; Quan, J.; Guo, Y.; Li, T.; Wang, L.; Wang, M.; et al. The role of intraspecific trait variability and soil properties in community assembly during forest secondary succession. Ecosphere 2019, 10, e02940. [Google Scholar] [CrossRef] [Scilit]
- Weigelt, A.; Mommer, L.; Andraczek, K.; Iversen, C.M.; Bergmann, J.; Bruelheide, H.; Fan, Y.; Freschet, G.T.; Guerrero-Ramírez, N.R.; Kattge, J.; et al. An integrated framework of plant form and function: The belowground perspective. New Phytol. 2021, 232, 42–59. [Google Scholar] [CrossRef] [Scilit]
- Wright, I.J.; Reich, P.B.; Westoby, M.; Ackerly, D.D.; Baruch, Z.; Bongers, F.; Cavender-Bares, J.; Chapin, T.; Cornelissen, J.H.C.; Diemer, M.; et al. The worldwide leaf economics spectrum. Nature 2004, 428, 821–827. [Google Scholar] [CrossRef] [Scilit]
- Poorter, L.; Rozendaal, D.M.A.; Bongers, F.; de Almeida-Cortez, J.S.; Zambrano, A.M.A.; Álvarez, F.S.; Andrade, J.L.; Villa, L.F.A.; Balvanera, P.; Becknell, J.M.; et al. Wet and dry tropical forests show opposite successional pathways in wood density but converge over time. Nat. Ecol. Evol. 2019, 3, 928–934. [Google Scholar] [CrossRef] [Scilit]
- Faccion, G.; Alves, A.M.; do Espirito-Santo, M.M.; Silva, J.O.; Sanchez-Azofeifa, A.; Ferreira, K.F. Intra- and interspecific variations on plant functional traits along a successional gradient in a Brazilian tropical dry forest. Flora 2021, 279, 151815. [Google Scholar] [CrossRef] [Scilit]
- Okubo, S.; Tomatsu, A.; Parikesit Muhamad, D.; Harashina, K.; Takeuchi, K. Leaf functional traits and functional diversity of multistoried agroforests in West Java, Indonesia. Agric. Ecosyst. Environ. 2012, 149, 91–99. [Google Scholar] [CrossRef] [Scilit]
- Lasky, J.R.; Uriarte, M.; Boukili, V.K.; Chazdon, R.L. Trait-mediated assembly processes predict successional changes in community diversity of tropical forests. Proc. Natl. Acad. Sci. USA 2014, 111, 5616–5621. [Google Scholar] [CrossRef] [Scilit] [PubMed]
- van der Plas, F.; Manning, P.; Allan, E.; Scherer-Lorenzen, M.; Verheyen, K.; Wirth, C.; Zavala, M.A.; Hector, A.; Ampoorter, E.; Baeten, L.; et al. Jack-of-all-trades effects drive biodiversity–ecosystem multifunctionality relationships in European forests. Nat. Commun. 2016, 7, 11109. [Google Scholar] [CrossRef] [Scilit] [PubMed]
- Onoda, Y.; Westoby, M.; Adler, P.B.; Choong, A.M.F.; Clissold, F.J.; Cornelissen, J.H.C.; Díaz, S.; Dominy, N.J.; Elgart, A.; Enrico, L.; et al. Global patterns of leaf mechanical properties. Ecol. Lett. 2011, 14, 301–312. [Google Scholar] [CrossRef] [Scilit]
- Díaz, S.; Kattge, J.; Cornelissen, J.H.C.; Wright, I.J.; Lavorel, S.; Dray, S.; Reu, B.; Kleyer, M.; Wirth, C.; Prentice, I.C.; et al. The global spectrum of plant form and function. Nature 2016, 529, 167–171. [Google Scholar] [CrossRef] [Scilit]
- Buzzard, V.; Hulshof, C.M.; Birt, T.; Violle, C.; Enquist, B.J. Re-growing a tropical dry forest: Functional plant trait composition and community assembly during succession. Funct. Ecol. 2016, 30, 1006–1013. [Google Scholar] [CrossRef] [Scilit]

Disclaimer/Publisher’s Note: The statements, opinions and data contained in all publications are solely those of the individual author(s) and contributor(s) and not of MDPI and/or the editor(s). MDPI and/or the editor(s) disclaim responsibility for any injury to people or property resulting from any ideas, methods, instructions or products referred to in the content. |
© 2026 by the authors. Licensee MDPI, Basel, Switzerland. This article is an open access article distributed under the terms and conditions of the Creative Commons Attribution (CC BY) license.