Article

Multi-Organ Nutrient Imbalances Underpin Drought-Induced Dieback in Scots Pine

by
Ester González de Andrés
1,2,*,
Antonio Gazol
2,
José Ignacio Querejeta
3 and
Jesús Julio Camarero
2
1
Department of Physical Geography and Geoecology, Faculty of Science, Charles University, Albertov 6, 12843 Prague, Czech Republic
2
Instituto Pirenaico de Ecología (IPE-CSIC), Avda. Montañana 1005, 50059 Zaragoza, Spain
3
Centro de Edafología y Biología Aplicada del Segura (CEBAS-CSIC), Campus de Espinardo, 30100 Murcia, Spain
*
Author to whom correspondence should be addressed.
Forests 2026, 17(6), 657; https://doi.org/10.3390/f17060657
Submission received: 5 May 2026 / Revised: 25 May 2026 / Accepted: 26 May 2026 / Published: 28 May 2026
(This article belongs to the Special Issue Forest Resilience to Extreme Climatic Events)

Abstract

The increasing frequency and intensity of hotter droughts are driving widespread forest dieback, yet the role of tree nutritional status in drought-induced growth dieback remains poorly understood. We investigated how nutrient composition across tissues (leaves, wood) relates to water use patterns and growth resilience in rear-edge populations of Scots pine (Pinus sylvestris L.) in Northeastern Spain. Using a multi-proxy approach, we combined analyses of foliar and sapwood nutrient concentrations, stable isotopes (δ13C, δ18O), and dendrochronological indicators across contrasting tree vigor classes. Defoliated trees exhibited pronounced shifts in elemental composition, including depletion of foliar K and increased concentrations of Ca, S, and Fe, alongside higher intrinsic water use efficiency and reduced growth resistance to drought. In contrast, the sapwood elemental composition was less responsive to defoliation but showed stronger associations with isotopic signals and drought resilience, suggesting its integrative role in tree functioning. Coordination of nutrient concentrations between tissues was limited, suggesting organ-specific regulation of nutrient allocation under drought stress. Our results reveal that nutrient imbalances are linked to water–carbon dynamics and drought responses and emphasize the importance of considering multi-organ nutrient dynamics to improve our understanding of long-term nutritional imbalances during drought-induced forest dieback.

1. Introduction

Climate-change-driven increases in the frequency and intensity of so-called hotter droughts have led to widespread forest dieback and growth decline [1,2]. Pervasive drought-induced tree mortality, along with subsequent shifts in forest structure and dynamics, threatens the local persistence of some tree populations [3] and eventually undermines the role of forests as carbon sinks [4]. The drought-prone Mediterranean Basin—where many temperate tree species reach their xeric southern distribution limits—has recently experienced an increase in dieback and mortality events [5]. Rear-edge populations of Scots pine (Pinus sylvestris L.) are no exception [6]. A mechanistic understanding of drought-induced dieback of Scots pine is essential to inform adaptive management strategies for this broadly distributed species of outstanding ecological and economic relevance.
Tree mortality triggered by drought has been attributed to two non-mutually exclusive physiological mechanisms associated with constraints in the tightly coupled dynamics of water (i.e., hydraulic failure) and carbon (i.e., carbon starvation) [7]. Because tree death ultimately occurs when lethal dehydration spreads across tissues, hydraulic dysfunction is regarded as a central mechanism of drought-induced mortality [8]. Critical water content thresholds, however, depend on carbon assimilation and storage, which support osmoregulation and the energy supply required to sustain metabolic activity [9]. Even though water–carbon relations are modulated by tree nutritional status [10,11], the elemental composition of tree tissues has been largely overlooked in assessments of drought impacts on tree performance. Nonetheless, recent research has highlighted consistent patterns of nutritional impairment linked to drought-induced dieback and mortality across species and biomes. They include disruptions in nitrogen (N), phosphorous (P) and potassium (K) stoichiometry; deficiencies in micronutrients such as copper (Cu) or zinc (Zn); and the frequent accumulation of manganese (Mn) [12]. These imbalances relate to drought-induced reductions in soil nutrient availability [13] and the impairment of nutrient uptake through reduced transpiration-driven mass flow and diffusion of nutrients, as well as root and mycorrhizal functioning [14,15,16]. In addition, heterogeneous soil properties and frequent vertical decoupling between water and nutrient distribution with depth along the soil profile further constrain plant nutrient acquisition under dry climatic conditions [17,18,19]. The interaction of drought with other global-change drivers (e.g., increasing atmospheric CO2 concentration and N deposition) has exacerbated the overall nutritional decline of forest trees [20,21,22,23], which, in turn, compromises their ability to cope with drought.
So far, drought-related nutrient imbalances have been documented in either foliar [15,24,25] or woody tissues [26,27,28]. However, direct comparisons of nutrient allocation across multiple organs remain scarce (but see [12,29]). Given the functional linkage between leaves and stems, nutrient concentrations in these two organs are expected to be coordinated through nutrient allocation strategies [30]. Nevertheless, differences may also arise because leaves are primarily responsible for photosynthesis, whereas stems provide mechanical support and mediate the transport and storage of water, nutrients and carbohydrates [31,32]. In fact, nutrient allocation among organs reflects functional trade-offs that aim at optimizing plant performance under changing conditions [17,33]. Examining how scaling relationships of elemental composition among different organs vary along gradients of drought-induced tree vigor decline may therefore offer valuable insights into the underlying physiological mechanisms. Despite this, the limited availability of wood nutrient data—and its integration with other functional traits—remains a major knowledge gap in functional ecology [34].
The assessment of the linkages between nutrient imbalances of different tree tissues and complementary indicators of decline can improve our mechanistic understanding of drought-induced dieback. Past and present radial growth dynamics, as reconstructed using dendrochronological methods, are sensitive indicators of water–carbon balance of trees, since radial growth integrates carbon assimilation and allocation processes under climatic constraints [35]. In particular, prolonged growth declines and reduced resilience have been consistently identified as early warning signals preceding dieback and tree death [36,37,38]. Furthermore, carbon and oxygen stable isotopes provide a valuable tool for investigating water use patterns during dieback [39]. The carbon isotope composition (δ13C) reflects CO2 diffusion and enzymatic discrimination during carboxylation and thus serves as a proxy for intrinsic water use efficiency (iWUE), defined as the ratio between the photosynthetic rate and stomatal conductance [40]. The oxygen isotope composition (δ18O), in turn, primarily depends on source water isotopic composition and leaf-level evaporative enrichment during transpiration [41,42]. Together, the dual- C/O isotope framework allows the interpretation of coupled changes in δ13C and δ18O to infer shifts in photosynthetic activity and stomatal regulation during mortality [43,44].
In this study, we applied a multi-proxy approach to advance the understanding of drought-induced dieback in rear-edge Scots pine populations in Northeastern Spain. By combining foliar and sapwood elemental composition, tree-ring width measures, and stable isotope signatures (δ13C, δ18O), we aimed to (1) assess the coordination of nutrient allocation between different tissues; (2) quantify shifts in nutrient status of needles and sapwood across tree vigor classes; and (3) determine how the nutrient composition relates to tree water use patterns and growth resilience against drought. We hypothesized that (1) variability in nutrient composition would be coordinated across tissues; (2) defoliated trees—since crown defoliation is considered a reliable indicator of tree vigor [45]—would exhibit nutrient deficiencies and imbalances across tissues; and (3) drought-induced nutritional shifts would be coupled with increases in iWUE and reduced growth resilience.

2. Materials and Methods

2.1. Study Sites

Study sites are located in the Iberian System in the provinces of Teruel and Guadalajara, Northeastern Spain (Table S1). In each province, we selected one mortality hotspot (Corbalán and Traid-Adobes), and one nearby mortality coldspot (Cedrillas and Alustante)—characterized by low canopy defoliation (<20%)—that was used as a control stand. Mortality of P. sylvestris at the study sites peaked in response to the 2005, 2012, 2017 and 2022 droughts, with drought-induced growth decline persisting thereafter [46]. The lithology consists of limestone, conglomerate and sandstone, and soils are loam and loamy sand types.
The climate of the study area is continental Mediterranean, characterized by dry summers and cold winters (Figure S1a). Monthly climate data for each study site were obtained from the TerraClimate dataset (~4 km resolution; [47]). Despite their close proximity (less than 15 km apart), hotspots exhibited slightly higher mean annual temperatures than coldspots, whereas total annual precipitation showed the opposite pattern (Table S1). Across all sites, the lowest mean minimum temperatures occurred in January (−3.1 °C to −1.5 °C), while mean maximum temperatures were recorded in July–August (23.5 °C to 25.9 °C). May was the wettest month (71 ± 2 mm), and July was the driest (28 ± 2 mm). Mean summer vapor pressure deficit (VPD; June–August) was also retrieved as a proxy for atmospheric evaporative demand. Drought intensity was assessed using the Standardized Precipitation–Evapotranspiration Index (SPEI), interpreted as a proxy for soil moisture availability [48]. The SPEI is a standardized drought index based on the cumulative balance between precipitation and potential evapotranspiration and can be computed over multiple temporal scales; negative values indicate dry conditions, whereas positive values indicate wet conditions. We calculated the 12-month August SPEI (SPEI12.Aug) using the SPEI package [49] in R software version 4.5.2 [50]. Climatic records revealed negative trends in SPEI12.Aug and positive trends in summer VPD (Figure S1b) over the last decades. Notably, the period 2022–2023 was identified as an extremely hot and dry spell across all study sites, consistent with conditions reported throughout Spain [51].

2.2. Field Sampling and Soil Properties

In total, 60 dominant and co-dominant P. sylvestris trees were selected for the present study. Crown defoliation, as a proxy of vigor status, was visually assessed as the proportion of leaf area lost relative to a fully foliated reference tree from the same stand [45]. Trees were then classified as non-declining (ND) and declining (DD) if defoliation was below 40% and above 60%, respectively. Three tree vigor classes were defined according to stand type and crown defoliation: coldspot trees (control stand), hotspot ND trees and hotspot DD trees (hotspot stand). It should be noted that the occurrence of defoliated trees in the control stands was negligible; therefore, all trees in the coldspot are considered healthy, non-declining individuals. Field sampling was conducted during the summer of 2023.
For each selected tree, we collected needles, wood and soil samples and measured the diameter at breast height (DBH) and total tree height using diameter tapes and a laser range finder (Nikon Forestry Pro II, Nikon, Japan), respectively. Needle material was obtained by cutting a sun-exposed branch from the upper third of the canopy using either a telescopic pole or a canopy slingshot device (Notch Equipment, Greensboro, NC, USA). Fully expanded, undamaged needles from the 2022 cohort were collected and transported to the laboratory in sealed bags. Wood samples were obtained by extracting three increment cores at 1.3 m height using 5.15 mm Pressler increment borers (Haglöf, Långsele, Sweden). Two radii were used for dendrochronological analyses, while the remaining radius was reserved for dendrochemical analyses.
Soil samples were collected around each selected tree (within 50 cm of the trunk) using Edelman soil augers (7 cm diameter and 15 cm depth; Royal Eijkelkamp, Giesbeek, The Netherlands). Before sampling, the litter layer was carefully removed. Three soil subsamples were taken per tree from the uppermost 15 cm of soil, where the majority of fine roots are concentrated [52]. Samples were air-dried and sieved with a 2 mm mesh size. Soil texture was determined with a laser diffraction method in a particle analyzer (Coulter Mastersizer 2000, Malvern Panalytical, Spectris, London, UK), and clay content was corrected following Taubner et al. [53]. To integrate the different components of soil texture into one single variable, the exponent of the Saxton equation [54] was calculated using Equation (1).
b = −3.140 − 0.00222 (% clay)2 − 3.484 × 10⁻⁵ (% sand)2 (% clay),
where less negative values of b indicate sandy soils with lower soil water retention capacity. Soil carbon (organic and total), N, P, Ca, K and Mg availability were determined with an elemental analyser (Element Analyzer VarioMAX N/CM, Hanau, Germany). Physical and chemical properties of soils were analyzed at IRNASA-CSIC (Salamanca, Spain).

2.3. Nutrient Composition of Needles and Sapwood

The nutrient composition of needles and sapwood samples was determined as a proxy of tree nutritional status. Needle samples were oven-dried at 70 °C for 72 h and ground in a ball mill (Retsch ZM1, Haan, Germany). To determine sapwoods’ nutrient composition, we obtained the last ten years of growth (period 2012–2022) from the wood cores. They were then air-dried, chopped and ground to a fine powder. Phosphorus (P), potassium (K), calcium (Ca), magnesium (Mg), sulfur (S), iron (Fe), manganese (Mn), zinc (Zn), copper (Cu), and nickel (Ni) concentrations of both needle and sapwood were measured via inductively coupled plasma optical emission spectrometry (ICP−OES; Intrepid II XDL, Thermo Elemental Iris, MA, USA) after microwave-assisted digestion with HNO2:H2O2 (4:1, volume/volume). Elemental analyses were conducted at the CEBAS-CSIC Ionomics laboratory (Murcia, Spain). In addition, we calculated five meaningful stoichiometric ratios N:P, N:K, K:Ca, and Fe:Cu, which provide insights into important physiological processes, including growth and hydraulic function [55,56].

2.4. Foliar Isotopic Composition

Foliar carbon (δ13C) and oxygen (δ18O) isotope signatures were analyzed as time-integrated indicators of carbon assimilation and water relations. Finely ground needle material was weighed into tin capsules for δ13C analyses and into silver capsules for δ18O measurements. Leaf δ13C was quantified by continuous-flow dual-isotope analysis using a CHNOS elemental analyzer (EuroVector S.p.A., Milan, Italy) coupled to an IsoPrime100 isotope ratio mass spectrometer (Elementar, Langenselbold, Germany) and reported in delta notation (‰) relative to the Vienna Pee Dee Belemnite (V-PDB) standard. Leaf δ18O was determined under continuous flow conditions using an Elementar PYRO Cube (Elementar, Germany) interfaced with a Thermo Delta V mass spectrometer (Thermo Fisher Scientific, Waltham, MA, USA), expressed in delta notation (‰) relative to Vienna Standard Mean Ocean Water (VSMOW). Long-term external analytical precision was ±0.10‰ for δ13C and ±0.20‰ for δ18O. All stable isotope measurements were conducted at the University of Lisbon (Portugal).
Leaf δ13C values were subsequently used to estimate intrinsic water use efficiency (iWUE), defined as the ratio of net photosynthetic rate to stomatal conductance, following Farquhar et al. [40]:
iWUE = Ca × [1 − (Ci/Ca)] × 0.625,
where Ca and Ci represent atmospheric and intercellular CO2 concentrations, respectively, and the factor 0.625 accounts for the ratio of diffusivities of water vapor and CO2. The intercellular CO2 concentration (Ci) was derived from carbon isotope discrimination using
Ci = Ca × [(δ13C_leaf − δ13C_atm + 1)/(ba)],
where δ13C_leaf and δ13C_atm denote leaf and atmospheric carbon isotope ratios, a is the fractionation associated with diffusion through the boundary layer and stomata (4.4‰), and b represents Rubisco carboxylation fractionation (27.0‰). Atmospheric δ13C and CO2 concentration values were obtained from published datasets [57]. Calculations of iWUE were performed using the R package isocalcR [58], which incorporates corrections for elevation to account for differences in temperature and atmospheric pressures among study sites [59].
To account for spatial variation in the isotopic composition of precipitation, we calculated leaf oxygen enrichment above source water (Δ18O). Specifically, we subtracted site-specific precipitation δ18O from leaf δ18O values. Mean annual precipitation δ18O values were calculated as rainfall amount–weighted averages [60]. Precipitation isotope data were retrieved from the Online Isotopes in Precipitation Calculator (OIPC; [61]) using each site’s geographic coordinates and elevation.

2.5. Dendrochronological Processing

The wood samples were processed using common dendrochronological methods [35]. Cores were air-dried, glued onto wooden supports, and carefully sanded with progressively finer-grain sandpaper until ring boundaries were clearly visible. Then, they were scanned at a 2400 dpi resolution (Epson Expression 10,000XL Scanner; Epson, Suwa, Japan) and visually cross-dated. Ring widths were measured with a 0.01 mm resolution using scanned images and CooRecorder-CDendro software version 9.8.4 [62]. The quality of cross-dating was checked using COFECHA software, which calculates moving correlations between individual series of ring-width values and the mean sites series [63].
Ring-width series were converted into basal area increment (BAI), which is considered a more reliable measure of tree growth [64]. The BAI was calculated as
BAI = π (Rt2 − Rt−12)
where Rt and Rt−1 represent the stem radii at the end and beginning of each annual ring formed in years t and t − 1, respectively. The mean BAI series of each tree was calculated by averaging the two radius measurements.
Short-term growth responses to drought were quantified using resilience indices following Lloret et al. [65]. Resistance (Rt) reflects the capacity to sustain growth during a drought event, recovery (Rc) measures the extent of post-drought growth rebound, and resilience (Rs) represents the ability to return to pre-drought growth levels.
Rt = BAID/BAIpreD,
Rc = BAIpostD/BAID,
Rs = BAIpostD/BAIpreD,
where BAID denotes growth during the drought year, and BAIpreD and BAIpostD represent mean growth in the periods preceding and following the drought, respectively. Pre- and post-drought periods were defined as three years, a time window shown to provide a suitable balance between drought severity and short-term growth responses [66]. Drought events selected for analysis were 2012 and 2017, as they met several criteria. First, these years corresponded to extreme negative values of SPEI12.Aug, accompanied by relatively high summer VPD (Figure S1), indicating severe drought conditions. Second, both events have been identified as tipping points for forest canopy dieback, growth decline and tree mortality at the study sites [46]. Finally, they represent the most recent drought episodes encompassed within the temporal window covered by the sapwood nutrient composition data. Calculation of drought resilience indices was conducted using the R package pointRes [67].

2.6. Data Analysis

To test differences among tree vigor classes regarding nutrient concentrations, isotopic composition and resilience indices, we fitted linear regressions. Models included soil physical–chemical parameters as covariates to account for differences in soil properties among and within stands. Since soil parameters were strongly correlated with each other, a principal component analysis (PCA) was performed, and the first two principal components (PC1.soil and PC2.soil) were retained as covariables (Figure S2). The pairwise relationships among study variables across vigor classes were assessed using linear mixed-effect models (LMMs) [68], which included the study site as a random effect to account for differences associated with sampling sites.
We conducted partial redundancy analyses (partial RDA) to assess the association between multivariate nutrient composition and tree traits (vigor class, iWUE, Δ18O, DBH, tree height), while controlling for variation in soil properties (PC1.soil and PC2.soil). Different models were fitted for needle and sapwood nutrient concentrations. The significance of the axes and the explanatory variables was calculated using a permutation test (1000 permutations).
Drought resilience indices were modeled as a function of foliar and sapwood nutrient concentration, isotope composition and tree size using LMMs. The site was included as a random intercept. Relevant predictor variables were selected using a backward stepwise procedure based on likelihood ratio tests, in which non-significant fixed effects were sequentially removed by comparing the full model with reduced models that omitted each term. Variance inflation factors (VIFs) were calculated to assess collinearity among predictors, and highly collinear variables (VIF > 3) were discarded. The goodness-of-fit of selected LMMs was evaluated using marginal (R2m) and conditional R2 (R2c) values. Finally, the relative contribution of each predictor set (needle nutrients, sapwood nutrients and other isotopic- and size-related traits) was quantified through variance partitioning with bootstrapping (1000 permutations).
All analyses were conducted in R statistical software [50]. Multivariate analyses were conducted using the R packages vegan [69] and pairwiseAdonis [70]. LMMs were fitted using the packages lme4 [71] and lmerTest [72], while the emmeans package was employed to estimate least-squares means [73]. Variance partitioning of sets of variables included in drought resilience LMMs was performed using the package partR2 [74]. Variables were log-transformed prior to analyses.

3. Results

3.1. Soil Conditions and Tree Characteristics

Soils in mortality coldspots (control stands) exhibited more negative values of Saxton b values (−4.92 ± 0.07), which became progressively less negative beneath non-declining (ND) trees (−4.75 ± 0.04) and declining (DD) trees (−4.63 ± 0.05) within mortality hotspots (Table S1). This indicates a reduction in soil water retention capacity along this gradient of tree vigor status. Soil pH and CaCO3 content also differed between stands: soils in mortality hotspots were more alkaline (6.9 ± 0.1) and contained higher CaCO3 concentrations (15.5 ± 2.0%) than soils in mortality coldspots (pH: 5.9 ± 0.2; CaCO3: 7.6 ± 3.1% in Cedrillas and undetectable in Alustante). Consistently, Ca availability was lower in mortality coldspots, a trend that was also observed for K availability (Table S1). The first two principal components derived from the PCA of soil physical–chemical parameters (PC1.soil and PC2.soil) explained over 75% of the total variance. The first component (PC1.soil) described a gradient that opposed water retention capacity against the availability of N, P and K. The second component (PC2.soil) was primarily associated with CaCO3 content and soil pH (Figure S2). The PERMANOVA results showed significant differences in soil parameters between coldspot trees and ND trees (F = 9.877; p = 0.001) and DD trees (F = 11.389; p = 0.001) in hotspots. Differences between DD and ND trees within mortality hotspots were only marginally significant (F = 2.396; p = 0.061).
As expected, crown defoliation was higher in hotspot DD trees (57.8 ± 2.6%) than in hotspot ND trees (33.2 ± 1.2%) or coldspot trees (9.5 ± 0.6%) (Fclass = 186.8; p < 0.001). As defoliation was used as a classification criterion within hotspot stands, this internal contrast reflects the predefined grouping and confirms a clear separation between ND and DD trees. DBH did not differ between coldspot trees (38.1 ± 1.2 cm), ND trees (34.8 ± 1.5 cm) and DD trees (37.6 ± 1.7 cm) within hotspots (Fclass = 2.245; p = 0.116). In contrast, tree height was significantly higher (Fclass = 10.355; p < 0.001) in coldspot trees (15.0 ± 0.4 m) than in hotspot trees (ND trees: 12.9 ± 0.4 m; DD trees: 13.6 ± 0.4 m). No significant differences were found regarding tree age (coldspot trees: 111 ± 8 years; ND trees: 123 ± 7 years; DD trees: 132 ± 6 years; Fclass = 2.624, p = 0.103).

3.2. Foliar and Sapwood Nutrient Concentrations

The concentration of most nutrients was higher in needles than in sapwood (Table 1). For macronutrients such as N, P, K, Ca, Mg, and for some micronutrients (Mn), foliar concentrations were approximately an order of magnitude greater, whereas for micronutrients such as Cu, Zn, and Ni, the difference was about threefold. Iron (Fe) was the only element with comparable concentrations between the two tissues (Table 1).
Both needle and sapwood elemental composition differed among vigor classes. Foliar N and N:K were both higher in trees of the mortality hotspots, whereas foliar K and K:Ca were higher in coldspot trees. The highest foliar Ca, Mg, S, and Fe concentrations and N:P ratios were found in hotspot DD trees, while the lowest were found in the healthy trees of coldspots, with ND trees exhibiting intermediate values. The Fe:Cu ratio in needles was significantly higher in hotspot DD trees than in the other vigor classes. Sapwood concentrations of P, Ca and S were higher in mortality hotspot trees, while the N:P ratio was higher in coldspot trees. There were non-significant differences in sapwood nutrient composition between ND and DD trees within hotspots (Table 1). While some nutrient concentrations (e.g., Mn, Cu, Zn, and Ni) varied markedly among trees, this variation appears to be strongly driven by soil conditions rather than by tree vigor class (Table S2).
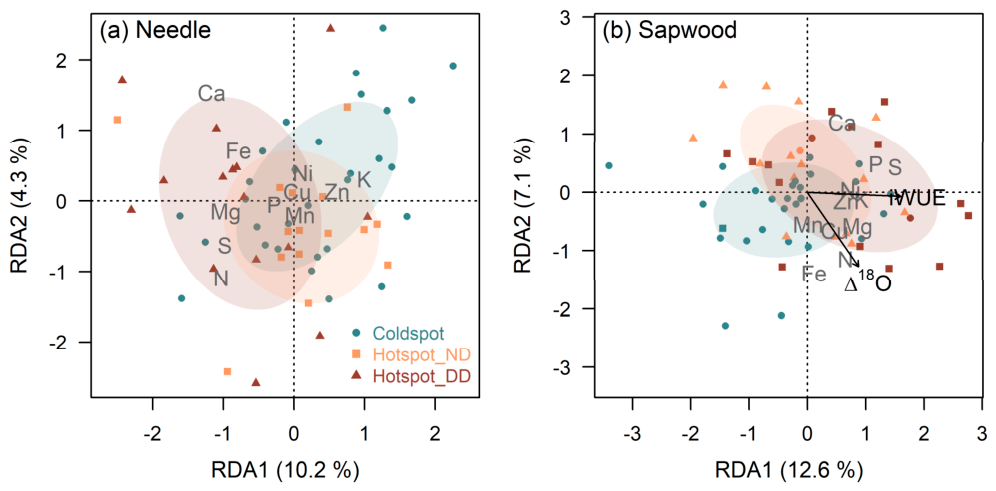
RDA analyses of multivariate nutrient composition showed that the first RDA axis discriminated among vigor classes (Figure 1; Table S3). In the ordination analysis with foliar data, pairwise comparisons indicated significant differences among all groups (coldspot–hotspot ND: F = 3.250, p = 0.002; coldspot–hotspot DD: F = 7.653, p = 0.001; hotspot ND–hotspot DD: F = 2.290, p = 0.028). Thus, mortality hotspot DD trees showed high N, Ca, Fe, S and Mg leaf concentrations, while healthy trees in coldspots were characterized by a high foliar K concentration (Figure 1a). Significant pairwise differences in sapwood composition were detected only between healthy trees in coldspot and the other classes (coldspot–hotspot ND: F = 8.195, p = 0.001; coldspot–hotspot DD: F = 6.828, p = 0.001), whereas ND and DD trees in mortality hotspots did not differ significantly (F = 0.973, p = 0.405) (Figure 1b). Concentrations of N, Ca and S were also high in sapwood of hotspot trees, along with P concentration.
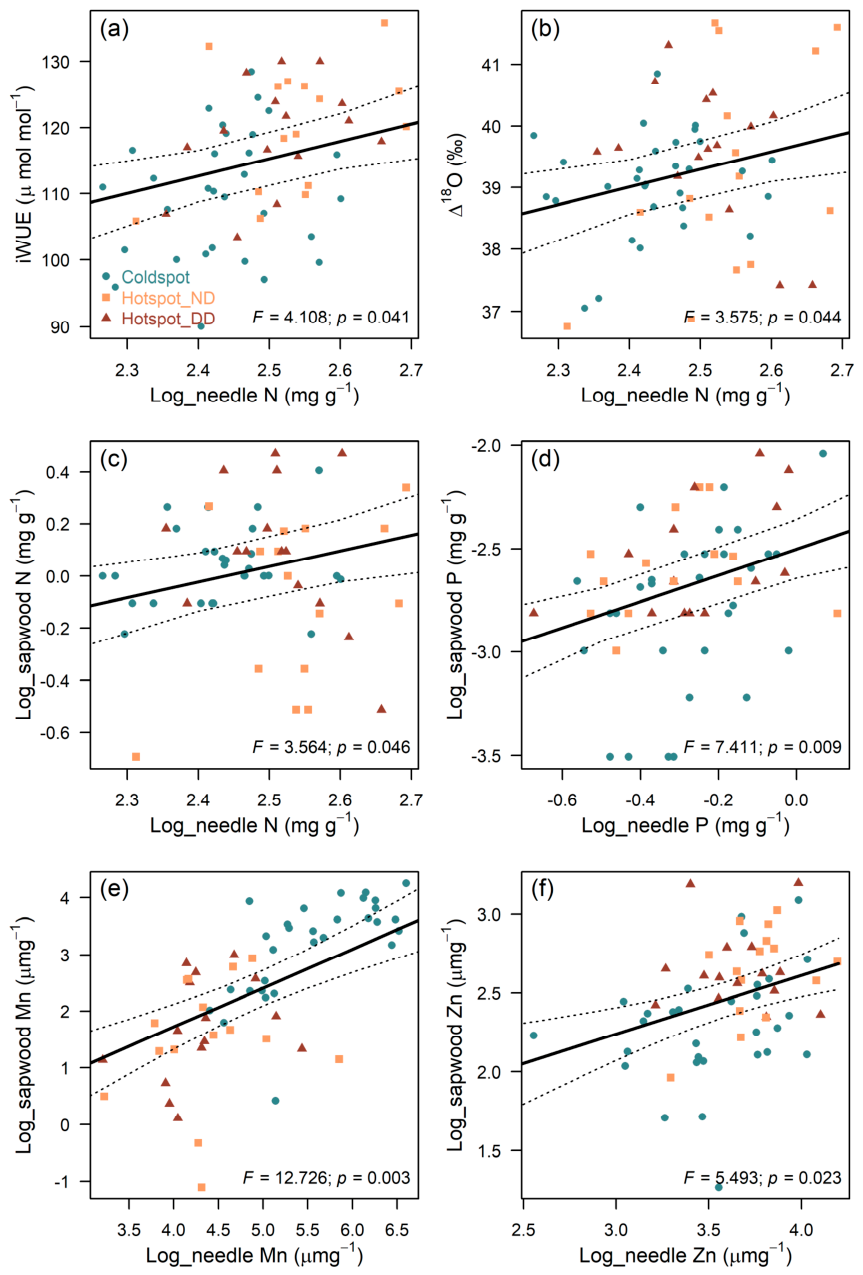
The total explained variance remained relatively low in both ordination analyses (Table S3). After accounting for variability in soil parameters, only sapwood nutrient concentrations showed a significant relationship with isotopic signatures. In this ordination, iWUE aligned with the first RDA axis and was positively associated with P, K, S, Zn and Ni concentrations in sapwood. The second RDA axis was correlated with Δ18O, which was positively associated with N and Fe and negatively with Ca (Figure 1b). Relationships across all individuals supported these patterns and also highlighted a positive association between foliar N concentration and both C and O isotopes (Table S4; Figure 2).
We detected a few significant relationships between nutrient concentration in needles and sapwood (Table 1). Across tree vigor classes, only N, P, Mn and Zn were positively related between tissues (Figure 2). Overall, these results suggest limited similarity in the nutrient composition patterns between tissues. We also observed tissue-specific differences in the nutrient-defoliation relationship across vigor classes. Some nutrients exhibited consistent relationships with crown defoliation in both tissues (Ca, S, Fe, Mn, Zn, Fe:Cu), whereas others displayed contrasting relationships with crown defoliation between needles and sapwood (N, K, N:P, N:K, K:Ca) (Table 1).

3.3. Isotopic Signatures and Drought Response

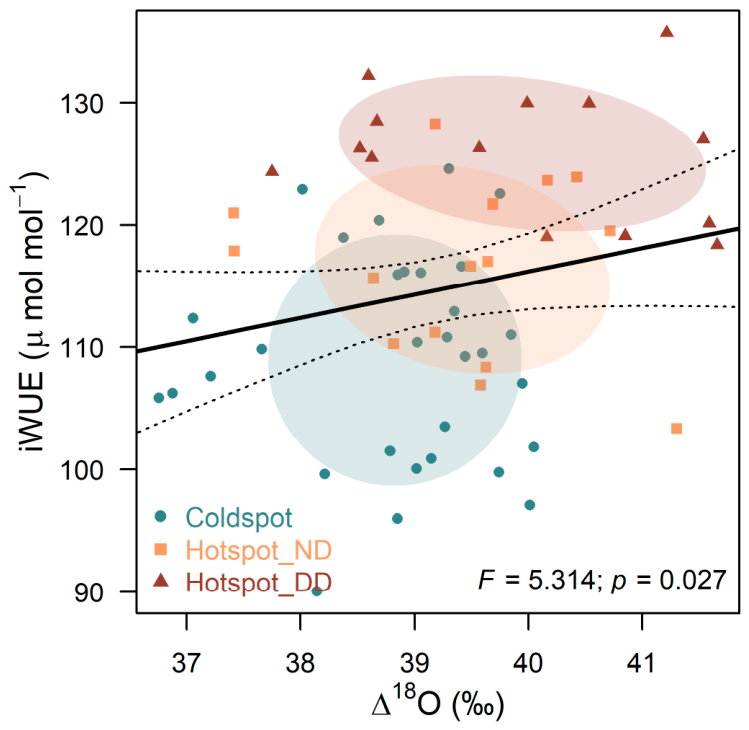
Intrinsic water use efficiency (iWUE) was lowest in the healthy trees from coldspots, intermediate in hotspot ND trees and highest in hotspot DD trees. Similarly, leaf oxygen isotopic enrichment above source water (Δ18O) showed the highest values in DD trees and the lowest in coldspot trees, while hotspot ND trees showed no significant differences between any of the previous groups (Table 2). Moreover, we found that iWUE and Δ18O were significantly and positively associated with each other across vigor classes (Figure 3).
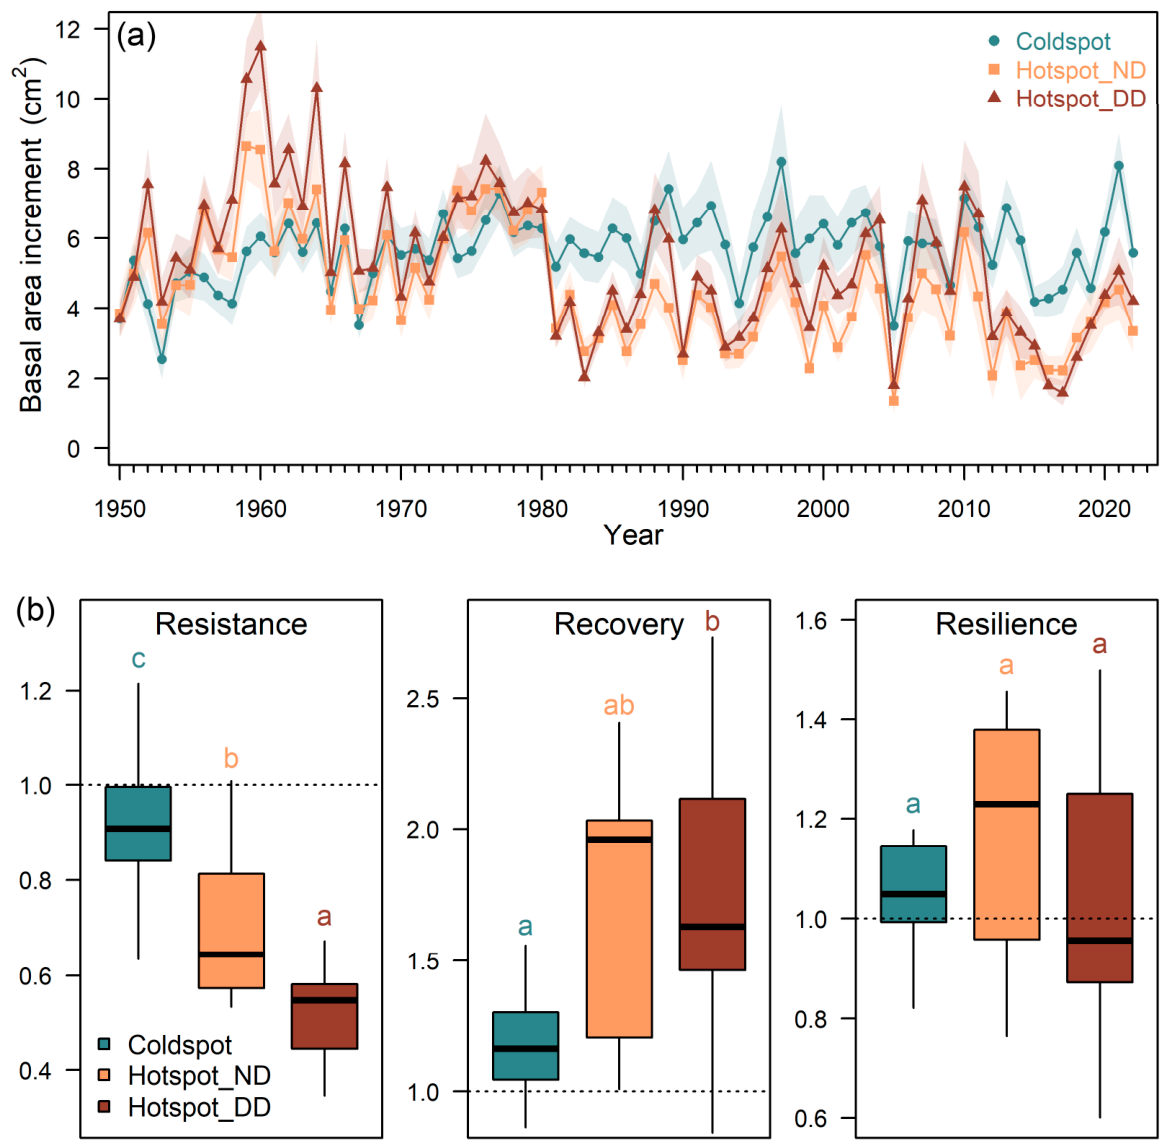
The averaged growth responses to the 2012 and 2017 drought events depended on the particular index and the vigor class considered (Table 2). Resistance was highest in coldspot trees, lowest in hotspot DD trees, and intermediate in hotspot ND trees. In contrast, recovery was greatest in DD trees and lowest in coldspot trees. No significant differences among vigor classes were detected for resilience (Figure 4b).

3.4. Associations of Nutrients and Isotopes with Drought Resilience

Our models explained more than twice as much variance in resistance as in recovery and resilience against drought (Table 3). Consistently, the proportion of variance associated with the site factor was substantially higher for recovery and resilience than for resistance (Table S5), highlighting a stronger spatial structuring of these latter responses. For all indices, sapwood nutrient variables had higher explanatory power than foliar nutrient variables. Needle nutrients were not included in the selected model for recovery, whereas the resilience model retained only nutrient-related variables (Table 3).
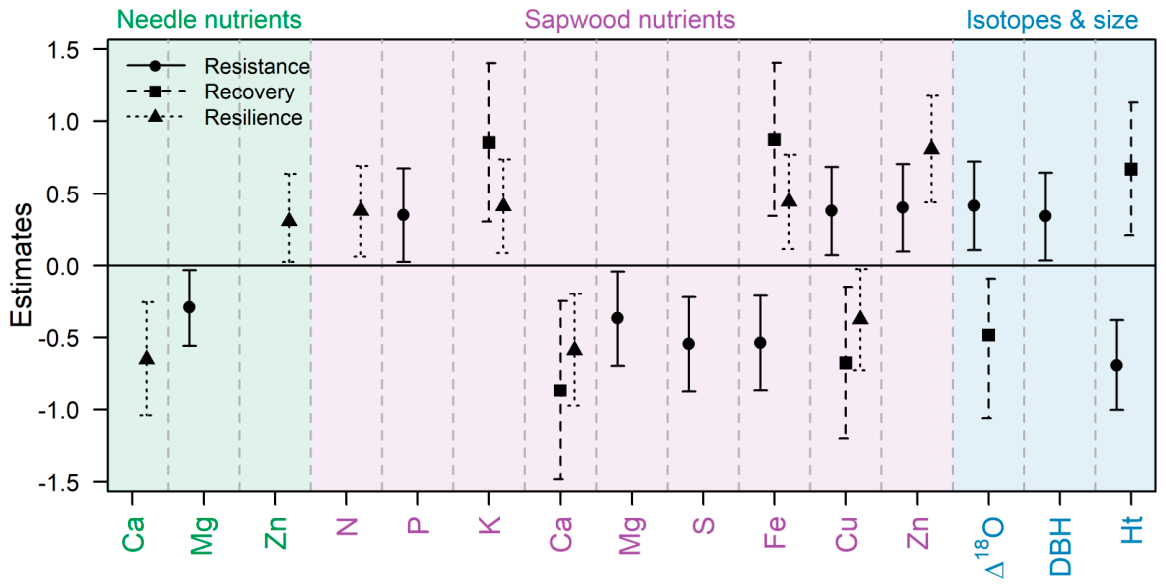
Our results indicate that resistance was negatively associated with Mg concentrations in both needles and sapwood, as well as with sapwood S and Fe concentrations and tree height. In contrast, resistance was positively related to sapwood P, Cu and Zn concentrations, Δ18O, and DBH (Figure 5). Growth recovery after drought was positively associated with sapwood K and Fe concentrations and with tree height, whereas higher sapwood Ca and Cu concentrations and Δ18O were linked to reduced recovery. Finally, resilience was positively associated with sapwood N, K, Fe and Zn concentrations. Interestingly, resilience showed a positive relationship with needle Ca and sapwood Zn, while the opposite pattern was observed for sapwood Ca and needle Zn (Figure 5; Table S5).

4. Discussion

4.1. Coordination of Nutrient Pools and Environmental Drivers

We found coordinated variation between needle and sapwood concentrations for several elements (N, P, Mn, and Zn) across sites and tree individuals, suggesting coupling of these nutrient pools between different organs (Figure 2) and providing only partial support for our first hypothesis. Previous studies have also reported positive—albeit often weak—correlations of N and P contents between different tissues, with allocation patterns varying across trees’ functional groups and environmental gradients [30,75,76]. Notably, the scaling factors observed here for N and P allocation between sapwood vs. leaves (0.60 and 0.64, respectively) across tree vigor classes exceeded those reported for conifers across broader environmental gradients in Catalonian forests [77]. This difference may indicate that, within drought-stressed populations, trees allocate proportionally more N and P to sapwood. This would be consistent with the positive relationship between increased nutrient investment in leaves and enhanced tree radial growth under more favorable conditions [30,77].
Soil properties influenced the tree nutrient composition across sites and vigor classes [18], and this effect was particularly pronounced for micronutrients like Mn and Zn (Table S2). These elements showed pronounced sensitivity to local edaphic conditions and coordinated variation across tissues. In this context, calcareous soils—such as those found in mortality hotspots—impose constraints on tree performance. These include lower water retention capacity due to higher water percolation [78], as well as elevated pH that limits the bioavailability of essential nutrients such as P, Fe, Zn and Cu [79]. Consistently, tree populations growing on calcareous substrates have been reported to experience greater drought stress and reduced resilience [80]. However, the lack of significant soil effects on several needle nutrients and most sapwood nutrients, together with the relatively low proportion of variance explained by soil variables in multivariate models, suggests that other additional factors aside from soil nutrients (e.g., tree vigor status) may independently regulate nutrient dynamics in both needles and sapwood.
Overall, our results revealed greater differences in foliar than in sapwood nutrient composition among tree vigor classes (Table 1). This suggests that our second hypothesis is better supported by the needles than by the sapwood. These differences likely reflect the contrasting functional roles of these tissues. As major photosynthetic and metabolic organs, leaves require heavy nutrient investment to sustain carbon assimilation and stress-adaptive responses [31]. In contrast, nutrients in woody tissues are more strongly associated with structural and defensive functions, although the mobile nutrient pools stored in parenchyma can be remobilized to support leaf flush, reproduction, or repair following stress [32,81]. Therefore, drought stress and declining tree vigor are expected to exert organ-specific effects on nutrient allocation. He et al. [12] reported that needle nutrient concentrations were consistently more responsive to drought stress than those in stems or roots in a drought-affected Scots pine forest located within the species’ core distribution. Based on both field observations and a global meta-analysis, these authors concluded that leaves are more vulnerable to drought impacts on tissue elemental composition, likely reflecting their role as primary nutrient sinks and carbon sources [12]. In contrast, Mohammadzadeh et al. [29] found no clear evidence that leaf nutrients outperform wood or bark chemistry as indicators of drought-induced decline in Quercus brantii Lindl., although responses remained organ-dependent.

4.2. Organ-Specific Nutrient Dynamics and Drought Responses

The needle nutritional profile of declining trees reveals characteristic nutritional shifts associated with drought stress, particularly a progressive K deficiency that intensified with increasing crown defoliation (Figure 1a), consistent with observations from core populations of Scots pine [82]. Potassium plays a central role in drought tolerance by regulating stomatal function, transpiration, photosynthesis, osmoregulation capacity and xylem hydraulic conductivity [83,84]. Its depletion likely exacerbated physiological stress in declining individuals, a pattern further supported by isotopic evidence. The observed increase in iWUE from coldspost to hotspots, and especially in declining trees within hotspots, is consistent with the enrichment of δ13C typically associated with drought stress [39]. Moreover, the positive relationship between iWUE and Δ18O across vigor classes indicates a shared stomatal signal and regulation on both isotopic variables [85]. Within the dual-isotope framework (Figure 3), these patterns suggest reduced time-integrated stomatal conductance in declining trees compared with healthy trees in coldspots (non-defoliated stands) [43]. This interpretation is consistent with the higher N accumulation in needles of declining trees, which enhances tighter stomatal regulation of leaf gas exchange and possibly also photosynthetic upregulation at the leaf level (Figure 2) to partially compensate for a stronger stomatal limitation of carbon assimilation and reduced canopy area [33,86]. Positive associations between N concentration in needles and both iWUE and Δ18O across tree vigor classes are consistent with the predictions of the least-cost economic theory of photosynthesis [33], whereby higher foliar N content enhances carboxylation capacity, photosynthesis and tighter stomatal regulation, ultimately favoring more conservative water use by leaves under drought conditions [86]. This finding suggests that drought-stressed declining pines exhibiting severe canopy defoliation may prioritize N investment and accumulation in their remaining foliage (at the expense of lower N concentrations in sapwood) to foster leaf-level water use efficiency as an adaptive response to water shortage. However, the markedly reduced proportion of functional crowns of declining trees in mortality hotspots still constrains whole-tree carbon balance and long-term growth in these individuals.
The sapwood elemental composition also exhibited significant associations with leaf isotopic composition and emerged as the most powerful set of predictors of growth resilience indices among all variables considered (Figure 5). These findings underscore the integrative role of sapwood in tree physiology. We observed contrasting patterns in sapwood elemental composition across vigor classes (Figure 1b). Nitrogen was depleted in the sapwood of individuals growing in mortality hotspots, likely reflecting remobilization from woody reservoirs to sustain leaf-level photosynthetic upregulation aimed at compensating for reduced canopy area [81]. In contrast, sapwood K concentrations were higher in trees from mortality hotspots, suggesting enhanced resorption from senescing foliage and subsequent storage in stem tissues. In the sapwood, K may contribute to maintaining hydraulic conductivity and facilitating embolism repair through the so-called ionic effect [87,88]. Therefore, our third hypothesis appears to hold true for both tissues, although the associations between nutrients and tree water–carbon balance were organ-specific.
Interestingly, nutrients such as Ca, S and Fe also showed higher concentrations in needles of declining trees in mortality hotspots. While essential for structural integrity and stress metabolism [89,90,91], their accumulation in leaves may signal stress-induced premature foliar senescence, given that these elements tend to accumulate in senescing foliage, particularly in high pH soils [92]. The same nutrients also accumulate in the sapwood of defoliated trees from hotspots, pointing to coordinated signals of drought stress or accelerated senescence across tissues for these elements in declining conifers growing on calcareous substrates.
Finally, opposing relationships between resistance and recovery across vigor classes (despite shared predictors) may indicate the existence of a physiological trade-off between drought avoidance and post-drought growth recovery (Figure 4). Growth rates also modulate the relationship between resistance and recovery [93], so that high recovery values in defoliated trees can result from very low growth during drought years. In general, conservative traits promoted resistance at the expense of a slower recovery. For instance, earlier and/or tighter stomatal regulation of tree water flux (resulting in higher Δ18O) could protect and safeguard the tree hydraulic integrity during drought, but the associated reduction in carbon assimilation could constrain post-drought growth [9,94]. Similarly, higher tree height increases hydraulic path length and vulnerability to drought stress, thereby reducing resistance [95,96], yet it is also associated with traits that may enhance recovery, such as larger non-structural carbohydrate pool reserves and more extensive root systems capable of exploiting larger soil volumes [42,97]. The contrasting effects of sapwood Fe and Cu further illustrate this trade-off, likely reflecting their distinct roles in stress metabolism and phytohormone signaling [98]. Despite these contrasts, some consistent patterns emerged across drought response indices, including negative associations of tree vigor with needle and sapwood Ca concentrations and positive associations with K (sapwood) and Zn (needle and sapwood). These relationships align with previous studies investigating the links between nutrient status and tree performance under drought-induced mortality (e.g., [12,24,26]).

4.3. Limitations and Future Directions

One of the main limitations of this study is the partially confounding effects between site conditions and tree vigor, as the least defoliated trees occur only on mortality coldspots (i.e., control stands). To mitigate this issue, we applied analytical approaches that explicitly account for variation in soil and site conditions. Nevertheless, tree vigor and site-specific environmental factors cannot be considered fully independent, which limits our ability to disentangle drought-induced versus soil-driven nutritional impairment in the studied declining Scots pine populations. In addition, the multivariate models explained a limited proportion of the variability in elemental composition (Table S3), suggesting that other unmeasured environmental and/or physiological processes may play a significant role in shaping tree nutritional dynamics. Taken together, these limitations call for caution when inferring underlying mechanisms and highlight the need for future research aimed at disentangling the interactive effects of climatic and edaphic stressors.
There are still a few studies that simultaneously assess nutritional changes during drought-induced dieback (but see [12,29]), indicating that key gaps persist in this emerging research topic. These include, among others, determining whether shifts in scaling relationships of nutrients among organs are a general feature of drought-induced decline. Moreover, existing conceptual frameworks that investigate the mechanisms of drought-induced mortality—such as those based on growth trajectories and tree-ring isotopic signals [39,44]—could benefit from incorporating the temporal dynamics of sapwood nutrient composition. However, future research is needed to disentangle the roles of radial nutrient remobilization and translocation within the sapwood to fully support this integrative approach [99].

5. Conclusions

Our results show that drought-induced decline in Scots pine in Northeastern Iberia is associated with organ-specific shifts in elemental composition, with foliar nutrients providing sensitive indicators of current crown defoliation, and sapwood nutrients capturing longer-term physiological integration. The contrasting patterns observed between tissues highlight the importance of considering complex internal nutrient allocation dynamics, rather than single-organ measurements, when assessing tree nutritional responses to drought. In particular, foliar K deficiency and isotopic signatures (δ13C, δ18O) jointly point to tight coupling between nutrient status, stomatal regulation, and carbon–water balance under drought stress. Moreover, the stronger association of sapwood elemental composition with growth resilience indicates that it may serve as a long-term integrative proxy of drought impacts on tree functioning. The observed trade-off between resistance and recovery further suggests that drought responses are influenced by site conditions (aridity, soil moisture storage, soil fertility) and governed by coordinated physiological strategies involving both hydraulic and metabolic adjustments. Altogether, these findings advance current understanding of the mechanisms linking tree nutrient dynamics with drought-induced mortality and highlight the value of integrating multi-organ and multi-proxy approaches to improve predictions of forest vulnerability under climate change.

Supplementary Materials

The following supporting information can be downloaded at: https://www.mdpi.com/article/10.3390/f17060657/s1, Table S1: Characteristics of study sites, soils and sampled trees; Table S2: Differences in individual foliar and sapwood nutrient composition among tree vigor classes accounting for soil parameter variability; Table S3: Partial redundancy analyses characterising multivariate nutrient composition in needles and sapwood as a function of vigor classes, isotopic signals and tree size after accounting for variability in soil parameters; Table S4: Relationships between nutrient and isotopic composition; Table S5: Relationships of resilience indices with foliar and sapwood nutrients and additional tree traits; Figure S1: (a) Climatic diagrams of study sites according to climate data retrieved from TerraClimate dataset [47] for the period 1958–2023. (b) Interannual variability of 12-month August Standardized Precipitation-Evaporation Index (SPEI12.Aug) (blue and red bars on left y-axis), and summer vapor pressure deficit (VPDsum) (black line on right y-axis). Vertical grey areas indicate extreme climatic events when Scots pine mortality peaked at the study sites; Figure S2: The ordination of soil physical and chemical parameters. Different colors indicate coldspot trees (blue circles), hotspot non-declining (ND) trees (orange squares) and hotspot declining (DD) trees (brown triangles). Shaded areas represent the centroid of each vigour class. Black labels and arrows indicate loadings of soil parameters. The F-statistic of the PERMANOVA test comparing vigour classes is shown (*** p < 0.001).

Author Contributions

Conceptualization, E.G.d.A., A.G., J.I.Q. and J.J.C.; field sampling, E.G.d.A., A.G. and J.J.C.; laboratory analyses, E.G.d.A. and J.I.Q.; formal analysis, E.G.d.A.; resources, A.G., J.I.Q. and J.J.C.; data curation, E.G.d.A.; writing—original draft preparation, E.G.d.A.; writing—review and editing, E.G.d.A., A.G., J.I.Q. and J.J.C.; visualization, E.G.d.A.; funding acquisition, E.G.d.A., A.G., J.I.Q. and J.J.C. All authors have read and agreed to the published version of the manuscript.

Funding

This research was funded by the Science and Innovation Ministry of Spain (AEI, Agencia Española de Investigación) with projects PID2019-107382RB-I00, PID2021-123675OB-C41, PID2021-123675OB-C43, TED2021-129770B- C21, RyC2020-030647-I and PIE-20223AT003. Ester González de Andrés was supported by the Johannes Amos Comenius Programme (P JAC), project No. CZ.02.01.01/00/22_008/0004605, Natural and anthropogenic georisks.

Data Availability Statement

The raw data supporting the conclusions of this article will be made available by the authors on request.

Acknowledgments

We acknowledge Michele Colangelo, Cristopher Fernández-Blas, Marina Rodes-Blanco, Eva Samblás, César Morales-Molino, Julián Tijerín-Triviño, Pedro Rebollo, Mariano García, María Inmaculada Aguado, Paloma Ruiz-Benito and Miguel Angel Zavala for their fieldwork and Cristina Valeriano, Carme Pedrol, Elisa Tamudo and Elena Lahoz for their support in the laboratory.

Conflicts of Interest

The authors declare no conflicts of interest. The funders had no role in the design of the study; in the collection, analyses, or interpretation of data; in the writing of the manuscript; or in the decision to publish the results.

References

  1. Allen, C.D.; Macalady, A.K.; Chenchouni, H.; Bachelet, D.; McDowell, N.; Vennetier, M.; Kitzberger, T.; Rigling, A.; Breshears, D.D.; Hogg, E.H.; et al. A Global Overview of Drought and Heat-Induced Tree Mortality Reveals Emerging Climate Change Risks for Forests. For. Ecol. Manag. 2010, 259, 660–684. [Google Scholar] [CrossRef]
  2. Hammond, W.M.; Williams, A.P.; Abatzoglou, J.T.; Adams, H.D.; Klein, T.; López, R.; Sáenz-Romero, C.; Hartmann, H.; Breshears, D.D.; Allen, C.D. Global Field Observations of Tree Die-off Reveal Hotter-Drought Fingerprint for Earth’s Forests. Nat. Commun. 2022, 13, 1761. [Google Scholar] [CrossRef]
  3. McDowell, N.G.; Allen, C.D.; Anderson-Teixeira, K.; Aukema, B.H.; Bond-Lamberty, B.; Chini, L.; Clark, J.S.; Dietze, M.; Grossiord, C.; Hanbury-Brown, A.; et al. Pervasive Shifts in Forest Dynamics in a Changing World. Science 2020, 368, aaz9463. [Google Scholar] [CrossRef] [PubMed]
  4. Trugman, A.T.; Anderegg, L.D.L. Source vs Sink Limitations on Tree Growth: From Physiological Mechanisms to Evolutionary Constraints and Terrestrial Carbon Cycle Implications. New Phytol. 2025, 245, 966–981. [Google Scholar] [CrossRef]
  5. Alderotti, F.; Bussotti, F.; Brunetti, C.; Ferrini, F.; Gori, A.; Pollastrini, M. Linking Patterns of Forest Dieback to Triggering Climatic and Weather Events: An Overview on Mediterranean Forests. iForest 2024, 17, 309–316. [Google Scholar] [CrossRef]
  6. Bose, A.K.; Gessler, A.; Büntgen, U.; Rigling, A. Tamm Review: Drought-Induced Scots Pine Mortality—Trends, Contributing Factors, and Mechanisms. For. Ecol. Manag. 2024, 561, 121873. [Google Scholar] [CrossRef]
  7. McDowell, N.; Pockman, W.T.; Allen, C.D.; Breshears, D.D.; Cobb, N.; Kolb, T.; Plaut, J.; Sperry, J.; West, A.; Williams, D.G.; et al. Mechanisms of Plant Survival and Mortality during Drought: Why Do Some Plants Survive While Others Succumb to Drought? New Phytol. 2008, 178, 719–739. [Google Scholar] [CrossRef] [PubMed]
  8. Brodribb, T.J. Learning from a Century of Droughts. Nat. Ecol. Evol. 2020, 4, 1007–1008. [Google Scholar] [CrossRef] [PubMed]
  9. McDowell, N.G.; Sapes, G.; Pivovaroff, A.; Adams, H.D.; Allen, C.D.; Anderegg, W.R.L.; Arend, M.; Breshears, D.D.; Brodribb, T.; Choat, B.; et al. Mechanisms of Woody-Plant Mortality under Rising Drought, CO2 and Vapour Pressure Deficit. Nat. Rev. Earth Environ. 2022, 3, 294–308. [Google Scholar] [CrossRef]
  10. Gessler, A.; Schaub, M.; McDowell, N.G. The Role of Nutrients in Drought-Induced Tree Mortality and Recovery. New Phytol. 2017, 214, 513–520. [Google Scholar] [CrossRef]
  11. Peñuelas, J.; Fernández-Martínez, M.; Ciais, P.; Jou, D.; Piao, S.; Obersteiner, M.; Vicca, S.; Janssens, I.A.; Sardans, J. The Bioelements, the Elementome, and the Biogeochemical Niche. Ecology 2019, 100, e02652. [Google Scholar] [CrossRef]
  12. He, P.; Sardans, J.; Wang, X.; Ma, C.; Man, L.; Peñuelas, J.; Han, X.; Jiang, Y.; Li, M.H. Nutritional Changes in Trees during Drought-Induced Mortality: A Comprehensive Meta-Analysis and a Field Study. Glob. Change Biol. 2024, 30, e17133. [Google Scholar] [CrossRef]
  13. Kreuzwieser, J.; Gessler, A. Global Climate Change and Tree Nutrition: Influence of Water Availability. Tree Physiol. 2010, 30, 1221–1234. [Google Scholar] [CrossRef]
  14. León-Sánchez, L.; Nicolás, E.; Prieto, I.; Nortes, P.; Maestre, F.T.; Querejeta, J.I. Altered Leaf Elemental Composition with Climate Change Is Linked to Reductions in Photosynthesis, Growth and Survival in a Semi-Arid Shrubland. J. Ecol. 2020, 108, 47–60. [Google Scholar] [CrossRef]
  15. Salazar-Tortosa, D.; Castro, J.; Villar-salvador, P.; Viñegla, B.; Matías, L.; Michelsen, A.; Rubio de Casas, R.; Querejeta, J.I. The “Isohydric Trap”: A Proposed Feedback between Water Shortage, Stomatal Regulation, and Nutrient Acquisition Drives Differential Growth and Survival of European Pines under Climatic Dryness. Glob. Change Biol. 2018, 24, 4069–4083. [Google Scholar] [CrossRef]
  16. León-Sánchez, L.; Nicolás, E.; Goberna, M.; Prieto, I.; Maestre, F.T.; Querejeta, J.I. Poor Plant Performance under Simulated Climate Change Is Linked to Mycorrhizal Responses in a Semi-Arid Shrubland. J. Ecol. 2018, 106, 960–976. [Google Scholar] [CrossRef]
  17. Aerts, R.; Chapin, F.S. The Mineral Nutrition of Wild Plants Revisited: A Re-Evaluation of Processes and Patterns. Adv. Ecol. Res. 1999, 30, 1–67. [Google Scholar] [CrossRef]
  18. Ryel, R.J.; Ivans, C.Y.; Peek, M.S.; Leffler, A.J. Functional Differences in Soil Water Pools: A New Perspective on Plant Water Use in Water-Limited Ecosystems. In Progress in Botany 69; Lüttge, U., Beyschlag, W., Murata, J., Eds.; Springer-Verlag: Berlin, Germany, 2008; pp. 397–422. [Google Scholar]
  19. Querejeta, J.I.; Ren, W.; Prieto, I. Vertical Decoupling of Soil Nutrients and Water under Climate Warming Reduces Plant Cumulative Nutrient Uptake, Water-Use Efficiency and Productivity. New Phytol. 2021, 230, 1378–1393. [Google Scholar] [CrossRef] [PubMed]
  20. Peñuelas, J.; Fernández-Martínez, M.; Vallicrosa, H.; Maspons, J.; Zuccarini, P.; Carnicer, J.; Sanders, T.G.M.; Krüger, I.; Obersteiner, M.; Janssens, I.A.; et al. Increasing Atmospheric CO2 Concentrations Correlate with Declining Nutritional Status of European Forests. Commun. Biol. 2020, 3, 125. [Google Scholar] [CrossRef]
  21. Terrer, C.; Vicca, S.; Stocker, B.D.; Hungate, B.A.; Phillips, R.P.; Reich, P.B.; Finzi, A.C.; Prentice, I.C. Ecosystem Responses to Elevated CO2 Governed by Plant–Soil Interactions and the Cost of Nitrogen Acquisition. New Phytol. 2018, 217, 507–522. [Google Scholar] [CrossRef] [PubMed]
  22. Craine, J.M.; Elmore, A.J.; Wang, L.; Aranibar, J.; Bauters, M.; Boeckx, P.; Crowley, B.E.; Dawes, M.A.; Delzon, S.; Fajardo, A.; et al. Isotopic Evidence for Oligotrophication of Terrestrial Ecosystems. Nat. Ecol. Evol. 2018, 2, 1735–1744. [Google Scholar] [CrossRef] [PubMed]
  23. Jonard, M.; Fürst, A.; Verstraeten, A.; Thimonier, A.; Timmermann, V.; Potočić, N.; Waldner, P.; Benham, S.; Hansen, K.; Merilä, P.; et al. Tree Mineral Nutrition Is Deteriorating in Europe. Glob. Change Biol. 2015, 21, 418–430. [Google Scholar] [CrossRef]
  24. González de Andrés, E.; Gazol, A.; Querejeta, J.I.; Igual, J.M.; Colangelo, M.; Sánchez-Salguero, R.; Linares, J.C.; Camarero, J.J. The Role of Nutritional Impairment in Carbon-water Balance of Silver Fir Drought-induced Dieback. Glob. Change Biol. 2022, 28, 4439–4458. [Google Scholar] [CrossRef]
  25. Zhang, H.; Li, X.; Guan, D.; Wang, A.; Yuan, F.; Wu, J. Nitrogen Nutrition Addition Mitigated Drought Stress by Improving Carbon Exchange and Reserves among Two Temperate Trees. Agric. For. Meteorol. 2021, 311, 108693. [Google Scholar] [CrossRef]
  26. González de Andrés, E.; Suárez, M.L.; Querejeta, J.I.; Camarero, J.J. Chronically Low Nutrient Concentrations in Tree Rings Are Linked to Greater Tree Vulnerability to Drought in Nothofagus dombeyi. Forests 2021, 12, 1180. [Google Scholar] [CrossRef]
  27. Billings, S.A.; Boone, A.S.; Stephen, F.M. Tree-Ring Δ13C and Δ18O, Leaf Δ13C and Wood and Leaf N Status Demonstrate Tree Growth Strategies and Predict Susceptibility to Disturbance. Tree Physiol. 2016, 36, 576–588. [Google Scholar] [CrossRef]
  28. Sardans, J.; Peñuelas, J. Drought Changes Phosphorus and Potassium Accumulation Patterns in an Evergreen Mediterranean Forest. Funct. Ecol. 2007, 21, 191–201. [Google Scholar] [CrossRef]
  29. Mohammadzadeh, H.; Mirzaei, J.; Farashiyani, M.E.; Soheili, F.; Woodward, S.; Abdul-Hamid, H.; Naji, H.R. Variation in the Nutrient Contents of Leaves, Bark, and wood of Persian Oak Trees (Quercus brantii) affected by Decline. Bioresources 2021, 16, 4704–4715. [Google Scholar] [CrossRef]
  30. Yan, Z.; Li, P.; Chen, Y.; Han, W.; Fang, J. Nutrient Allocation Strategies of Woody Plants: An Approach from the Scaling of Nitrogen and Phosphorus between Twig Stems and Leaves. Sci. Rep. 2016, 6, 20099. [Google Scholar] [CrossRef]
  31. Poorter, H.; Niklas, K.J.; Reich, P.B.; Oleksyn, J.; Poot, P.; Mommer, L. Biomass Allocation to Leaves, Stems and Roots: Meta-Analyses of Interspecific Variation and Environmental Control. New Phytol. 2012, 193, 30–50. [Google Scholar] [CrossRef]
  32. Dalling, J.W.; Flores, M.R.; Heineman, K.D. Wood Nutrients: Underexplored Traits with Functional and Biogeochemical Consequences. New Phytol. 2024, 244, 1694–1708. [Google Scholar] [CrossRef] [PubMed]
  33. Wright, I.J.; Reich, P.B.; Westoby, M. Least-Cost Input Mixtures of Water and Nitrogen for Photosynthesis. Am. Nat. 2003, 161, 98–111. [Google Scholar] [CrossRef]
  34. Li, J.; Chen, X.; Niklas, K.J.; Sun, J.; Wang, Z.; Zhong, Q.; Hu, D.; Cheng, D. A Whole-Plant Economics Spectrum Including Bark Functional Traits for 59 Subtropical Woody Plant Species. J. Ecol. 2022, 110, 248–261. [Google Scholar] [CrossRef]
  35. Fritts, H.C. Tree Rings and Climate; Academic Press: London, UK, 1976. [Google Scholar]
  36. Cailleret, M.; Jansen, S.; Robert, E.M.R.; Desoto, L.; Aakala, T.; Antos, J.A.; Beikircher, B.; Bigler, C.; Bugmann, H.; Caccianiga, M.; et al. A Synthesis of Radial Growth Patterns Preceding Tree Mortality. Glob. Change Biol. 2017, 23, 1675–1690. [Google Scholar] [CrossRef]
  37. Camarero, J.J.; Gazol, A.; Sangüesa-Barreda, G.; Oliva, J.; Vicente-Serrano, S.M. To Die or Not to Die: Early Warnings of Tree Dieback in Response to a Severe Drought. J. Ecol. 2015, 103, 44–57. [Google Scholar] [CrossRef]
  38. DeSoto, L.; Cailleret, M.; Sterck, F.; Jansen, S.; Kramer, K.; Robert, E.M.R.; Aakala, T.; Amoroso, M.M.; Bigler, C.; Camarero, J.J.; et al. Low Growth Resilience to Drought Is Related to Future Mortality Risk in Trees. Nat. Commun. 2020, 11, 545. [Google Scholar] [CrossRef] [PubMed]
  39. Gessler, A.; Cailleret, M.; Joseph, J.; Schönbeck, L.; Schaub, M.; Lehmann, M.; Treydte, K.; Rigling, A.; Timofeeva, G.; Saurer, M. Drought Induced Tree Mortality—A Tree-Ring Isotope Based Conceptual Model to Assess Mechanisms and Predispositions. New Phytol. 2018, 219, 485–490. [Google Scholar] [CrossRef]
  40. Farquhar, G.D.; Ehleringer, J.R.; Hubick, K.T. Carbon Isotope Discrimination and Photosynthesis. Annu. Rev. Plant Physiol. 1989, 40, 503–537. [Google Scholar] [CrossRef]
  41. Barbour, M.M. Stable Oxygen Isotope Composition of Plant Tissue: A Review. Funct. Plant Biol. 2007, 34, 83–94. [Google Scholar] [CrossRef]
  42. Muñoz-Gálvez, F.J.; Querejeta, J.I.; Moreno-Gutiérrez, C.; Ren, W.; de la Riva, E.G.; Prieto, I. Trait Coordination and Trade-Offs Constrain the Diversity of Water Use Strategies in Mediterranean Woody Plants. Nat. Commun. 2025, 16, 4103. [Google Scholar] [CrossRef] [PubMed]
  43. Scheidegger, Y.; Saurer, M.; Bahn, M.; Siegwolf, R. Linking Stable Oxygen and Carbon Isotopes with Stomatal Conductance and Photosynthetic Capacity: A Conceptual Model. Oecologia 2000, 125, 350–357. [Google Scholar] [CrossRef]
  44. Siegwolf, R.T.W.; Lehmann, M.M.; Goldsmith, G.R.; Churakova, O.V.; Mirande-Ney, C.; Timoveeva, G.; Weigt, R.B.; Saurer, M. Updating the Dual C and O Isotope—Gas-Exchange Model: A Concept to Understand Plant Responses to the Environment and Its Implications for Tree Rings. Plant Cell Environ. 2023, 46, 2606–2627. [Google Scholar] [CrossRef]
  45. Dobbertin, M. Tree Growth as Indicator of Tree Vitality and of Tree Reaction to Environmental Stress: A Review. Eur. J. For. Res. 2005, 124, 319–333. [Google Scholar] [CrossRef]
  46. Valeriano, C.; Gazol, A.; Colangelo, M.; Camarero, J.J. Drought Drives Growth and Mortality Rates in Three Pine Species under Mediterranean Conditions. Forests 2021, 12, 1700. [Google Scholar] [CrossRef]
  47. Abatzoglou, J.T.; Dobrowski, S.Z.; Parks, S.A.; Hegewisch, K.C. TerraClimate, a High-Resolution Global Dataset of Monthly Climate and Climatic Water Balance from 1958–2015. Sci. Data 2018, 5, 170191. [Google Scholar] [CrossRef]
  48. Vicente-Serrano, S.M.; Beguería, S.; López-Moreno, J.I. A Multiscalar Drought Index Sensitive to Global Warming: The Standardized Precipitation Evapotranspiration Index. J. Clim. 2010, 23, 1696–1718. [Google Scholar] [CrossRef]
  49. Beguería, S.; Vicente-Serrano, S.M. SPEI: Calculation of the Standardized Precipitation-Evapotranspiration Index, R Package Version 1.8.1; The R Foundation: Vienna, Austria, 2023. Available online: https://cran.r-project.org/web/packages/SPEI/index.html (accessed on 31 October 2025).
  50. R Core Team. R: A Language and Environment for Statistical Computing; The R Foundation: Vienna, Austria, 2025. [Google Scholar]
  51. Serrano-Notivoli, R.; Tejedor, E.; Sarricolea, P.; Meseguer-Ruiz, O.; de Luis, M.; Saz, M.Á.; Longares, L.A.; Olcina, J. Unprecedented Warmth: A Look at Spain’s Exceptional Summer of 2022. Atmos. Res. 2023, 293, 106931. [Google Scholar] [CrossRef]
  52. Janssens, I.A.; Sampson, D.A.; Curiel-Yuste, J.; Carrara, A.; Ceulemans, R. The Carbon Cost of Fine Root Turnover in a Scots Pine Forest. For. Ecol. Manag. 2002, 168, 231–240. [Google Scholar] [CrossRef]
  53. Taubner, H.; Roth, B.; Tippkötter, R. Determination of Soil Texture: Comparison of the Sedimentation Method and the Laser-Diffraction Analysis. J. Plant Nutr. Soil Sci. 2009, 172, 161–171. [Google Scholar] [CrossRef]
  54. Saxton, K.E.; Rawls, W.J.; Romberger, J.S.; Papendick, R.I. Estimating Generalized Soil-Water Characteristics from Texture. Soil Sci. Soc. Am. J. 1986, 50, 1031–1036. [Google Scholar] [CrossRef]
  55. He, M.; Dijkstra, F.A. Drought Effect on Plant Nitrogen and Phosphorus: A Meta-Analysis. New Phytol. 2014, 204, 924–931. [Google Scholar] [CrossRef]
  56. Hevia, A.; Sánchez-Salguero, R.; Camarero, J.J.; Querejeta, J.I.; Sangüesa-Barreda, G.; Gazol, A. Long-Term Nutrient Imbalances Linked to Drought-Triggered Forest Dieback. Sci. Total Environ. 2019, 690, 1254–1267. [Google Scholar] [CrossRef]
  57. Belmecheri, S.; Lavergne, A. Compiled Records of Atmospheric CO2 Concentrations and Stable Carbon Isotopes to Reconstruct Climate and Derive Plant Ecophysiological Indices from Tree Rings. Dendrochronologia 2020, 63, 125748. [Google Scholar] [CrossRef]
  58. Mathias, J.M.; Hudiburg, T.W. IsocalcR: An R Package to Streamline and Standardize Stable Isotope Calculations in Ecological Research. Glob. Change Biol. 2022, 28, 7428–7436. [Google Scholar] [CrossRef]
  59. Cernusak, L.A.; Ubierna, N.; Winter, K.; Holtum, J.A.M.; Marshall, J.D.; Farquhar, G.D. Environmental and Physiological Determinants of Carbon Isotope Discrimination in Terrestrial Plants. New Phytol. 2013, 200, 950–965. [Google Scholar] [CrossRef]
  60. Bowen, G.J.; Revenaugh, J. Interpolating the Isotopic Composition of Modern Meteoric Precipitation. Water Resour. Res. 2003, 39, 1299. [Google Scholar] [CrossRef]
  61. IAEA/WMO Global Network of Isotopes in Precipitation. The GNIP Database. Available online: https://Nucleus.Iaea.Org/Wiser (accessed on 15 June 2025).
  62. Maxwell, R.S.; Larsson, L.-A. Measuring Tree-Ring Widths Using the CooRecorder Software Application. Dendrochronologia 2021, 67, 125841. [Google Scholar] [CrossRef]
  63. Holmes, R.L. Computer-Assisted Quality Control in Tree-Ring Dating and Measurement. Tree-Ring Bull. 1983, 43, 69–78. [Google Scholar]
  64. Klesse, S.; Bigler, C. Growth Trends in Basal Area Increments: The Underlying Problem, Consequences for Research and Best Practices. Dendrochronologia 2025, 90, 126296. [Google Scholar] [CrossRef]
  65. Lloret, F.; Keeling, E.G.; Sala, A. Components of Tree Resilience: Effects of Successive Low-Growth Episodes in Old Ponderosa Pine Forests. Oikos 2011, 120, 1909–1920. [Google Scholar] [CrossRef]
  66. Schwarz, J.; Skiadaresis, G.; Kohler, M.; Kunz, J.; Schnabel, F.; Vitali, V.; Bauhus, J. Quantifying Growth Responses of Trees to Drought—A Critique of Commonly Used Resilience Indices and Recommendations for Future Studies. Curr. For. Rep. 2020, 6, 185–200. [Google Scholar] [CrossRef]
  67. van der Maaten-Theunissen, M.; van der Maaten, E.; Bouriaud, O. PointRes: An R Package to Analyze Pointer Years and Components of Resilience. Dendrochronologia 2015, 35, 34–38. [Google Scholar] [CrossRef]
  68. Pinheiro, J.C.; Bates, D.M. Mixed-Effects Models in S and S-PLUS; Springer: New York, NY, USA, 2000. [Google Scholar]
  69. Oksanen, J.; Simpson, G.; Blanchet, F.; Kindt, R.; Legendre, P.; Minchin, P.; O’Hara, R.; Solymos, P.; Stevens, M.; Szoecs, E.; et al. Vegan: Community Ecology Package, R Package Version 2.7-2; The R Foundation: Vienna, Austria, 2025. [Google Scholar]
  70. Martinez Arbizu, P. PairwiseAdonis: Pairwise Multilevel Comparison Using Adonis, R Package Version 0.4.1; Commit Cb190f7668a0c82c0b0853927db239e7b9ec3e83; The R Foundation: Vienna, Austria, 2017; Available online: https://Github.Com/Pmartinezarbizu/PairwiseAdonis (accessed on 28 October 2025).
  71. Bates, D.; Maechler, M.; Bolker, B.; Walker, S. Fitting Linear Mixed-Effects Models Using Lme4. J. Stat. Softw. 2015, 67, 1–48. [Google Scholar] [CrossRef]
  72. Kuznetsova, A.; Brockhoff, P.B.; Christensen, R.H.B. LmerTest Package: Tests in Linear Mixed Effects Models. J. Stat. Softw. 2017, 82, 1–26. [Google Scholar] [CrossRef]
  73. Lenth, R.; Piaskowski, J. Emmeans: Estimated Marginal Means, Aka Least-Squares Means, R Package Version 2.0.1; The R Foundation: Vienna, Austria, 2025. [Google Scholar]
  74. Stoffel, M.A.; Nakagawa, S.; Schielzeth, H. PartR2: Partitioning R2 in Generalized Linear Mixed Models. PeerJ 2021, 9, e11414. [Google Scholar] [CrossRef]
  75. Lira-Martins, D.; Humphreys-Williams, E.; Strekopytov, S.; Ishida, F.Y.; Quesada, C.A.; Lloyd, J. Tropical Tree Branch-Leaf Nutrient Scaling Relationships Vary with Sampling Location. Front. Plant Sci. 2019, 10, 877. [Google Scholar] [CrossRef] [PubMed]
  76. Heineman, K.D.; Turner, B.L.; Dalling, J.W. Variation in Wood Nutrients along a Tropical Soil Fertility Gradient. New Phytol. 2016, 211, 440–454. [Google Scholar] [CrossRef]
  77. Sardans, J.; Peñuelas, J. Tree Growth Changes with Climate and Forest Type Are Associated with Relative Allocation of Nutrients, Especially Phosphorus, to Leaves and Wood. Glob. Ecol. Biogeogr. 2013, 22, 494–507. [Google Scholar] [CrossRef]
  78. Bolan, N.; Srivastava, P.; Rao, C.S.; Satyanaraya, P.V.; Anderson, G.C.; Bolan, S.; Nortjé, G.P.; Kronenberg, R.; Bardhan, S.; Abbott, L.K.; et al. Distribution, Characteristics and Management of Calcareous Soils. In Advances in Agronomy; Academic Press Inc.: London, UK, 2023; Volume 182, pp. 81–130. [Google Scholar]
  79. Marschner, P.; Rengel, Z. Nutrient Availability in Soils; Elsevier Ltd.: Amsterdam, The Netherlands, 2012. [Google Scholar]
  80. Leberecht, M.; Tu, J.; Polle, A. Acid and Calcareous Soils Affect Nitrogen Nutrition and Organic Nitrogen Uptake by Beech Seedlings (Fagus sylvatica L.) under Drought, and Their Ectomycorrhizal Community Structure. Plant Soil. 2016, 409, 143–157. [Google Scholar] [CrossRef]
  81. Millard, P.; Grelet, G.A. Nitrogen Storage and Remobilization by Trees: Ecophysiological Relevance in a Changing World. Tree Physiol. 2010, 30, 1083–1095. [Google Scholar] [CrossRef] [PubMed]
  82. Dietrich, V.; Wambsganss, J.; Greve, M. Foliar Nutrient Composition, Fructification and Previous Years’ Climatic Conditions Explain Changes in Defoliation of Temperate Tree Species. Ecol. Indic. 2026, 183, 114672. [Google Scholar] [CrossRef]
  83. da Silva, E.C.; Nogueira, R.J.M.C.; da Silva, M.A.; Albuquerque, M.B. Drought Stress and Plant Nutrition. Plant Stress 2011, 5, 32–41. [Google Scholar]
  84. Sardans, J.; Peñuelas, J. Potassium: A Neglected Nutrient in Global Change. Glob. Ecol. Biogeogr. 2015, 24, 261–275. [Google Scholar] [CrossRef]
  85. Roden, J.S.; Farquhar, G.D. A Controlled Test of the Dual-Isotope Approach for the Interpretation of Stable Carbon and Oxygen Isotope Ratio Variation in Tree Rings. Tree Physiol. 2012, 32, 490–503. [Google Scholar] [CrossRef]
  86. Querejeta, J.I.; Prieto, I.; Armas, C.; Casanoves, F.; Diémé, J.S.; Diouf, M.; Yossi, H.; Kaya, B.; Pugnaire, F.I.; Rusch, G.M. Higher Leaf Nitrogen Content Is Linked to Tighter Stomatal Regulation of Transpiration and More Efficient Water Use across Dryland Trees. New Phytol. 2022, 235, 1351–1364. [Google Scholar] [CrossRef]
  87. Nardini, A.; Salleo, S.; Jansen, S. More than Just a Vulnerable Pipeline: Xylem Physiology in the Light of Ion-Mediated Regulation of Plant Water Transport. J. Exp. Bot. 2011, 62, 4701–4718. [Google Scholar] [CrossRef]
  88. Trifilò, P.; Barbera, P.M.; Raimondo, F.; Nardini, A.; Lo Gullo, M.A. Coping with Drought-Induced Xylem Cavitation: Coordination of Embolism Repair and Ionic Effects in Three Mediterranean Evergreens. Tree Physiol. 2014, 34, 109–122. [Google Scholar] [CrossRef]
  89. Fromm, J. Wood Formation of Trees in Relation to Potassium and Calcium Nutrition. Tree Physiol. 2010, 30, 1140–1147. [Google Scholar] [CrossRef]
  90. Kaufholdt, D.; Kistner, S.; Rumpel, J.; Heidenblut, H.; Hauskeller, H.M.; Hartmann, H.; Bloem, E.; Hänsch, R. From Curse to Blessing: Sulfur-Availability Enhances Forest Resilience? Trends Plant Sci. 2025, 31, 282–294. [Google Scholar] [CrossRef]
  91. Broadley, M.; Brown, P.; Cakmak, I.; Rengel, Z.; Zhao, F. Function of Nutrients: Micronutrients. In Marschner’s Mineral Nutrition of Higher Plants: Third Edition; Elsevier Inc.: Amsterdam, The Netherlands, 2012; pp. 191–248. [Google Scholar]
  92. Prieto, I.; Querejeta, J.I. Simulated Climate Change Decreases Nutrient Resorption from Senescing Leaves. Glob. Change Biol. 2020, 26, 1795–1807. [Google Scholar] [CrossRef]
  93. Tao, W.; He, J.; Smith, N.G.; Yang, H.; Liu, J.; Chen, L.; Tao, J.; Luo, W. Tree Growth Rate-Mediated Trade-off between Drought Resistance and Recovery in the Northern Hemisphere. Proc. R. Soc. B Biol. Sci. 2024, 291, 20241427. [Google Scholar] [CrossRef]
  94. Martin-StPaul, N.; Delzon, S.; Cochard, H. Plant Resistance to Drought Depends on Timely Stomatal Closure. Ecol. Lett. 2017, 20, 1437–1447. [Google Scholar] [CrossRef]
  95. McDowell, N.G.; Allen, C.D. Darcy’s Law Predicts Widespread Forest Mortality under Climate Warming. Nat. Clim. Change 2015, 5, 669–672. [Google Scholar] [CrossRef]
  96. Olson, M.E.; Soriano, D.; Rosell, J.A.; Anfodillo, T.; Donoghue, M.J.; Edwards, E.J.; León-Gómez, C.; Dawson, T.; Julio Camarero Martínez, J.; Castorena, M.; et al. Plant Height and Hydraulic Vulnerability to Drought and Cold. Proc. Natl. Acad. Sci. USA 2018, 115, 7551–7556. [Google Scholar] [CrossRef]
  97. Trugman, A.T.; Anderegg, L.D.L.; Anderegg, W.R.L.; Das, A.J.; Stephenson, N.L. Why Is Tree Drought Mortality so Hard to Predict? Trends Ecol. Evol. 2021, 36, 520–532. [Google Scholar] [CrossRef]
  98. Hendrix, S.; Verbruggen, N.; Cuypers, A.; Meyer, A.J. Essential Trace Metals in Plant Responses to Heat Stress. J. Exp. Bot. 2022, 73, 1775–1788. [Google Scholar] [CrossRef] [PubMed]
  99. Canning, C.M.; Laroque, C.P.; Muir, D. Critical Analysis of the Past, Present, and Future of Dendrochemistry: A Systematic Literature Review. Forests 2023, 14, 1997. [Google Scholar] [CrossRef]
Figure 1. Partial redundancy analysis relating the variation in nutrient concentration of needles (a) and sapwood (b) with isotopic and size-related traits (only significant effects are represented) after accounting for variability in soil physical–chemical parameters. Different symbols indicate coldspot trees (blue circles), hotspot non-declining (ND) trees (orange squares) and hotspot declining (DD) trees (brown triangles). Shaded areas represent the centroid of each vigor class. Gray labels indicate loadings of nutrient concentrations. Black arrows and labels represent the direction of the significant effects. Abbreviations: intrinsic water use efficiency (iWUE), leaf oxygen isotopic enrichment above source water (Δ18O).
Forests 17 00657 g001
Figure 2. Relationships between foliar isotopic composition, needle and sapwood elemental composition: foliar nitrogen (needle N) and intrinsic water-use efficiency (iWUE, (a)) and leaf oxygen enrichment above source water (Δ18O, (b)); foliar and sapwood N concentration (c); foliar and sapwood phosphorus (P) concentration (d); foliar and sapwood manganese (Mn) concentration (e); foliar and sapwood zinc (Zn) concentration (f). Solid and dashed lines indicate the significant relationships and 95% confidence intervals across vigor classes.
Forests 17 00657 g002
Figure 3. Relationship between intrinsic water use efficiency (iWUE) and foliar oxygen isotopic enrichment above source water (Δ18O). Different symbols represent different tree vigor classes: coldspot trees (blue circles), hotspot non-declining (ND) trees (orange squares) and hotspot declining (DD) trees (brown triangles). Solid and dashed lines indicate significant and positive relationships and 95% confidence intervals between isotopic signals across vigor classes.
Forests 17 00657 g003
Figure 4. (a) Interannual variability in basal area increment (BAI). Symbols and lines represent the mean BAI for each tree vigor class, and shaded areas around them are the standard error of the mean. (b) Mean growth resistance, recovery and resilience against 2012 and 2017 droughts. Different letters indicate significant (p < 0.05) differences among vigor classes. In (a,b), different colors represent different tree vigor classes: coldspot trees (blue), hotspot non-declining (ND) trees (orange), and hotspot declining (DD) trees (brown). Dotted horizontal lines indicate index = 1.
Forests 17 00657 g004
Figure 5. Coefficient estimates from selected linear mixed-effects models of drought resilience indices. Symbols indicate mean estimates, and arrows show 95% confidence intervals for resistance (circles, solid lines), recovery (squares, dashed lines), and resilience (triangles, dotted lines). Background color represents predictor sets: needle nutrients (green), sapwood nutrients (purple), and other isotope and size-related traits (blue). Note that intrinsic water use efficiency (iWUE) is not shown, as it was neither selected nor had significant effects in any of the models.
Forests 17 00657 g005
Table 1. Needle and wood nutrient concentration and ratios of coldspot trees, hotspot non-declining trees (ND) and hotspot declining trees (DD). Different letters indicate significant differences (p < 0.05) according to linear models and least-squares means, and they are highlighted in bold. The estimated coefficient and F-statistic of the linear mixed-effects models between foliar and sapwood nutrient composition are also shown. Asterisks indicate significant effects. Values are mean ± standard error.
NeedleSapwoodRelationship
ColdspotHotspot_NDHotspot_DDColdspotHotspot_NDHotspot_DDEst. ± SEF
N (mg g−1)11.47 ± 0.18 a12.34 ± 0.26 b12.70 ± 0.32 b1.06 ± 0.03 a1.14 ± 0.08 a0.96 ± 0.07 a0.60 ± 0.333.56 *
P (mg g−1/μg g−1)0.77 ± 0.02 a0.78 ± 0.04 a0.74 ± 0.04 a66.21 ± 4.44 a81.52 ± 6.06 b79.71 ± 4.75 b0.64 ± 0.237.41 *
K (mg g−1)5.53 ± 0.24 b5.41 ± 0.37 ab4.91 ± 0.42 a0.69 ± 0.03 a0.87 ± 0.09 a0.85 ± 0.08 a−0.13 ± 0.170.61
Ca (mg g−1)4.30 ± 0.18 a4.52 ± 0.34 ab5.81 ± 0.39 b0.94 ± 0.05 a1.28 ± 0.10 b1.32 ± 0.07 b0.04 ± 0.130.09
Mg (mg g−1)1.12 ± 0.05 a1.09 ± 0.06 a1.26 ± 0.06 b0.16 ± 0.01 a0.17 ± 0.02 a0.16 ± 0.02 a0.25 ± 0.191.69
S (mg g−1/μg g−1)0.80 ± 0.02 a0.84 ± 0.02 ab0.88 ± 0.02 b65.81 ± 2.80 a91.09 ± 4.61 b81.90 ± 4.87 b−0.47 ± 0.312.27
Fe (μg g−1)102.3 ± 4.7 a116.4 ± 8.6 ab139.6 ± 9.8 b144.4 ± 16.9 a188.1 ± 25.2 a152.8 ± 20.9 a0.33 ± 0.271.45
Mn (μg g−1)315.4 ± 36.5 a87.58 ± 13.84 a96.56 ± 19.95 a30.62 ± 3.36 a7.70 ± 1.59 a6.85 ± 1.48 a0.69 ± 0.1912.73 *
Cu (μg g−1)3.01 ± 0.08 a3.22 ± 0.09 a3.27 ± 0.14 a1.18 ± 0.05 a1.24 ± 0.10 a1.16 ± 0.11 a0.16 ± 0.230.51
Zn (μg g−1)35.76 ± 2.09 a39.97 ± 2.61 a43.73 ± 2.47 a10.60 ± 0.73 a14.63 ± 1.11 a14.41 ± 0.99 a0.37 ± 0.165.49 *
Ni (μg g−1)3.16 ± 0.31 a3.94 ± 0.47 a3.10 ± 0.55 a1.84 ± 0.11 a2.55 ± 0.27 a2.19 ± 0.18 a−0.01 ± 0.090.02
N:P15.00 ± 0.42 a16.14 ± 0.69 ab17.28 ± 0.91 b17.78 ± 1.22 b14.32 ± 1.24 a11.57 ± 1.54 a−0.08 ± 0.300.06
N:K2.20 ± 0.12 a2.46 ± 0.20 b2.81 ± 0.20 b1.40 ± 0.05 a1.35 ± 0.14 a1.12 ± 0.15 a−0.19 ± 0.171.23
K:Ca1.28 ± 0.07 b1.15 ± 0.08 b0.75 ± 0.10 a66.21 ± 4.44 a81.52 ± 6.06 a75.71 ± 4.75 a0.13 ± 0.101.82
Fe:Cu34.96 ± 1.70 a33.49 ± 1.79 a41.54 ± 2.99 b0.69 ± 0.03 a0.87 ± 0.09 a0.85 ± 0.08 a−0.06 ± 0.240.05
Table 2. Isotopic signatures and radial growth drought responses of coldspot trees, hotspot non-declining trees (ND) and hotspot declining trees (DD). Different letters indicate significant differences (p < 0.05) according to linear models and least-squares means, and they are highlighted in bold. Values are mean ± standard error.
VariableColdspotHotspot_NDHotspot_DD
Foliar isotopic composition
 δ13C (‰)−25.62 ± 0.15 a−24.89 ± 0.17 b−24.31 ± 0.2 c
 iWUE (μmol mol−1)110.1 ± 1.8 a116.9 ± 2.0 b123.0 ± 2.2 c
 Δ18O (‰)38.68 ± 0.17 a39.17 ± 0.33 ab39.77 ± 0.41 b
Radial growth
 mBAI_10 (cm2)4.96 ± 0.33 b3.15 ± 0.42 a3.23 ± 0.33 a
 Resistance0.90 ± 0.03 c0.72 ± 0.04 b0.55 ± 0.04 a
 Recovery1.21 ± 0.05 a1.62 ± 0.13 ab1.75 ± 0.13 b
 Resilience1.06 ± 0.03 a1.18 ± 0.06 a1.05 ± 0.07 a
Abbreviations: carbon isotope composition (δ13C); intrinsic water use efficiency (iWUE); leaf oxygen isotopic enrichment above source water (Δ18O); mean basal area increment of the last 10 years (mBAI_10).
Table 3. Variance partitioning of linear mixed-effects models showing the contribution of needle nutrients, sapwood nutrients, and isotopic and size-related traits to explain variability in drought resistance indices. For each index and set of predictors, the marginal R2 (95% confidence intervals) is shown.
ResistanceRecoveryResilience
Needle nutrients0.065 (<0.001/0.366)0.050 (<0.001/0.332)
Sapwood nutrients0.209 (0.075/0.478)0.141 (0.053/0.439)0.175 (0.083)
Isotopic and size traits0.129 (<0.001/0.412)0.090 (0.006/0.370)
Full model0.461 (0.324/0.688)0.195 (0.086/0.527)0.186 (0.089/0.579)
Disclaimer/Publisher’s Note: The statements, opinions and data contained in all publications are solely those of the individual author(s) and contributor(s) and not of MDPI and/or the editor(s). MDPI and/or the editor(s) disclaim responsibility for any injury to people or property resulting from any ideas, methods, instructions or products referred to in the content.