1. Introduction
According to Poorter et al. [
1], forest succession is defined as a directional change in species populations, the community, and the ecosystem at a site following an ecological disturbance. Ecological disturbances include natural events such as windstorms. Tropical cyclones are powerful windstorms often accompanied by heavy rainfall. Tropical cyclones mainly occur at latitudes of approximately 10° to 20° in the Pacific, North Atlantic, and South Indian oceans [
2]. The tropical cyclones then proceed north or south in the Northern or Southern Hemispheres, respectively. Some tropical cyclones reach and run over land, and then may disturb the forest stands. The ‘storm-warning zone’ (bofu-iki) is defined as the area where wind speeds reach 25 m s
−1 or higher. Near Japan, it is not uncommon for regions to remain within this zone for ten hours or more several times a year. Such prolonged exposure to tropical cyclones inevitably leads to catastrophic damage.
Details of forest disturbance caused by tropical cyclones have been well documented by photographs by Kagamihara et al. [
3]. After a tropical cyclone hit a western Japanese region, some tree root systems were detached from the soil, and the root systems that remained in the soil rapidly decomposed. The outcome of forest disturbances, such as that mentioned above [
3], was detected as changes in ecological indicators such as the normalized difference vegetation index (NDVI) [
4], which indicates the health status of green biomass. Tropical cyclone-induced decreases in NDVI were recognized after the observed forest stands had experienced the uprooting of trees, breaking of tree trunks and branches, and defoliation [
5]. The enhanced vegetation index (EVI [
6]) was employed to accurately identify cyclone-affected forest stands [
7]. Unlike NDVI, which is often saturated in high-biomass regions, EVI maintains sensitivity in dense forests, allowing for the precise detection of fallen trees.
A recent review article shows that forest disturbances caused by windstorms, fires, pests, or diseases kill vulnerable trees that eventually release organic matter and inorganic nutrients [
8,
9]. These processes enable the colonization of diverse taxonomic newcomers, driving a process of ecological succession in which the species most adaptable to the new environment eventually become dominant. These shifts in species composition and the acceleration of succession are accompanied by niche-derived diversity and unique ecosystems [
10]. Tropical cyclones and related disasters are common in Japan and often cause forest disturbances [
2]. For example, in Tokyo, tropical cyclones occasionally knock down vulnerable trees that die afterward. Fujiwara [
11] found that the species composition in the forest had clearly changed between 1950 and 1971, when more than 90% of chinkapin (
Castanopsis cuspidata (Thunb.)), a broadleaved laurel species, survived. Meanwhile, only 13% of pines and 5% of Japanese cedars (
Cryptomeria japonica (Thunb. ex L.f.) D.Don) were still standing after being occasionally hit by tropical cyclones. In the south coastal regions of Japan, these processes alter the secondary forest stands originally dominated by human-introduced coniferous trees, typically, pines and Japanese cedars. Eventually, the forest changed to an evergreen laurel forest, which is the climax forest type in the region [
12]. Along the east coast of the United States, which shares climatic similarities with the southern coastal regions of Japan, tropical cyclones have been identified as a driving force of forest succession [
13].
Besides tropical cyclones, the memory of the 2011 Great East Japan Earthquake remains vivid, and numerous other seismic events continue to cause damage across Japan on an almost annual basis. Earthquakes have also caused significant forest disturbance, observed as decreases in NDVI value as well as the recovery [
14,
15]. Even though earthquakes have immediate destructive effects on forest ecosystems, they can also be driving forces of forest succession by allowing the surviving tree species to fit in the post-earthquake landscape while vulnerable tree species are eliminated [
16]. Moreover, under global climate change, intensifying typhoons represent a growing climate risk rather than merely isolated disturbance events.
Here, a question arises. If an extremely strong tropical cyclone or a major earthquake hits a forest ecosystem, which one has the more significant statistical contribution to vegetative biomass loss, as indicated by changes in EVI value? To compare the effects, changes in EVI before and after disasters were expected to give an answer to the question. Numerous studies have documented the processes of forest disturbance [
17] and subsequent recovery [
18] related to tropical cyclones. Similarly, some records exist regarding the destructive impacts [
19] and restoration [
20] associated with earthquakes. However, there has been no comparative analysis to date that directly evaluates the destructive power of these two forces at a shared site.
As such, this study was conducted to examine whether either a strong tropical cyclone or a major earthquake resulted in more significant changes in EVI value across forest stands in the Rokko Mountains in western Japan, hypothesizing that the impact of the earthquake would be more profound.
2. Materials and Methods
In 1991, 1994, and 2018, the Rokko mountains were hit by extremely strong super typhoons [
21]. Typhoons are a regional name for tropical cyclones [
2]. The 1991, 1994, and 2018 typhoons meet the criteria for super typhoon status. Super typhoons are defined as those with surface wind speeds of 130 knots (240 km h
−1) or greater [
22]. Changes in EVI were obtained for pixels representing 30 × 30 m areas in the Rokko Mountains. The EVI values within a period of a single year were compared before and after the 1991, 1994, and 2018 typhoon seasons. To enable the evaluation of the effects of each super typhoon independently from other events, including typhoons, earthquakes, and others, December, January, and February (winter) composite EVI datasets for 1991, 1994 or 2018 were used to minimize the effects of other typhoons and earthquakes in previous years, mitigating possible interactions among multiple typhoons and other events spanning more than a single year [
23,
24]. Likewise, changes in the EVI in the same area were obtained as effects of the major earthquake that shook the area on 17 January 1995. The before–after comparison was made using EVI values for the 18 January–28 February 1995 composite and the 1992–16 Jan 1995 winter composite to evaluate the immediate earthquake effects. Year-long earthquake processes were also evaluated by comparing the 18 Jan 1995–1996 winter composite EVI values against those from the 1992–16 Jan 1995 winters. The comparisons were made taking topographical changes into account.
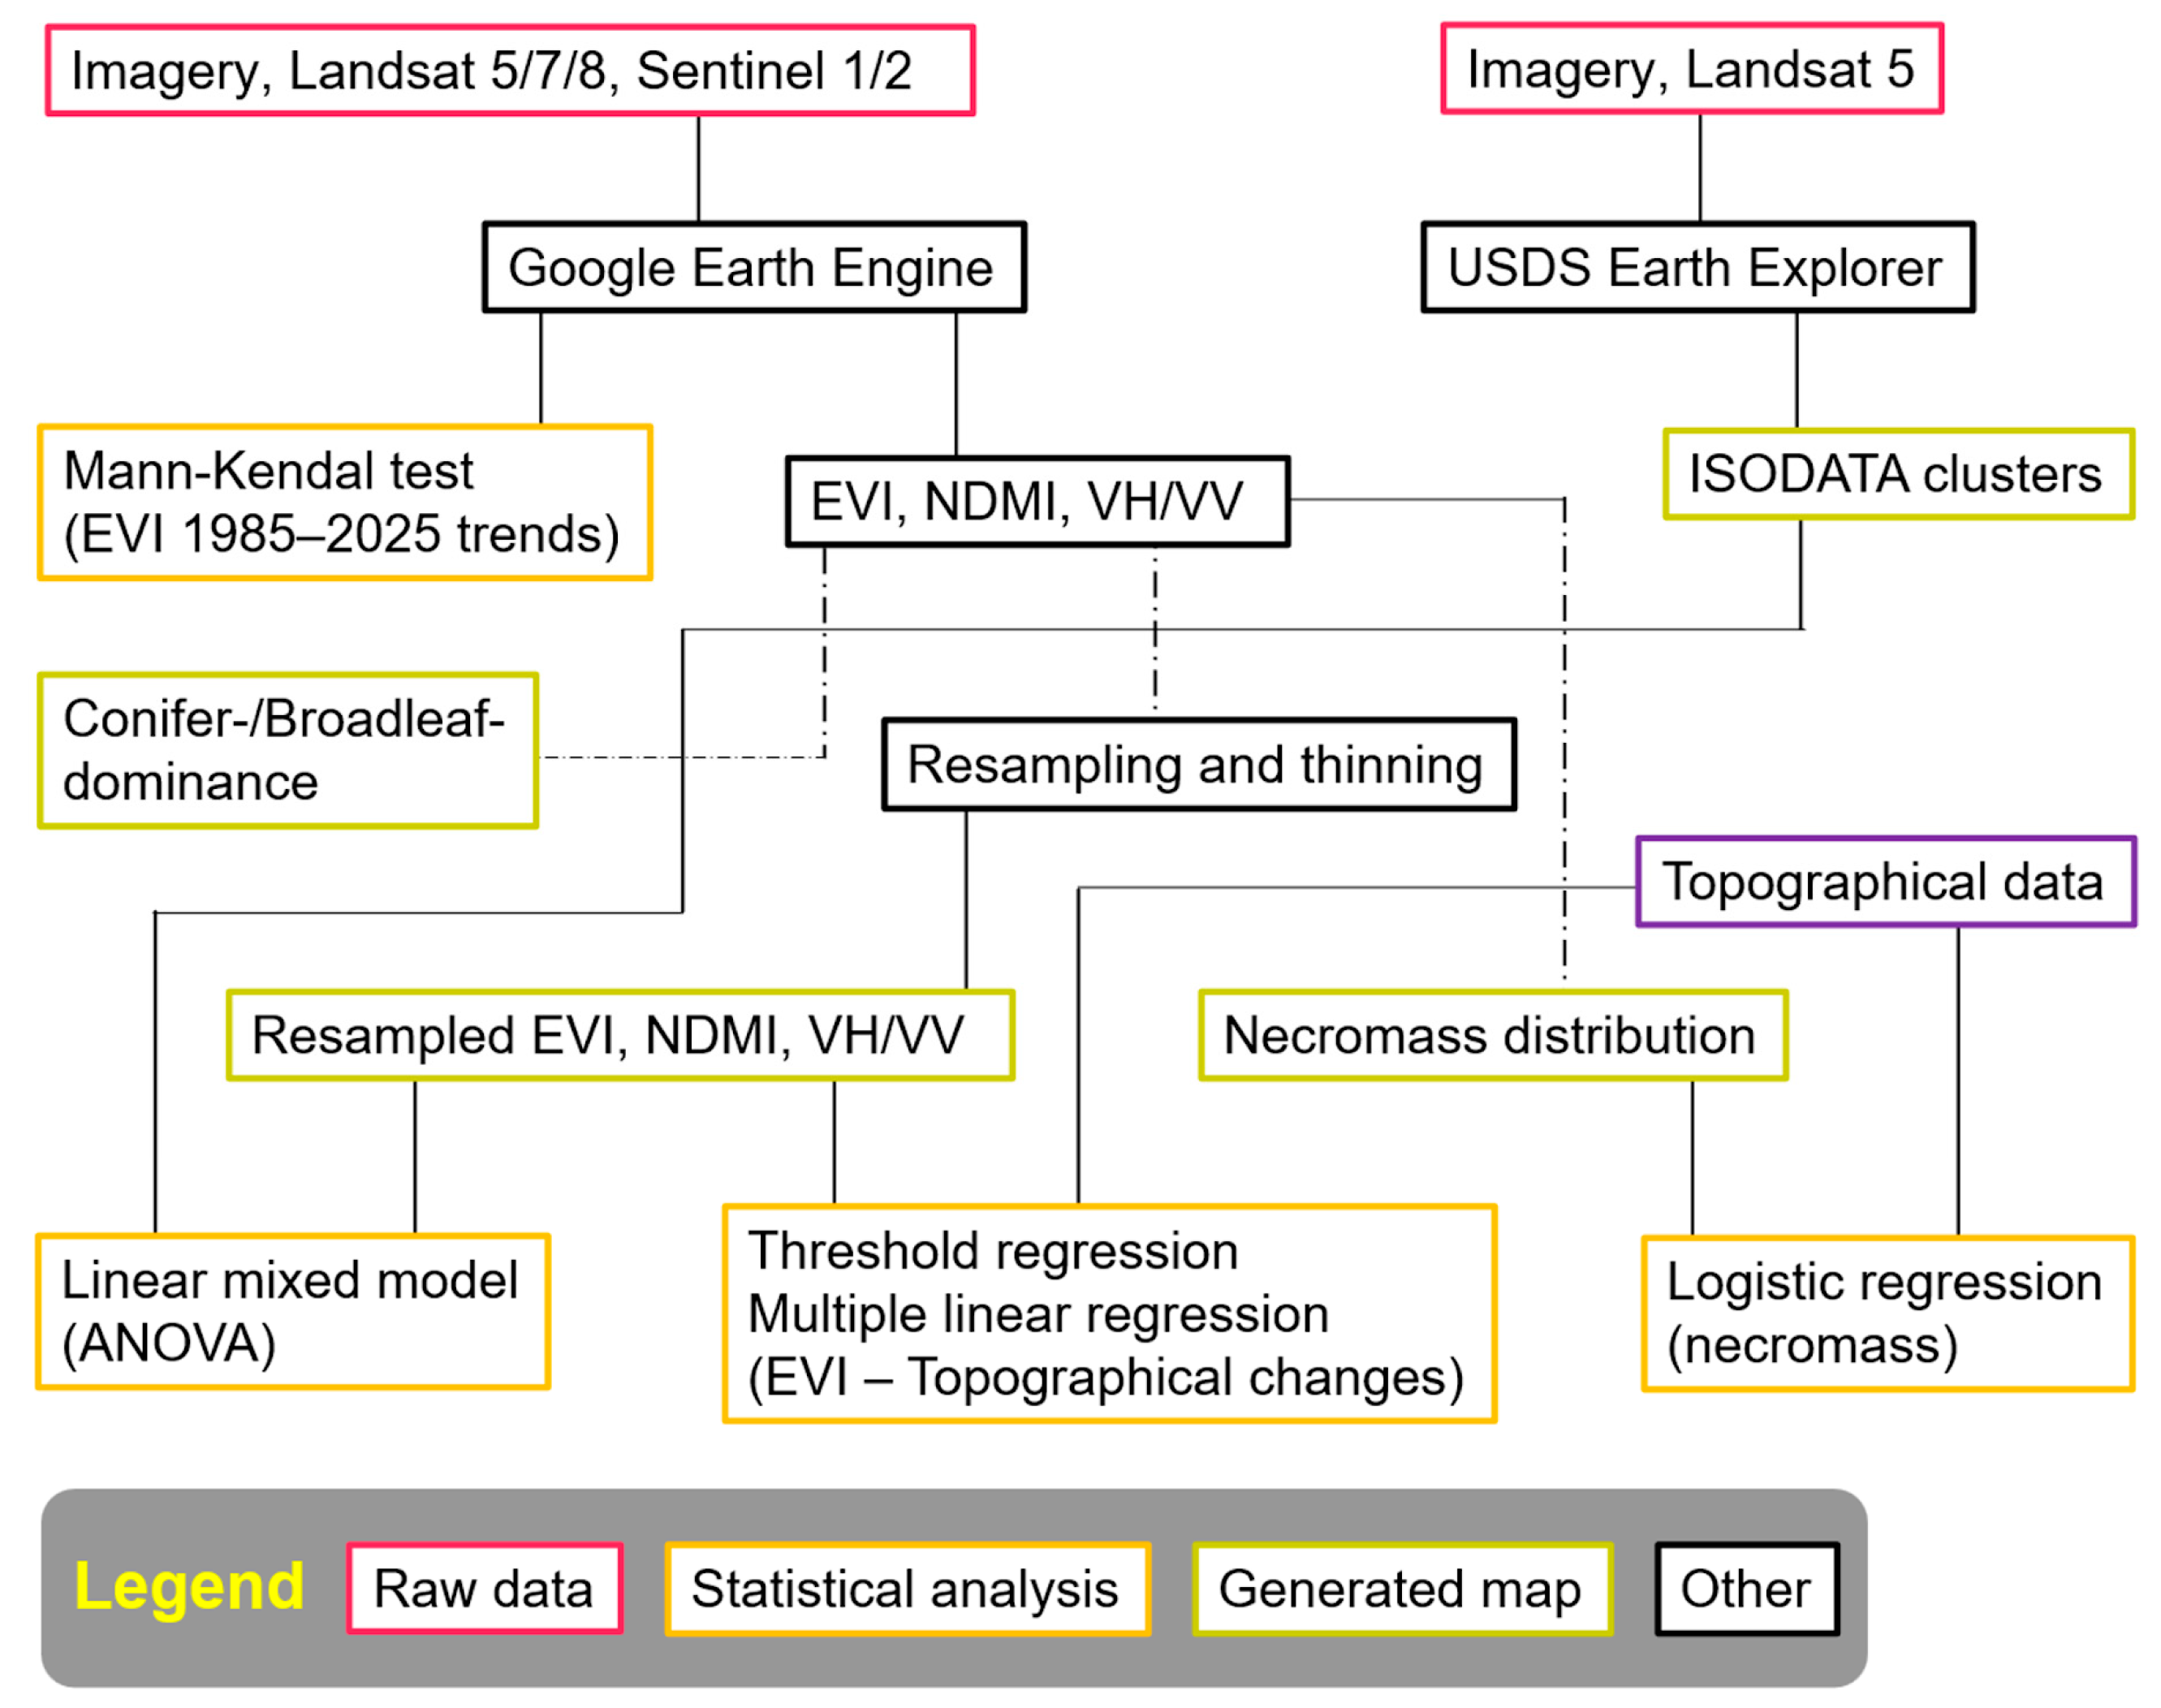
The workflow of this research is shown in
Figure 1, and it will be described in the following chapters.
2.1. Site Description
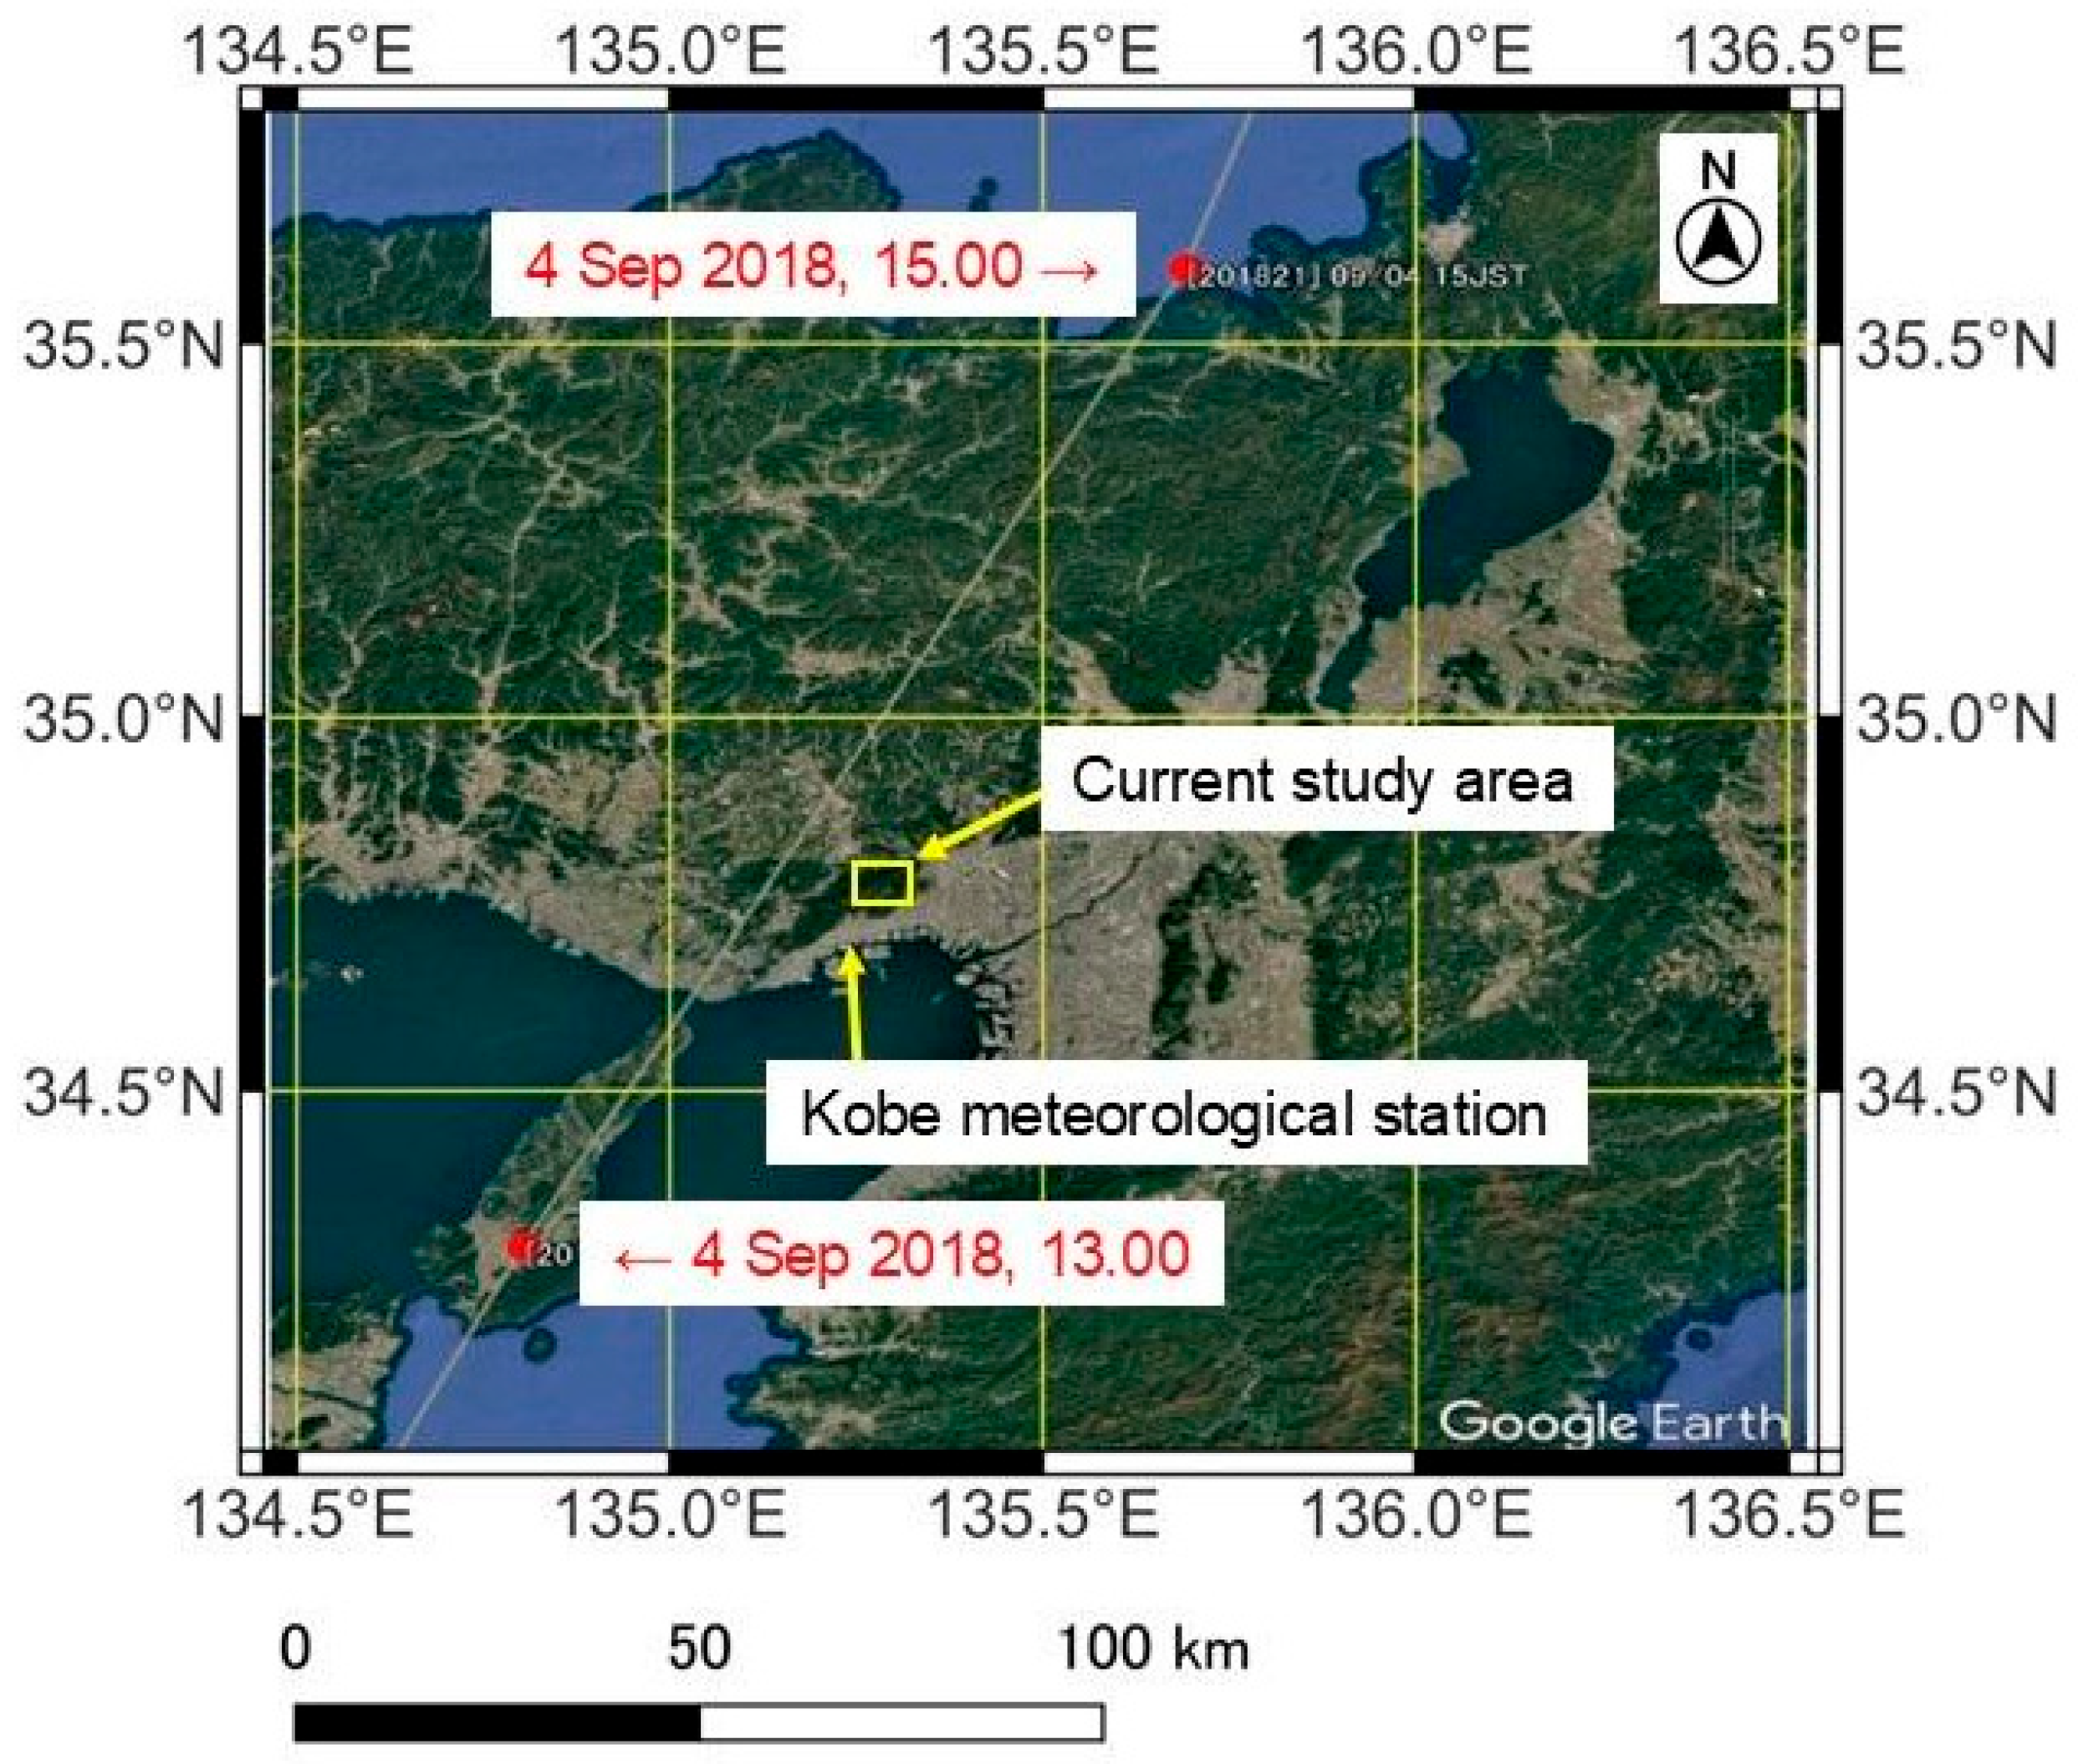
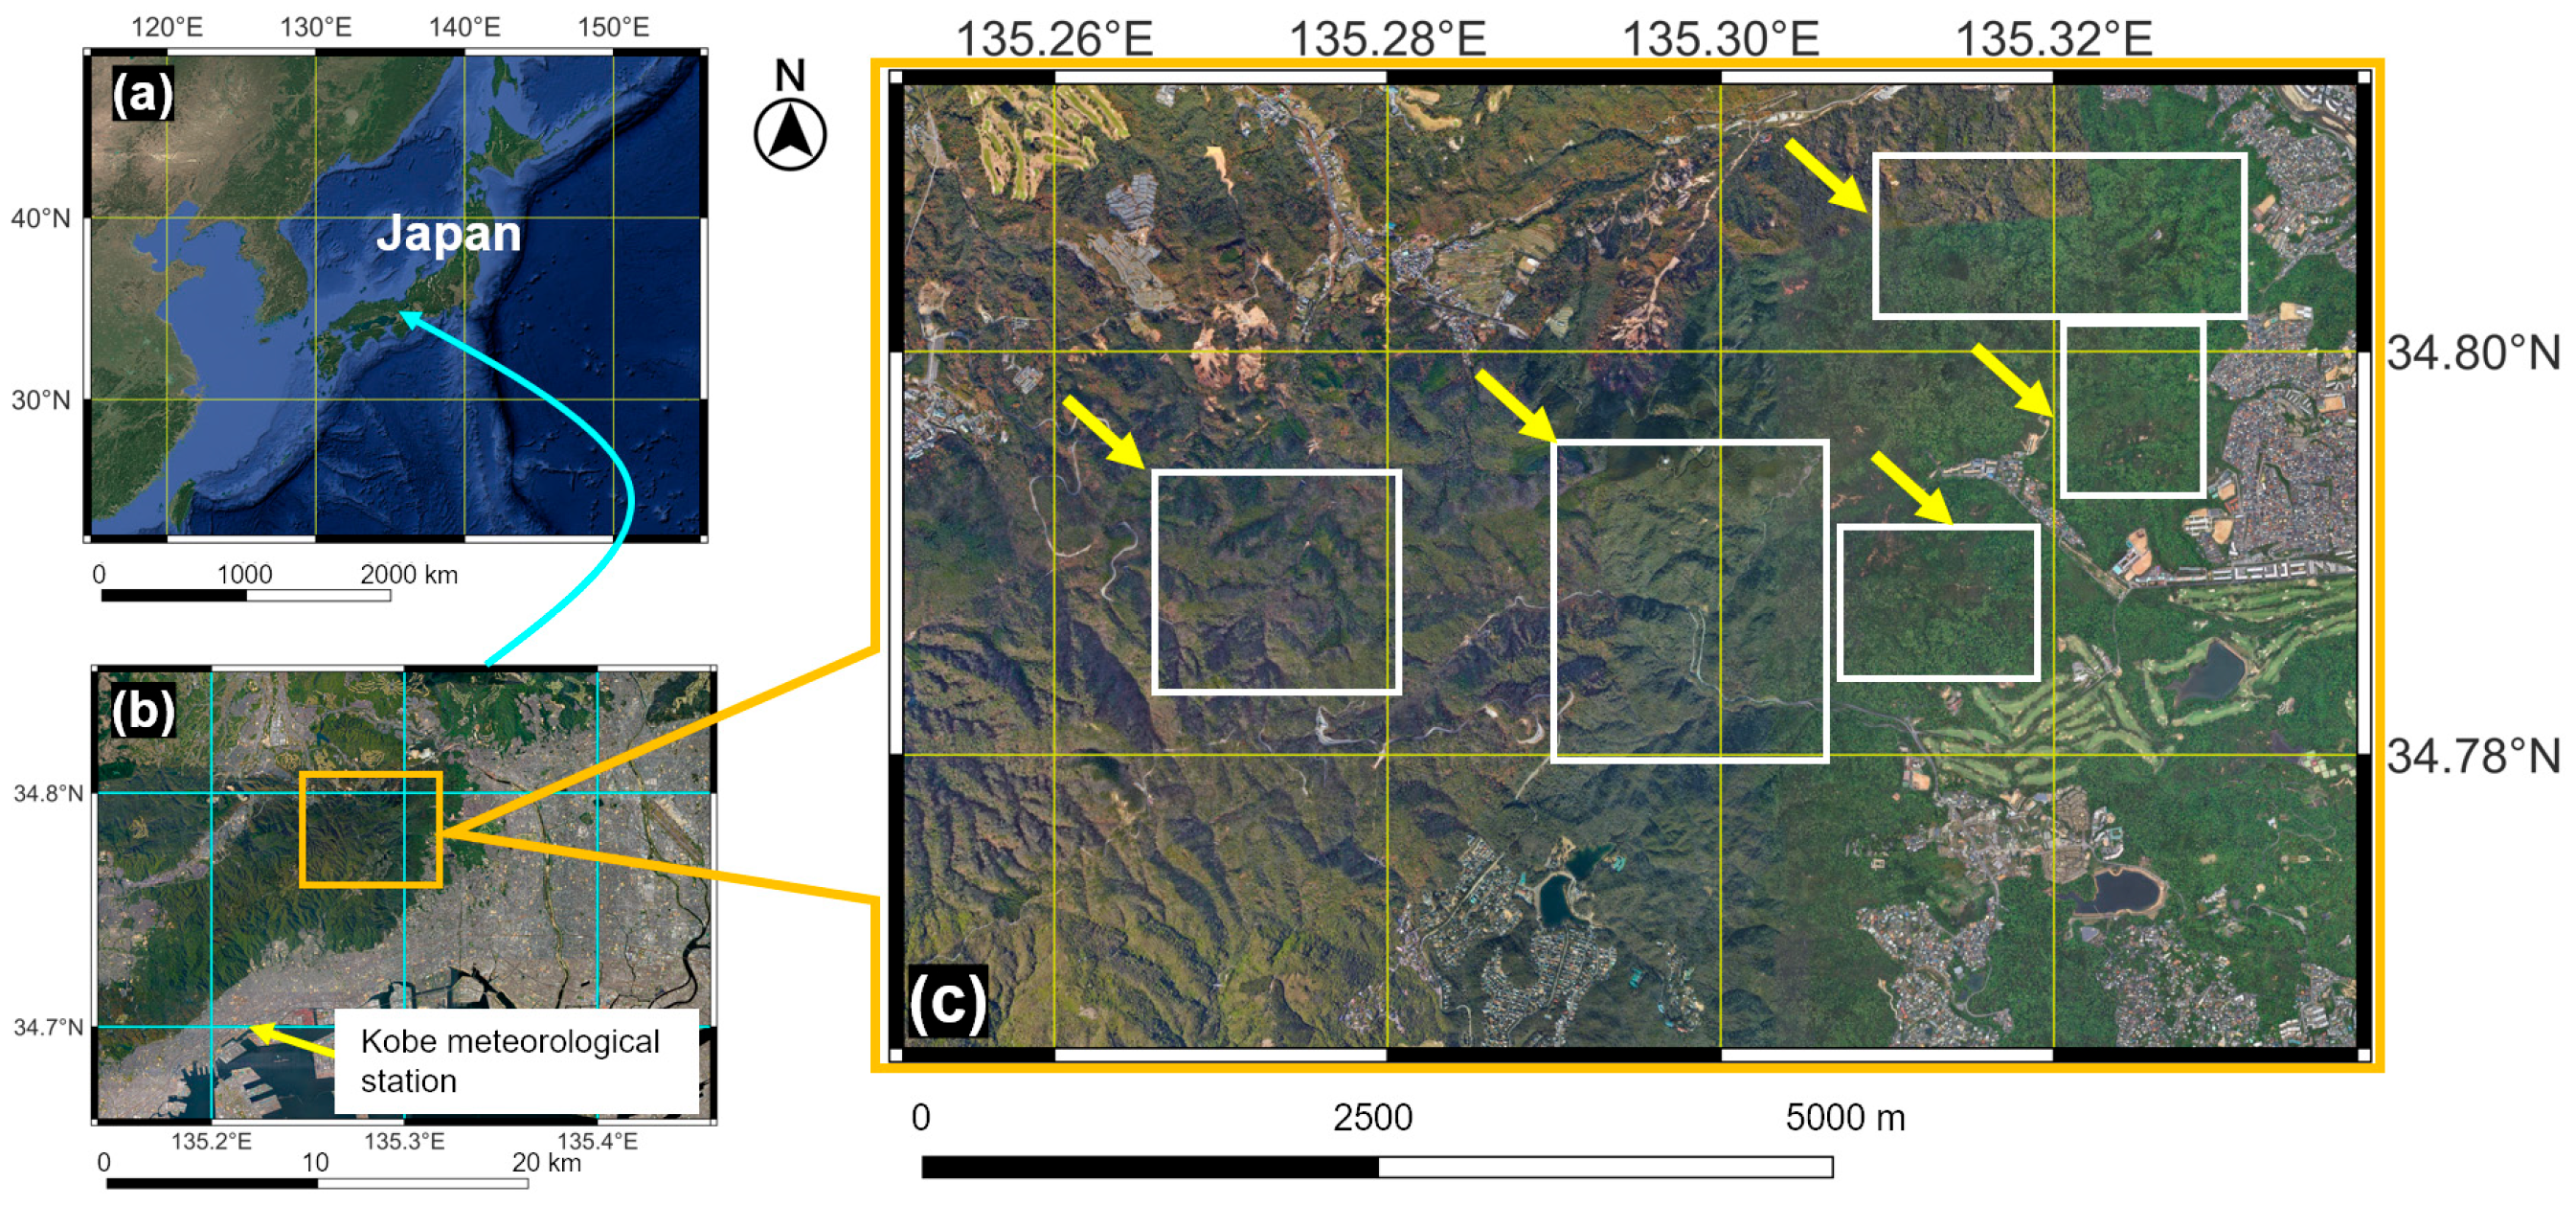
The current study site is located mainly in Kobe city, Hyogo prefecture, in western Japan (
Figure 2). According to Köppen [
25], the Rokko Mountains and the surrounding areas shown in
Figure 2b belong to the humid subtropical zone (Cfa). The mountains have the highest altitude of 931 m above sea level at 34.7780° N, 135.2637° E in Kobe city, Japan. According to Takahashi et al. [
26], almost the entire area of the mountains has a brown forest soil derived from granite [
27]. The soil has low fertility while its water permeability is high [
26].
The mountains have had centuries of deforestation history; they lost a significant number of trees and became bare except for a small area [
28]. In the early 1900s, landslides and their subsequent outcomes occasionally damaged downtown Kobe city. Then, to cope with this risk, a reforestation program to restore the Rokko’s vegetation was started in 1902 [
29,
30]. In the last 100 years, limited human activities accompanied by deforestation occurred [
31]. The mountains were included in the Setonaikai National Park, established in 1934 [
32].
In the reforestation program, multiple tree species were introduced. The most widely introduced was a pine tree species (
Pinus densiflora Siebold et Zucc.). Another widely introduced tree was
Alnus firma Siebold et Zucc., a Japan-endemic tree species that fixes atmospheric nitrogen. The program also involved other tree species, including coniferous evergreen species of Japanese cedar (
Cryptomeria japonica (Thunb. ex L.f.) D.Don) and Japanese cypress (
Chamaecyparis obtusa (Siebold et Zucc.) Endl.). Some deciduous trees were also introduced. These were zelkova (
Zelkova serrata (Thunb.) Makino), sawtooth oak (
Quercus acutissima Carruth.), maple species, and others [
30]. To date, depending on the site, most of the initially introduced trees have been substituted by others, such as camphor trees (
Camphora officinarum Boerh. ex Fabr.), a broadleaf evergreen laurel species. Between 1954 and 2004, evergreen laurel tree species became more abundant than in the past [
33].
The area including the mountains and Kobe city was strongly shaken by an earthquake on 17 January 1995. The magnitude values were Mw = 6.9 and Mj = 7.2 [
34]. The effects on the forest stands were also analyzed and compared with those of typhoons.
2.2. Meteorological Data on Typhoons
Super typhoons Mireille, Orchid, and Jebi hit the region in 1991, 1994, and 2018, respectively. Typhoons are tropical cyclones that occur in the northwestern Pacific Ocean [
2]. Mireille and Orchid were category 4 super typhoons, the second-most intense typhoon category [
35]. Jebi was a category 5 super typhoon, the strongest one. The nearest meteorological station was the Kobe meteorological station (
Figure 2b). The meteorological data from the meteorological station on the 3 days of the super typhoons were retrieved from the Japan Meteorological Agency website (
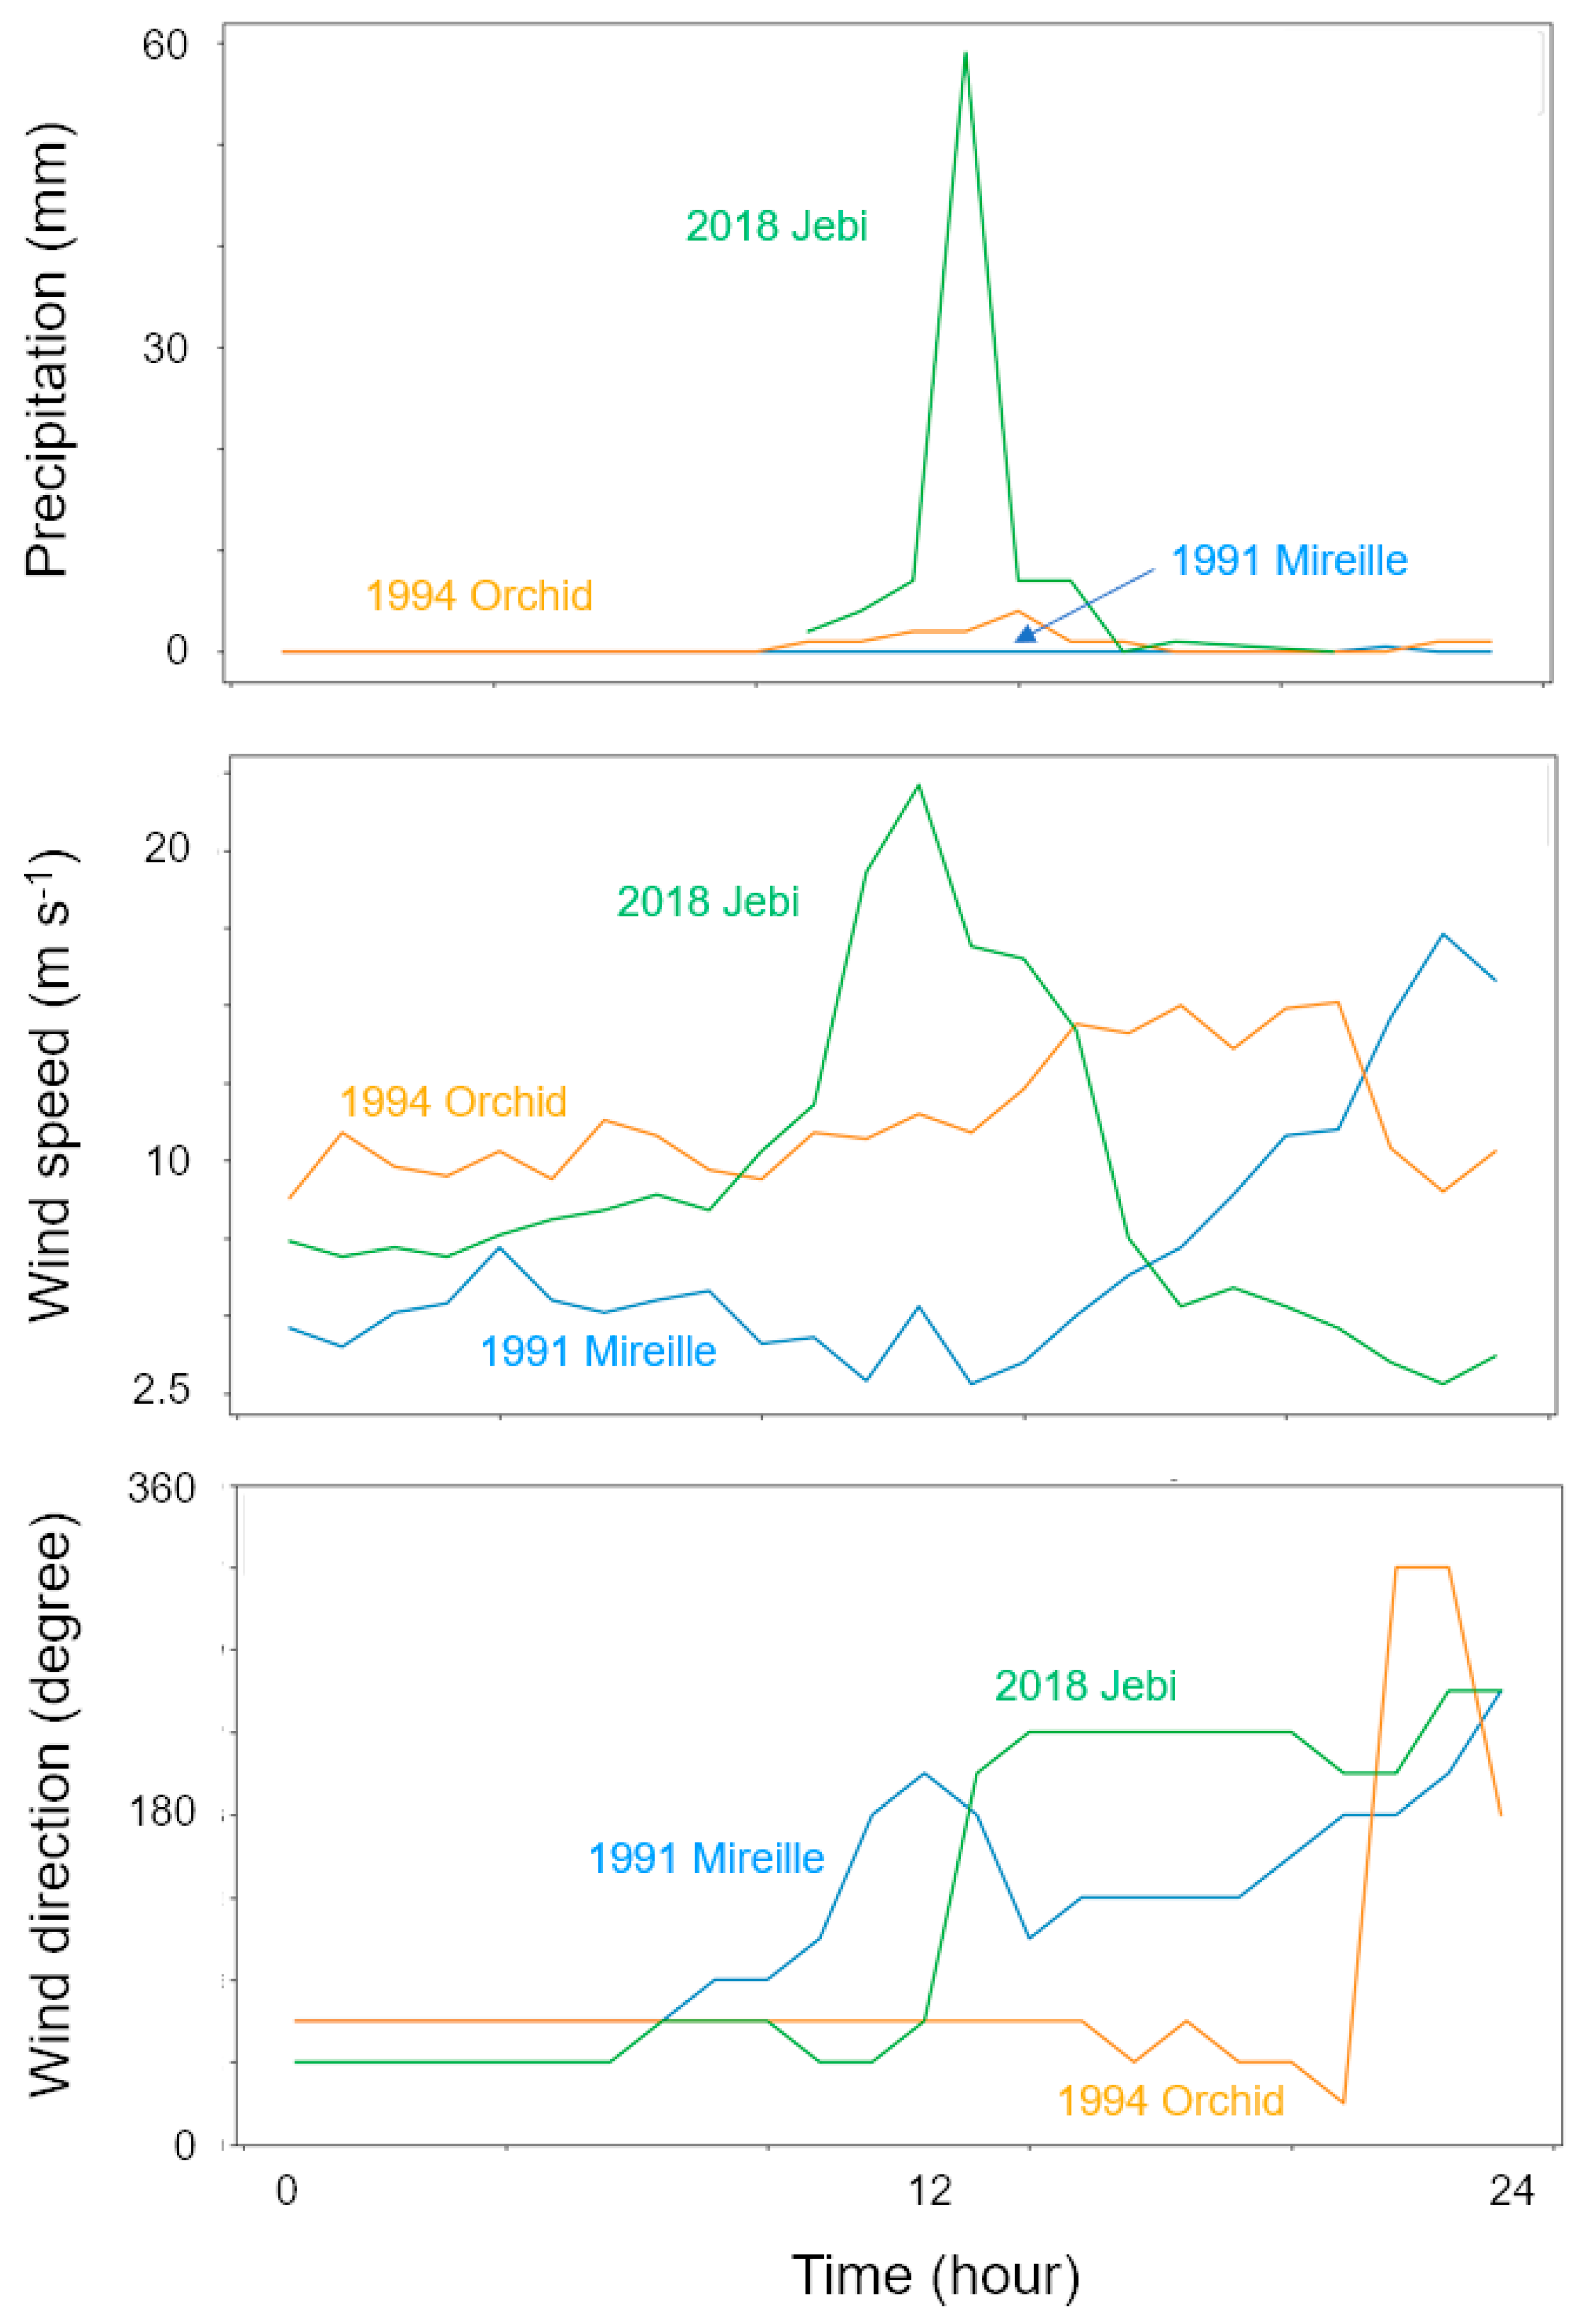
https://www.jma.go.jp/jma/indexe.html accessed on 2 May 2026). From the website, meteorological data on 27 September 1991 (Mireille), 29 September 1994 (Orchid), and 4 September 2018 (Jebi) were retrieved (
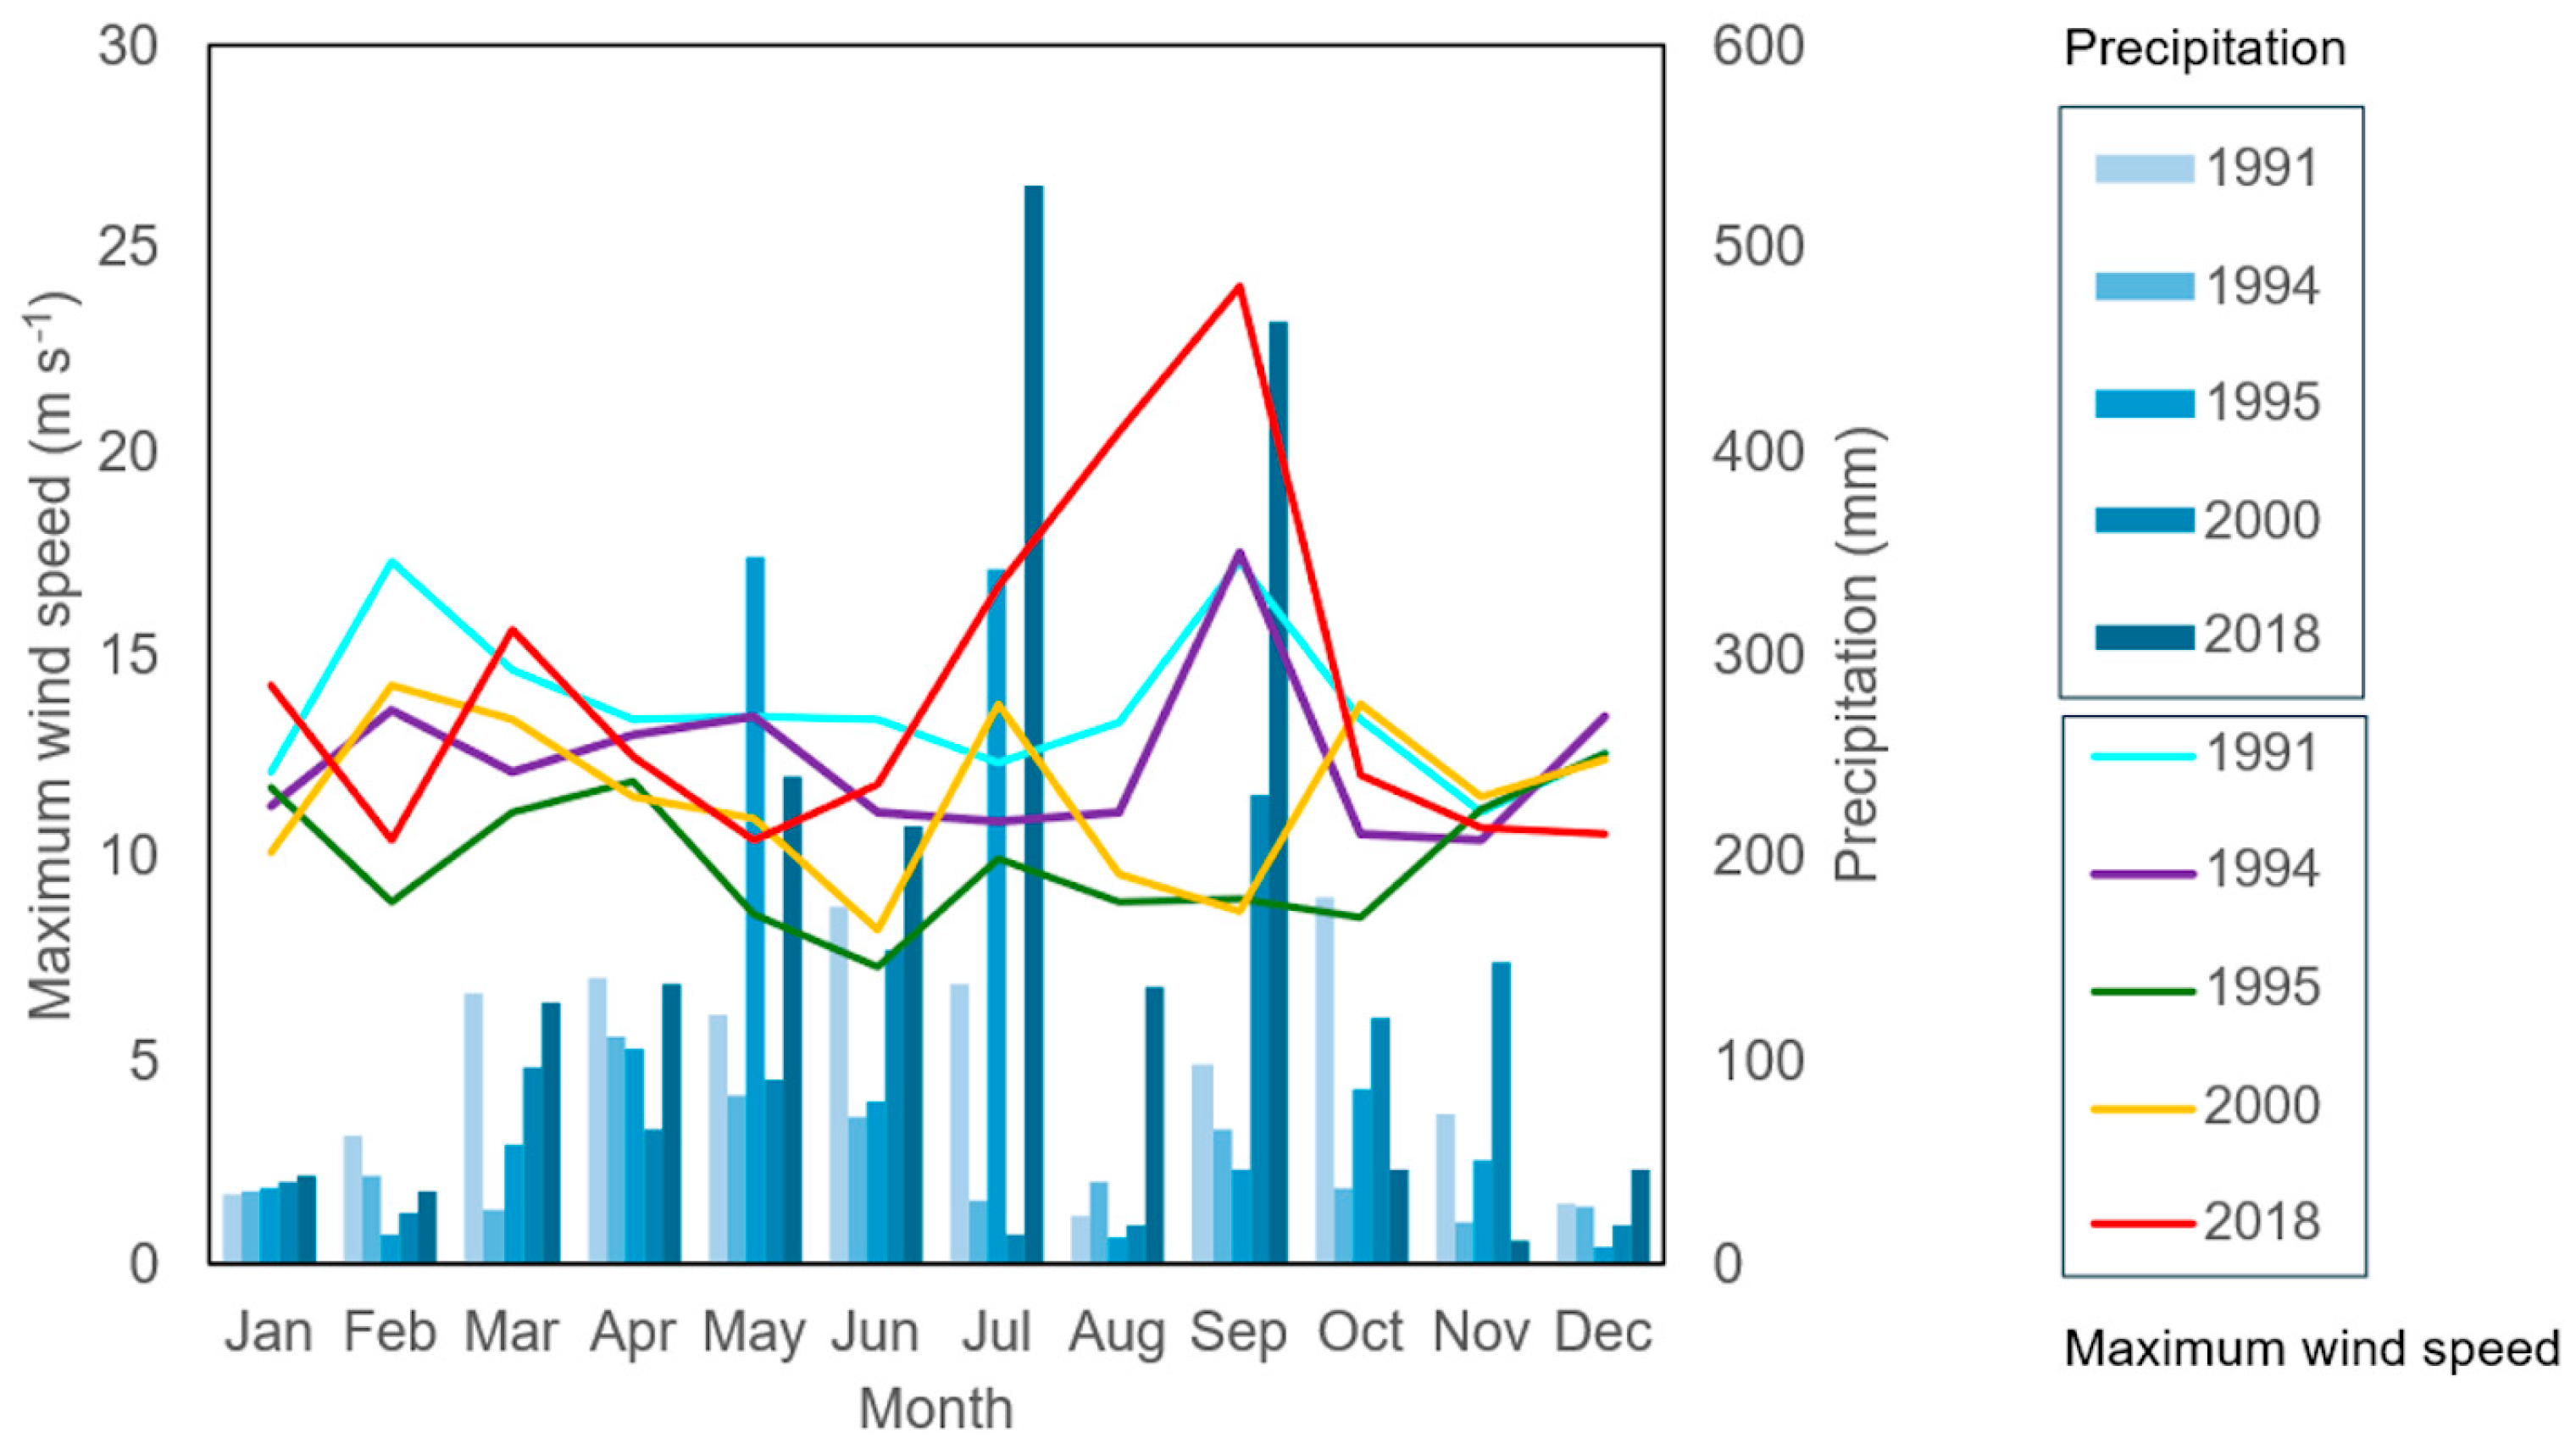
Figure 3). The website also provided the number of typhoons that had struck the region, including Kobe city and the Rokko Mountains. The mean number of typhoons approaching within 300 km of Kobe was 3.8 per year between 1991 and 2018 (standard deviation 1.9). The typhoon numbers in 1991, 1994, 1995, 2000, and 2018 were 4, 2, 1, 0, and 5, respectively.
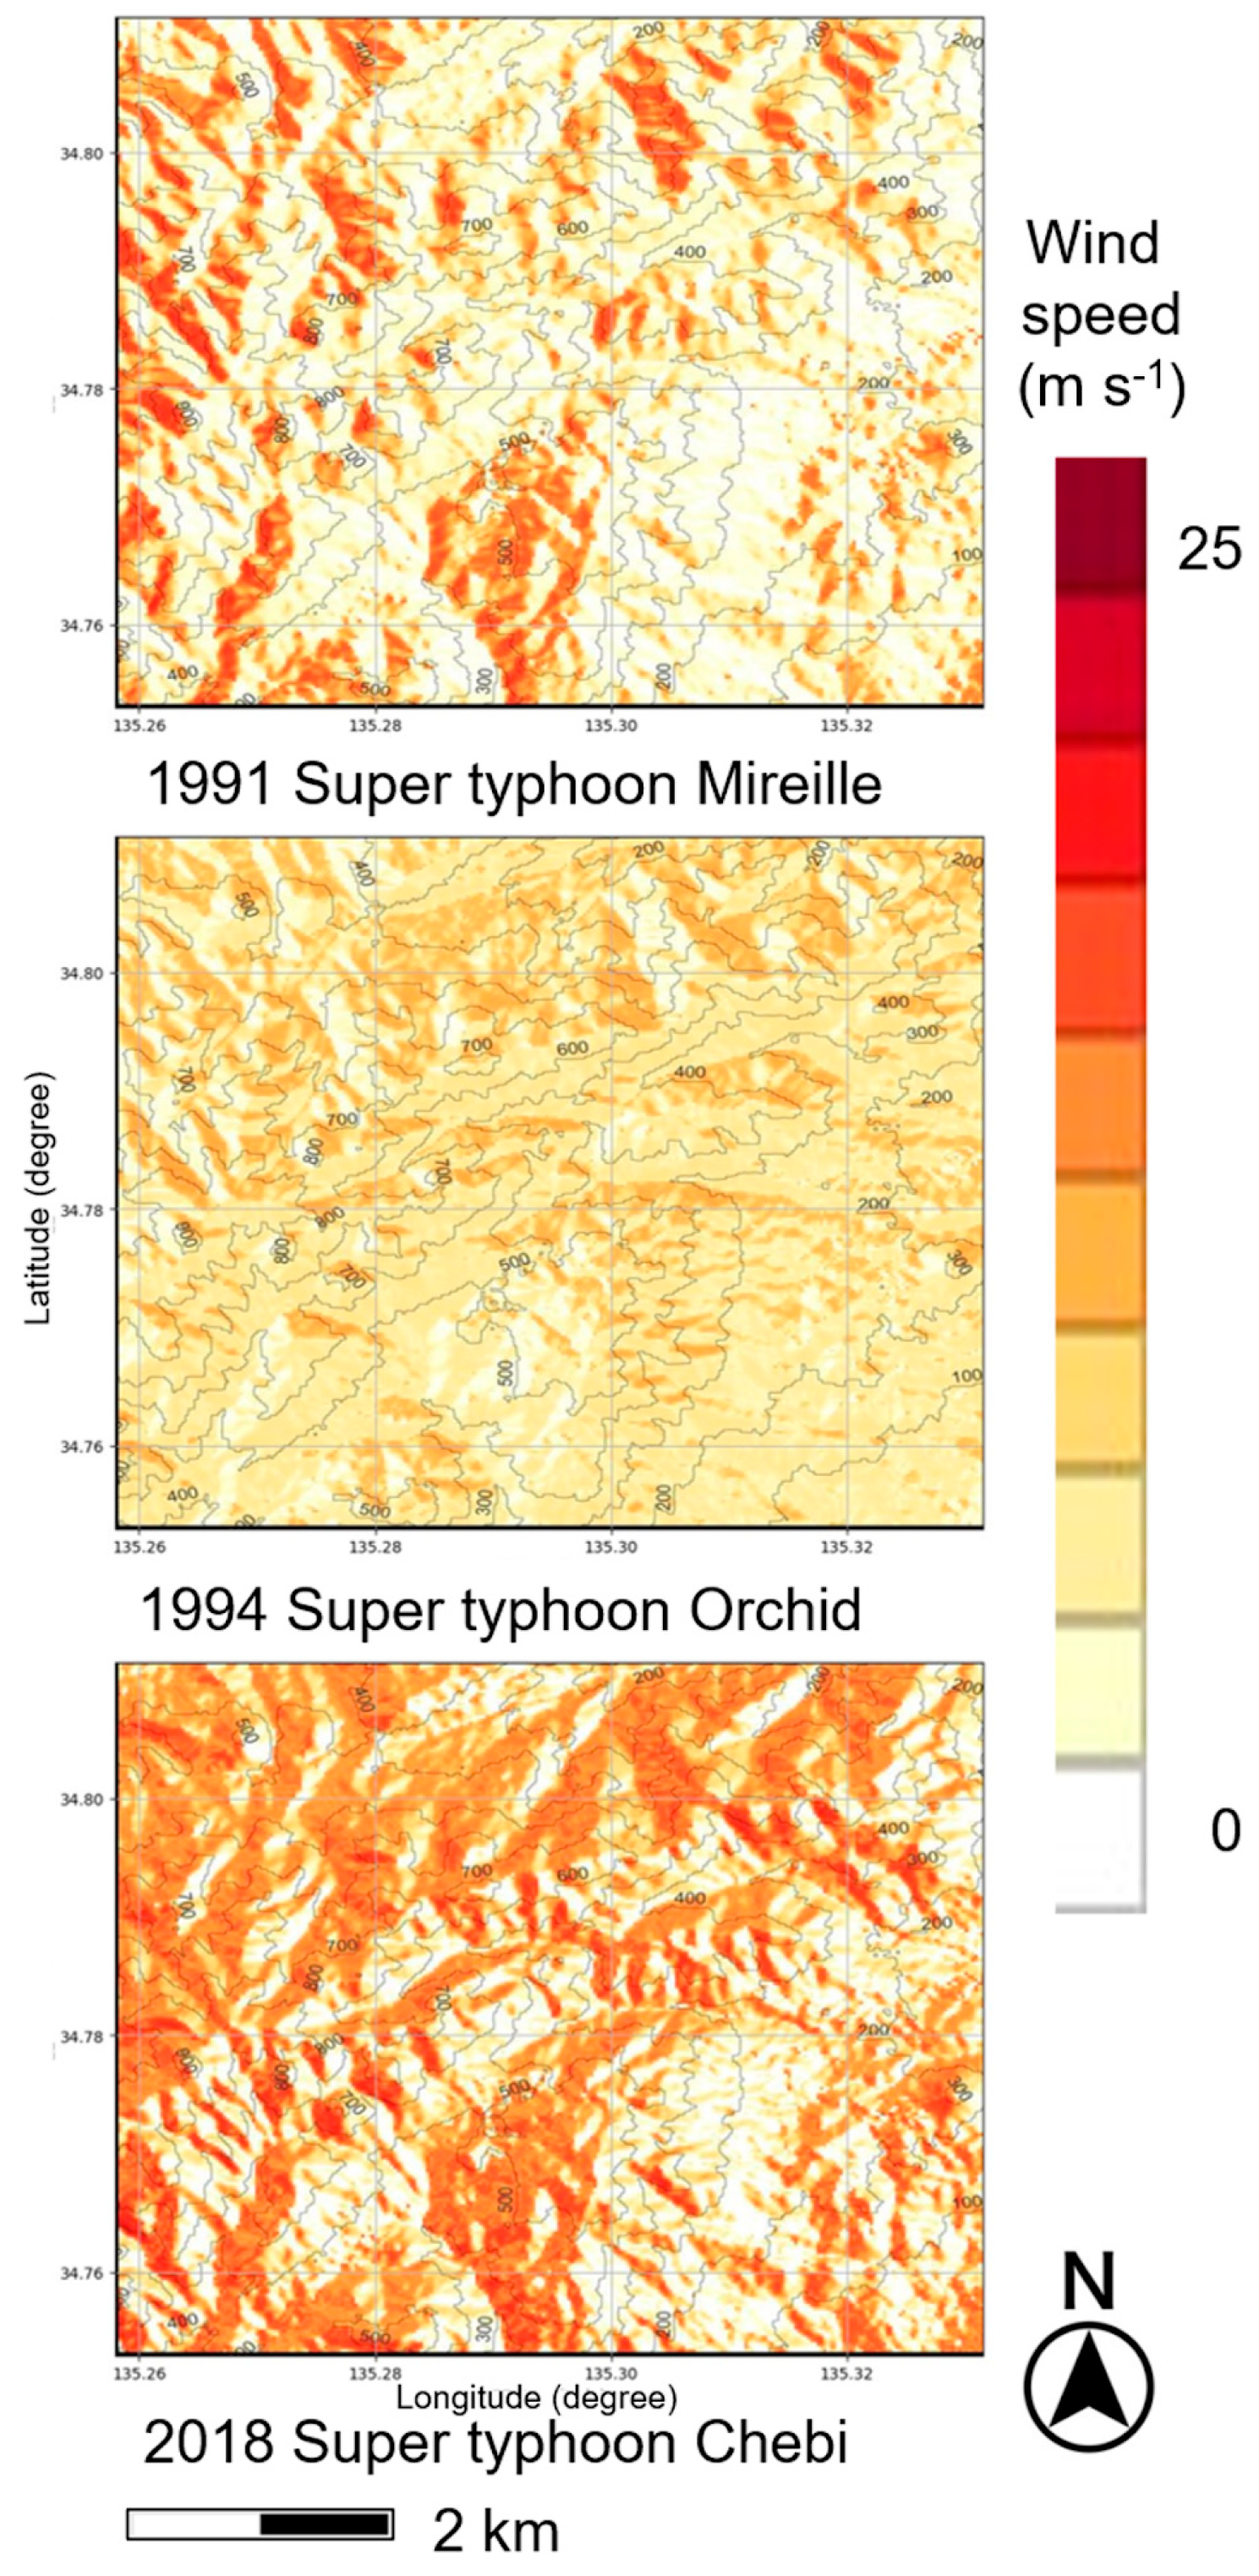
The maximum terrain-adjusted wind speeds on Rokko slopes during the typhoons were evaluated as follows. To evaluate the physical stress imposed by the typhoons, two datasets were integrated within the Google Earth Engine platform (Map data: Google, DigitalGlobe). The datasets were topographic and meteorological variables. Sin- and cos-converted components derived from wind speeds and directions at 10 m above the surface were obtained from the ECMWF ERA5-Land hourly dataset. Google Earth Engine performed the wind impact simulation and maximum impact extraction.
2.3. Remote Sensing Data
Google Earth Engine was employed to retrieve remote sensing data. For all analysis periods, a median composite was generated to derive representative reflectance values.
To perform a three-decade-long assessment of vegetation changes, for the analysis spanning from the late 1980s to the early 2000s, data from Landsat 5 Thematic Mapper and Landsat 7 Enhanced Thematic Mapper+ collection 2 level 2 were selected. For the contemporary analysis focused on 2015–2019, Sentinel 2 MultiSpectral Instrument level 1C data were utilized (European Space Agency, Paris, France). The collection comprised winter (December, January, February) EVI composite, which integrates data on multiple time series and then fills in the gaps caused by cloud contamination and other uncertainties [
37]. This study targeted the winter season to evaluate the physiological state of evergreen trees. To enable the before–after comparisons, the composite of the preceding three years was used as the baseline. For example, to evaluate the 2018 typhoon effects, we compared the 2018–2019 winter composite (observation) against a 2015–2018 winter baseline. Immediate effects of the major earthquake were evaluated by comparing the composite EVI value for 18 January 1995–28 February 1995 against a winter composite baseline for 1992–16 January 1995 winters.
When relying on the Landsat series, surface reflectance data were used, which included atmospheric correction via the USGS LaSRC/LEDAPS algorithms. Cloud masking was performed using the quality assessment pixel bitmask. As for Sentinel-2, top-of-atmosphere reflectance data were processed, with clouds and cirrus removed via the quality assessment 60 and MSK_CLASSI bands. Given the steep and complex topography of the Rokko Mountains, a rigorous sun-canopy-sensor + C-correction topographic correction was implemented for both Landsat and Sentinel 2 datasets. For each scene, the specific solar geometry (zenith and azimuth) was retrieved from the image metadata. A band-specific C-factor was then estimated through linear regression between the reflectance and local incidence angle within the study area.
The EVI was utilized as a robust proxy for vegetation vigor, calculated as follows:
where red, NIR, and blue are reflectance measurements for red (630–690 nm wavelength), near-infrared (760–900 nm wavelength), and blue (450–530 nm wavelength) light, respectively. The EVI is a vegetation index to enhance the vegetation signal with improved sensitivity in high-biomass vegetation through a reduction in background scatter and atmospheric influences. The EVI is an improved version of the NDVI, which indicates gradients between extremely vegetation-rich and barren areas. The richer the vegetation, the closer the value converges to 1. The lowest value is −1. While Landsat products were processed as surface reflectance, Sentinel 2 data utilized Level 1C top-of-atmosphere reflectance. To ensure time-series consistency between these different reflectance levels, the EVI’s mathematical formulation inherently incorporates the blue band. The blue band serves to stabilize and self-correct atmospheric scattering effects [
6], thereby minimizing the discrepancy between top-of-atmosphere and surface reflectance datasets in dense forest canopies.
All image processing, algorithmic corrections, and spatial statistics were performed using the Google Earth Engine cloud platform. Final results were projected into the UTM Zone 53N (EPSG:32653) coordinate system and exported as GeoTIFF images.
2.4. Handling Remote Sensing Data
QGIS 3.2.2. and MultiSpec version 2024.05.16 64-bit for Windows were used to obtain values for the EVI [
4] for pixels in the Landsat and Sentinel imagery datasets retrieved from a Google Earth Engine collection. December, January, and February (winter) composite EVI datasets for the 1991, 1994 and 2018 typhoons were used to minimize the effects of other typhoons and earthquakes in previous years when there must have been interaction among multiple typhoons and other events within more than a single year [
23,
24]. The three-year winter composite image was regarded as the baseline image before the typhoon season or earthquake. The post-typhoon periods for EVI comparison were December 1991–February 1992, December 1994–16 January 1995, and December 2018–February 2019. For 2000, when no typhoon approached the region, the December 1997 – February 2000 and December 2000 – February 2001composite EVI images were used as the before and after 2000 typhoon season images, respectively. Unavailable pixels were eliminated in the following analyses. Likewise, changes in the EVI in the same area were obtained as effects of the major earthquake that shook the area on 17 January 1995. The before–after comparison was made by obtaining EVI values for the Landsat imagery data.
Regarding the Sentinel imagery, systematic 3 × 3 pixel resampling was applied. In contrast, Landsat data were analyzed at their native 30 m resolution.
2.5. Moisture Measures Before the Typhoon in September 2018
Normalized difference moisture index (NDMI) composite values [
38] for 2015–2019 winters were retrieved from the Google Earth Engine cloud platform. The imagery was acquired by the Sentinel 2 satellite. The NDMI indicates gradients between extremely moist and dry ecosystems. The moister the ecosystem, the closer the value converges to 1. To ensure accuracy in the rugged terrain of the Rokko Mountains, we applied the sun-canopy-sensor + C topographic correction to bands 8 and 11, as in the case of EVI determination.
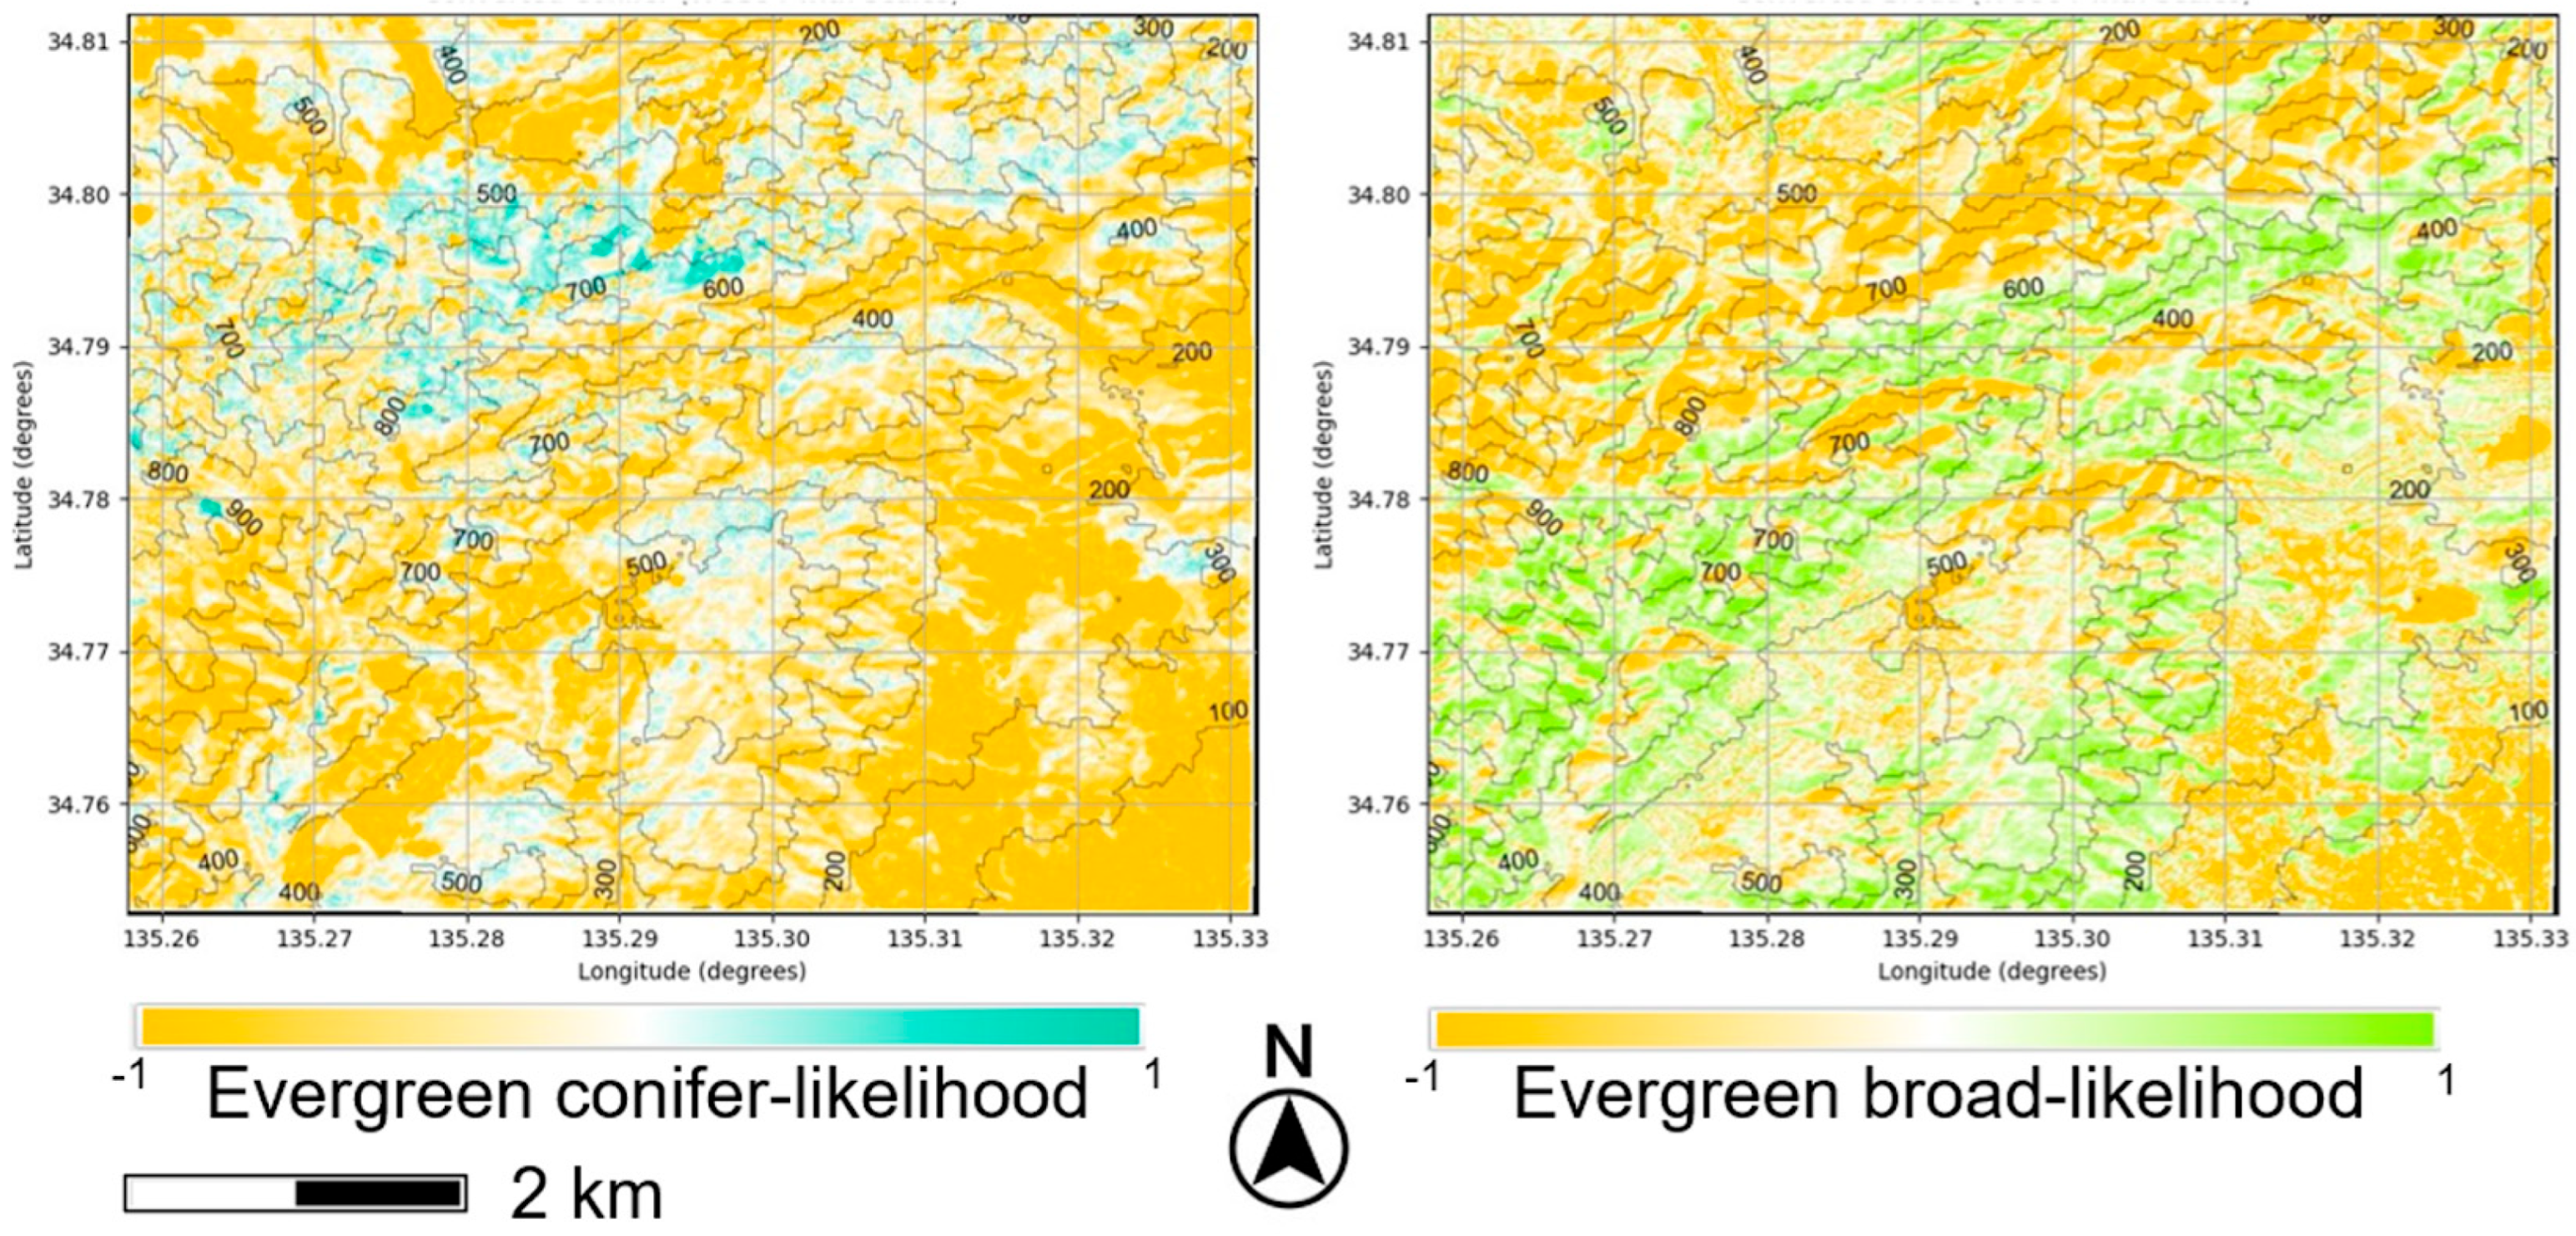
2.6. Evergreen Conifer- and Broadleaf-Dominance Likelihood Mapping
To characterize the spatial distribution of evergreen forest types in the area, we utilized the Sentinel 2 harmonized reflectance collection for the 2017–2018 winter [
39]. First, two spectral indices were calculated to differentiate conifer- and broadleaf-dominant forest stands. Normalized difference red edge (NDRE) was calculated using the near-infrared (band 8) and red edge (band 5) bands to capture vegetation vigor and chlorophyll content during the winter season. Tasseled cap brightness (TCB) was derived via a linear transformation of six multispectral bands (bands 2, 3, 4, 8, 11, and 12) using coefficients optimized for Sentinel 2. TCB was used as a proxy for the overall albedo and structural density of the canopy. To account for the spatial continuous transition between conifer- and broadleaf-dominant stands, we developed a likelihood mapping approach rather than a discrete classification. The NDRE and TCB values were rescaled to a 0–1 range using a unit-scale normalization based on typical local ranges (NDRE, 0.1–0.4 and TCB, 0.12–0.35). The likelihood for each forest type was defined as follows. Evergreen broadleaf likelihood was defined by high NDRE and high TCB values, representing the relatively high reflectance and vigor of broadleaf species (e.g.,
Camphora officinarum). Conifer likelihood was defined by high NDRE and low TCB, reflecting the dark and dense canopy structure of conifers (e.g.,
Pinus densiflora). The resulting likelihood layers were clipped to the study area boundary and masked to include only forested clusters. The final products were exported as GeoTIFFs at a 10 m spatial resolution for subsequent spatial analysis.
2.7. Identification of Necromass After the 2018 Typhoon Season
To detect the severest forest disturbances such as fallen trees and canopy dieback, we integrated multi-modal satellite observations from Sentinel 1 synthetic aperture radar and Sentinel 2 multispectral imagery [
40]. Structural changes in the forest canopy were assessed using the HV/VV polarization ratio from Sentinel 1 ground range detected data. To minimize the influence of seasonal humidity variations, we processed winter-only composites (December to February) for the observation period (winter 2018–2019) and the baseline period (winter 2015–2018). A median composite was generated for each period, and the structure loss was quantified by calculating the difference in the HV/VV ratio. A decrease in this ratio indicates a reduction in the volume of vertical and randomized scattering structures, characteristic of tree falls or major structural damage. Physiological stress and moisture reduction were evaluated using the NDMI derived from Sentinel 2 harmonized data. The NDMI difference (moisture drop) was then calculated between the pre- and post-disturbance winter periods. The final identification of dead biomass and fallen trees was performed using a strict dual-threshold approach. Pixels were classified as disturbed only if they exhibited a significant structural decline (structure loss < −2.0 dB) accompanied by a substantial reduction in canopy moisture (moisture drop < −0.1). To eliminate salt-and-pepper noise and isolate meaningful disturbance clusters, a 3 × 3 focal mode filter was applied to the binary classification mask. All processing was executed on the Google Earth Engine platform.
2.8. Topographical Variables for the Landsat and Sentinel Pixels
QGIS 3.22 and MultiSpec version 2024.05.16 64-bit for Windows were used to obtain topographical variable values for the Landsat pixels. Slope angle, slope aspect, and altitude values were determined for the 30 × 30 m rectangle areas represented by the Landsat imagery pixels. The slope aspect values were determined using the following equations:
where θ is the wind direction, θ is 0° when the wind direction is north, 90° when east, 180° when south, and 270° when west. Western and southern winds were positive, and eastern and northern winds were negative.
2.9. Vegetation Map
A vegetation map of the study area was obtained from the website provided by the Biodiversity Center of Japan (
http://gis.biodic.go.jp/webgis/ accessed on 26 May 2026). The information was acquired between 1999 and 2012.
2.10. Iterative Self-Organizing Data Analysis Technique Clustering of Pixels in the Landsat Imagery Data
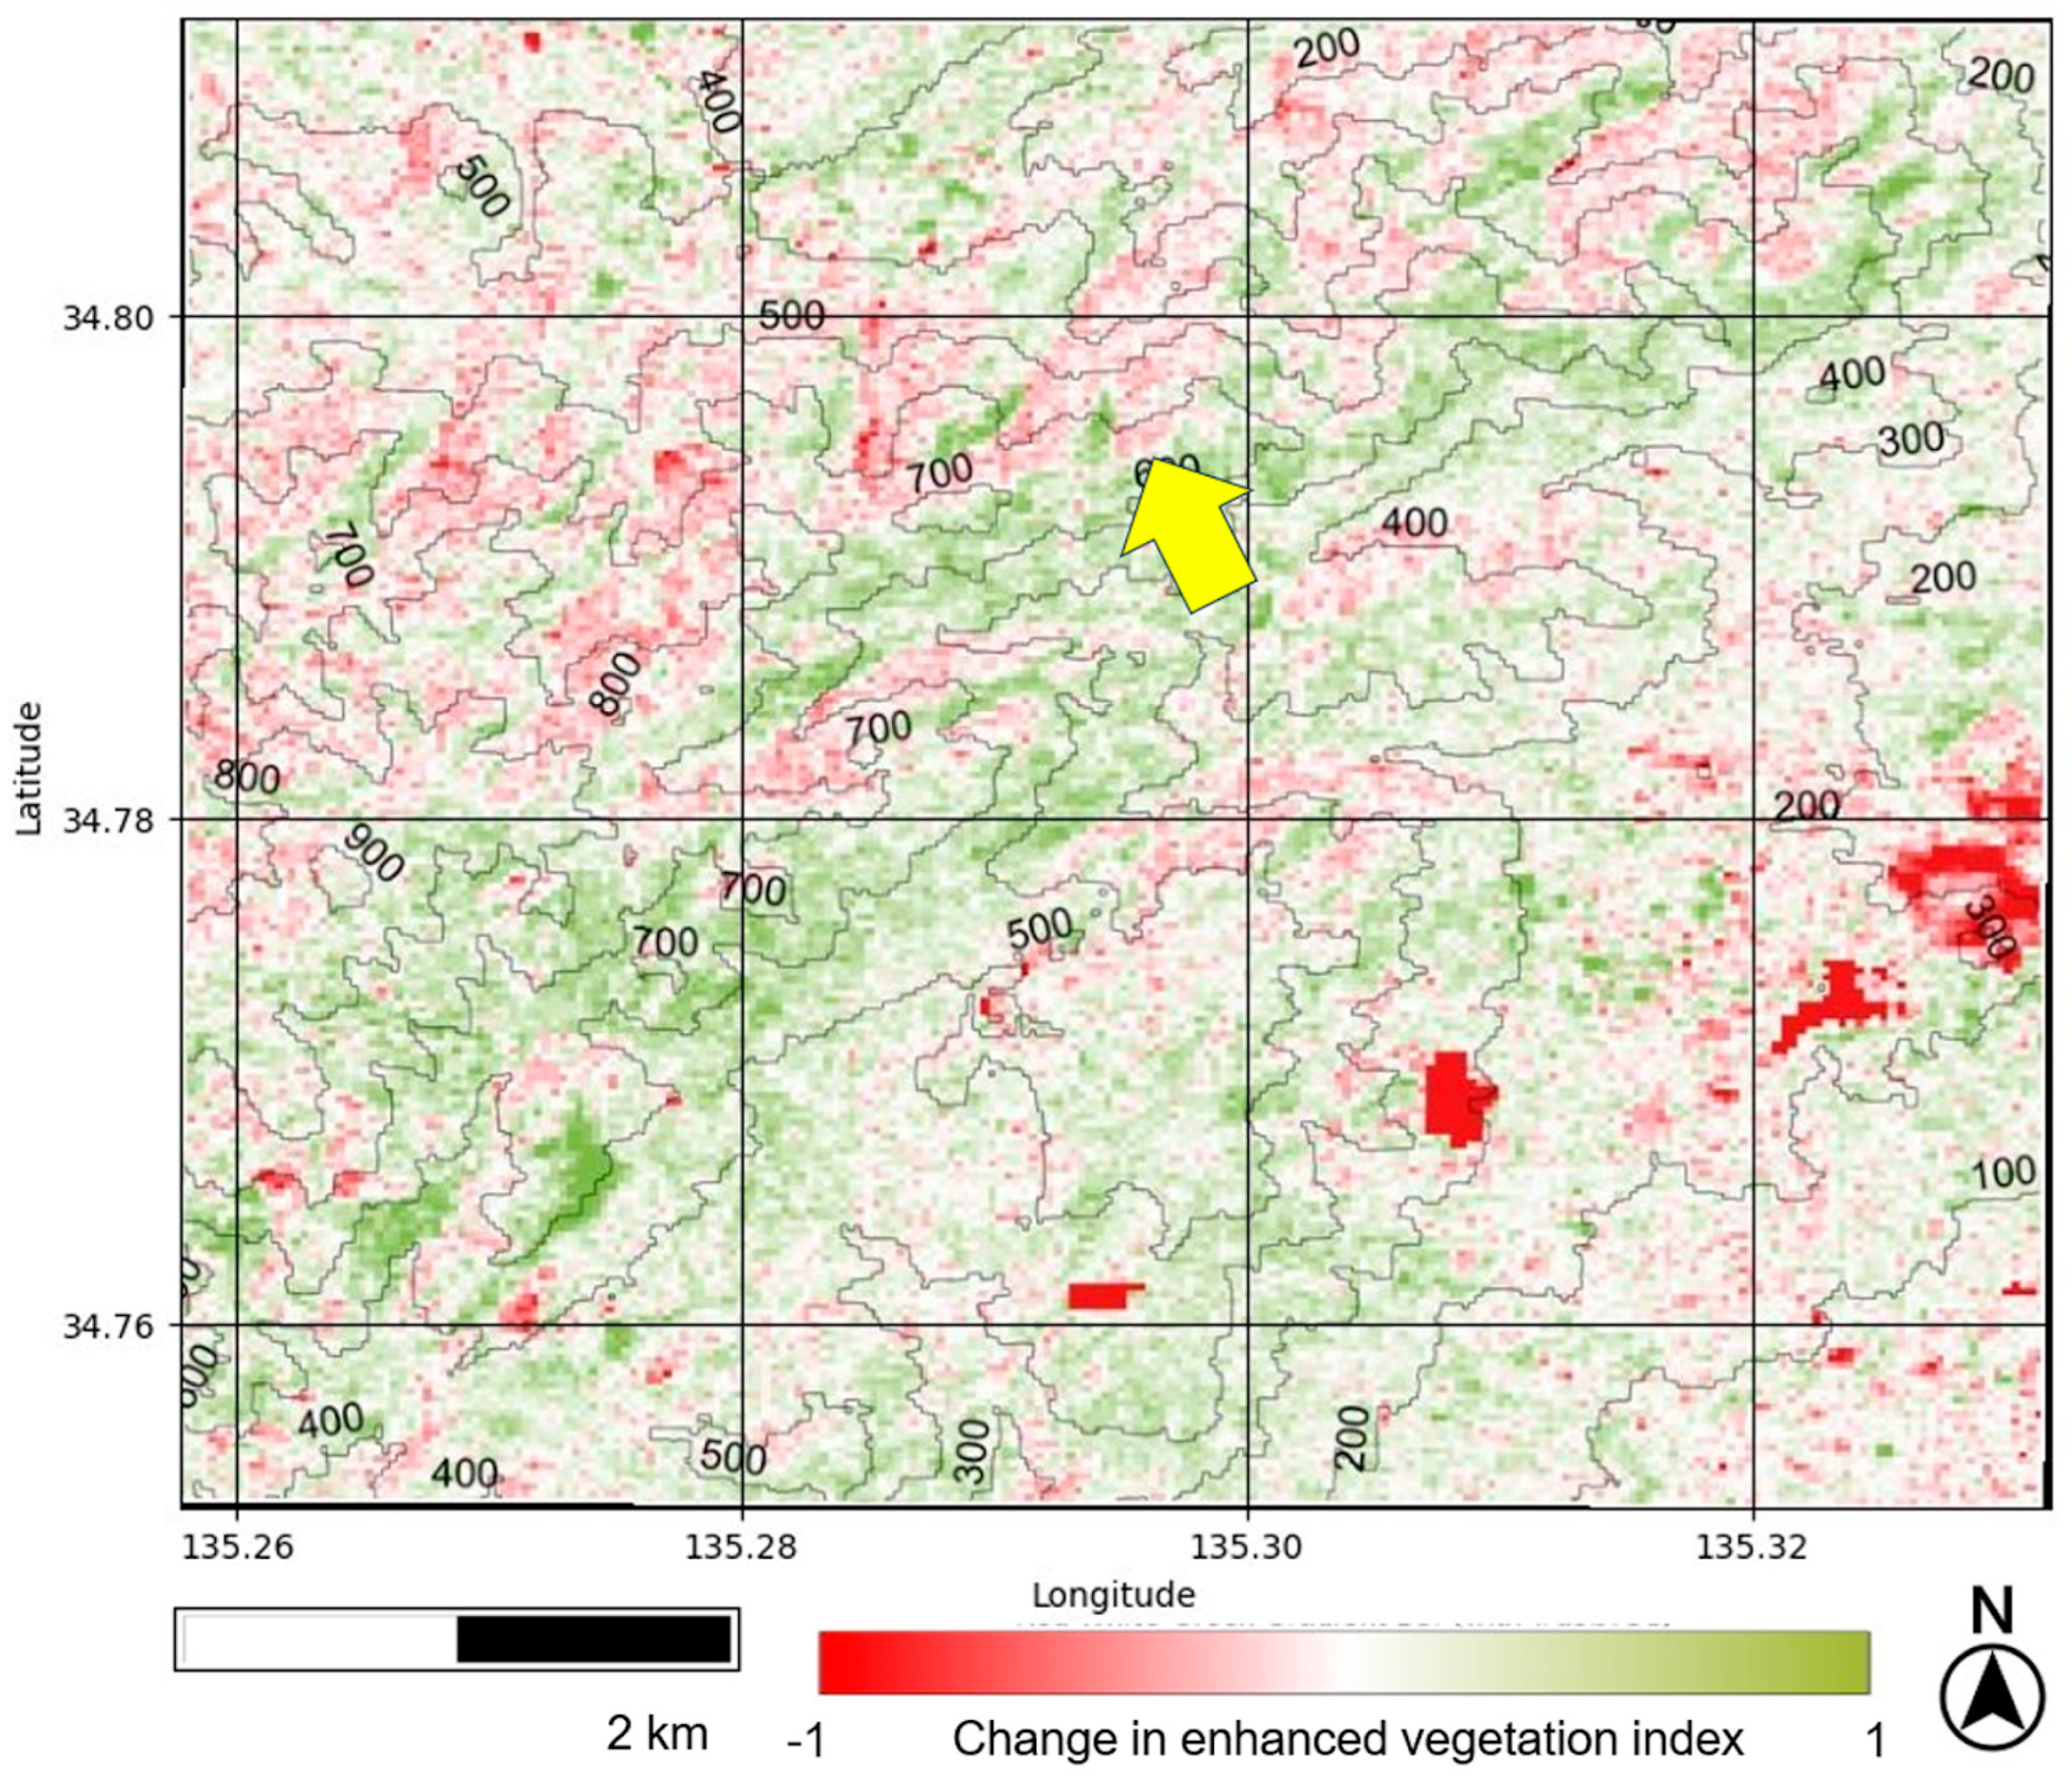
MultiSpec version 2024.05.16 64-bit for Windows was used to classify the area in
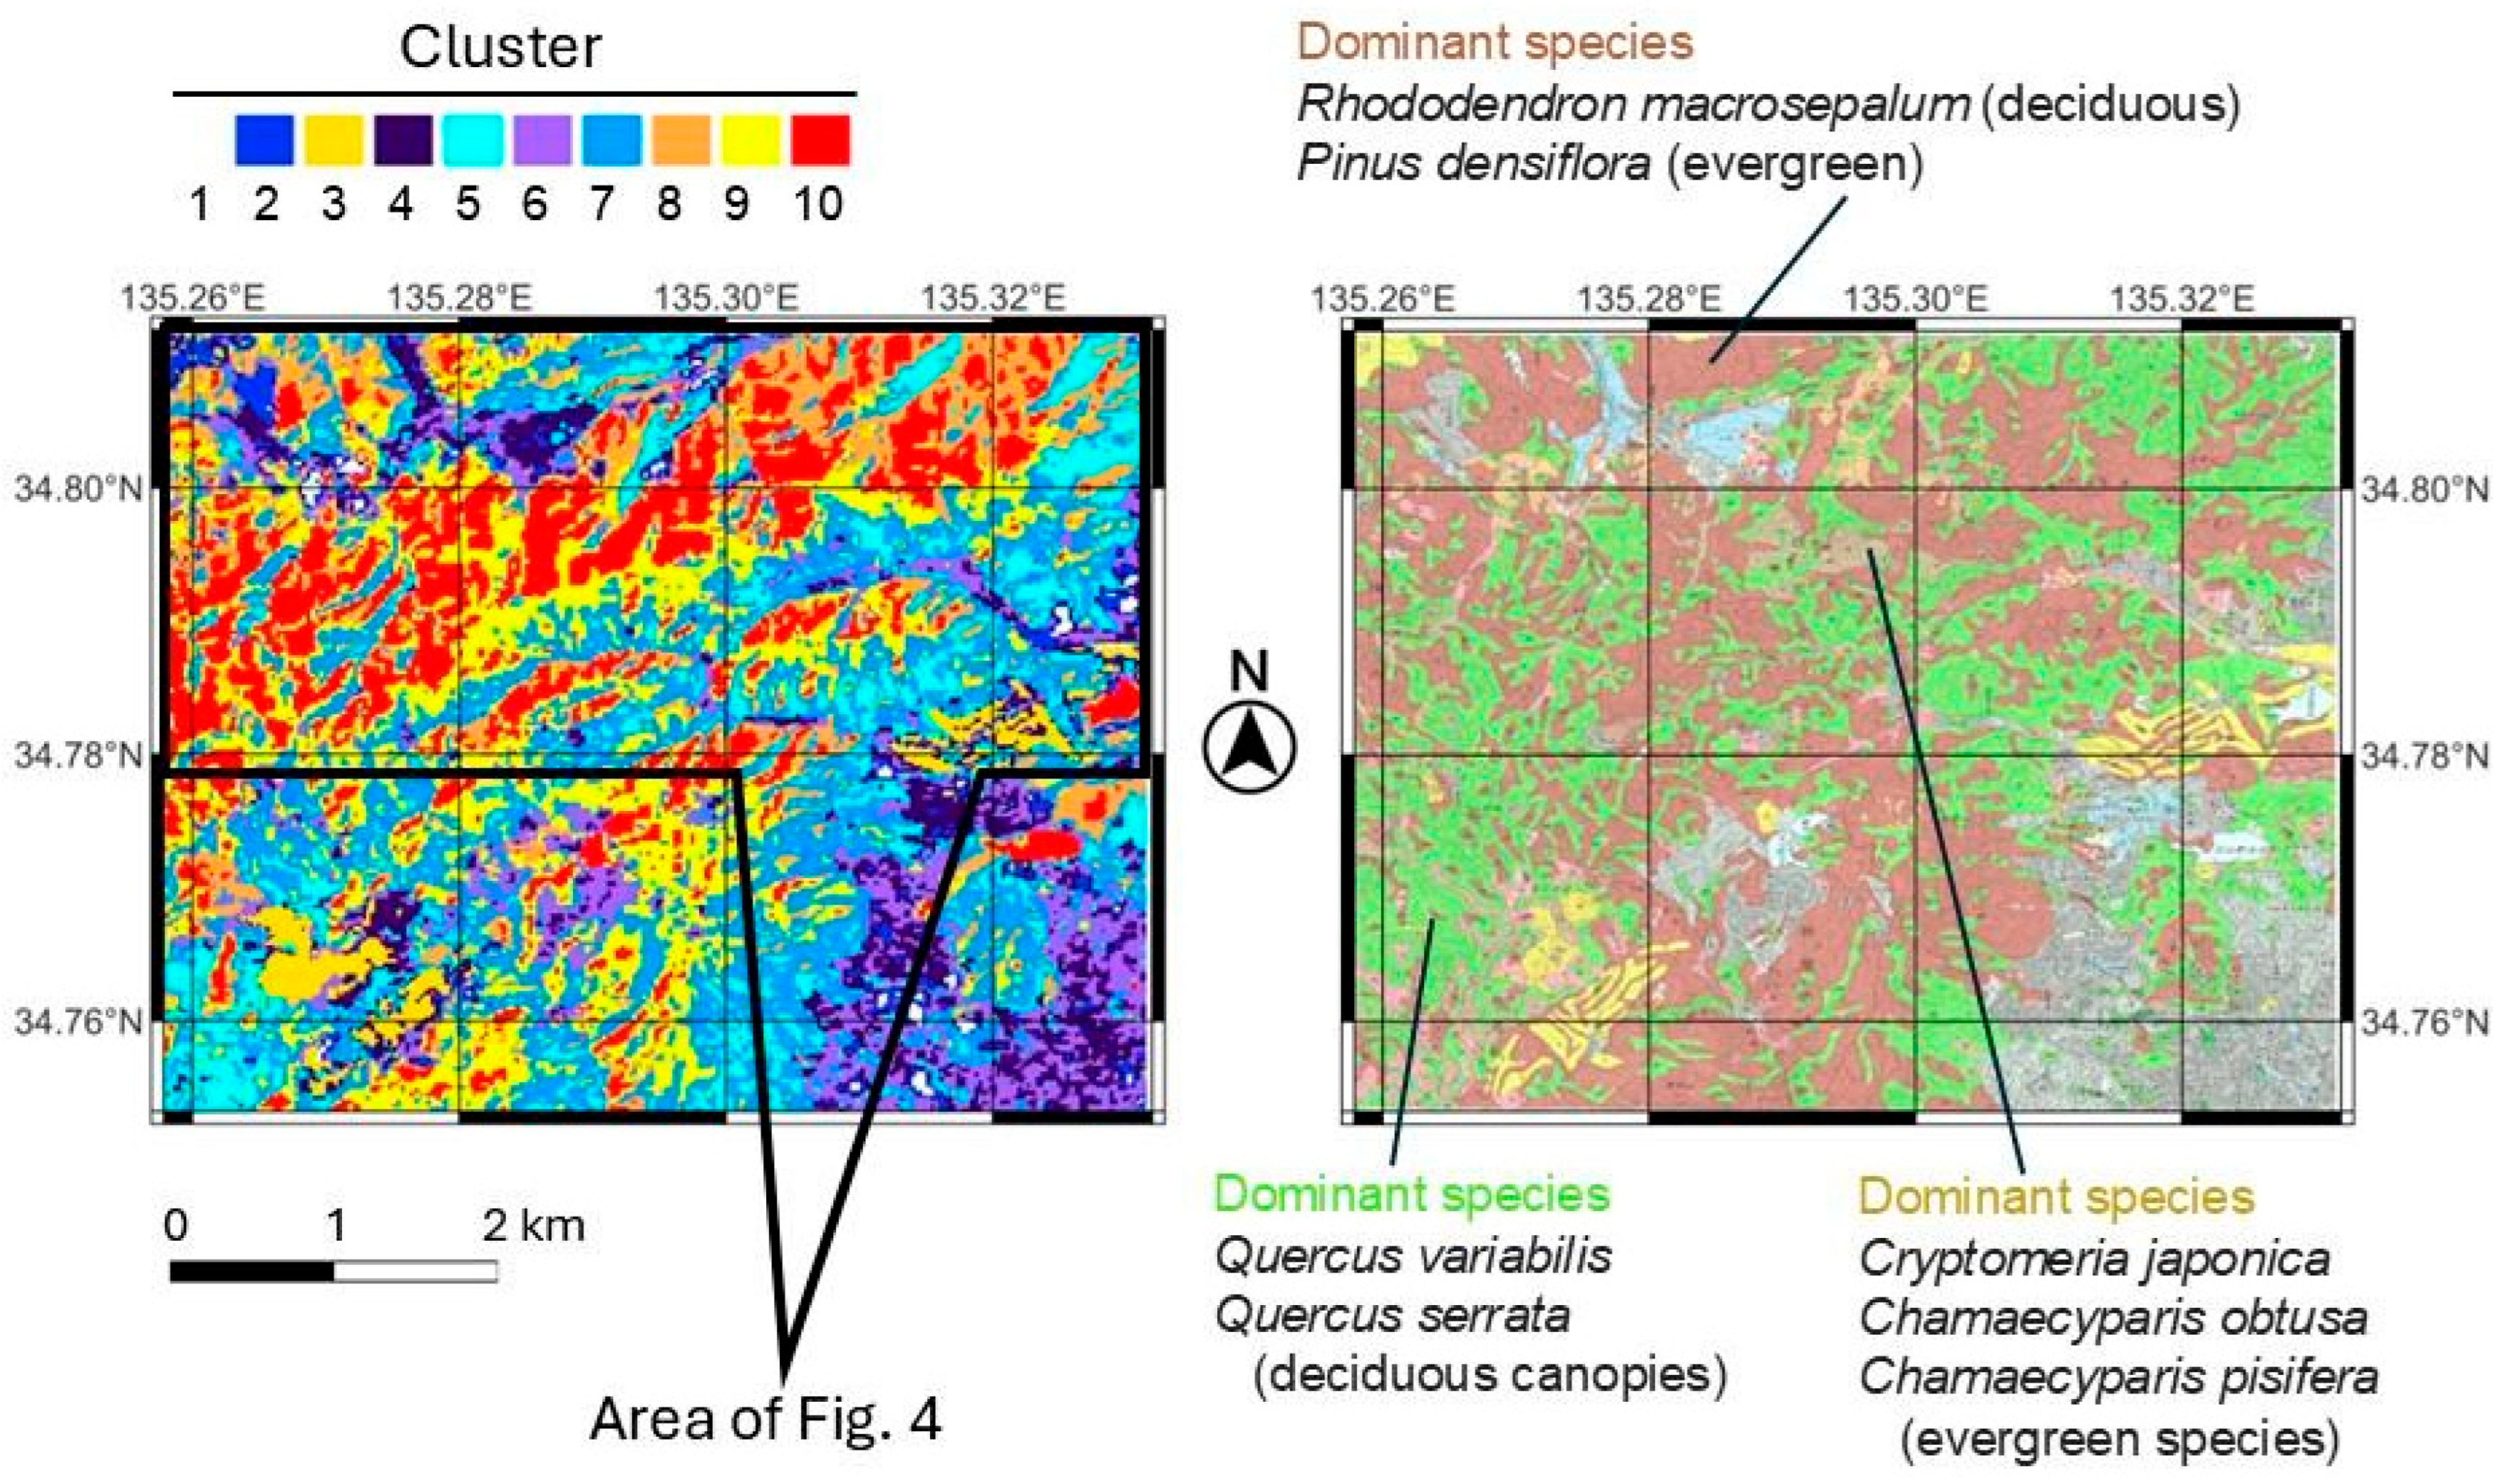
Figure 2c based on Landsat 5 pixels. To classify the forest stands, an unsupervised classification was performed using the Iterative Self-Organizing Data Analysis Technique (ISODATA). Unlike the standard k-means algorithm, ISODATA is a dynamic clustering process that automatically adjusts the number of clusters through iterative splitting and merging. During each iteration, clusters with a standard deviation exceeding a predefined threshold are split into two, while pairs of clusters with close spectral distances are merged. This process continues until the statistical distribution of the pixels reaches a stable state, allowing for a more objective representation of the complex forest structure and topographic variations in the Rokko Mountains. Clustering was carried out at 99% or greater pixels that did not change class membership; the minimum cluster size was represented by 4 pixels. Then, 10 clusters were generated in the imagery representing the area shown in
Figure 2c. The Landsat 5 imagery datasets were acquired for 18 March 1991, 5 May 1991, and 23 March 1993. The dataset for 18 March 1991 had a 4% cloud cover, and the others had 0%. Images for bands 1 (blue), 2 (green), 3 (red), 4 (near-infrared 1), 5 (near-infrared 2), and 7 (mid-infrared) were used. The band 2 image (green) for 23 March 1993 was eliminated due to an unknown computer glitch. Eventually, 17 grayscale images were used for ISODATA clustering by applying the above conditions.
2.11. Statistical Analysis
Sentinel data carried by comma-separated-value files provided by MultiSpec for Windows were 3 × 3 resampled on the Google Colaboratory platform. Sentinel and Landsat data were subjected to spatial thinning on Google Colab.
XLStat version 2021.4.1 (Addinsoft Inc., Paris, France) was used for stepwise multiple regression analysis. Changes in EVI or winter EVI were described as dependent variables by topographical variables and NDMI serving as independent variables. These processes identify the topographical variables most significantly associated with changes in EVI. A 5-fold cross-validation was adopted. In stepwise multiple regression analysis, p = 0.05 for inclusion and 0.10 for removal were adopted for independent variable selection. A variance inflation factor < 10 was used as the threshold for selecting independent variables.
The linear mixed-effects model analysis of variance, logistic regression analysis, threshold regression analysis, Global Moran’s I test for detecting spatial autocorrelation, and Mann–Kendal increase/decrease test for detecting significant increasing/decreasing trends of EVI were conducted on Google Colab. In the linear mixed-effects models, changes in EV were treated as the dependent variable. The ISODATA categories and the disaster events (typhoon and earthquake) were involved as independent variables. In analyzing composite EVI values for the 1990–1991, 2003–2004, and 2017–2018 winters, the ISODATA categories and the periods were used as independent variables. For the linear mixed-effects models, post hoc pairwise comparisons applying Tukey’s HSD test were performed.
Threshold regression analysis was performed to identify significant topographical variables influencing (changes in) EVI. In the threshold analysis, (changes in) EVI value and topographical variables were involved as the independent and dependent variables, respectively. A 5-fold cross-validation was used.
Logistic regression analysis was performed with a 5-fold cross-validation to examine the effects of topographical conditions on the occurrence of necromass. In the analysis, the occurrence of necromass was used as the dependent variable. The topographical variables and NDMI were used as the independent variables.
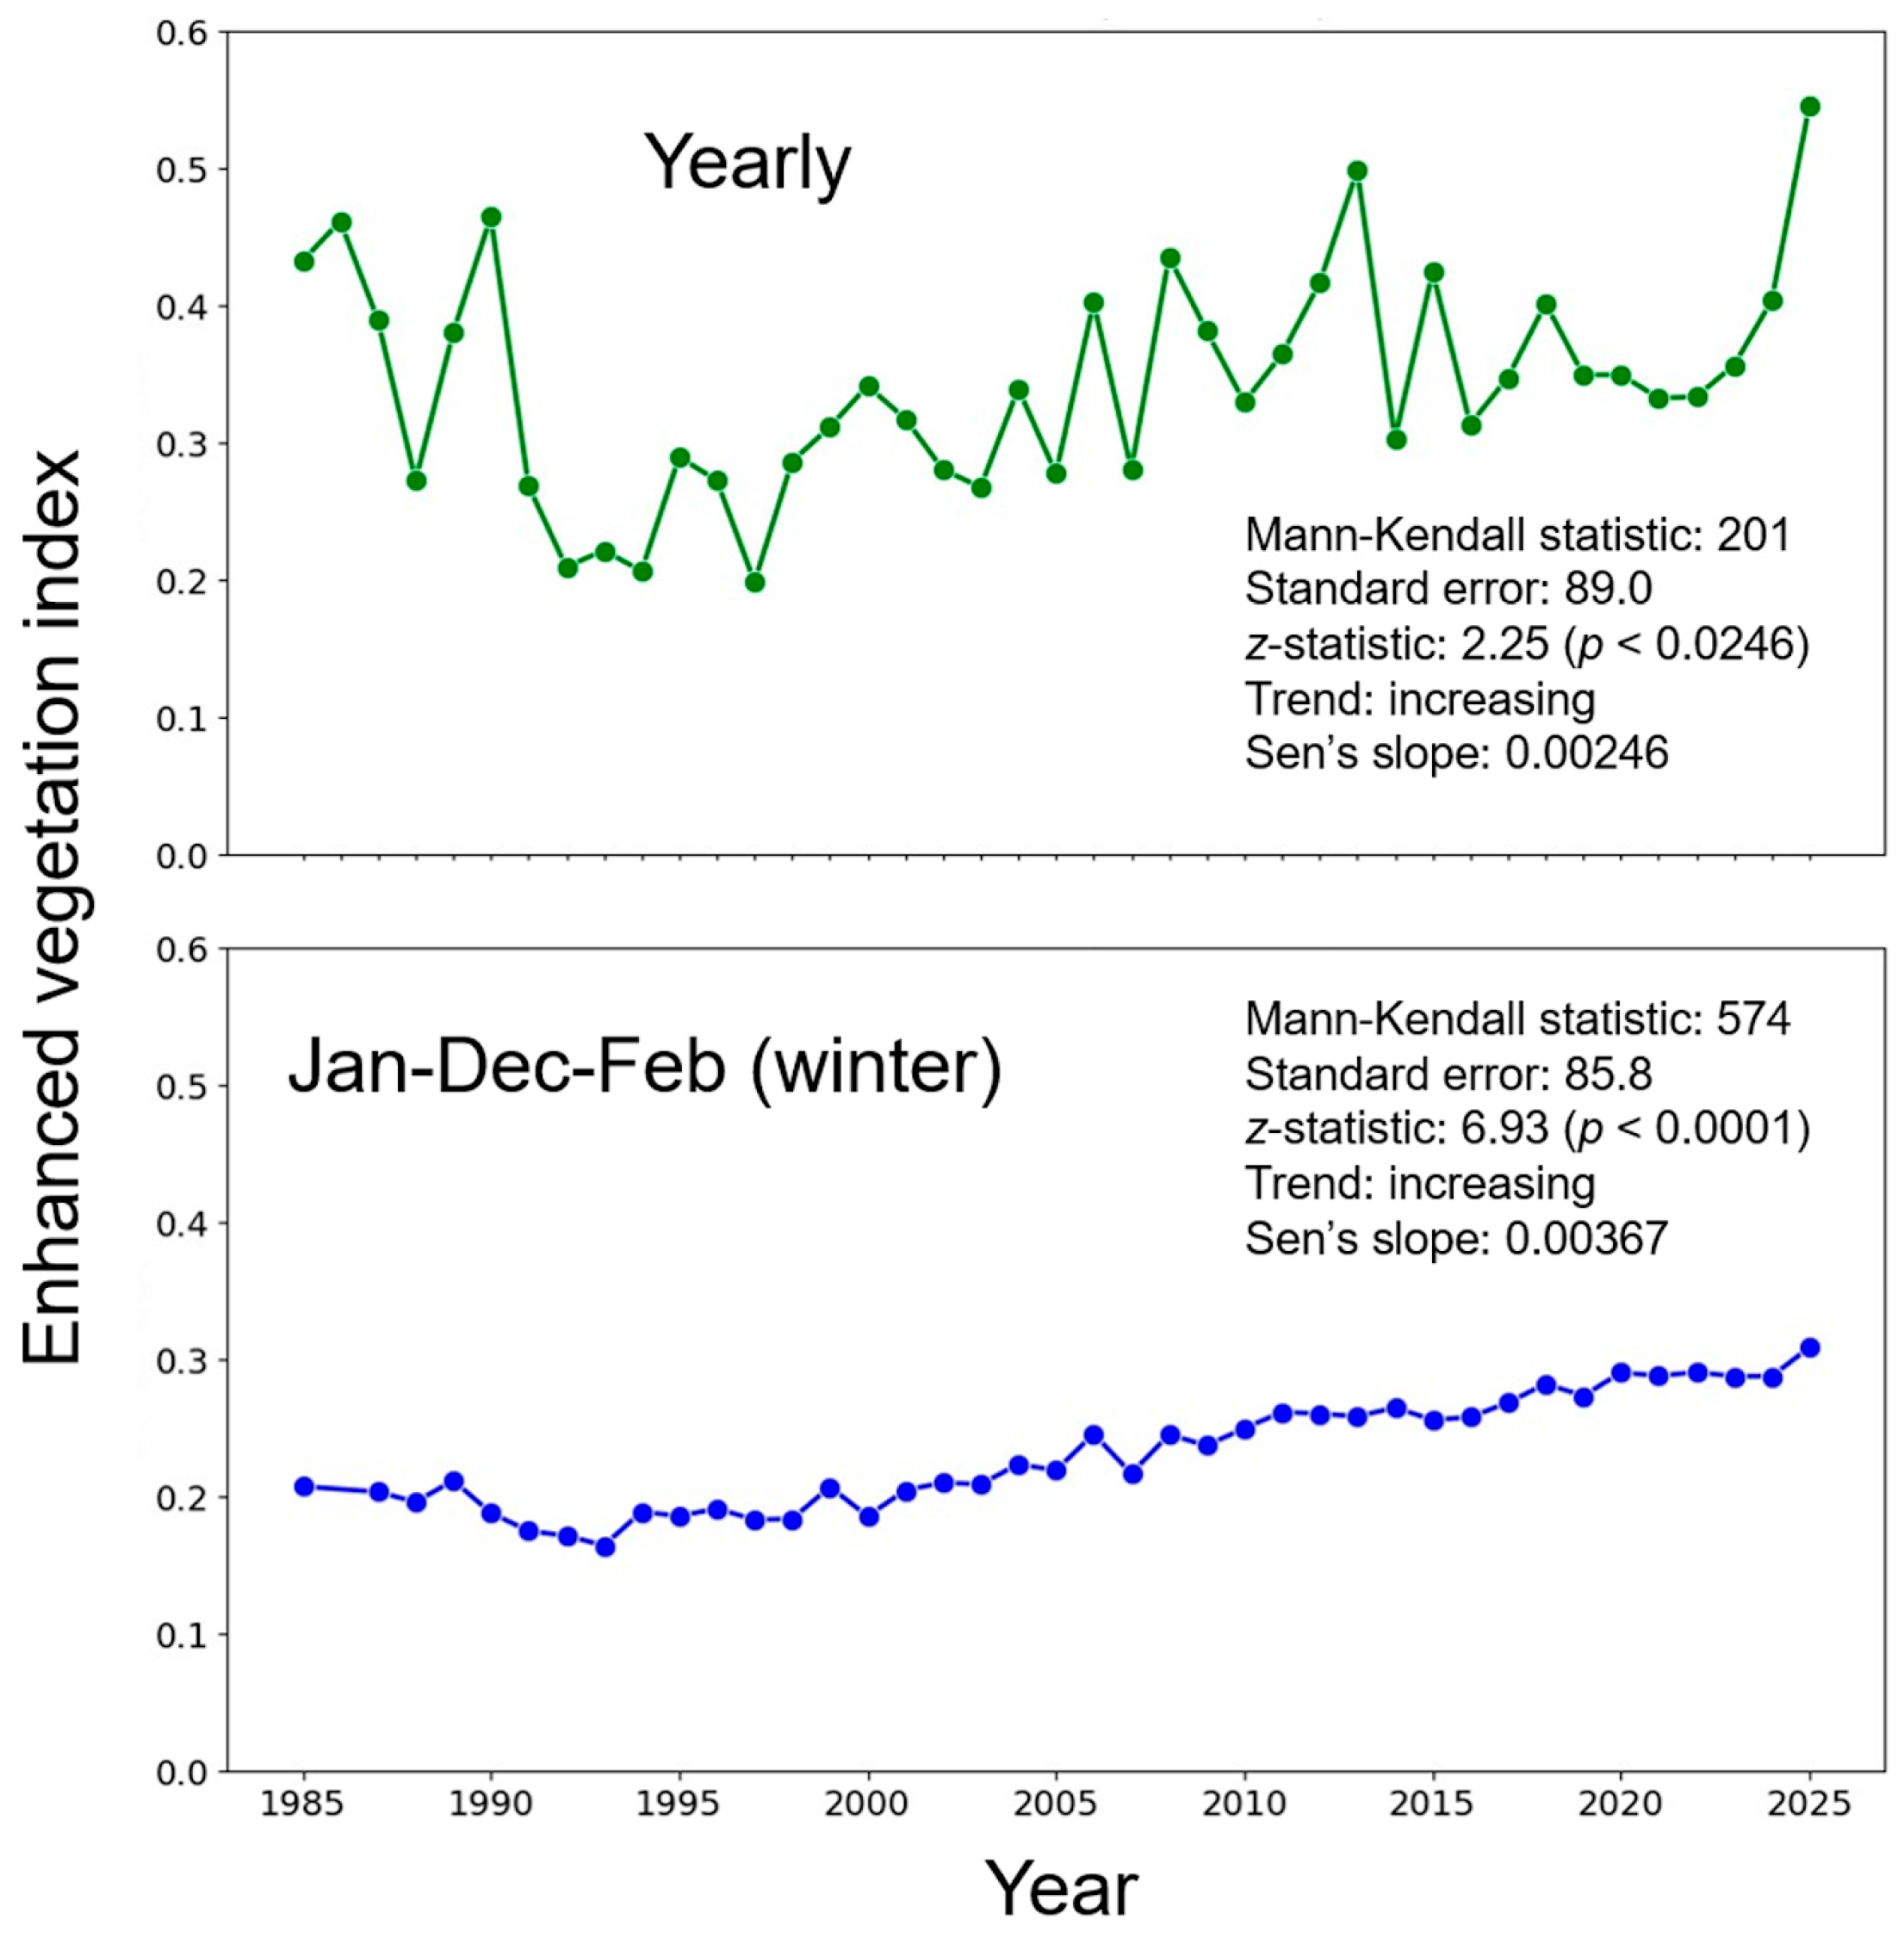
The Mann–Kendall trend test was applied to the winter and annual EVI composites from 1985 to 2025 across the five rectangular areas in
Figure 2c.
4. Discussion
For the first time, the effects of super typhoons and a major earthquake on forest stands were compared. Then, the 1991 typhoon was the most destructive. The major earthquake moderately disturbed the evergreen biomass on the northern slopes. Though the 2018 typhoon was the strongest among those generated within the past 30 years, the evergreen forest stands revealed more resilience compared to 1991. However, after the 2018 typhoon, damage was still distributed on the northern slopes in small and scattered patches. The mechanisms, processes, and related topics of the findings are discussed below.
4.1. Effects of the Super Typhoons
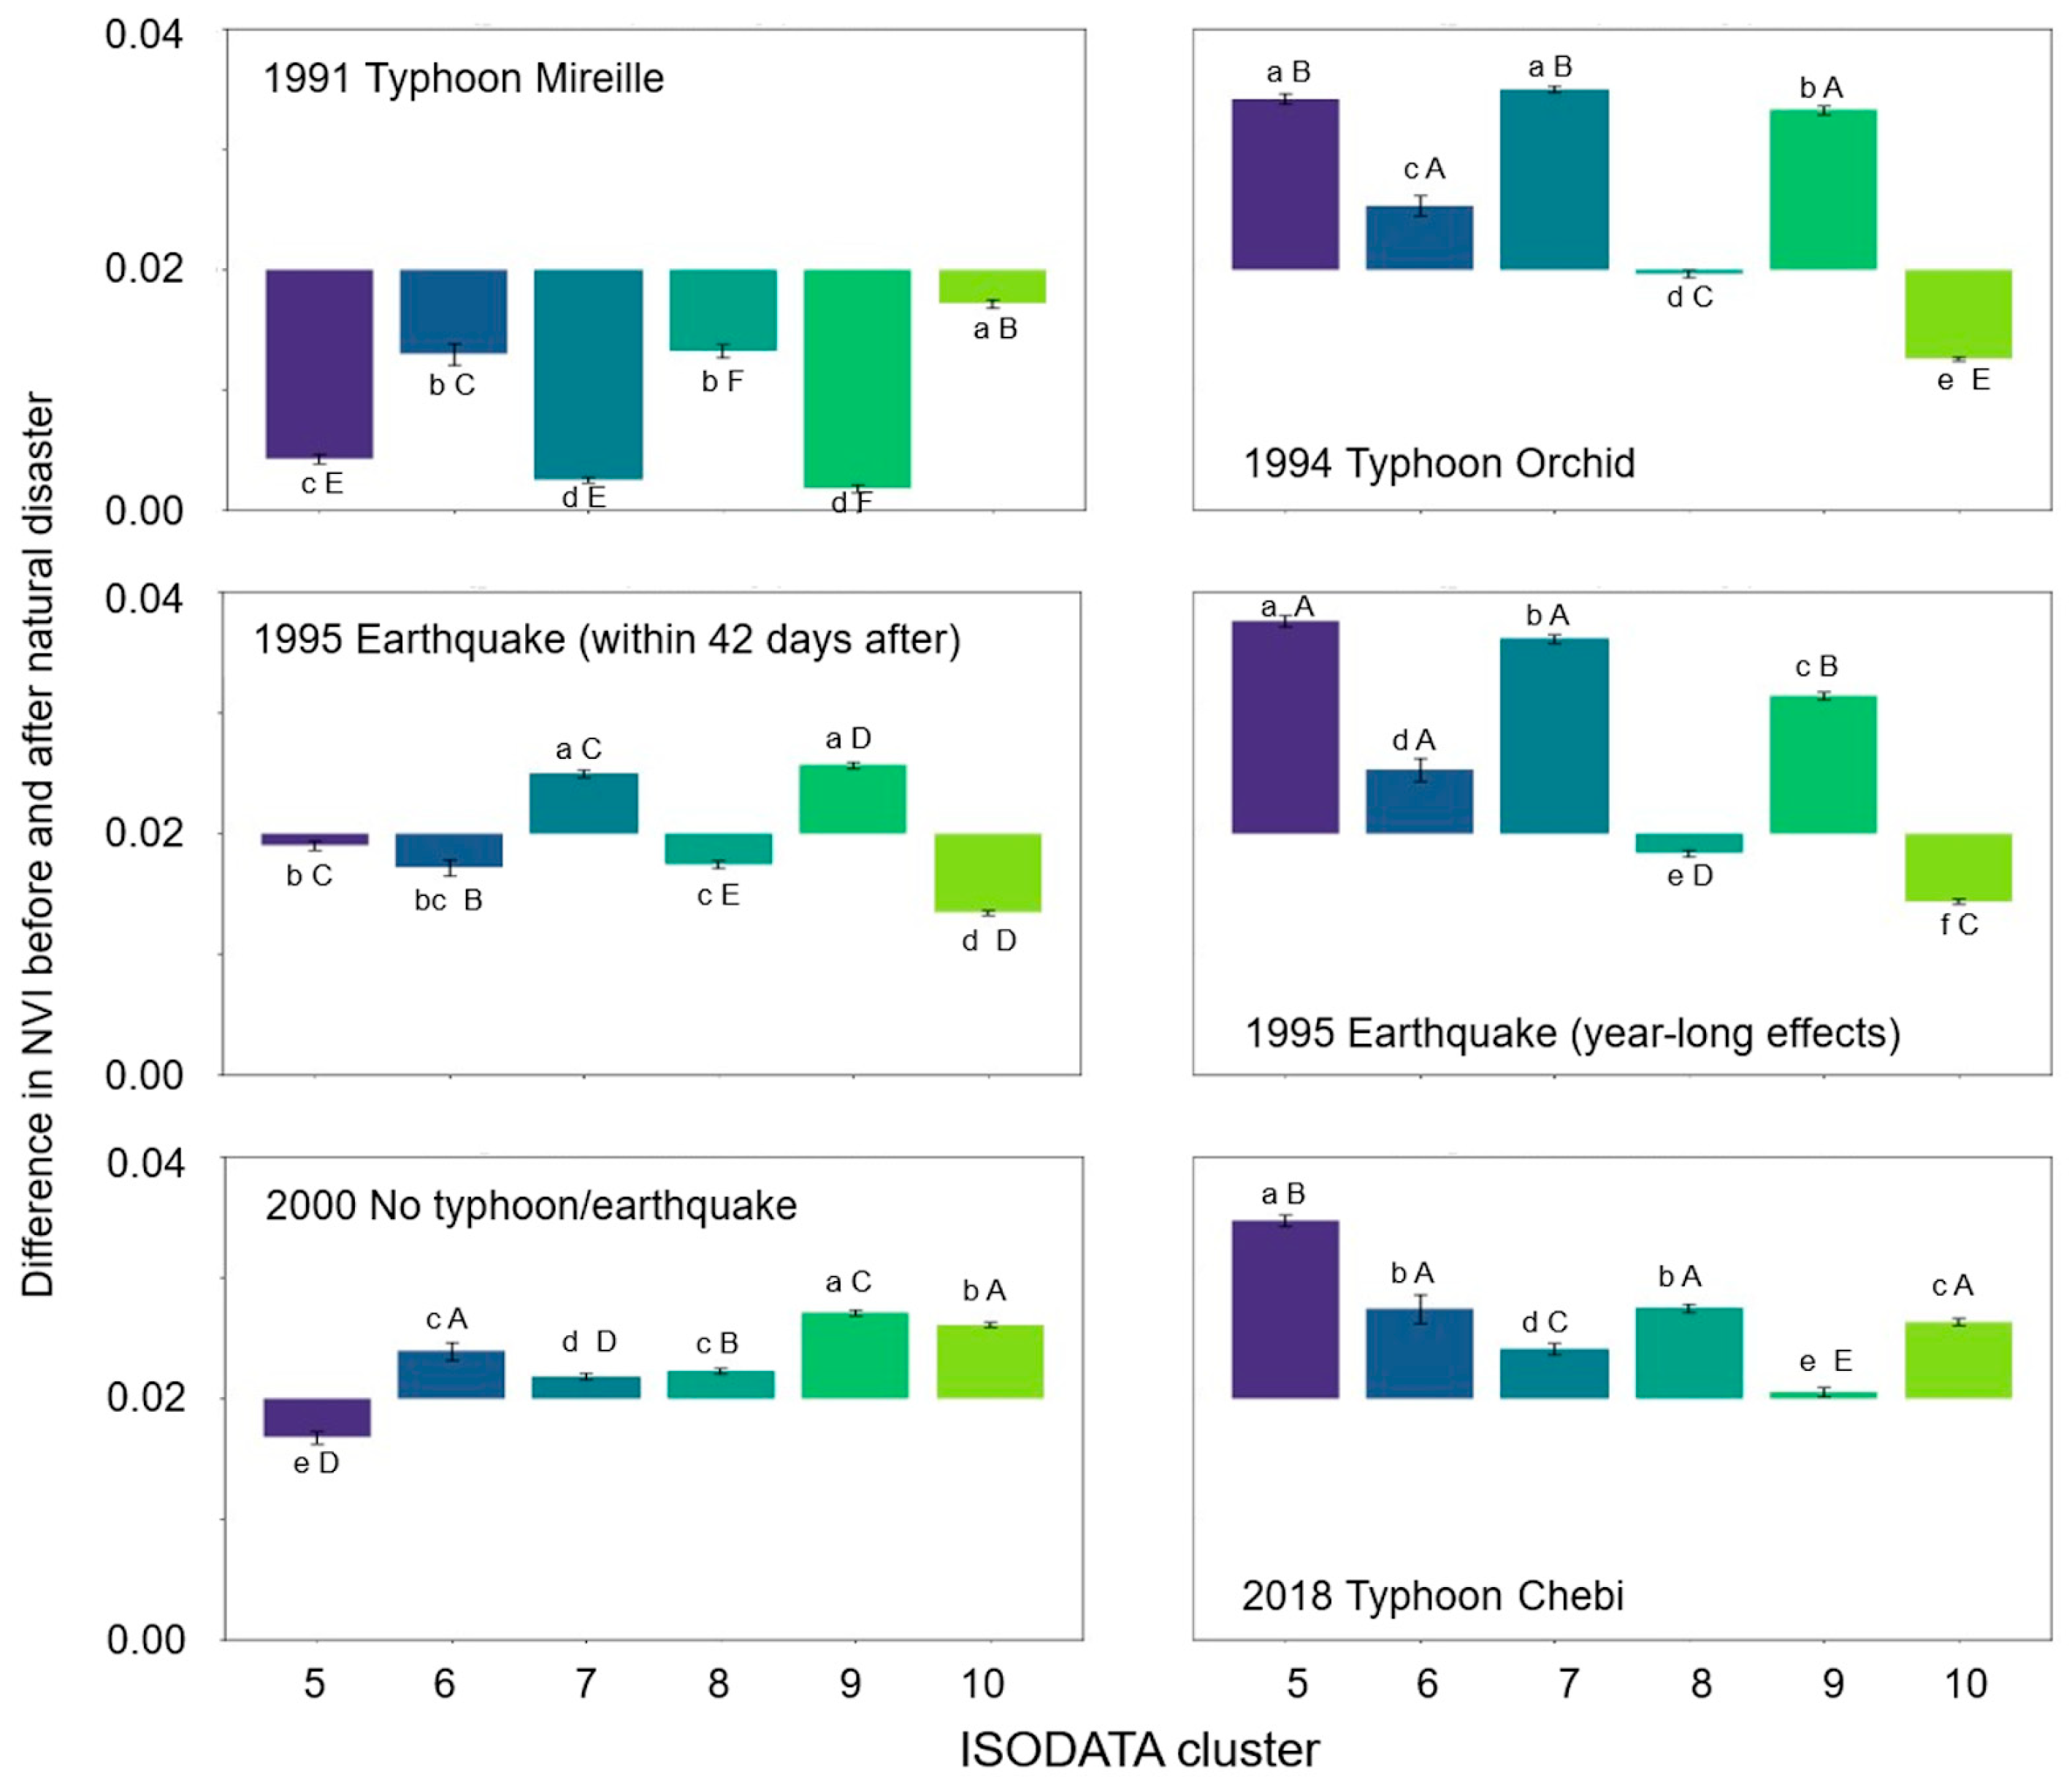
According to
Figure 10 and
Figure 11, evaluating the effects of super typhoons as the differences in EVI value before and after the periods of approximately a single year was valid if the typhoon-frequent months of July to October were included within the period. Within a comparable period of 1 year or so, a super typhoon-induced forest disturbance was observed between October 2017 and October 2018 in Hong Kong. The NDVI loss was largely attributed to the super typhoon [
17]. A similar typhoon effect was recognized as the difference before and after the 2004 typhoon season in western Japan when Japanese cypress trees lost above-ground biomass more significantly than in 2003 [
43]. The 1991 and 1994 typhoons must have disturbed the forest stands mainly by wind (
Figure 2,
Figure 10,
Figure 11 and
Figure 12), while some other windstorms were accompanied by rain with stronger effects on the trees than wind [
44].
When there were multiple vegetation types, Lu et al. [
45] reported that broadleaf forest stands were more vulnerable to a typhoon than coniferous forest stands in northeastern China. Conversely, Isamoto and Takayama [
46] found that broadleaved trees were damaged less than coniferous trees, including pines, Japanese cedars, and Japanese cypress. Contrary to these instances of damage on specific vegetation types, the multiple forest stands on similar topographical conditions were found to have had a common vulnerability to the strong winds of the 1994 typhoon and earthquakes (
Figure 10).
4.2. Linkages Between Forest Succession in the Rokko Mountains and Typhoons
In southern coastal Japan, including Kobe, typhoon-induced forest succession was observed. In a plantation plot in Tokyo, the survival, extinction, and generation of each individual tree were recorded. The human-introduced pines and Japanese cedars were killed at a high ratio by typhoons, whereas an evergreen laurel tree species of chinkapin survived more significantly than the coniferous cohabitants. Thus, the evergreen laurel-dominant community was established [
11]. Similar changes in forest community structure are thought to have been accelerated by typhoons on the Rokko Mountains, especially in the 1990s or beforehand.
Tree community censuses have been conducted in the Rokko Mountains. Between 1954 and 2004, according to the censuses, evergreen laurel tree species became more abundant [
33]. Changes in tree community structure within a later period, between 1974 and 2019, again demonstrated the increasing dominance of laurel tree species [
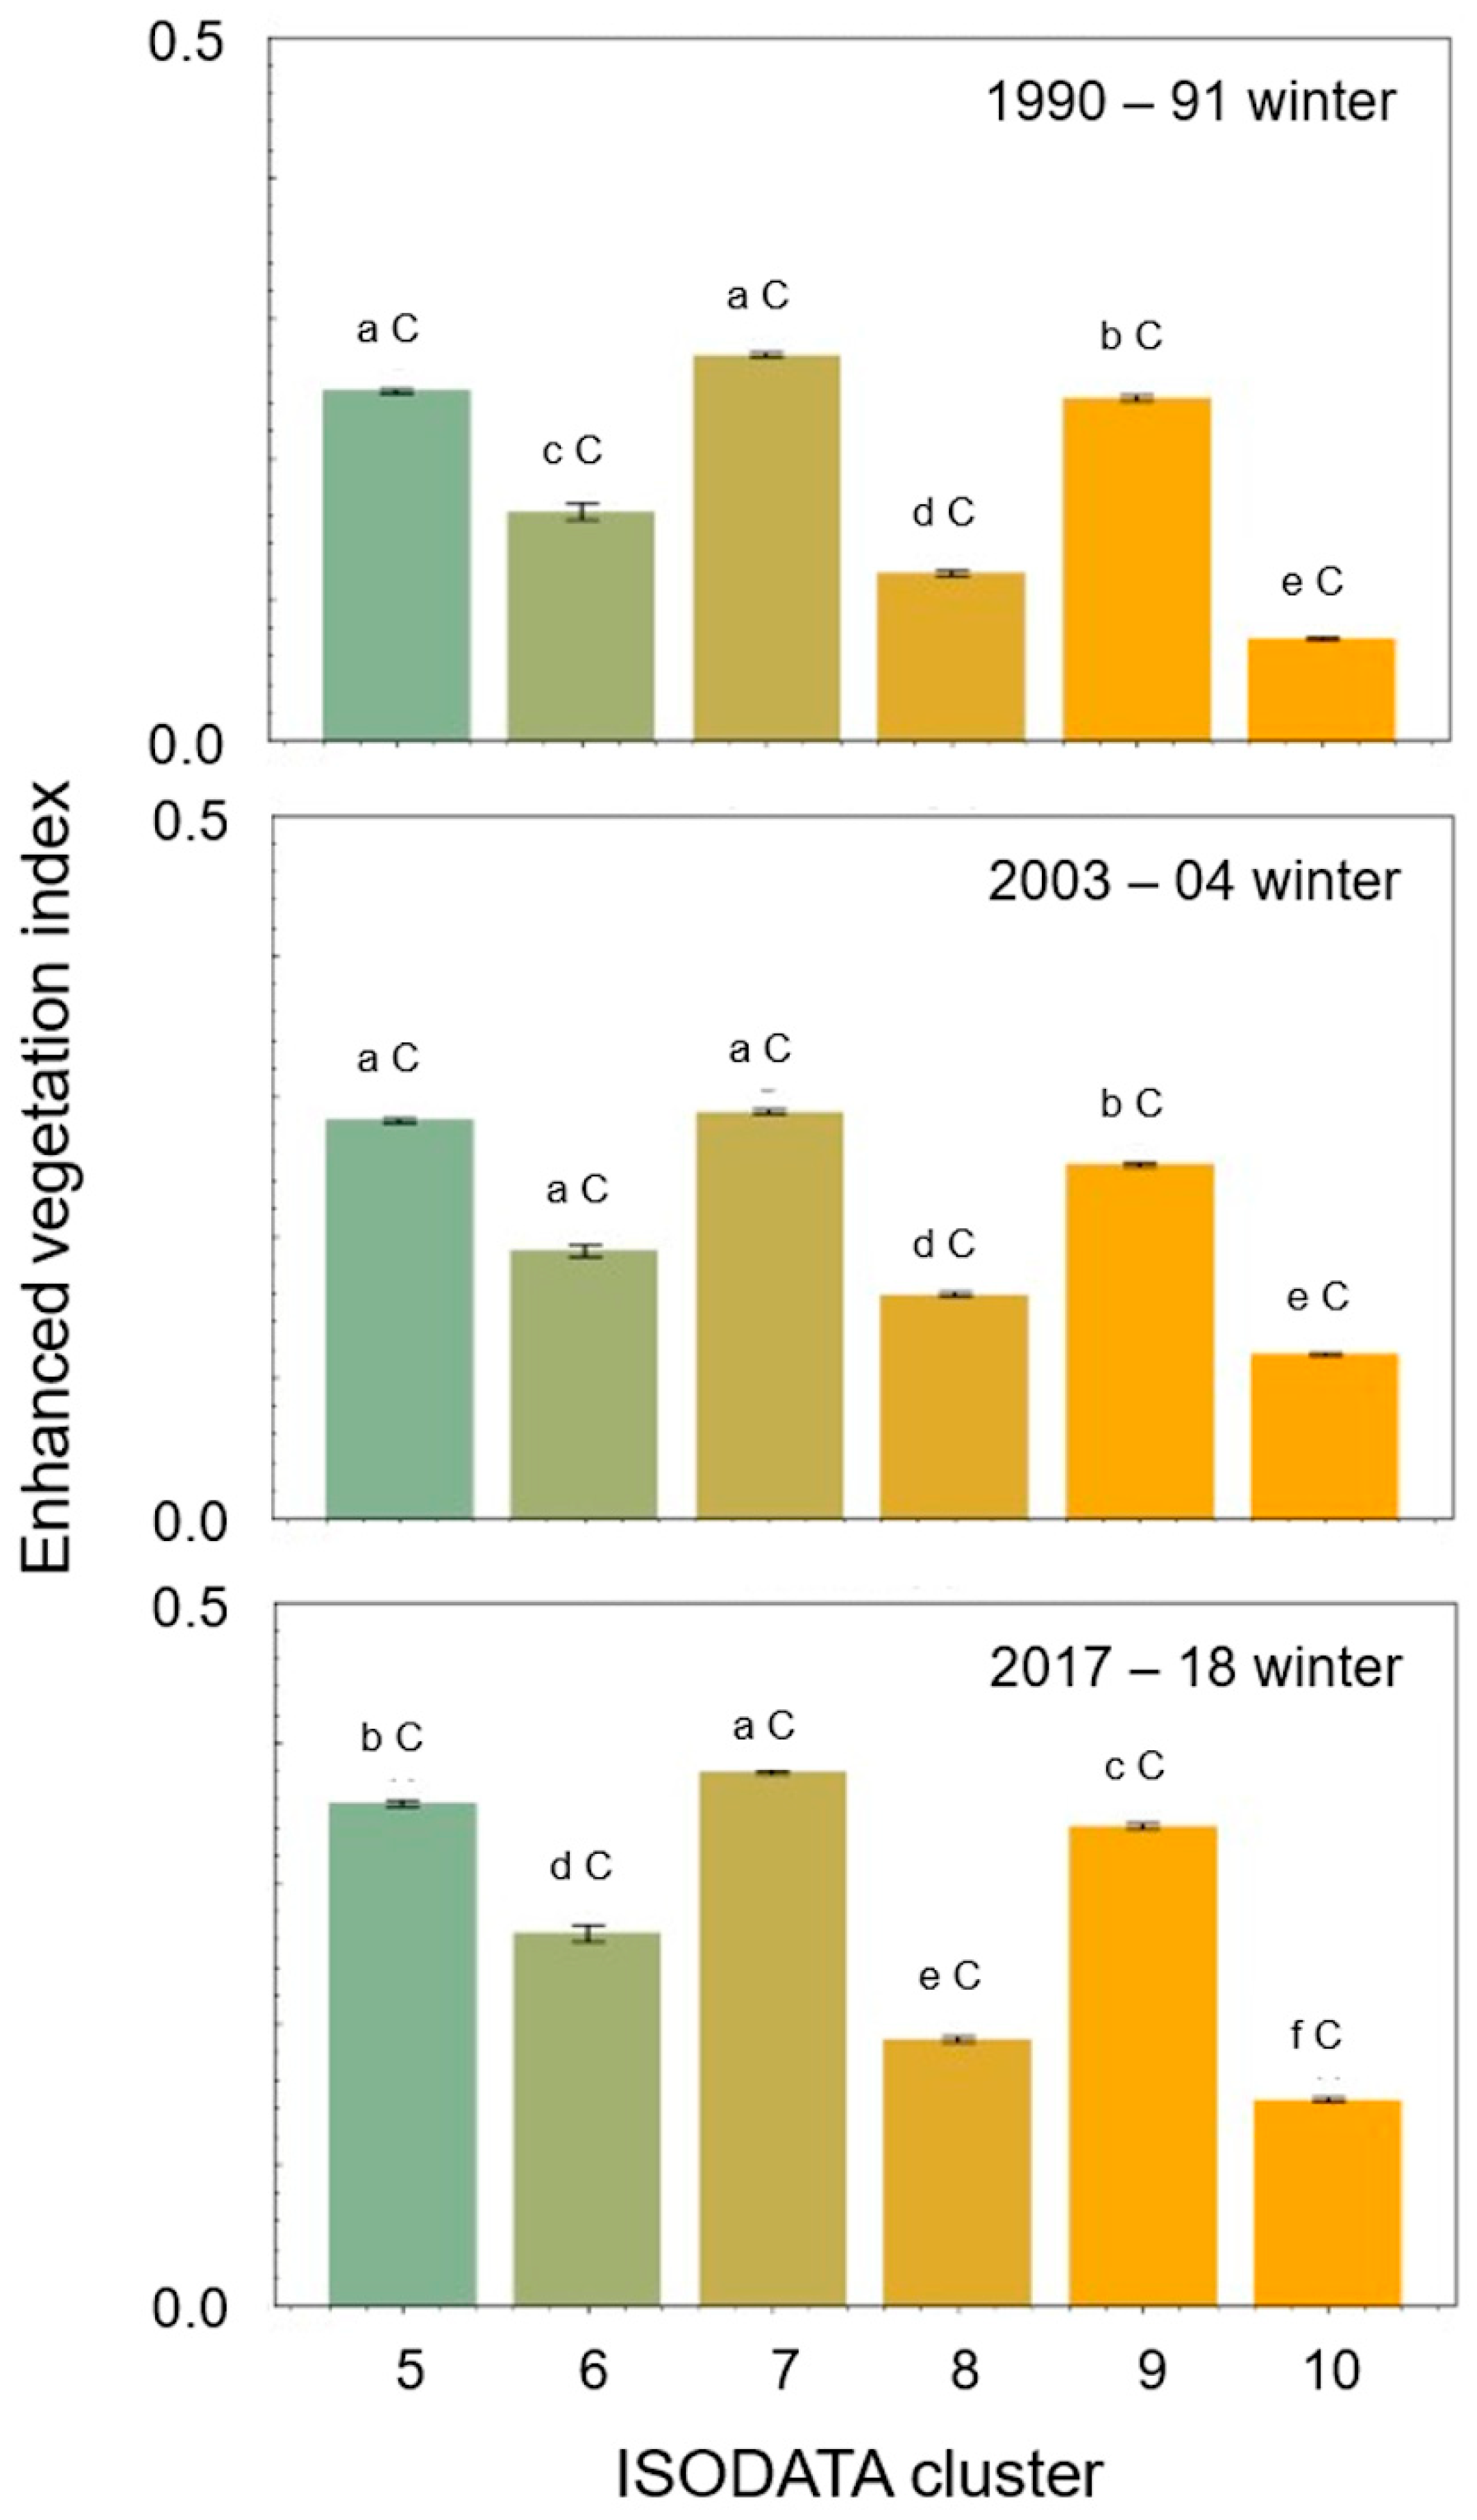
30]. From these instances, it is clear that the mountains have been experiencing perceivable changes in tree community membership. As suggested by the dark color of cluster 10’s profile and the gaps in the canopies in the early 1990s (
Table 1) and the early 2020s (
Figure 14), typhoons were highly likely to be the driving force of the forest succession.
Figure 8 and
Figure 9 show that clusters 5 and 9 lost EVI values of 13% and 14% during the typhoon seasons in 1991, while the values were positive after the 2018 typhoon season. The 40-year trend was the increasing EVI for the forest stands in the five rectangles in
Figure 2c.
Figure 10 and
Figure 12 also show that the forest stands were more tolerant to the strong winds of the 2018 typhoon than in the early 1990s, although the wind speeds were greater on 4 September 2018 (
Figure 3 and
Figure 12). The 2018 typhoon season indicated no damage as mean changes in EVI value. In a 100 × 100 km area in the current region of western Japan, including the Rokko Mountains, Takahashi and Saito [
47] found that mainly south slopes on mountains lost an NDVI of 0.050 or greater. Therefore, it is possible that forest stands on the Rokko Mountains had already become tolerant enough to the upslope winds before.
Shortly before approaching the Rokko Mountains, the typhoon damaged an experimental forest of Japanese cypress [
48]. In the plantation plot, 10% of Japanese cypress trees died due to the typhoon damage. On the same day, in another prefecture, the 1991 typhoon also disturbed multiple forest stands, among which the least affected were forest stands of a broadleaf species,
Quercus acutissima [
46]. The rate of damaged trees in the
Q. acutissima stands was 13%. A comparable rate of 15% was recorded for mixed forest stands with laurel tree species such as
Castanopsis and
Quercus trees. Pine tree stands were more severely disturbed, resulting in 37% damaged trees. Furthermore, the Japanese cypress and Japanese cedar forests were even more seriously damaged than the pine tree stands. The pine, cedar, and cypress trees introduced to the Rokko Mountains would have been more severely damaged on every slope of the Rokko Mountains due to weak root systems to support the above-ground biomass [
49], which is not necessarily advantageous to the leveraging force of strong winds of typhoons [
50].
4.3. Differences Between the South and North Slopes
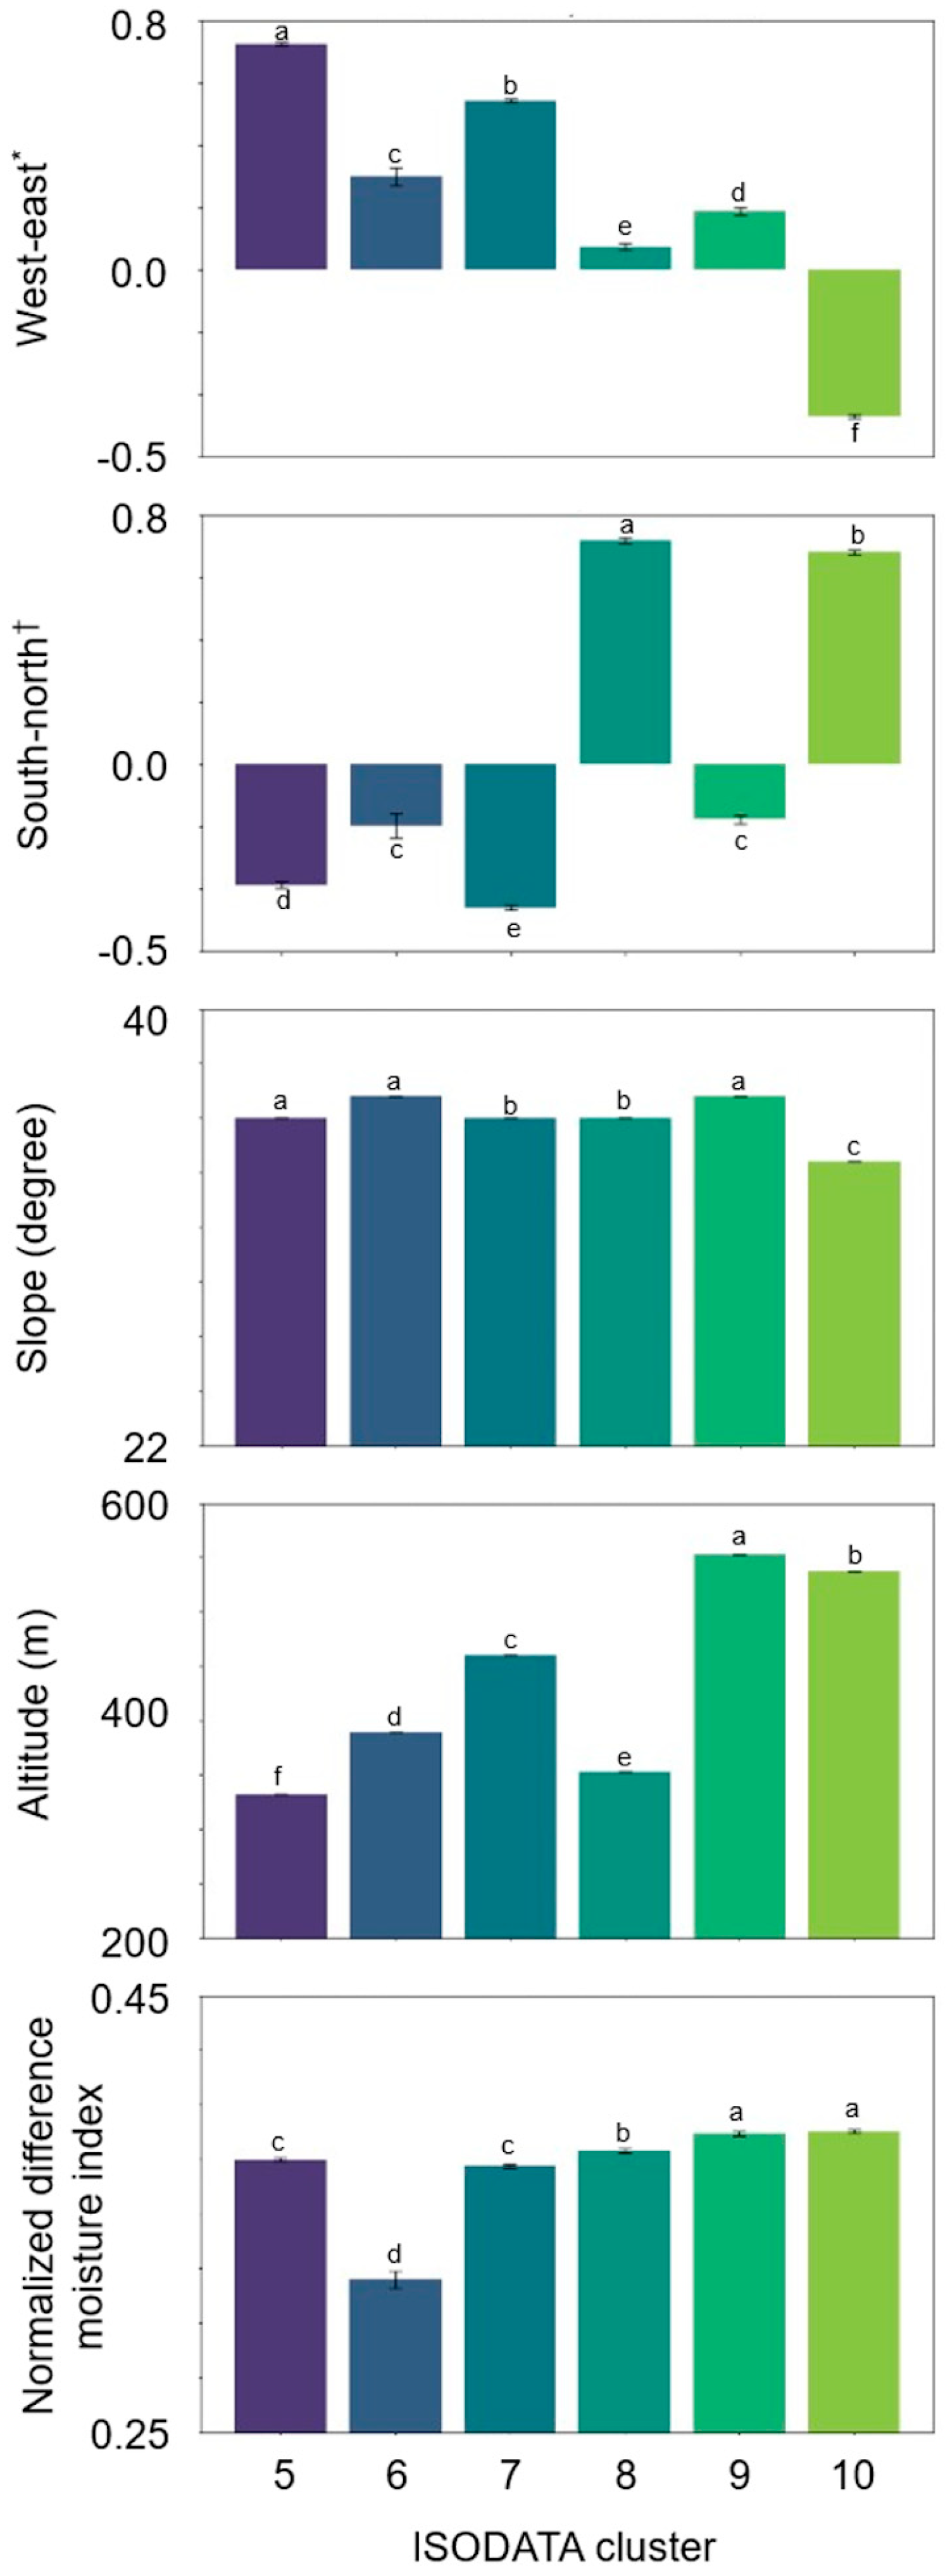
A novel finding of this study was that multiple vegetation types on the north-facing slopes were commonly damaged (
Figure 6,
Figure 7 and
Figure 11). This trend coincides with the findings by Ikami et al. [
51], who conducted a study in the Mie Prefecture. There, two forest stands on south- and north-facing slopes, covering 1.6 ha and 1.9 ha, respectively, had 937 and 969 Japanese cedar (
Cryptomeria japonica) trees. Over the ten-year period from 2013 to 2023, the south slopes lost 12 trees to windthrow, whereas the north slopes lost 48. A chi-square test yielded a chi-square value of 21.2. The odds ratio was 4.02. This result is close to the odds ratio of 5.12 observed for evergreen necromass occurrence on the north slopes of the Rokko Mountains in this study.
The south and north slopes of the mountains can be different in the intensity of air pollution effects in the south coastal Japanese mountains, such as Mount Gokurakuji in Hiroshima [
52] and the Rokko Mountains [
53]. In these mountains, pine trees on the south slopes are more significantly affected by air pollution that causes soil acidification [
54]. Meanwhile, evergreen laurel tree species are relatively more tolerant than Japanese cedar and Japanese cypress introduced in the Rokko Mountains reforestation program [
55]. Thus, less sensitive evergreen tree species could become more dominant due to their relatively greater tolerance to soil acidification [
30]. Also, there may be differences in soil fertility on the south and north slopes of the Rokko Mountains due to differences in solar irradiance per unit area [
56]. In the warmer region of Queensland, Australia, after cyclone Larry in 2006, there was a significantly higher percentage of tree falls in less fertile, granite-based sites compared with more fertile, basalt-based sites [
57]. Soils of the Rokko Mountains are also granite-based. It is worth investigating if the soil of clusters 8 and10 are more oligotrophic than the others, and whether or not the poor soil nutrient status resulted in the poor forest restoration.
4.4. Effects of the Earthquake
When compared with the typhoon effects, moderate changes in EVI before and after the earthquake were recognized (
Figure 10). The 1995 earthquake-induced landslide areas were distributed as small patches covering 0.1 to 1% of the areas analyzed by Kawabe et al. [
58]. Furthermore, trees partially uprooted in major earthquakes can survive and grow [
59]. These factors were possible causes of the moderate EVI losses for clusters 8 and 10. The results also indicated that the earthquake caused minor loss of foliage and small branches, and then the biomass recovered during the following summer, unlike the 1991 typhoon. Thus, the significant decreases in EVI in the 1991 typhoon are likely due to more frequent lethal trunk break and uprooting (
Table 4,
Figure 14).
In some cases, the uprooting of trees detaches the root systems from the soil [
60]. This root-damaging impact must have occurred in the Rokko Mountains as a result of the 1995 earthquake. Especially, tree species with relatively weak root systems, such as Japanese cedars, were likely to be the majority of the victims [
49]. Some damaged trees could have survived, although these were subjected to difficulties in taking in water and nutrients from the soil. Moderately damaged trees are expected to be more vulnerable to subsequent disasters, especially heavy rain. This possibility must not be ignored. The comparison of the leverage effect of wind on tree canopies and the mechanical impact of earthquakes, primarily on the root systems, remains to be made.
4.5. Perspective of Disaster Mitigation
By buffering direct rainfall via canopies, absorbing water in the root systems that prevents immediate water downflow, and holding soil structure with roots, forests have the function of preventing landslides [
61]. This function can be crippled by heavy rain, as well as by strong winds and earthquakes. From 8 to 10 August 2014, at the Kobe meteorological station, a precipitation of 267 mm and a maximum hourly wind speed of 14.6 m s
−1 were recorded. These conditions were thought to have caused landslides after forest disturbance [
3]. The landslides mainly occurred on the northern slopes of the Rokko Mountains [
29]. The distribution pattern of landslides reported by Okimura [
29] overlaps well with that of the poorly restored clusters 8 and 10 (
Figure 4).
The northern slopes had relatively more vulnerable trees, at least to the 2018 typhoon that pushed tree canopies and caused tree fall, as indicated in
Table 4 and
Figure 14. Intensive rainfall in August 2014 must have washed soil away from the root systems of partially uprooted but surviving trees. Some root systems of previously disturbed trees are likely to be more easily washed because roots detached from the above-ground biomass decompose rapidly [
62], and then the land stability declines [
49]. These underground processes related to forest succession are thought to have been associated with the 2014 landslides, the 1995 earthquake, and the typhoons. The mechanism of landslides after the 2014 heavy rain must be clearly different from that of the earthquake that resulted in landslides mainly on the south and east slopes [
63,
64].
The findings provide beneficial insights into adaptive and climate-resilient forest management strategies in regions increasingly threatened by super typhoons and seismic activities. The persistent vulnerability observed on the north-facing slopes highlights the need for slope-specific, proactive management. As a management strategy to foster climate-resilient forests, a topography-dependent conversion approach is possible. On vulnerable north-facing slopes, active forest management should prioritize the gradual conversion of legacy, weak-rooted coniferous plantations into deep-rooted evergreen broadleaved forests. This can be achieved through selective thinning of conifers to accelerate the natural recruitment of native laurel species, which showed greater tolerance to both windthrow and soil acidification in this region. Conversely, on south-facing slopes where forests have already achieved a certain level of wind tolerance, a passive restoration approach or minimal intervention could be applied to reduce management costs. Incorporating such topographically tailored silvicultural practices will assist forest managers in transforming vulnerable monocultures into structurally diverse, ecologically resilient ecosystems capable of withstanding the intensifying compound disturbances of the Anthropocene.
4.6. Limitations and Prospective of This Study
This study relied on changes in EVI value for the forest stands in winter. Therefore, the information is on evergreen tree species. In the succession processes, however, some deciduous tree species should have certain roles. Unfortunately, due to frequent disturbance by clouds at imagery acquisition times in the summer, no summer imagery data of adequate quality were available. The unavailability of information on canopies in the respective summers, including canopies of deciduous tree species, was a disadvantage.
Another clear disadvantage of this study is spatial resolution. As we relied mainly on Landsat and Sentinel imagery datasets, detailed outcomes and post-processes of the natural disasters were unseen, except for those shown in
Figure 14. Supplementing ground truth data is favorable, if available. Therefore, new census data are highly anticipated to enhance the validation of the models adopted in this study. In this context, EVI serves as a comprehensive indicator of vegetative response observed as overall spectral reflectance rather than distinguishing between different types of physical damage, such as simple defoliation versus long-term structural loss.
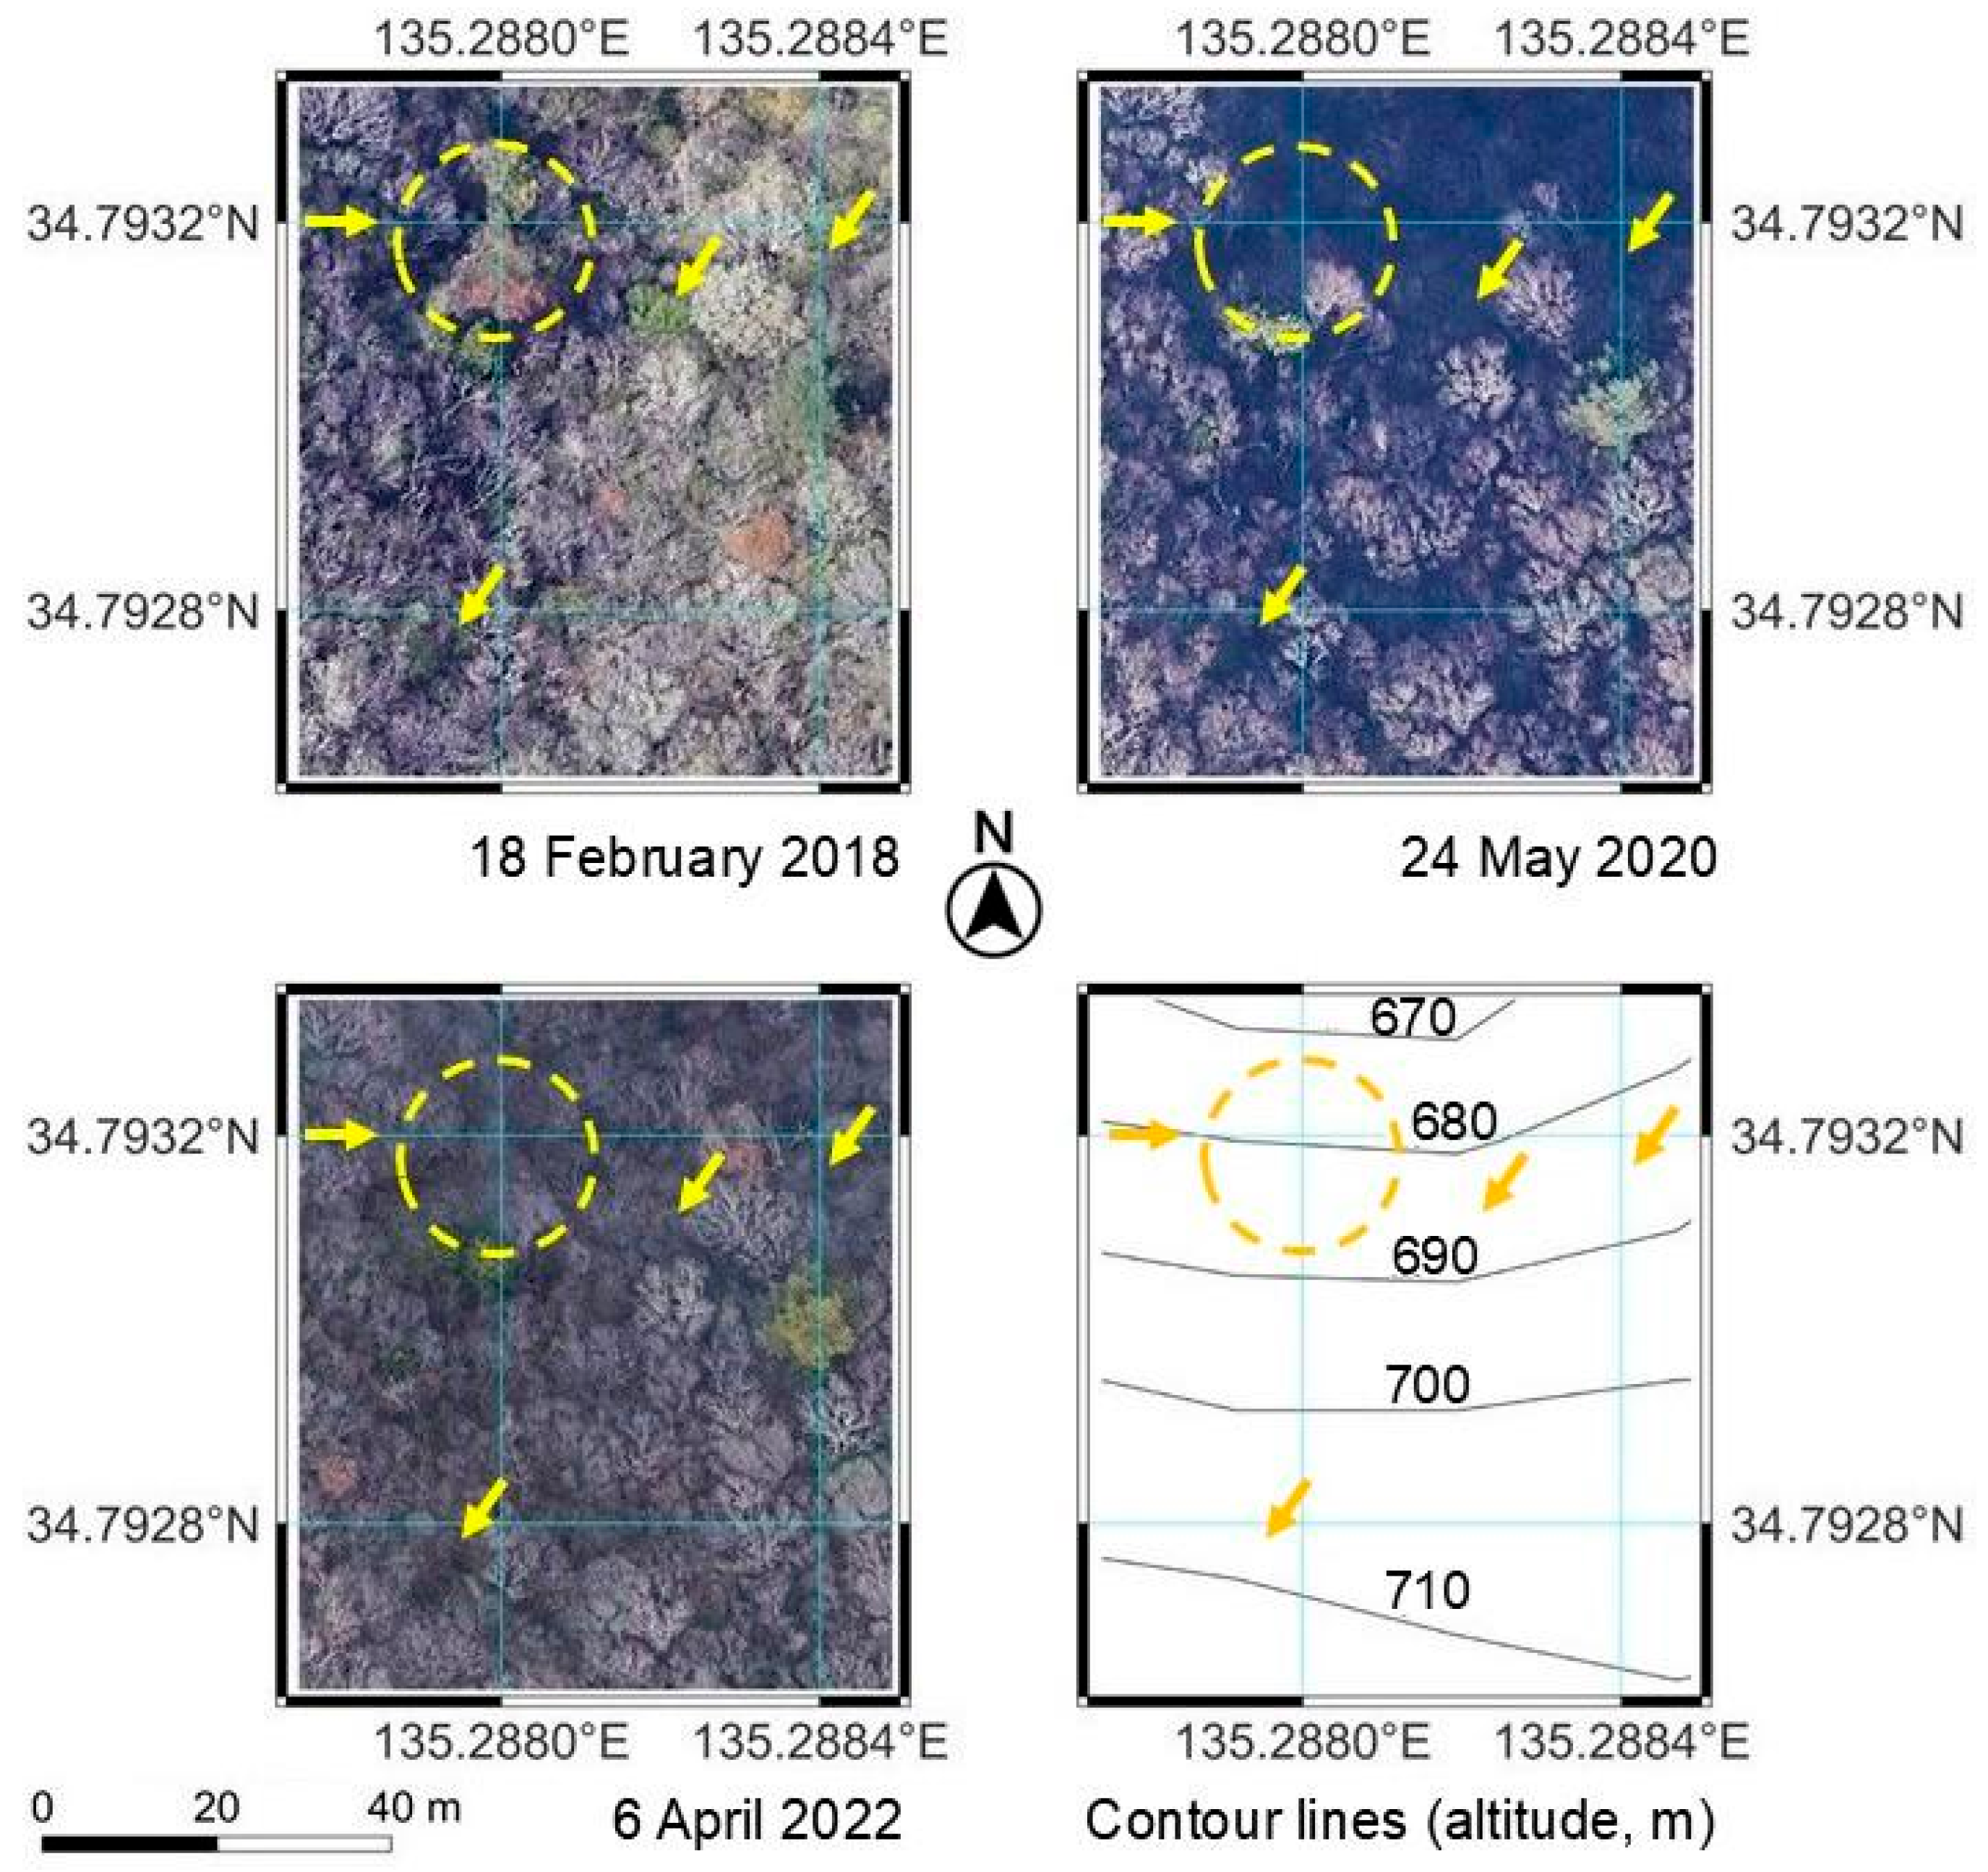
The effects of spatial autocorrelation were not entirely canceled out. However, the presence of opportunistic tree species that invaded during the succession process added structural heterogeneity to the forest canopy (
Figure 14). This diversity likely moderated the spatial autocorrelation (Moran’s I < 0.4) and contributed to the small recall rate (0.09) in the necromass detection, as the model primarily captured the most severe damage where topographic vulnerability overrode individual tree resilience.
Analyzing details of the listed aspects in
Section 4.2,
Section 4.3 and
Section 4.4 will generate useful knowledge. Tracking future changes in the forest stands will be valuable by analyzing aspects of physicochemical soil characteristics [
65], airborne depositions [
53], tree census, and cm level resolution canopy appearance. The mountains have clear records of deforestation and reforestation. Thus, they are a good study site for extracting knowledge on processes and results of deforestation and reforestation, in addition to natural disaster prevention and the resilience of the forests.
It is highly plausible that the 1995 earthquake interacted with subsequent typhoons, and we acknowledge the difficulty in isolating their individual impacts. However, future exploration of the mechanical links between extreme weather and tectonic activity may provide a more comprehensive understanding of forest succession and offer critical insights for disaster management.
5. Conclusions
For the first time, this study bridged the identified knowledge gap by directly comparing the destructive impacts of tropical cyclones and a major earthquake at a shared site. Contrary to our initial hypothesis that the earthquake would exert a more profound impact, the temporal analysis of EVI demonstrated that the 1991 super typhoon was the most significant driving force of forest succession on a landscape scale. While the 1995 earthquake had only moderate effects on forest stands on northern slopes, the entire mountain range revealed an increase in long-term resilience against subsequent typhoons. This study uncovered hidden topographic vulnerabilities: we revealed a common vulnerability across diverse vegetation types under consistent topographical conditions during the 1994 typhoon and the 1995 earthquake. This central finding proves that forest disturbance and subsequent successional resilience are heavily dictated by slope-specific dynamics rather than tree species diversity alone.
The most vulnerable forest stands had multiple vegetation types, including deciduous, evergreen, coniferous, and broadleaved trees. Because typhoons kill trees, especially those that have weak root systems, the northern slopes were highly likely to experience forest succession accelerated by the typhoons functioning as a driving force thereof. Indeed, according to precise cm level Google Earth images, some evergreen tree canopies confirmed in February 2018 on a northern slope disappeared following the super typhoon in September 2018.
Moderate effects of an Mj = 7.2 earthquake in 1995 on EVI were recognized. The earthquake did not cause significantly large landslides that exposed soil. Thus, the root systems of the most typhoon-vulnerable forest stands were not significantly affected by the mechanical force primarily on the root systems. Changes in EVI showed that the 1991 super typhoon more seriously disturbed the vulnerable forest stands by killing the weakest trees. These processes are thought to have enhanced the forest succession by substituting vulnerable trees with indigenously dominant tree species, typically broadleaved evergreen laurel trees such as oaks. The south slopes must differ from the north slopes in multiple ecological aspects. These differences are worth investigating based on the findings and discussion of this study. The Rokko Mountains are a good study site because of their unique history, geographical conditions, and ecosystem restoration processes.
The study area is characterized by frequent heavy rainfall, in addition to typhoons and earthquakes. Unlike the stable forest regeneration patterns observed in tectonically inactive tropical regions, forests in this landscape undergo restoration through frequent physical disturbances and subsequent successions. Furthermore, the details of these successional processes differ significantly between south- and north-facing slopes. The fact that the odds of necromass occurrence on northern slopes remain five times higher than on southern slopes, even a century after plantation, warrants serious attention for future disaster management. On a landscape scale, typhoons have exerted more destructive impacts than the 1995 earthquake. Moreover, the frequency of typhoons is significantly higher. Therefore, disaster mitigation strategies for typhoon events must account for the current successional status, which is inherently characterized by slope-specific vulnerability, as tropical cyclones have become increasingly intense in recent years.