Review

Carbon Budget of Rubber Plantation Ecosystems: Patterns, Drivers, and Sustainable Management Implications


1
College of Resources and Environmental Engineering, Guizhou University, Guiyang 550025, China
2
Guizhou Karst Environmental Ecosystems Observation and Research Station, Ministry of Education, Guizhou University, Guiyang 550025, China
3
Guizhou Provincial Double Carbon and Renewable Energy Technology Innovation Research Institute, Guiyang 550025, China
*
Author to whom correspondence should be addressed.
Forests 2026, 17(6), 653; https://doi.org/10.3390/f17060653
Submission received: 25 March 2026 / Revised: 22 May 2026 / Accepted: 25 May 2026 / Published: 28 May 2026
(This article belongs to the Section Forest Ecology and Management)

Abstract

Rubber plantations are a key component of managed forest ecosystems. Quantifying the carbon budget is essential for assessing their carbon sequestration potential and informing sustainable management practices. However, previous studies have focused primarily on individual carbon pools or specific regions, lacking a comprehensive assessment of the carbon budget in rubber plantation ecosystems (RPEs). This study systematically synthesizes the carbon budget of RPEs based on 678 data points extracted from 58 publications. The results indicate that (1) The carbon stock of RPEs (including plant, soil (0–100 cm), and litter carbon stocks) shows an accumulation trend with stand age, increasing from an average of 113.41 ± 21.63 tC ha−1 in young plantations to 252.64 ± 24.61 tC ha−1 in over-mature plantations. (2) RPEs exhibit high photosynthetic capacity and significant carbon sequestration potential during rotation phase, with mean gross primary productivity (GPP) of 22.99 ± 2.14 tC ha−1 yr−1, mean ecosystem respiration (Reco) of 13.92 ± 2.87 tC ha−1 yr−1, and net ecosystem carbon exchange (NEE) of −9.07 ± 1.91 tC ha−1 yr−1. (3) The carbon sequestration capacity of RPEs is influenced by stand age, and carbon sink capacity varies across different planting regions. (4) RPEs act as carbon sinks during rotation phase (−9.07 ± 1.91 tC ha−1 yr−1), with mean carbon storage of 196.13 ± 23.58 tC ha−1 (comprising plant biomass, litterfall, and soil carbon stocks of 70.25 ± 17.47, 2.50 ± 1.30, and 123.38 ± 14.47 tC ha−1, respectively). This synthesis provides representative baseline values for RPEs carbon dynamics, offering a scientific foundation for assessments of carbon sequestration potential and management practices.

1. Introduction

Forest ecosystems are an integral part of terrestrial systems, playing a vital role in maintaining ecological balance, conserving biodiversity, and functioning as the largest carbon reservoir on land [1,2,3]. Through photosynthetic carbon sequestration, forest ecosystems continuously absorb CO2 from the atmosphere, meeting the metabolic demands of vegetation growth and forming stable carbon storage through biomass accumulation [4,5]. Global climate change and carbon neutrality initiatives have accelerated research on forest carbon dynamics, particularly in terms of carbon stocks and fluxes [6]. Planted forests provide dual ecological and economic benefits through their controlled carbon sequestration potential and economic output [7]. Consequently, they have garnered significant attention in forest carbon cycle research and have gradually become a central focus in studies of carbon cycling within forest ecosystems [8].
The rubber tree (Hevea brasiliensis), an archetypal plantation species, has made rubber plantations a dominant component of managed forest ecosystems across Southeast Asia and China’s tropics (Hainan, Yunnan, Taiwan), supported by established silvicultural systems and significant economic returns. Rubber plantations enhance smallholder incomes [9,10] and are a critical source of natural rubber, widely used in core industries including tire manufacturing and healthcare. The rapid expansion of rubber plantations has led to the large-scale replacement of natural and secondary forests [11,12], causing a range of adverse ecological impacts, including biodiversity loss, soil erosion, and landscape fragmentation [13,14,15]. Thus, rubber plantations involve complex trade-offs between economic benefits and ecological functions, sparking ongoing debates within the ecological community about their cultivation [16]. In addition to the negative impacts mentioned above, studies have shown that rubber plantations have higher carbon sequestration potential than other managed forests during rotation phase, including eucalyptus and oil palm [17,18]. Notably, the carbon sink capacity coexists with substantial economic returns [19], providing a potential pathway to alleviate the existing conflicts and debates about their cultivation. Research on carbon stocks, fluxes, and their drivers in rubber plantation ecosystems forms the scientific basis for optimizing management strategies, balancing economic development and ecological benefits in rubber plantations.
Current research has extensively examined carbon stocks in rubber plantation carbon pools. Most studies are limited to single-pool analyses, overlooking comprehensive quantification of multiple carbon pools [20]. Research on carbon fluxes using eddy covariance, model simulation, and biological inventory methods has examined core indicators, including Gross Primary Productivity (GPP), Ecosystem Respiration (Reco), and Net Ecosystem Exchange (NEE), revealing the carbon sequestration capacity of rubber plantations [21,22]. However, current findings are largely confined to specific planting areas, restricting the representativeness of results across geographic regions, climate conditions, and stand age classes [23], all of which are key factors that determine the carbon budget characteristics of rubber plantation ecosystems [24,25]. Consequently, integrating and synthesizing data from published literature is essential to establish regionally representative and universally applicable reference values for rubber plantation carbon stocks and fluxes [26]. These values will facilitate more accurate assessments of carbon sink potential, thereby informing sustainable management strategies and supporting dual-carbon goals. The goal of this study is to conduct a scientific assessment of carbon sequestration benefits in rubber plantation ecosystems. By systematically integrating existing literature, we distill core patterns and key drivers, and synthesize management implications to improve management practices for enhancing the carbon sequestration capacity of rubber plantations, while also offering newcomers to the field an efficient pathway to acquiring relevant knowledge. To achieve these goals, our study synthesizes published data to acquire carbon flux and stock values for rubber plantations, with the specific aims to: (i) quantify carbon stocks and characterize dynamic changes of the three main carbon pools (plant, litter, and soil); (ii) assess the carbon sink capacity of major rubber plantation regions and identify the factors influencing carbon fluxes; and (iii) develop a carbon budget diagram for rubber plantation ecosystems to show their carbon stock and fluxes clearly.

2. Materials and Methods

2.1. Database Development

Published studies and reports addressing plant and soil carbon stocks in rubber plantations were retrieved and screened through systematic literature searches for subsequent data synthesis. To compile the database, journal articles were obtained from the China National Knowledge Infrastructure (CNKI, http://www.cnki.net) and the Web of Science (WOS, http://webofknowledge.com) through targeted searches. For CNKI, the search used the following terms with Boolean operators: (carbon exchange OR carbon flux OR carbon storage OR carbon density OR soil respiration) AND rubber plantation, yielding 76 publications. For Web of Science (WOS), the search terms were: (((((((TS = (carbon stock*)) OR TS = (carbon storage*)) OR TS = (biomass)) OR TS = (carbon exchange*)) OR TS = (carbon sequestration*)) OR TS = (carbon flux*)) OR TS = (soil respiration*)) AND TS = (rubber plantation* OR Hevea brasiliensis plantation* OR rubber agroforest*), yielding 478 articles (with the search period up to April 2026).
To ensure data representativeness and reliability, we excluded studies unrelated to carbon storage, fluxes, cycling, or budgets in rubber plantations. Studies focusing on single rubber trees or other mixed forests were also excluded. Only studies that explicitly reported carbon stocks or carbon fluxes, provided detailed methodological descriptions, and demonstrated reliable data quality were included. Studies with unclear methodologies, large discrepancies compared to similar studies, speculative findings, or those reporting only on rubber agroforestry systems without pure rubber monocultures were either used as supplementary references or excluded. Based on these screening criteria, 58 publications addressing carbon budget in rubber plantation ecosystems were identified. The complete publications selection process is detailed in Figure S1, and the complete list of the 58 publications used for data extraction and synthesis in this study is provided in the Supplementary File (Carbon stocks.xlsx and Carbon fluxes.xlsx).
Core variables collected included site elevation, mean annual precipitation (MAP), mean annual temperature (MAT), and stand age. The primary data compilation focused on carbon stock across ecosystem pools and carbon fluxes parameters, including Gross Primary Productivity (GPP), Ecosystem Respiration (Reco), and Net Ecosystem Exchange (NEE). In addition, data for specific respiration components, including soil respiration (Rs) and root respiration (Ra,s), were also extracted from the literature. For all carbon-related parameters, we extracted the mean values reported in the primary studies.
To enable subsequent statistical analyses, rubber plantations were categorized into five stand age classes (Table 1) based on growth stages and characteristics, in accordance with the Forestry Industry Standard of the People’s Republic of China LY/T 2908-2017: Regulations for Age-Class and Age-Group Division of Main Tree Species. The five classes were defined as young plantation (1–7 yr), middle-aged plantation (8–15 yr), pre-mature plantation (16–25 yr), mature plantation (26–30 yr), and overmature plantation (>30 yr, with a maximum stand age of 47 yr in our dataset).

2.2. Study Area and Classification

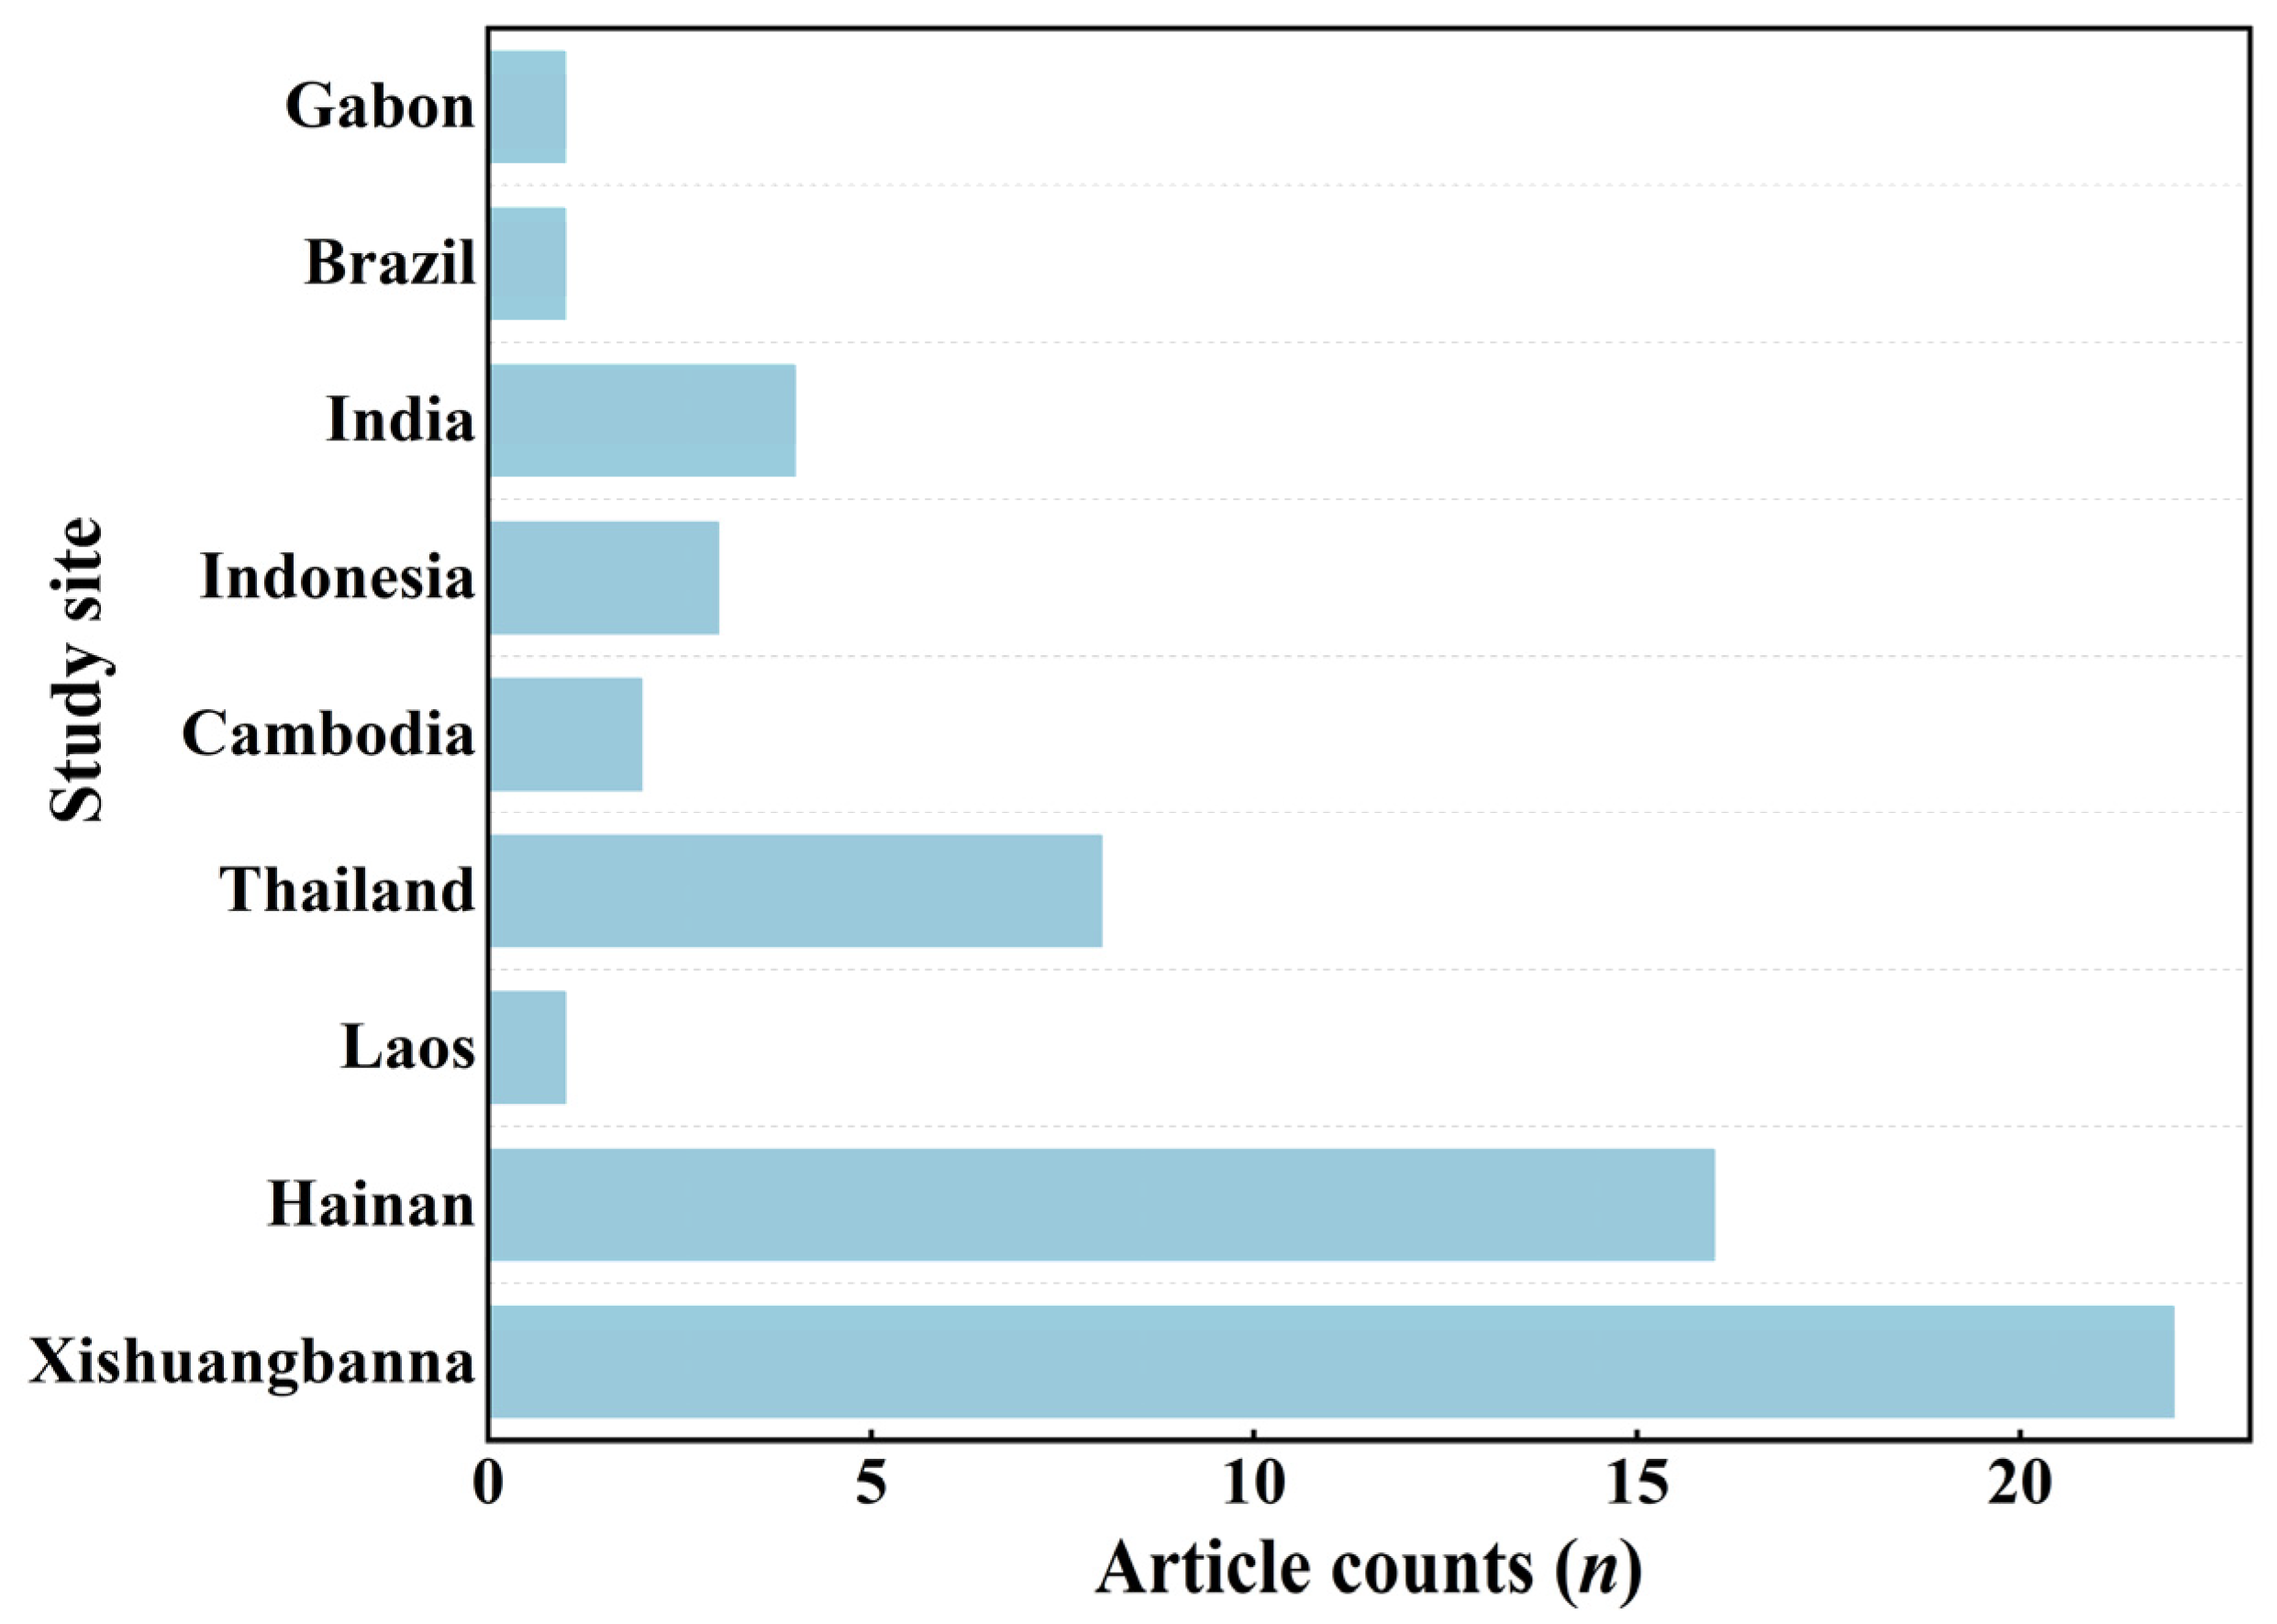
As a typical heliophilous species, the rubber tree is primarily cultivated in tropical regions characterized by high temperatures, high humidity, and an absence of frost. At present, cultivation is mainly concentrated in Southeast Asia (Thailand, Indonesia, Malaysia, Vietnam), South Asia (India, Sri Lanka), Africa (Côte d’Ivoire, Nigeria), and China (Xishuangbanna, Hainan) [27]. Nevertheless, as indicated by the literature compiled for this synthesis, research on carbon stocks and fluxes in rubber plantation ecosystems exhibits pronounced geographical disparities (Figure 1), with a predominant focus on China and Southeast Asia, while plantations in other major producing areas, such as Africa, South Asia, and Brazil, are rarely studied. Regarding specific research areas, studies in China primarily concentrate on Xishuangbanna State and Hainan Island. Meanwhile, Southeast Asian researchers focus on rubber plantations mainly in Thailand, Indonesia, Cambodia, and Laos. Considering that Southeast Asian countries (including Thailand, Indonesia, Cambodia, and Laos) share a similar equatorial monsoon climate and represent the traditional core zone of global rubber cultivation [12], we aggregated these countries into a unified Southeast Asia plantation zone (n = 14). In contrast, studies in China primarily concentrate on Xishuangbanna and Hainan Island. These regions represent the northern marginal rubber planting zone, characterized by distinct ecological and climatic constraints compared to the traditional equatorial core [28,29]. Therefore, Xishuangbanna and Hainan were grouped together as the China zone (n = 38) for comparison with Southeast Asia. Furthermore, since individual countries such as Gabon (n = 1), Brazil (n = 1), and India (n = 4) cannot broadly represent their respective continental regions (Africa, South America, and South Asia), and considering that commercial rubber plantations are globally managed as standardized monocultures that exhibit a high degree of structural and physiological uniformity [30], we treated them as independent studies and incorporated them into our overall statistical analysis.

2.3. Data Extraction and Calculation Methodology

We compiled all available reported values from the literature, including explicitly mentioned numerical data presented in tables, figures, the main text, and Supplementary Materials of the articles. Not all core variables selected for this study were reported in each relevant publication, as most primary studies focus exclusively on specific components (e.g., only biomass carbon or soil organic carbon, or specific fluxes like NEE without GPP). The absence of certain variables was not used as a criterion for exclusion to maximize the utilization of available empirical data. For variables not reported in the original articles, we maintained objective records and applied no data imputation or other speculative processing, ensuring the synthesis remains strictly grounded in observed evidence. The analysis for each figure and table in the Results section (Section 3) is based solely and objectively on the values reported in the original studies.
In some publications, data were only reported graphically. In such cases, we used the GetData Graph Digitizer tool to extract the unreported data from the graphs, performing three extractions and using the average value to ensure consistency and accuracy. For studies that only reported biomass, we applied a default carbon conversion factor of 0.5 to convert dry biomass to carbon mass [31]. For studies reporting soil organic carbon content ( C i ), soil bulk density ( θ i ), and soil layer thickness ( D i ), the study used Equation (1) to calculate the soil organic carbon stock (SOC) in the 0–100 cm layer [32], where i denotes the soil layer index.
SOC = i n C i × θ i × D i
To ensure carbon cycle closure and construct a consistent carbon budget diagram for rubber plantation ecosystems, we utilized the fundamental mass-balance equation for ecosystem carbon exchange [33,34]. Specifically, to guarantee mass balance across all synthesized flux components, Reco (Caculated values) was derived using the standard flux partitioning relationship: −NEE = GPP − Reco (assuming the atmospheric sign convention where a negative NEE indicates a net carbon sink). We further partitioned Reco into its specific belowground and aboveground components. Values for total soil respiration (Rs) and belowground root autotrophic respiration (Ra,s) were directly extracted from our compiled literature database. Based on these values, soil heterotrophic respiration (Rh,s) was calculated as the difference between soil respiration and root respiration (Rh,s = Rs − Ra,s). Subsequently, aboveground autotrophic respiration (Ra,a) was derived by subtracting total soil respiration from the total ecosystem respiration estimated above (Ra,a = Reco − Rs) [35]. All data points extracted from the literature were initially categorized by their corresponding stand age class (e.g., YP, MIP) and plantation region (e.g., Xishuangbanna, Hainan, Southeast Asia). For each category, we calculated the arithmetic mean and standard deviation (SD) of the carbon stock or flux values. The mean value of the carbon stock was compared using one-way analysis of variance (ANOVA), and the significant difference between the means was calculated using the Tukey post-hoc test at p < 0.05. Additionally, independent sample t-tests were employed to evaluate the differences in plant carbon stocks between the two elevational gradients. For comparability across studies, carbon stocks and fluxes were standardized to tC ha−1 and tC ha−1 yr−1, respectively.

3. Results

3.1. Carbon Stock in Rubber Plantation Ecosystem

3.1.1. Changes in Plant Carbon Stock with Stand Age and Elevation

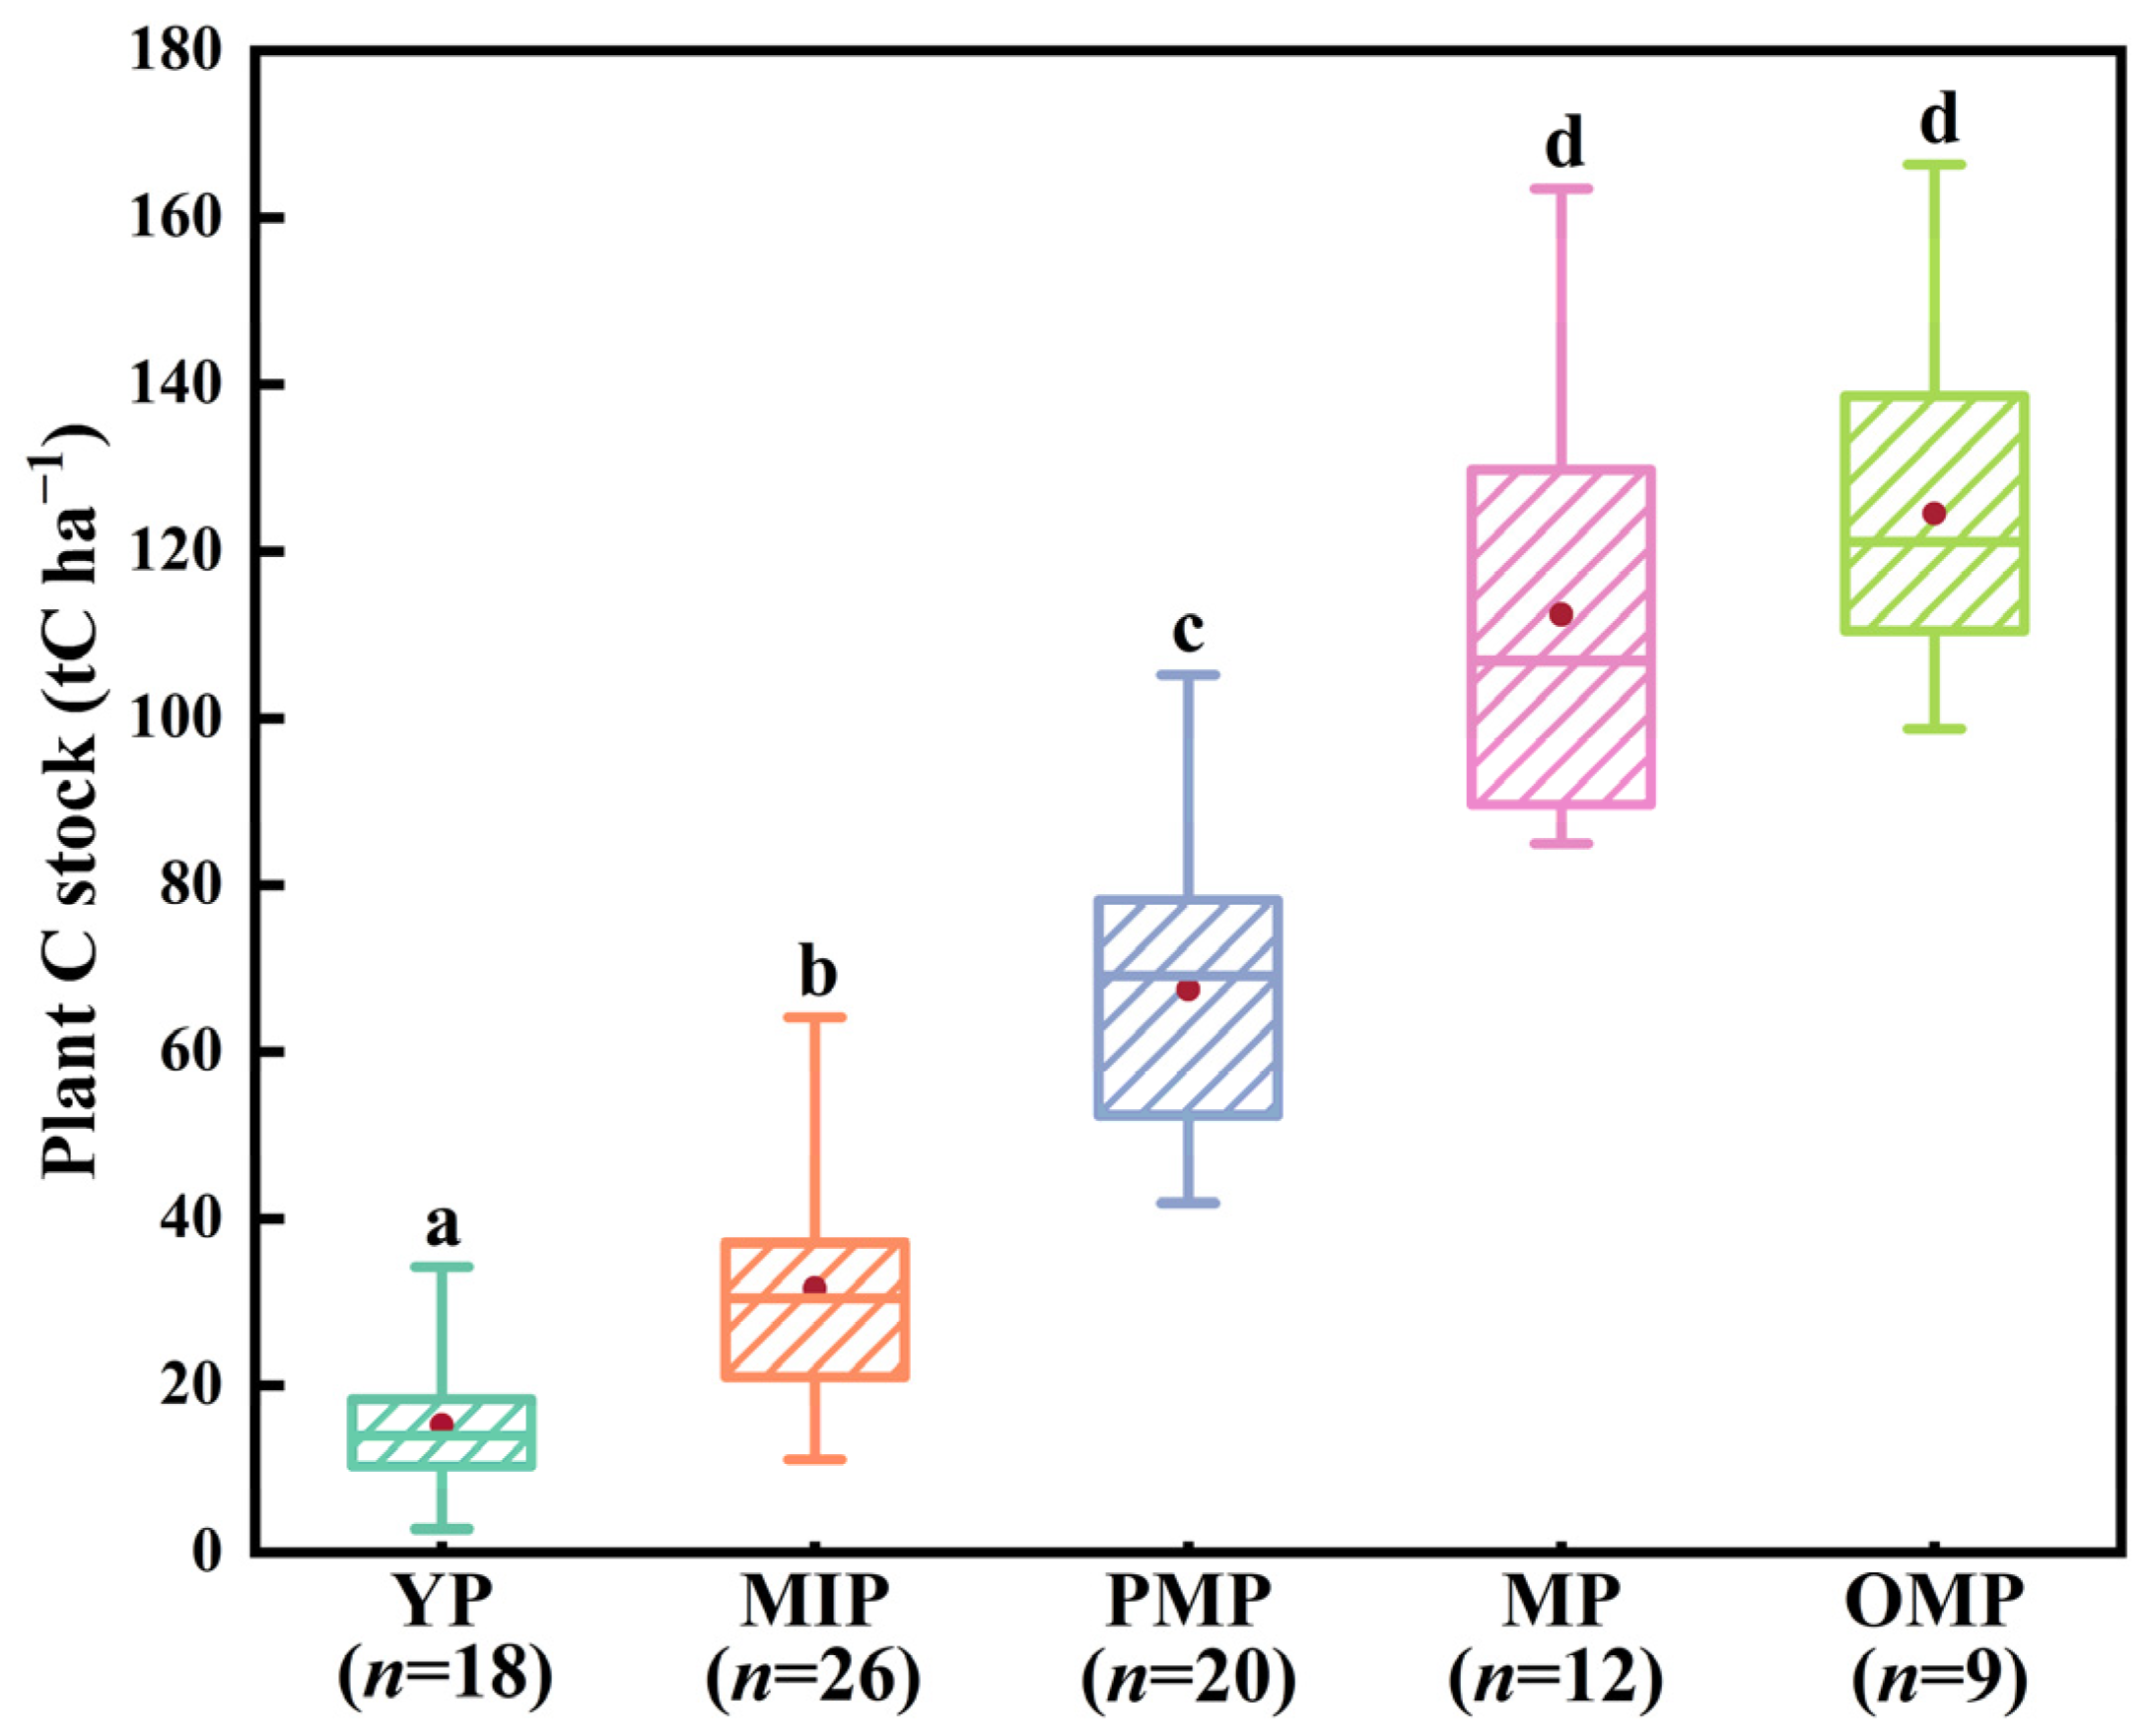
Synthesized data reveal that plant carbon stocks (excluding understory vegetation) in rubber plantation ecosystems range from 15.28 ± 8.22 to 124.47 ± 21.28 tC ha−1 (Figure 2) and show a significant increasing trend with stand age (p < 0.05). The results indicate a progressive accumulation of plant carbon stocks with increasing stand age in rubber plantations, characterized by a marked increase from young plantation (YP)to mature plantation (MP) stage, ultimately peaking in over-mature plantation (OMP) stage at 124.47 ± 21.28 tC ha−1. In the young plantation (YP) stage, carbon stocks remain low at 15.28 ± 8.22 tC ha−1. By the MIP stage, stocks moderately increase to 31.64 ± 14.41 tC ha−1, though values remain relatively low. A pronounced increase occurs in the PMP stage, with carbon stocks reaching 67.42 ± 16.62 tC ha−1, representing a 113.08% increase over the MIP stage. In Mature plantation (MP) stage, carbon stocks further increase to 112.42 ± 26.82 tC ha−1, while the OMP stage peaks at 124.47 ± 21.28 tC ha−1, exceeding young stand values by more than eightfold.
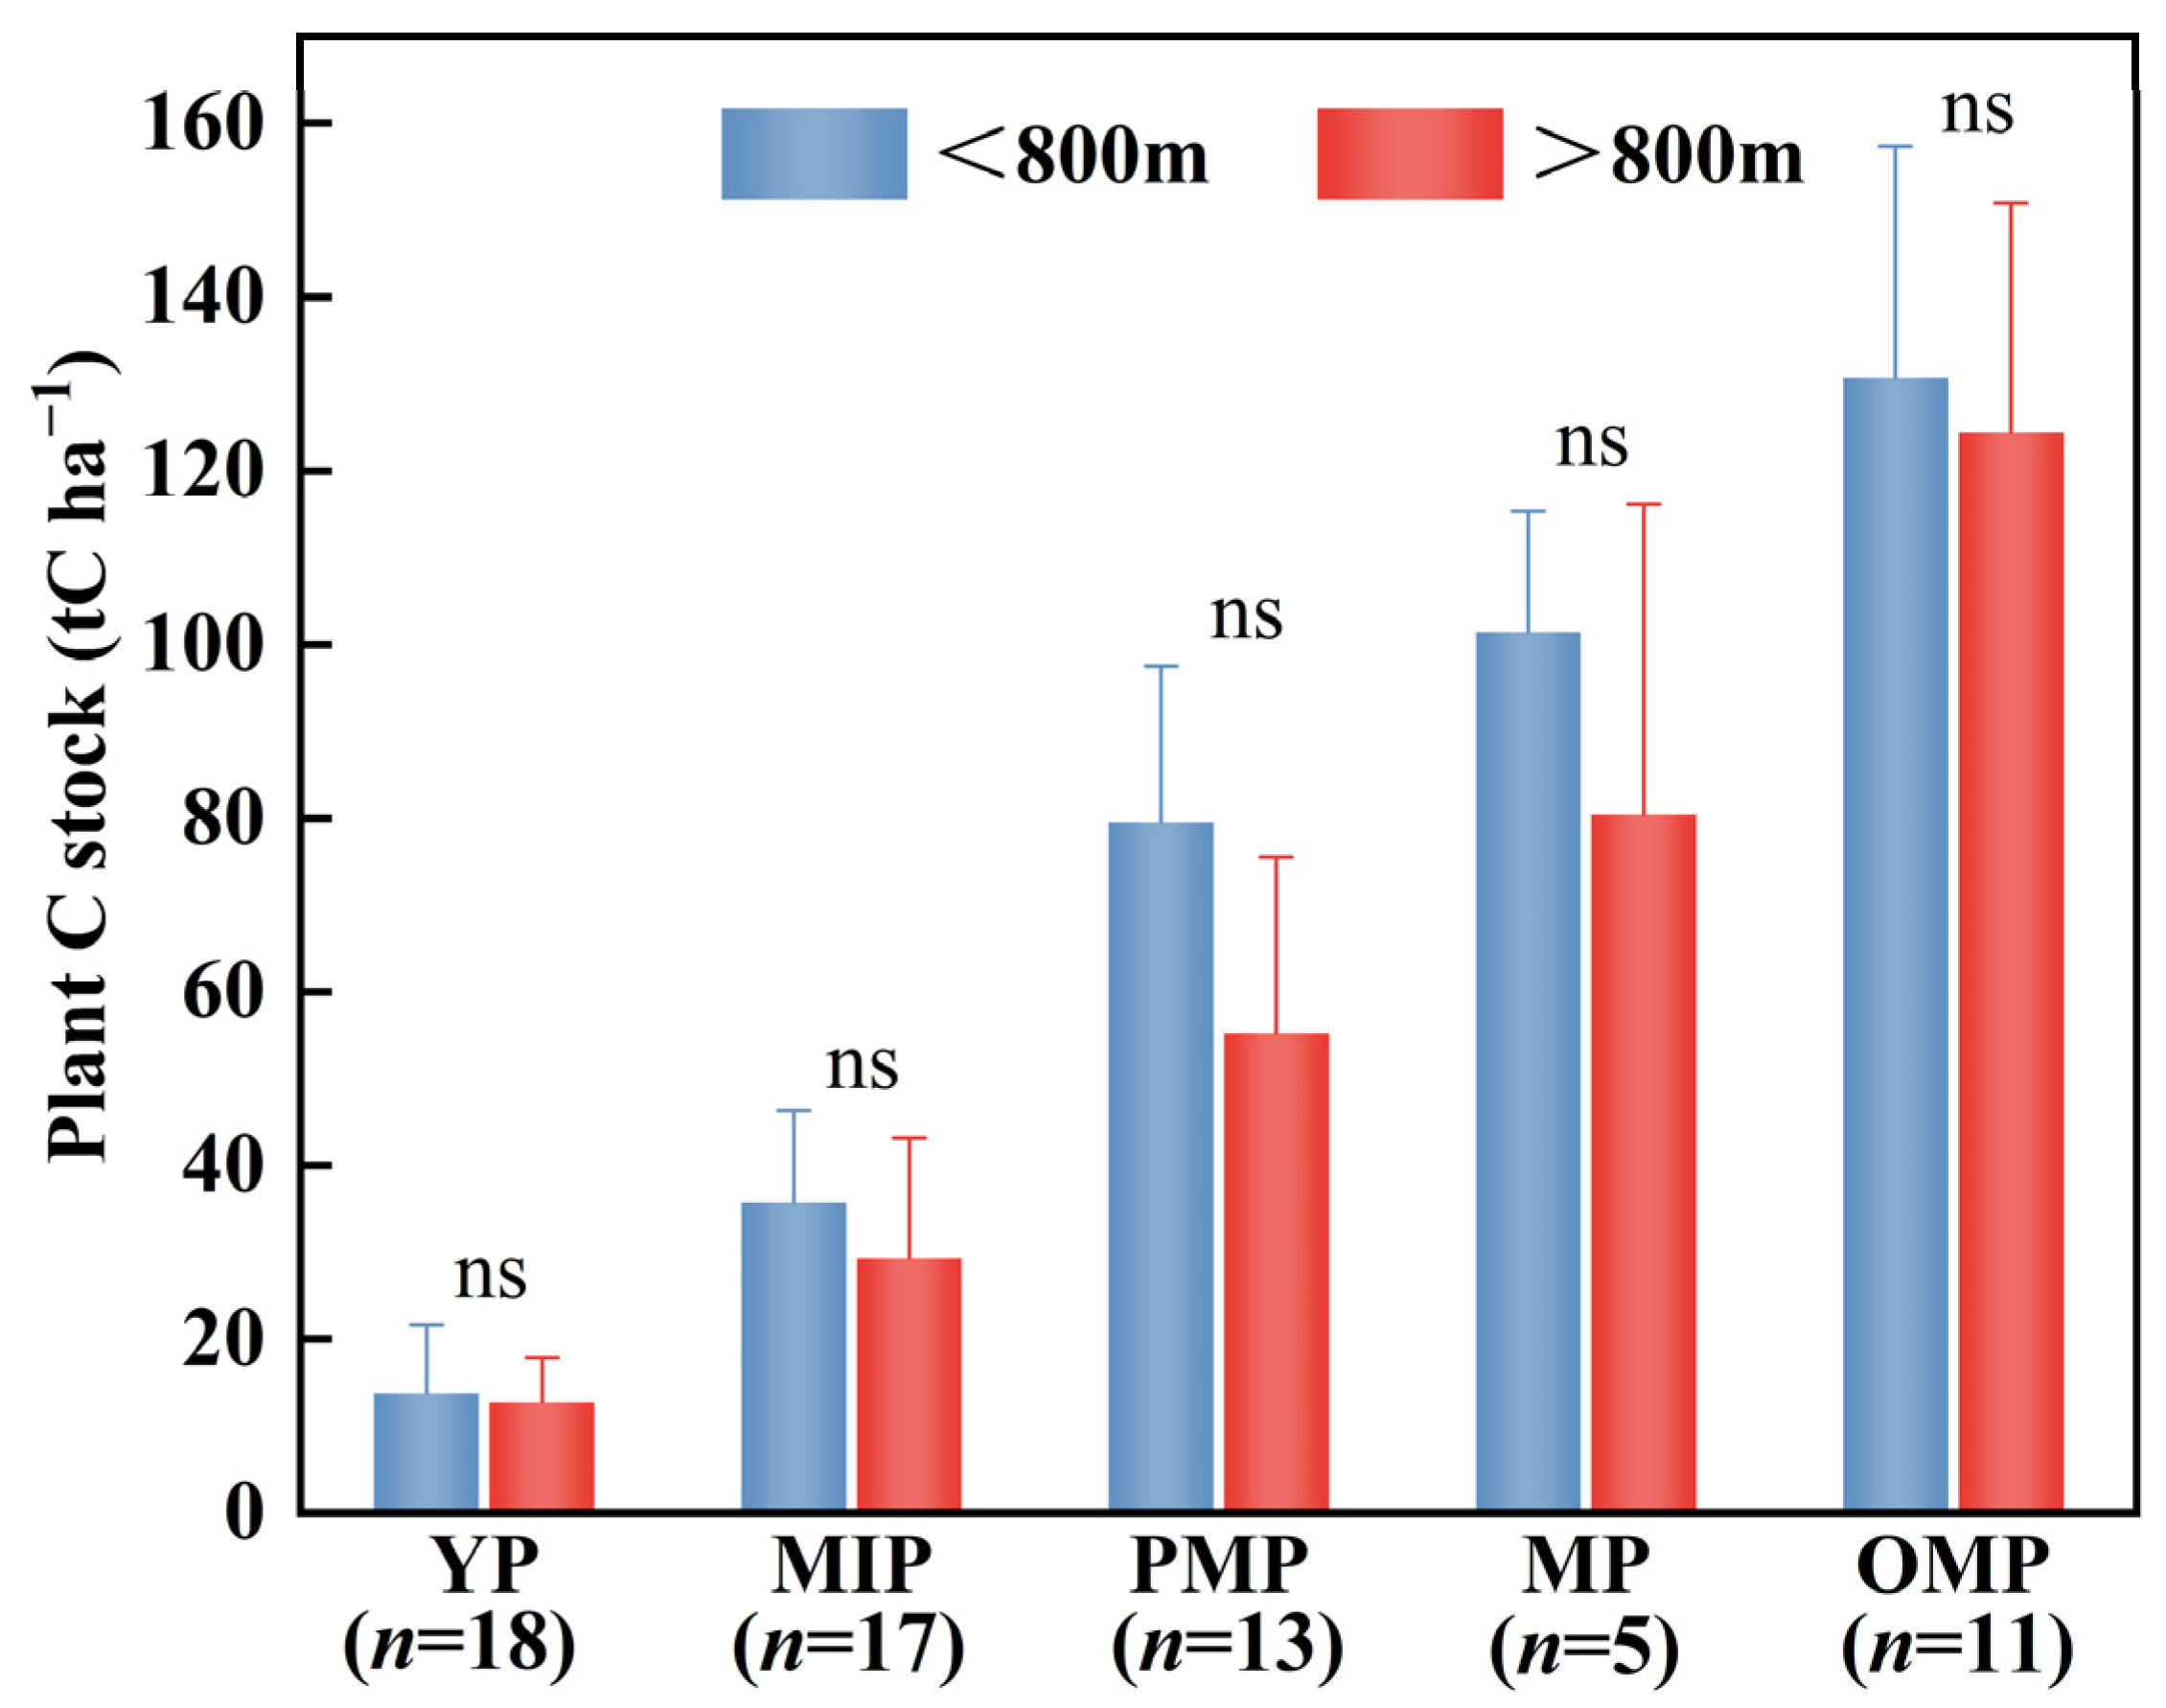
To examine elevational effects on plant carbon stocks across rubber plantation age classes, we defined two elevation gradients: optimal cultivation zones (<800 m) and suboptimal cultivation zones (>800 m). Based on the summarized mean values of plant carbon stocks in rubber plantations across different elevations and stand ages (Figure 3), the distribution patterns show that: (1) In the YP stage, the plant carbon stocks showed no statistically significant differences (p > 0.05), recording 13.83 tC ha−1 in optimal zones and 12.80 tC ha−1 in suboptimal zones. (2) As stand age increased, plant carbon stocks accumulated across both elevation gradients; although plant carbon stocks showed numerical variations across elevational gradients and optimal zones remained numerically higher, independent t-tests revealed no statistically significant differences (p > 0.05) between optimal (<800 m) and suboptimal (>800 m) zones throughout the chronosequence. (3) By the OMP stage, the mean carbon stocks reached 130.75 tC ha−1 in optimal zones and 124.41 tC ha−1 in suboptimal zones. Overall, plant carbon stocks exhibited a consistent age-dependent accumulation pattern across both elevation gradients; however, no statistically significant differences were observed between the two altitudinal zones within any specific age class.

3.1.2. Changes in Litter Carbon Stock with Stand Age

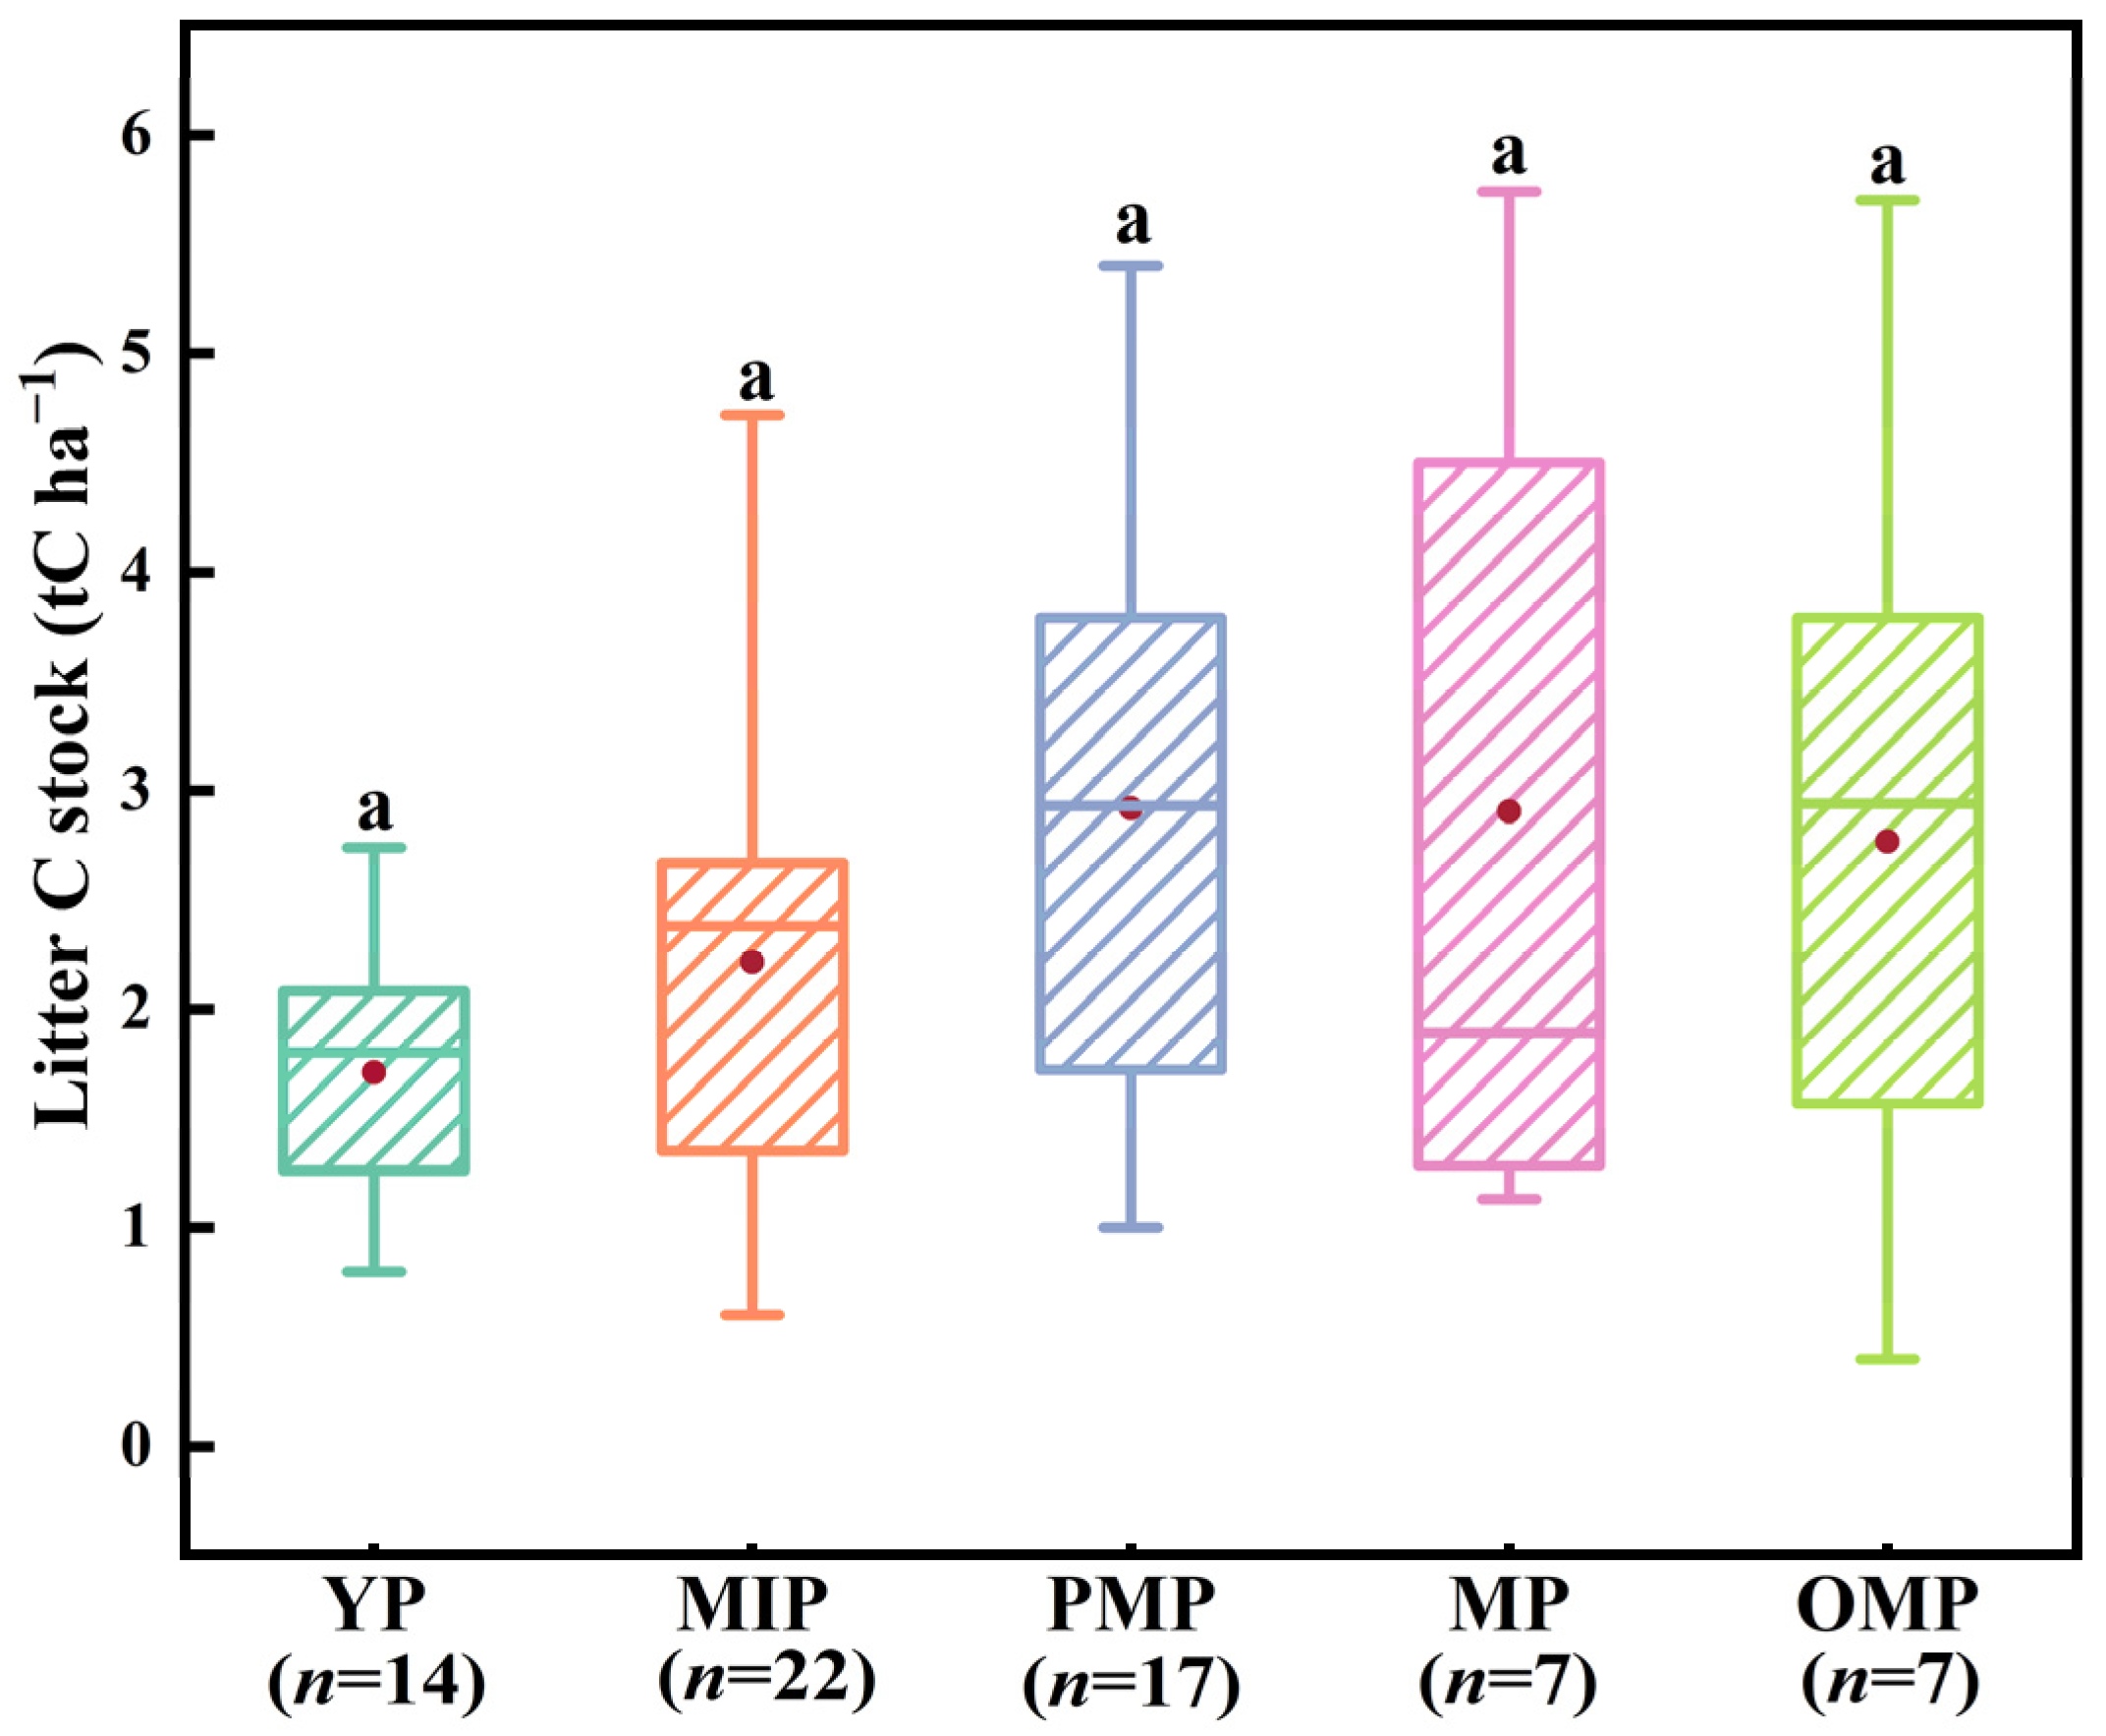
The litter carbon pool, primarily originating from leaf litter, branches, and fruit, exhibited considerable stability across stand age classes (p > 0.05). Litter carbon stocks remained relatively constant throughout the chronosequence, ranging between 1.71 ± 0.60 tC ha−1 and 2.92 ± 1.32 tC ha−1 (Figure 4). The litter carbon pool maintains a consistent level as the plantation matures, reflecting a balanced dynamic between litter input and decomposition.

3.1.3. Changes in Soil Carbon Stock with Stand Age and Soil Depth

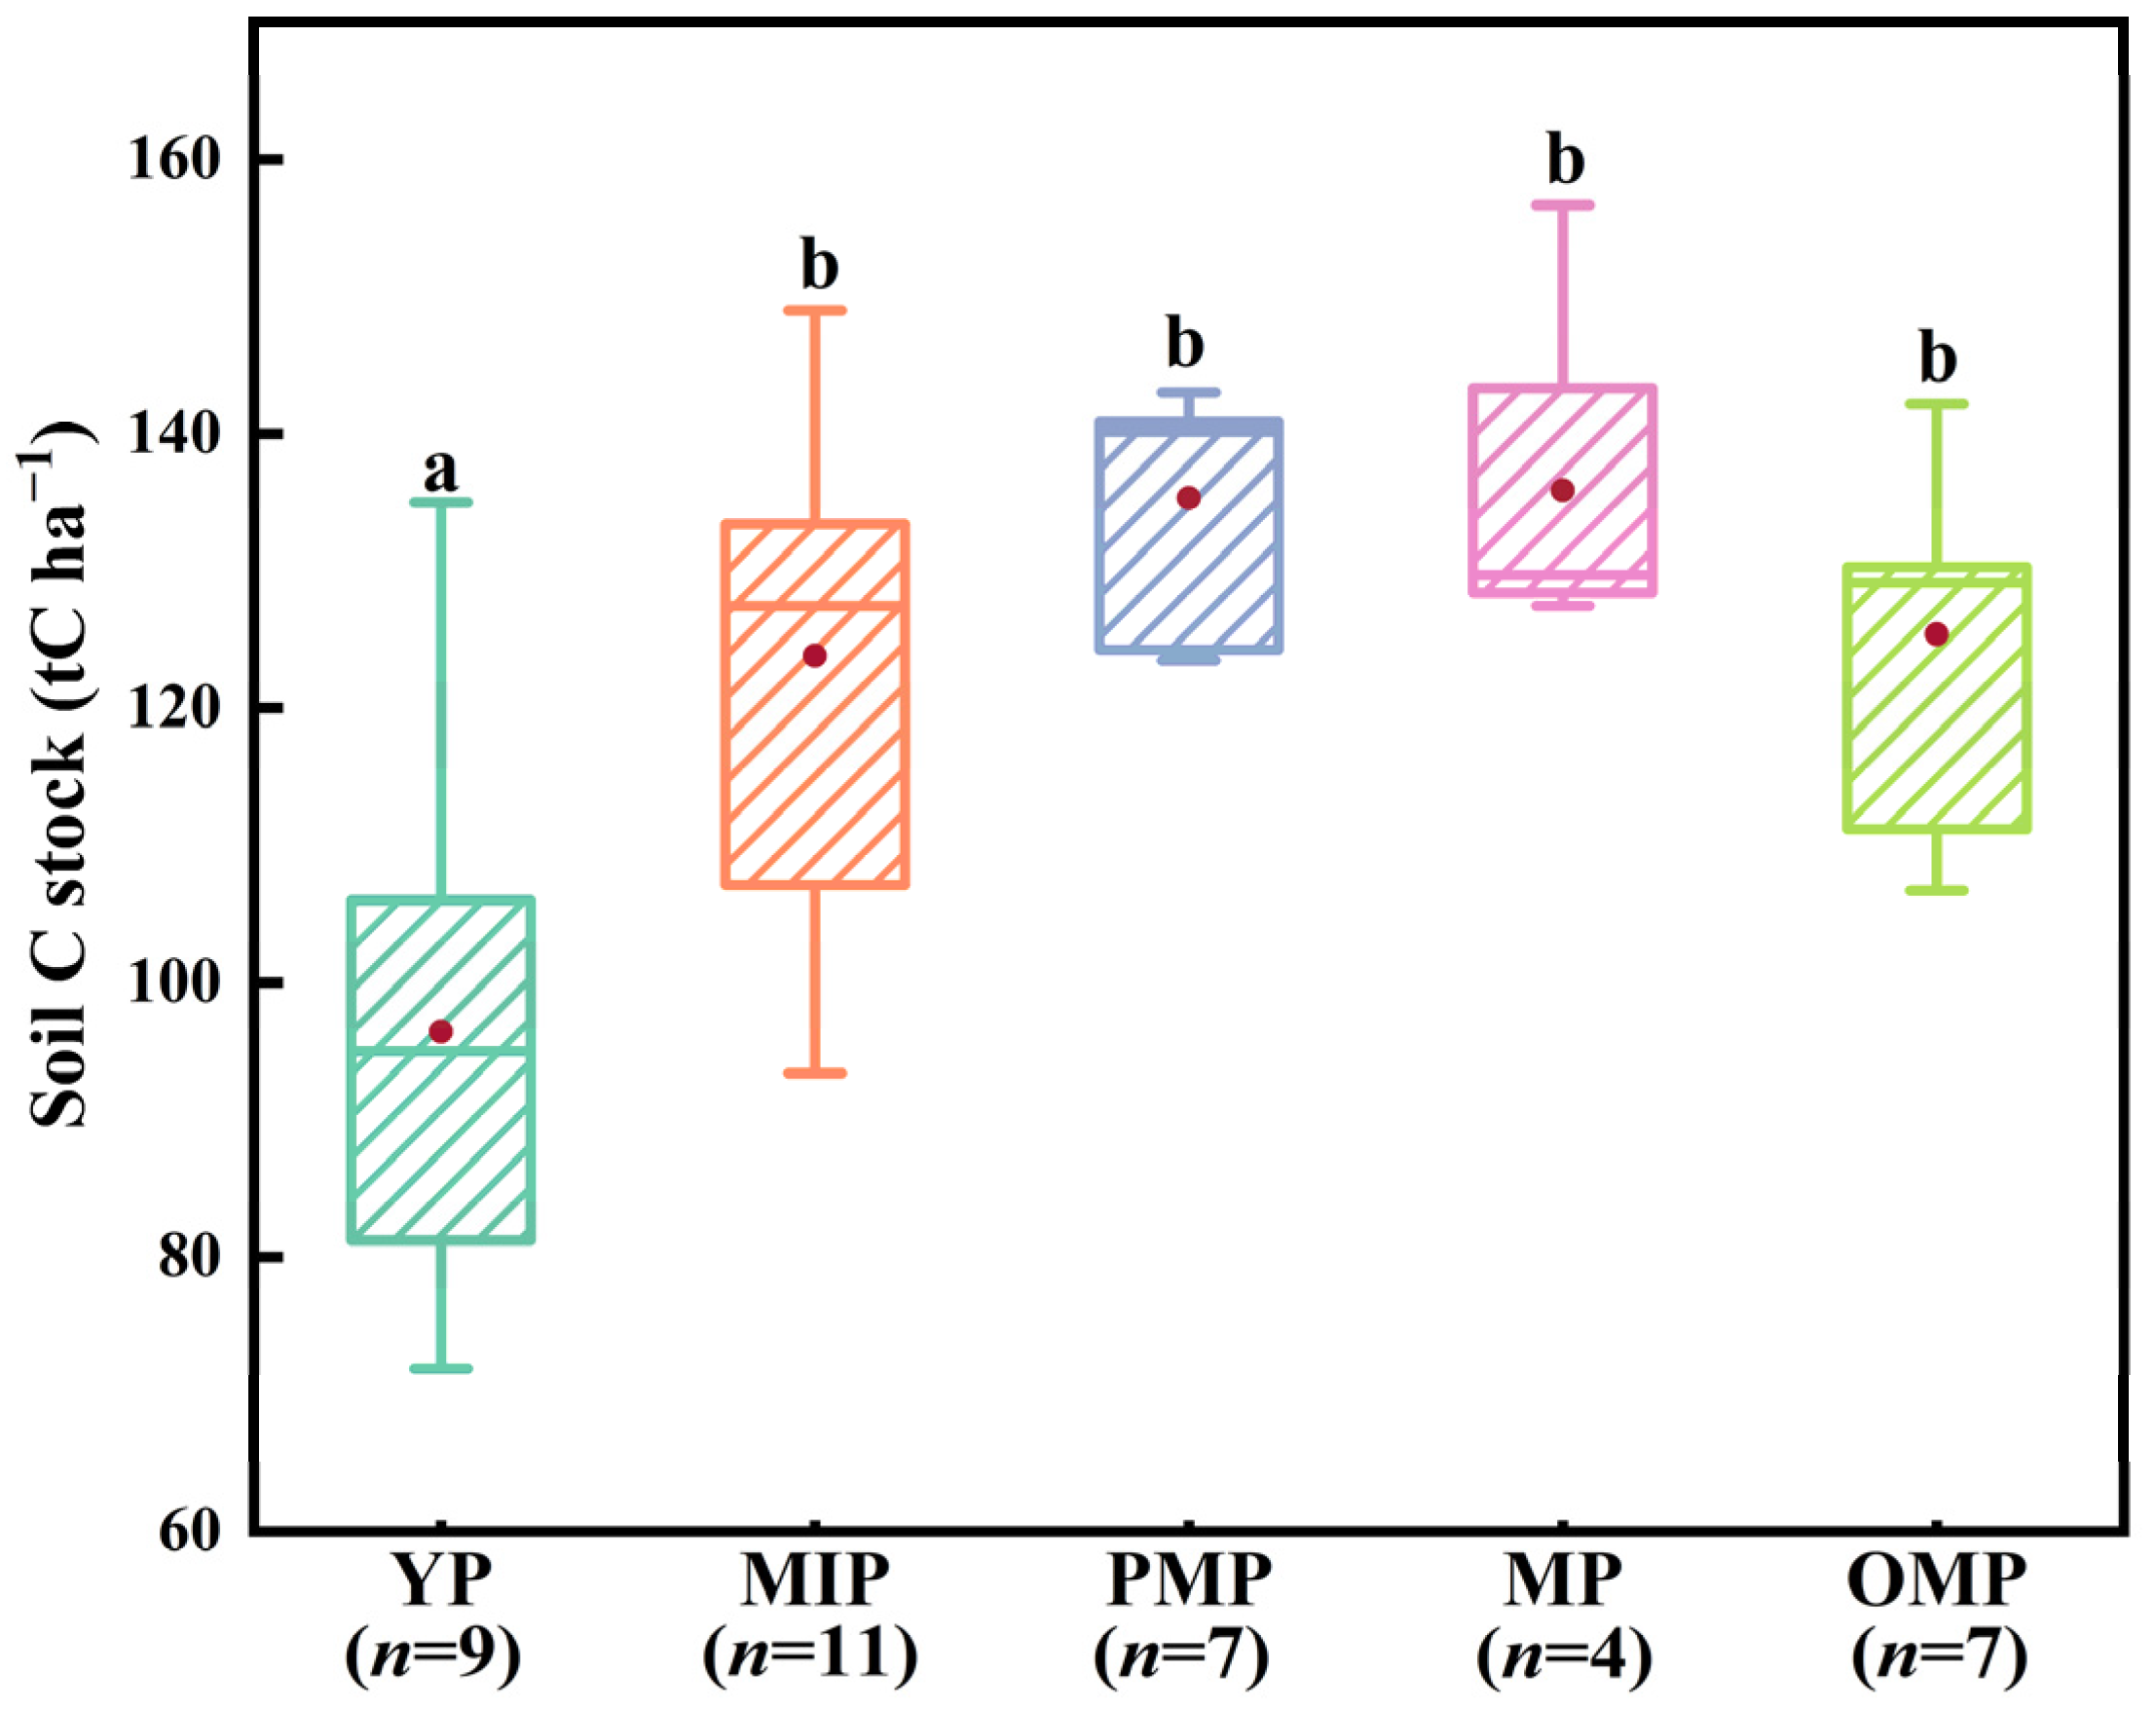
Soil carbon stocks exhibited a distinct age-dependent shift, characterized by two significantly different statistical groups (Figure 5). Initial stocks in the YP stage (96.42 ± 20.00 tC ha−1) were significantly lower than those in all subsequent stand age classes (p < 0.05). Following the YP stage, soil carbon stocks increased and e, with values ranging from 123.85 ± 17.25 to 135.89 ± 13.90 tC ha−1. This pattern reflects a rapid early-stage carbon accumulation in the soil followed by high stability as the rubber plantation matures.
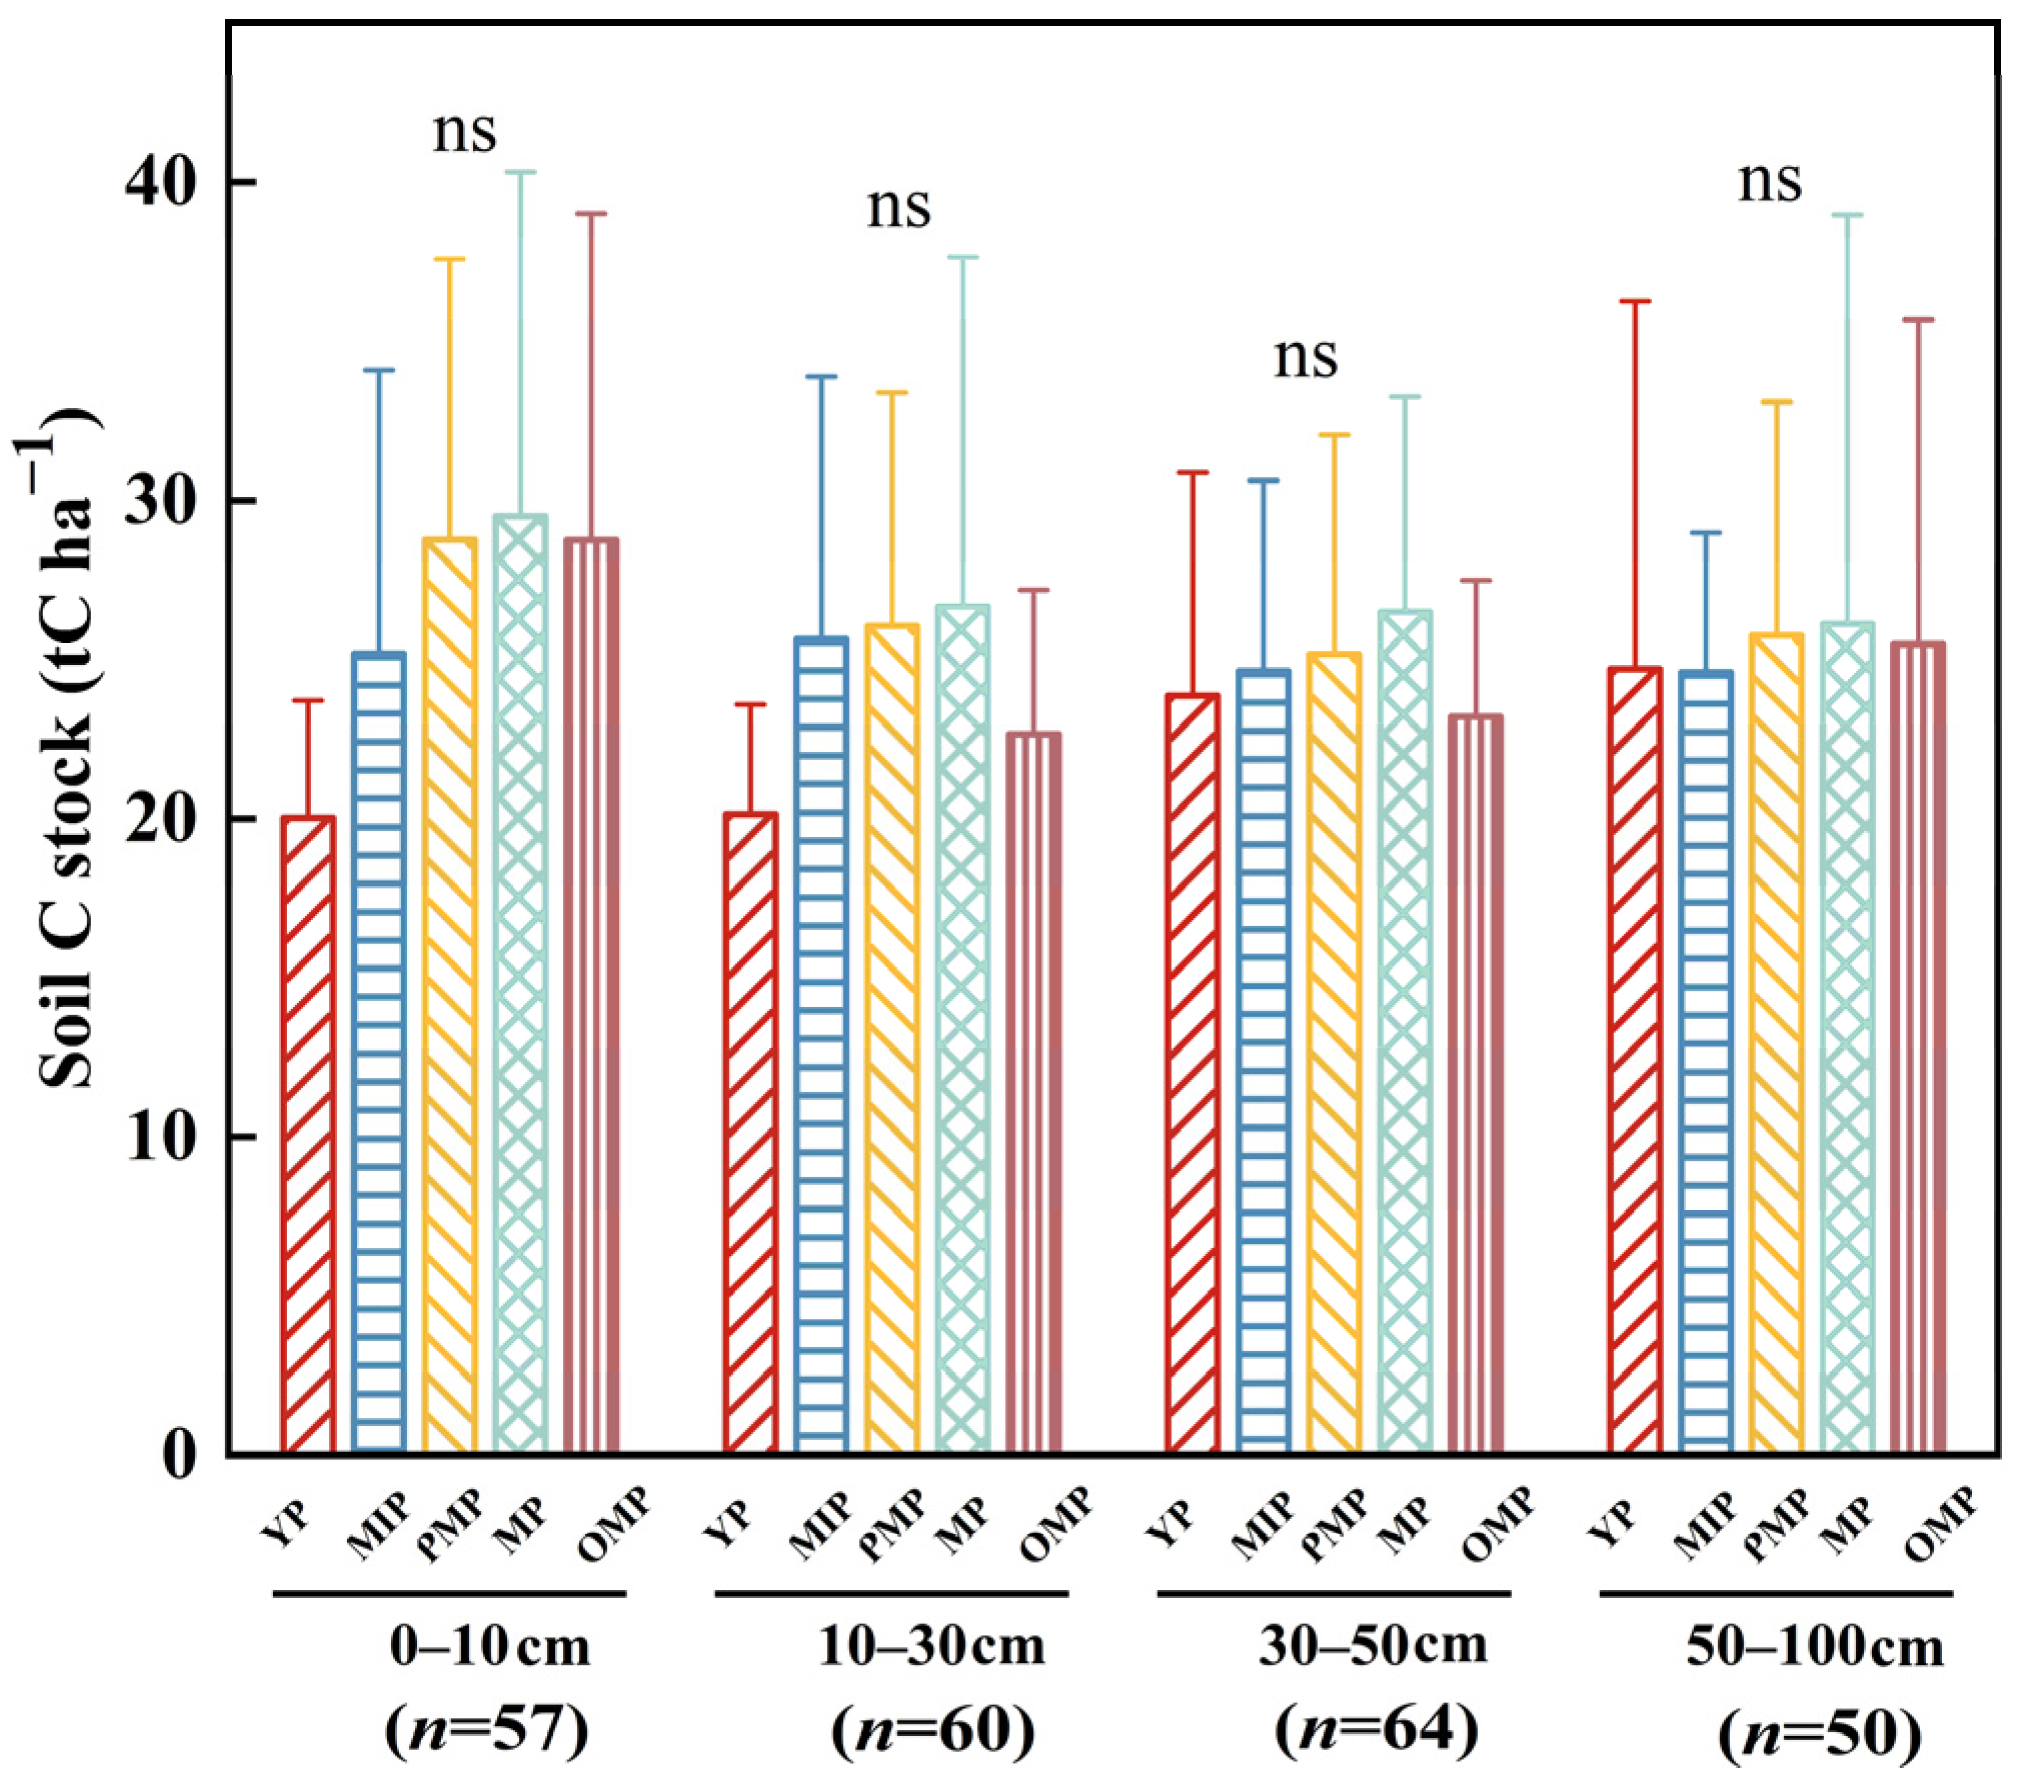
To assess soil carbon stock capacity and its vertical distribution, the soil profile was partitioned into four depth intervals: surface (0–10 cm), shallow (10–30 cm), middle (30–50 cm), and deep (50–100 cm). Based on the summarized mean values (Figure 6), the vertical distribution in the young plantation (YP) stage showed that the surface layer recorded the lowest numerical value (20.03 ± 3.67 tC ha−1), while the deep layer recorded the highest (24.71 ± 11.52 tC ha−1). As stand age progressed, mean carbon stocks exhibited minor numerical fluctuations across all soil layers.
Examining the mean values across the chronosequence within each depth interval, the 0–10 cm layer reached its numerically highest levels during the PMP (28.76 ± 8.81 tC ha−1) and MP (29.49 ± 10.83 tC ha−1) stages, with the OMP stage maintaining a comparable baseline (28.74 ± 10.26 tC ha−1). The YP (20.03 ± 3.67 tC ha−1) and MIP (25.18 ± 8.80 tC ha−1) stages recorded lower mean values. A similar pattern of numerical variation was observed in the 10–30 cm, 30–50 cm, and 50–100 cm layers, where mean carbon stocks fluctuated from YP to MP, followed by a relatively stable status in the OMP stage. However, one-way analysis of variance (ANOVA) revealed no statistically significant differences (p > 0.05) among the different stand ages within any specific depth interval, indicating that the soil serves as a stable carbon pool throughout the development of rubber plantations.

3.1.4. Carbon Stocks Across Stand Age Classes in Rubber Plantation Ecosystems

Carbon stocks across three major pools in rubber plantation ecosystems (Table 2) demonstrated a pronounced stand age-mediated accumulation effect in total ecosystem carbon stocks. Total carbon stocks in rubber plantation ecosystems increased from 113.41.53 ± 21.63 tC ha−1 in YP to 252.64 ± 24.61 tC ha−1 in OMP. During the YP to MIP transition, 52% of the total stock increment came from the soil carbon pool, whereas after the MIP, 98% of subsequent increments originated from the plant carbon pool. This shift reflected a transition in carbon accumulation from early soil-dependence to late-stage biomass dominance.
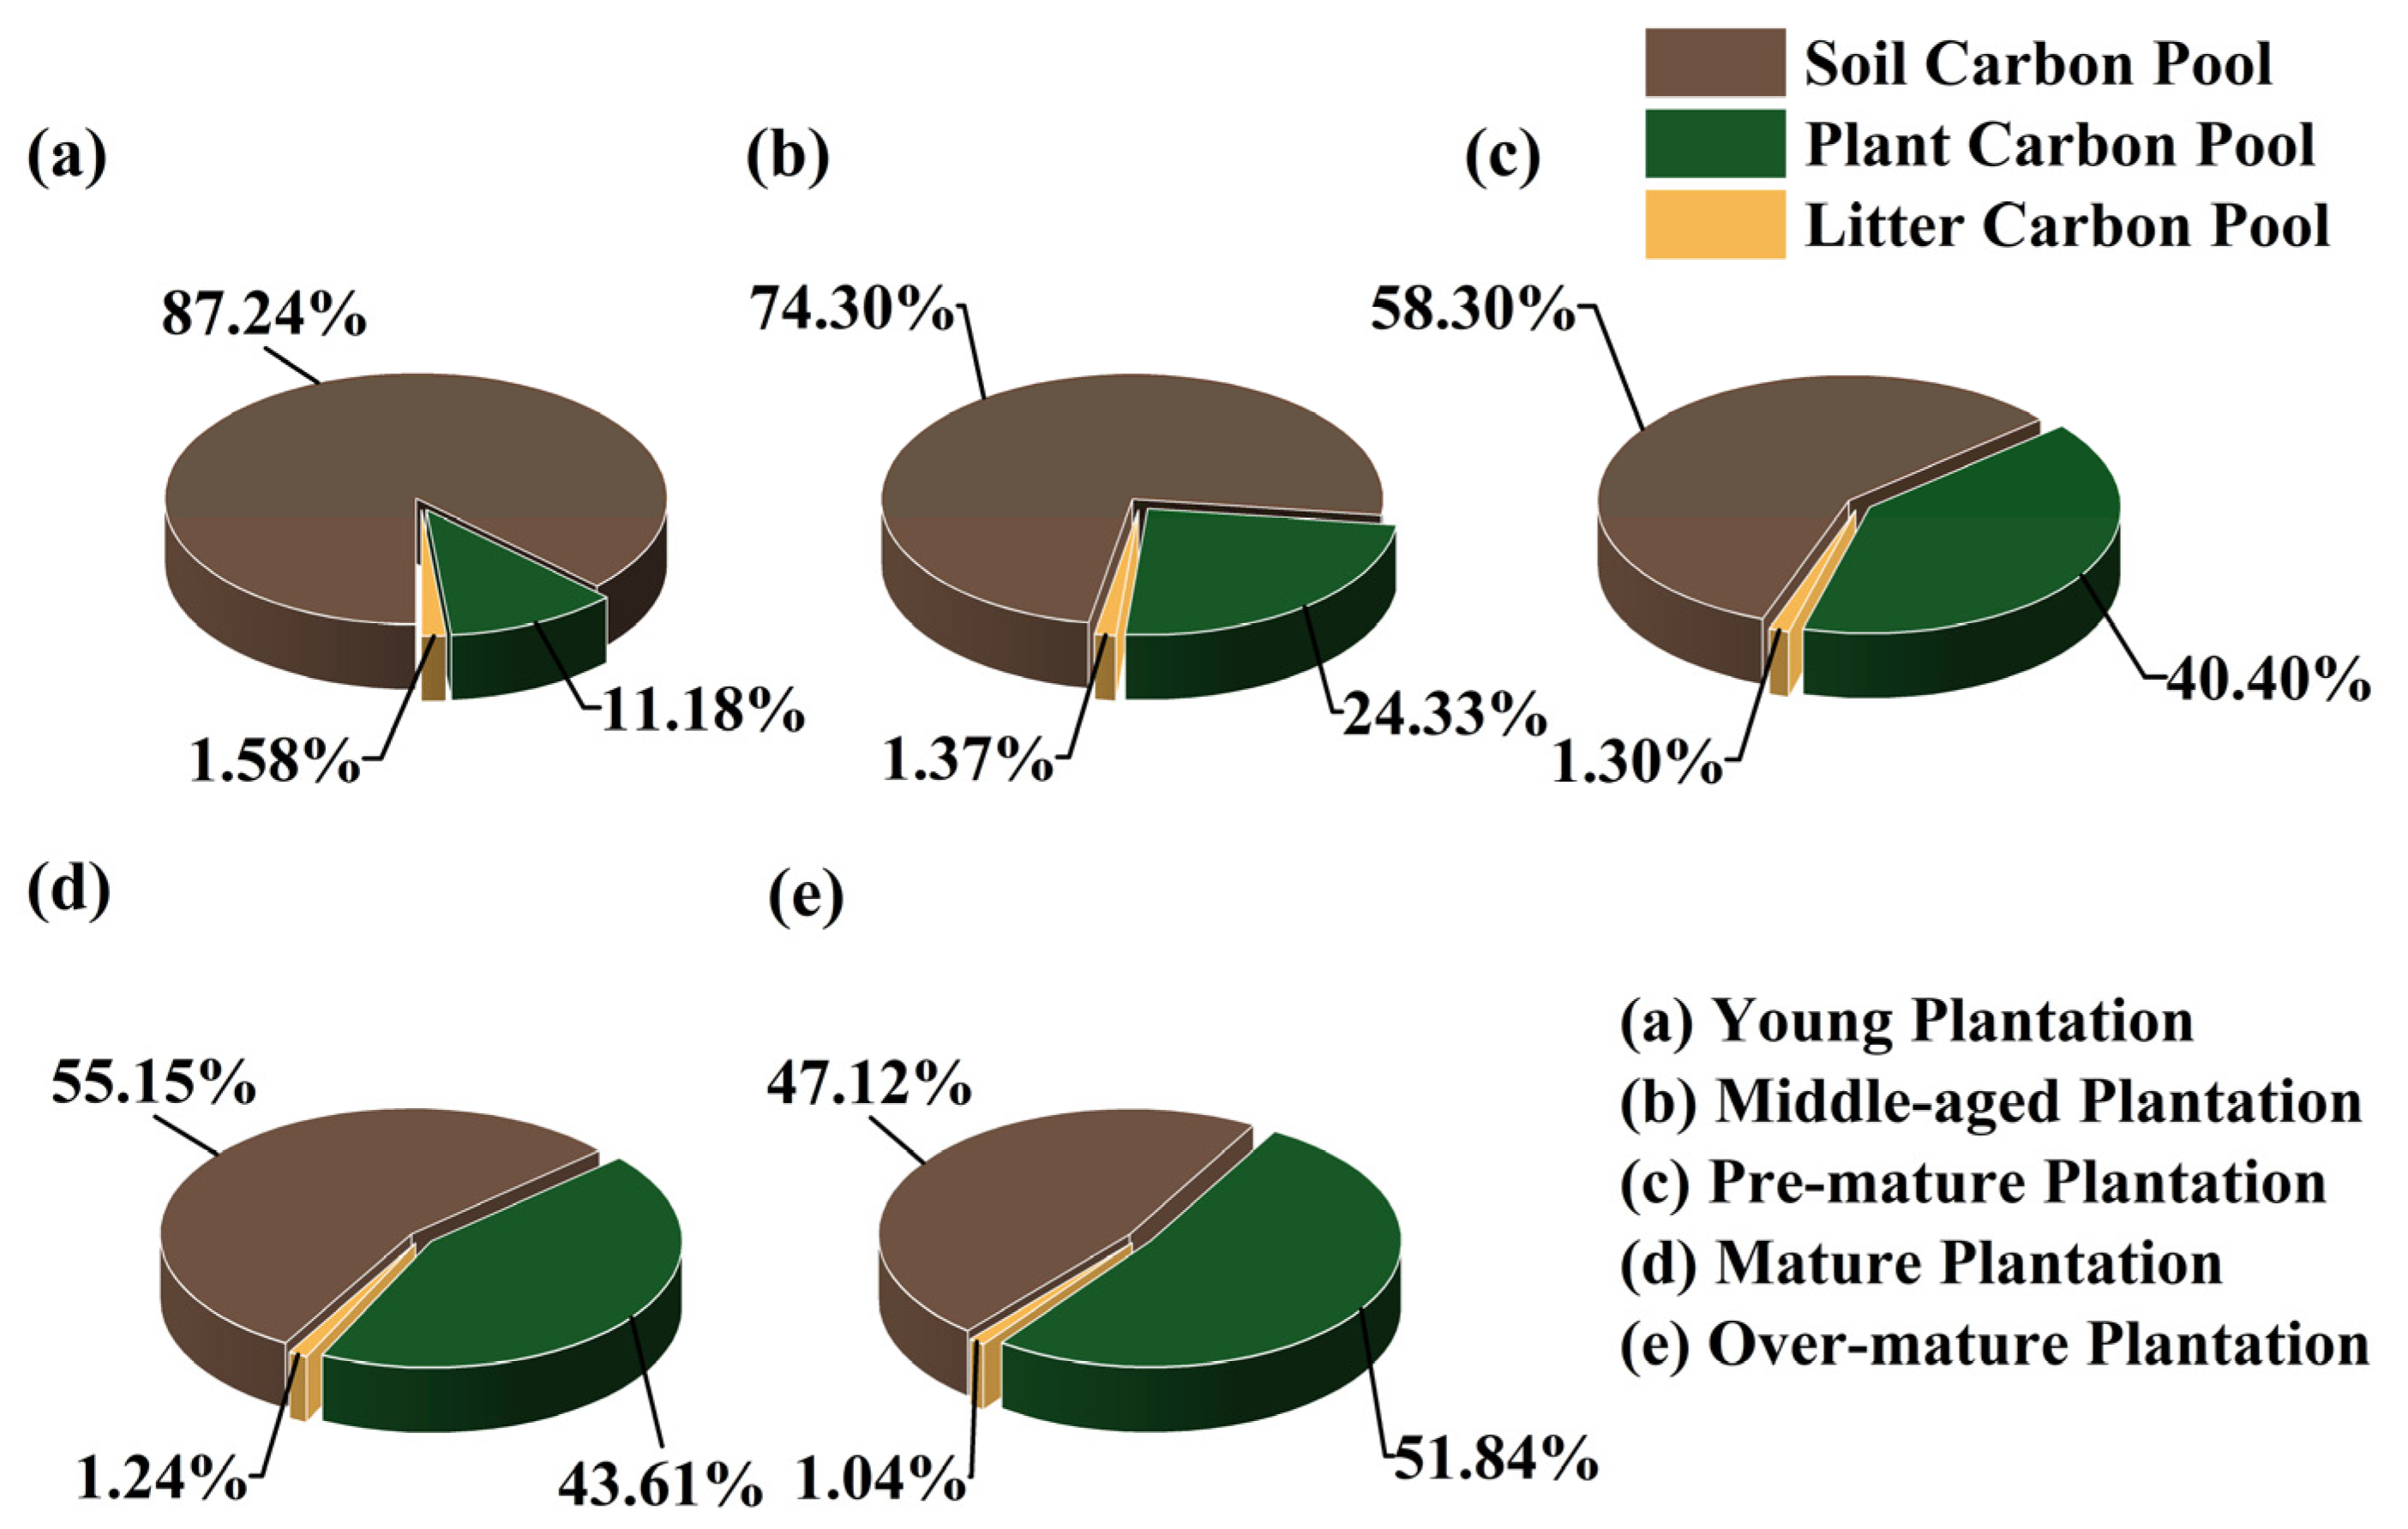
Analysis of the three major carbon pools in rubber plantation ecosystems across stand ages (Figure 7) reveals that the soil carbon pool constituted the largest share of the ecosystem carbon stock. The soil carbon proportion in YP (Figure 7a) is the highest (87.2%) and progressively declines with stand maturation. Conversely, the plant carbon pool increased from approximately 11% to over 40%, approaching parity with the soil pool in OMP (Figure 7d). The litter carbon pool remained stable at around 1% across all stages, with minimal variation. Collectively, stand maturation drove a shift in the ecosystem carbon allocation pattern, from soil carbon pool dominance toward an increasing proportion of the plant carbon pool, while the litter carbon pool maintained a stable, minor contribution.

3.2. Carbon Fluxes and Their Influencing Factors in Rubber Plantation Ecosystems

3.2.1. Carbon Fluxes

Carbon fluxes in rubber plantation ecosystems serve as essential indicators of carbon cycling capacity, quantified using Net Ecosystem Exchange (NEE), Gross Primary Productivity (GPP), and Ecosystem Respiration (Reco). Integrated analysis of carbon fluxes across three major rubber cultivation zones (Table 3) revealed a high photosynthetic carbon fixation capacity (GPP: 22.99 ± 2.14 tC ha−1yr−1) and substantial carbon sink strength (NEE: −9.07 ± 1.91 tC ha−1yr−1) in rubber plantation ecosystems.
Rubber plantation ecosystems exhibited minor inter-regional variation in GPP, with Hainan, China, having the highest GPP (23.60 ± 1.13 tC ha−1yr−1), exceeding Southeast Asia (23.29 ± 2.09 tC ha−1yr−1) and Xishuangbanna, China (21.78 ± 3.22 tC ha−1yr−1) by 1.3% and 7.71% respectively. However, the high productivity of rubber plantations in Hainan coincides with higher respiratory consumption, with Reco reaching 15.28 ± 2.54 tC ha−1yr−1, higher than Southeast Asia (11.55 ± 1.49 tC ha−1yr−1) and Xishuangbanna (9.70 ± 0.80 tC ha−1yr−1). Furthermore, considerable spatial heterogeneity was observed in the carbon sink capacity of rubber plantation ecosystems. Plantations in Hainan demonstrated the strongest net carbon uptake, with NEE reaching −10.49 ± 0.93 tC ha−1yr−1, which is 10.3% higher than Southeast Asia (−9.41 ± 1.91 tC ha−1yr−1) and 33.84% higher than Xishuangbanna, China (−6.97 ± 2.93 tC ha−1yr−1).

3.2.2. The Influence of Environmental Factors and Stand Age on Carbon Fluxes

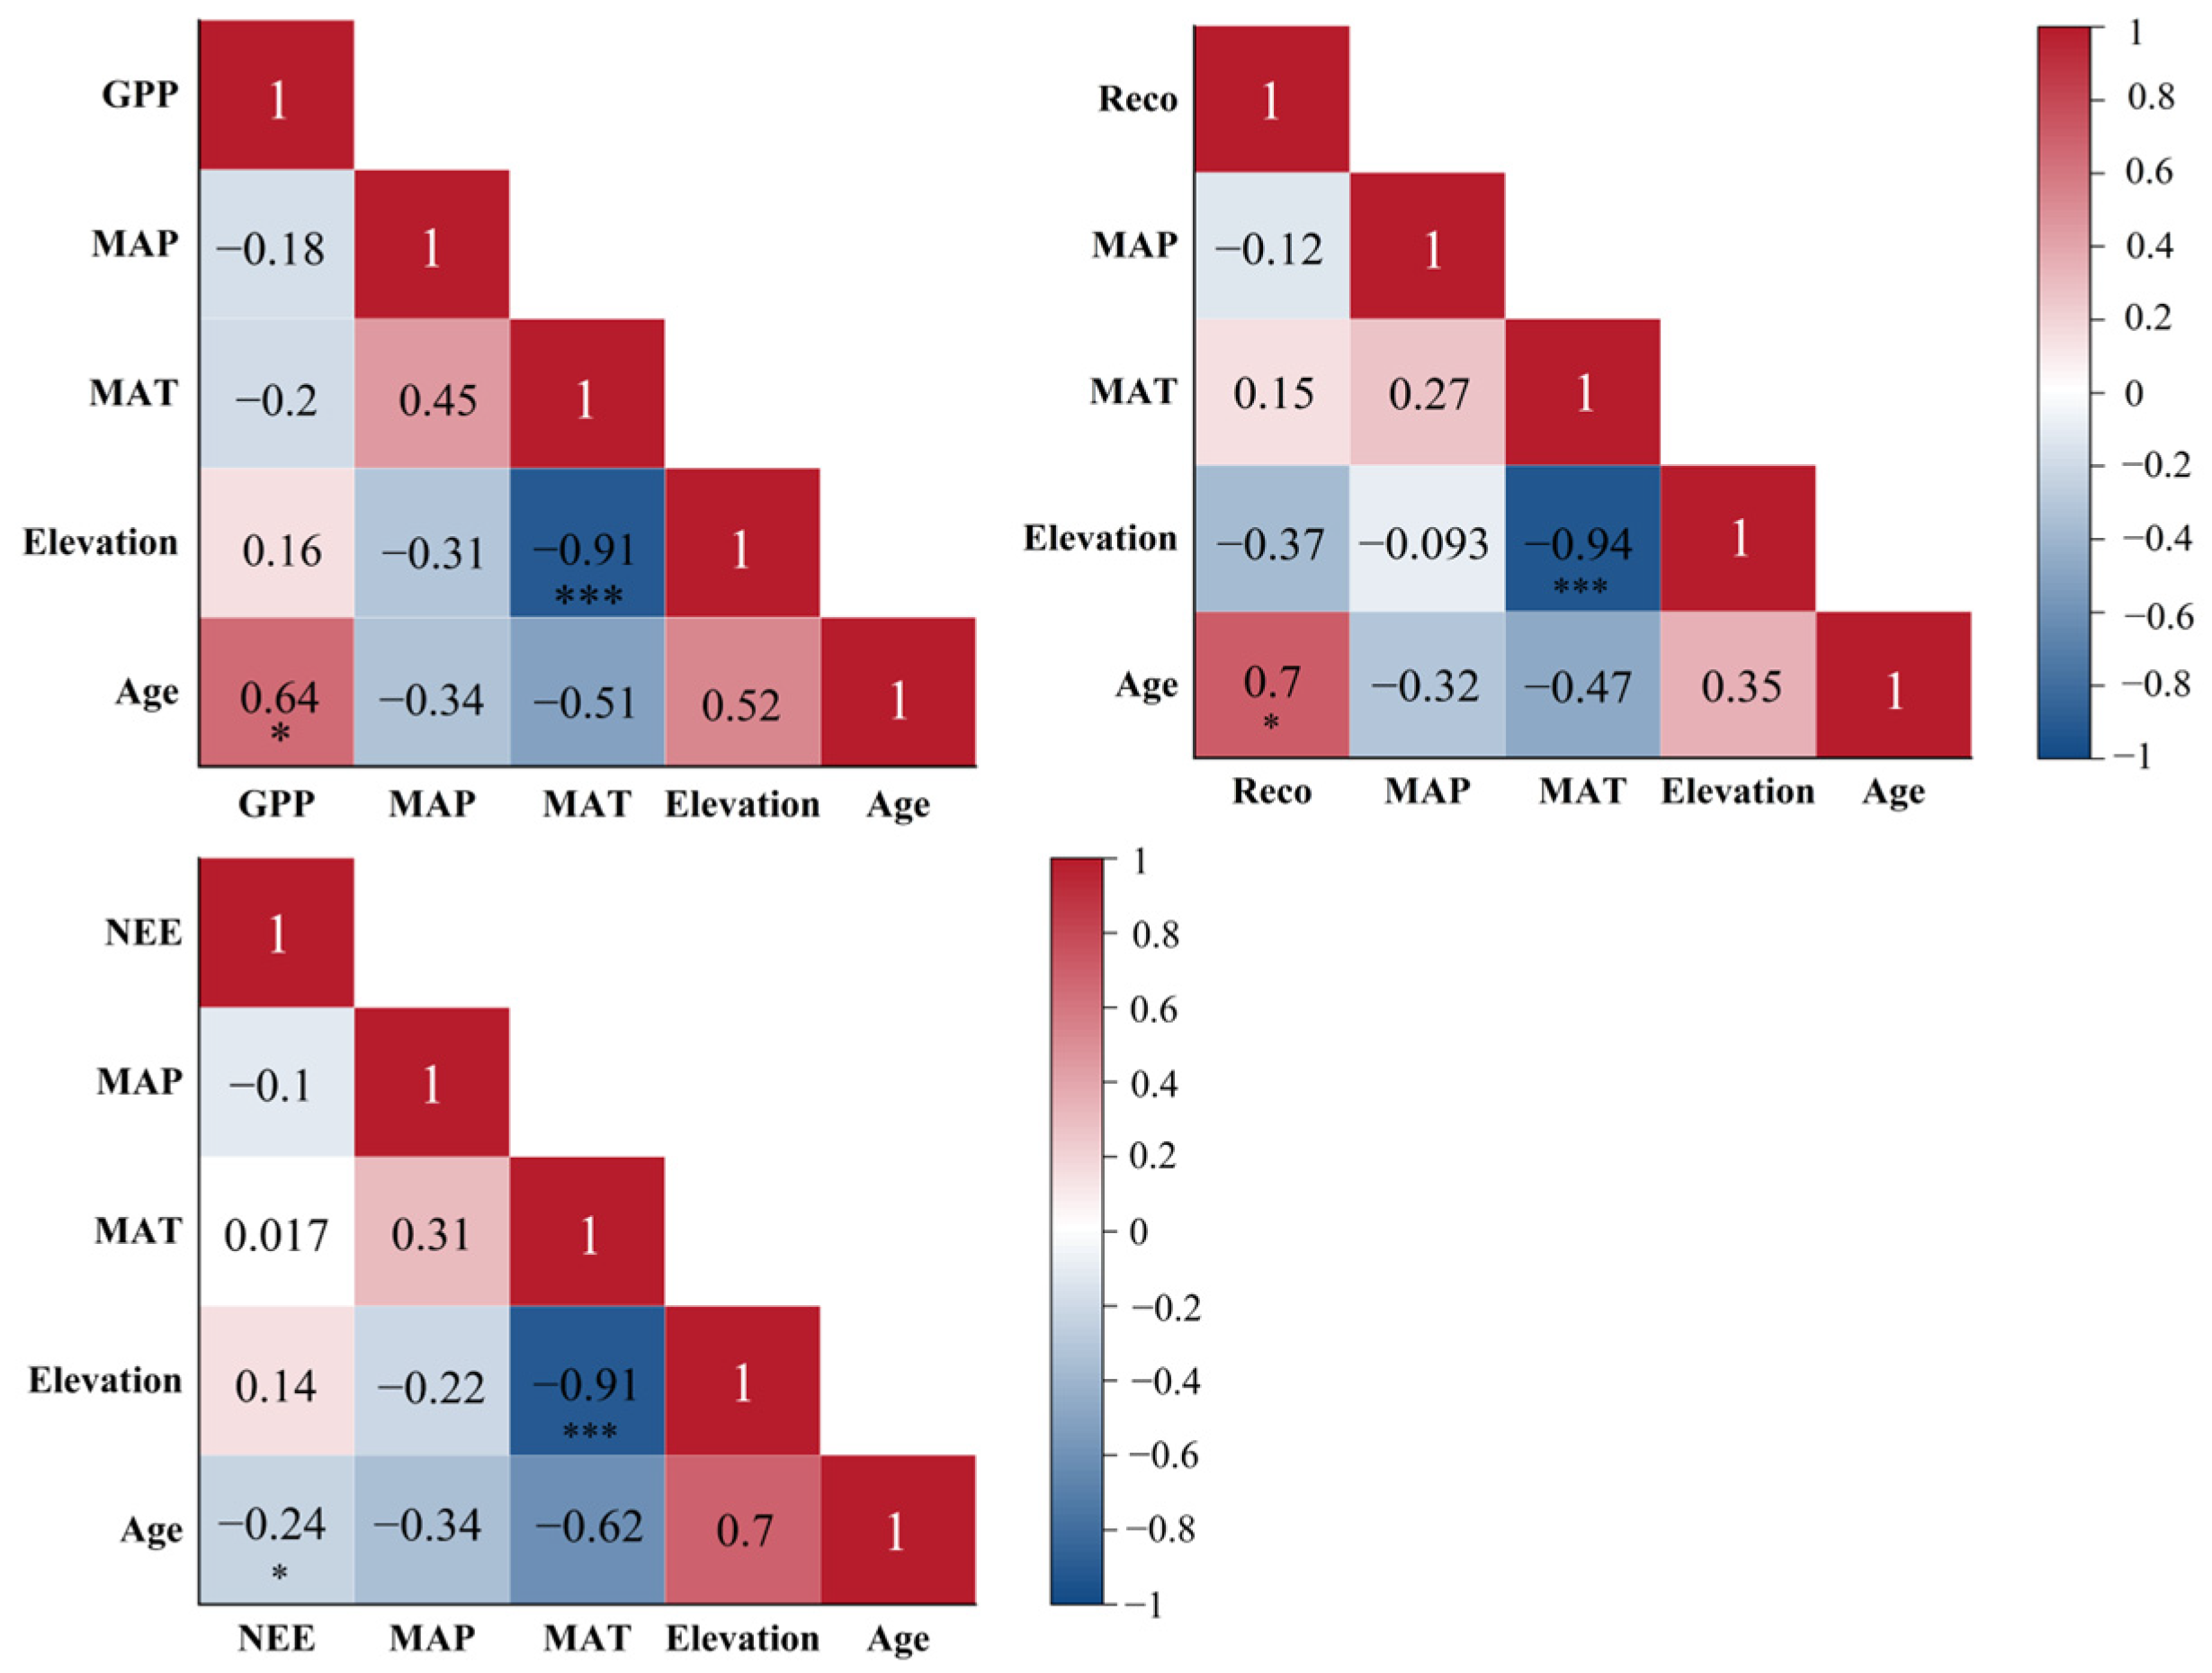
Correlation analysis of the carbon flux components (GPP, NEE, Reco) with environmental factors (MAP, MAT, elevation) and age in rubber plantation ecosystems (Figure 8) revealed that GPP was positively correlated with age (p < 0.05), but negatively correlated with MAP and MAT. Reco showed the same correlation with age as GPP, but had a negative correlation with MAT and ElevationAltitude. NEE was negatively correlated with stand age.

3.3. Carbon Budget Diagram of the Rubber Plantation

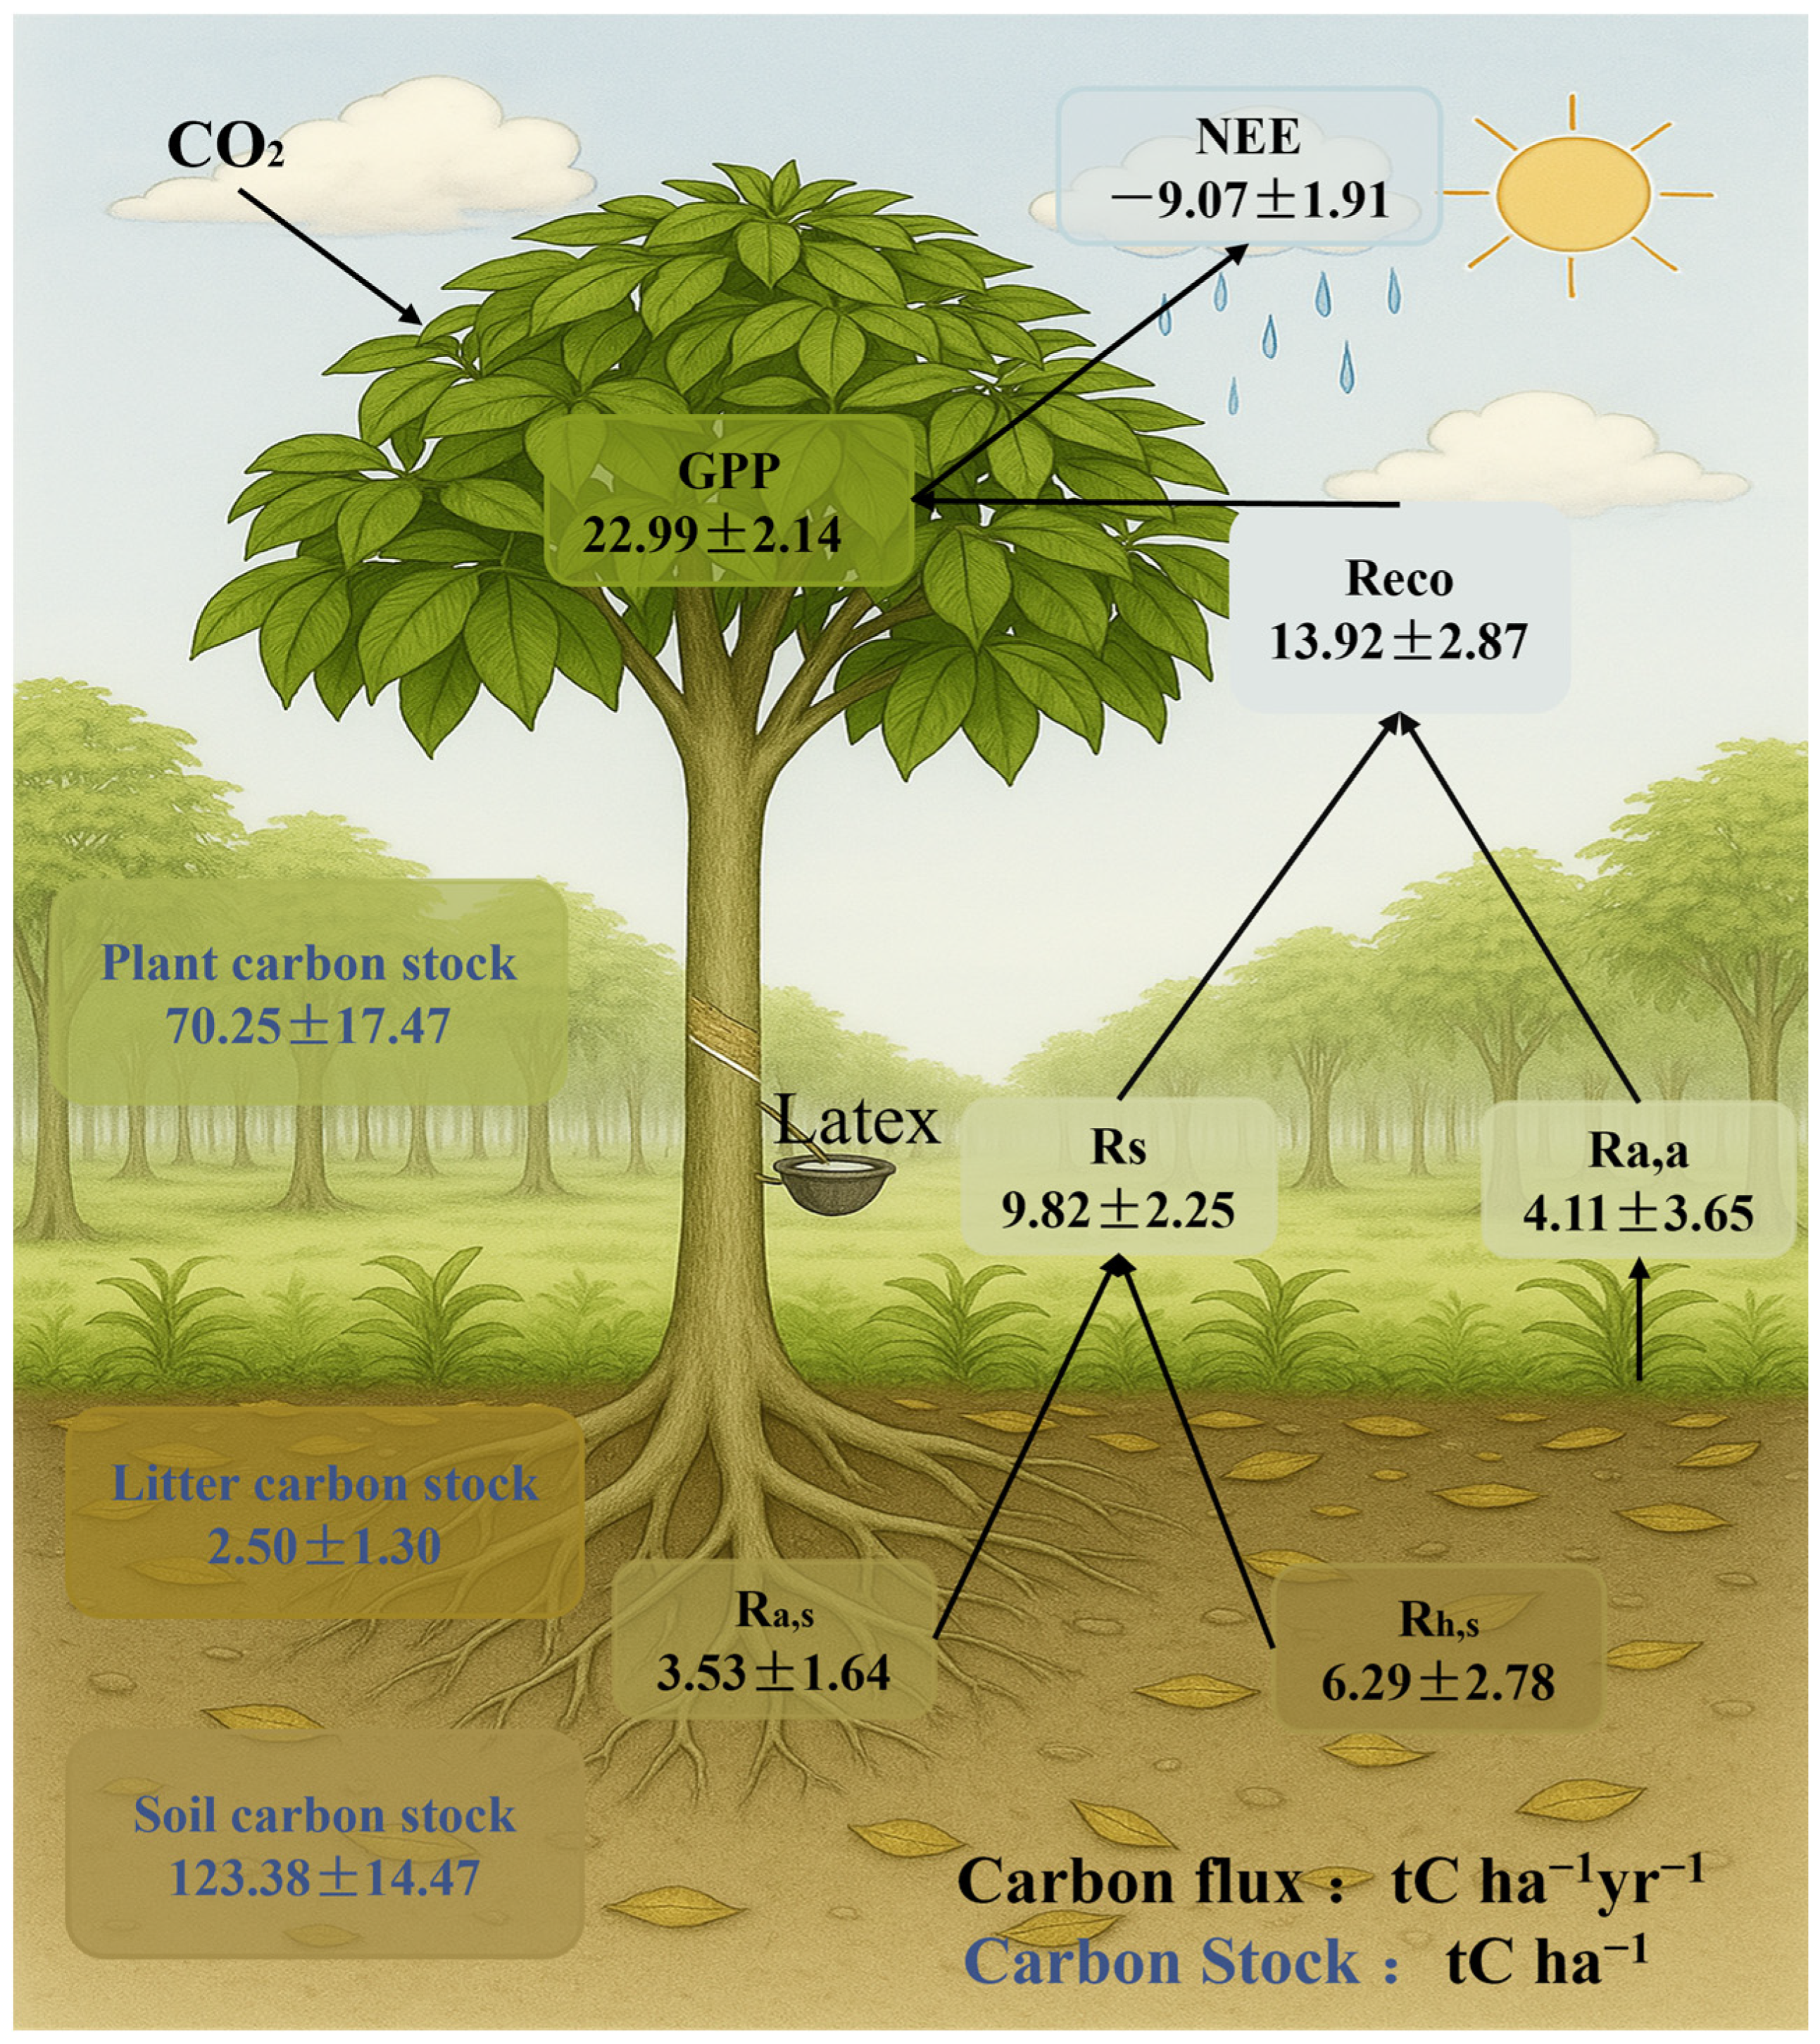
To provide a holistic perspective, we integrated the synthesized mean values of carbon stocks and fluxes detailed in the preceding sections and constructed a comprehensive carbon budget diagram for the rubber plantation ecosystem (Figure 9). The diagram starts with GPP (22.99 ± 2.14 tC ha−1yr−1) as the carbon cycle entry point, followed by respiratory dissipation through Reco (13.92 ± 2.87 tC ha−1yr−1), ultimately resulting in a net carbon sink (−9.07 ± 1.91 tC ha−1yr−1). The result indicates that the rubber plantation ecosystem functions as a carbon sink.
In RPEs, soil respiration (Rs) is the primary component of Reco, accounting for approximately 70.5% of the total carbon release. The individual respiratory fluxes were quantified as follows: aboveground autotrophic respiration (Ra,a) was 4.11 ± 3.65 tC ha−1yr−1, belowground root autotrophic respiration (Ra,s) was 3.53 ± 1.64 tC ha−1yr−1, and soil heterotrophic respiration (Rh,s) was 6.29 ± 2.78 tC ha−1yr−1.

4. Discussion

4.1. Carbon Stock Characteristics and Sustainable Management Implications in Rubber Plantation Ecosystems

Synthesized data indicate that carbon stocks in rubber plantation ecosystems range from 113.41 ± 21.63 to 252.64 ± 24.61 tC ha−1. Compared with other types of plantations, such as eucalyptus forests (65.68–109.63 tC ha−1) [17] and oil palm (58.9 tC ha−1) [36], rubber plantations exhibit numerically higher mean carbon stocks. The carbon storage capacity of rubber plantations can be further enhanced through optimized management practices, such as extending the rotation length and implementing intercropping systems [37]. Studies have shown that, compared with monoculture rubber plantation, intercropping with crops such as Flemingia macrophylla and cocoa can increase soil carbon storage by 4.33 to 54.95 tC ha−1 [38,39]. In addition to intercropping, adjusting the rotation period can also enhance the carbon stocks of rubber plantation ecosystems. Research on carbon stock dynamics under different rotation periods in Southwest China found that plantations with a 40-year rotation period had 93% greater total carbon storage than those with a 25-year rotation period and 30% greater than those with a 35-year rotation period, while maintaining high latex yields [40].
Plant carbon stocks in rubber plantation ecosystems show dynamic changes characterized by a clear stand-age gradient effect. Our synthesis shows that stocks increase progressively with stand maturation, consistent with findings that carbon continuously accumulates throughout the growth of rubber plantations. This suggests that rubber plantation continuously accumulates carbon as they age, steadily absorbing and sequestering carbon throughout growth [17,41,42]. Plant carbon stocks in rubber plantations of identical stand age show numerical variations across elevational gradients. Literature suggests this elevational differentiation results from the combined effects of temperature, soil nutrients, and human disturbance [43]. Specifically, research indicates plant carbon stocks generally decrease with increasing elevation [44]. Corresponding management strategies can be developed and implemented based on this gradient characteristic. In low elevation zones, carbon loss can be mitigated by protecting understory vegetation and reducing herbicide use, which can otherwise result in annual soil organic carbon losses of about 0.5 tC ha−1. In high elevation zones, shallow-rooted intercropping can enhance topsoil carbon stocks [45,46]. For instance, intercropping leguminous plants can increase surface soil carbon stocks by 10.7 tC ha−1 while reducing nutrient loss from deeper layers caused by deep-rooted shrubs [47].
Our synthesis reveals that the litter carbon pool maintains a statistically stable level across all stand age classes. Despite this overall stability, the YP exhibited the lowest litter carbon stocks compared to other age classes. This pattern parallels plant carbon stock succession, indicating that canopy biomass expansion promotes litter input [48]. Furthermore, the lack of significant continuous growth in litter carbon stocks across these subsequent age classes is likely constrained by agricultural management, particularly high-intensity tapping. Chronic high-intensity tapping diverts photosynthates toward latex synthesis [49], potentially reducing leaf regeneration and litter input. Consequently, OMP management should balance economic returns with carbon sequestration trade-offs by optimizing tapping intensity to maintain carbon pool stability. Moreover, annual litterfall production in rubber plantations is lower than in neighboring tropical rainforests [50]. This disparity mainly results from simplified vegetation structure and reduced species diversity under monoculture regimes, which limit the diversity of litter inputs [49].
The soil carbon pool is the dominant reservoir in rubber plantation ecosystems [51], existing mainly as organic carbon and concentrated in surface layers (0–10 cm and 10–30 cm). This distribution pattern is closely associated with surface litter accumulation and root concentration in the 0–15 cm soil horizon [52]. Our results indicate that soil carbon pools in rubber plantations are highly stable, with minimal fluctuations across stand-age classes. Moreover, carbon stocks in deep soil are more stable than surface stocks [53]. Dynamically, the most significant carbon stock increase occurs from YP to MIP, primarily attributed to continuous decomposition of legacy litter from previous rotations and progressive accumulation from new stands [54]. The soil carbon pool subsequently enters a plateau phase and remains statistically stable through the OMP stage. This pattern of stability is consistent with late-stage dynamics in other short-rotation plantations [55,56]. The lack of further soil carbon accumulation in this phase is driven by a confluence of multiple interacting mechanisms. Specifically, ecosystem senescence initiates a cascade of effects, including reduced leaf area index, diminished litter input, and lower tree survival, thereby impairing soil water and nutrient retention [57]. Concurrently, this biological decline is compounded by the ongoing decomposition and leaching of existing carbonaceous compounds [58]. Furthermore, long-term fertilization practices, despite improving soil fertility, can alter microbial dynamics and restrict the efficient humification of litter into stable soil organic carbon [59]. Ultimately, the interplay of these biological, physical, and anthropogenic constraints restricts the continued expansion of the soil carbon pool.
Current research indicates that converting forests to rubber plantations reduces soil carbon stocks by 41%–62%, with the most substantial loss occurring in the first 10 years following the conversion to rubber plantations [54], particularly in surface soils [60]. For long-term croplands converted to rubber plantations, soil carbon declines at an average rate of 0.74 ± 0.2 tC ha−1 yr−1 [61]. Beyond land-use change, soil texture strongly influences carbon loss dynamics. Specifically, clay-rich soils mitigate carbon depletion following forest-to-rubber conversion, whereas sandy soils accelerate organic matter decomposition and carbon loss due to diminished stabilization capacity [51]. Soil carbon dynamics in rubber plantations are largely driven by reduced organic inputs and physical disturbance. However, optimized management practices, including increasing plant residue inputs, implementing strategic intercropping, and applying precision fertilization, can slow carbon loss, enhance soil carbon stability, and mitigate soil degradation [26,62].

4.2. Carbon Fluxes and Their Influencing Factors

Our study synthesizes multi-regional carbon fluxes observations’ results, and confirms that rubber plantations function as carbon sinks. The mean carbon sink strength of RPEs is numerically higher than values reported for tropical deciduous forests (−5.24 ± 0.40 tC ha−1yr−1) [63], mangroves (−3.87 tC ha−1yr−1) [64], and rainforests (−1.6 tC ha−1yr−1) [65]. The average carbon sequestration capacity of China’s rubber plantations is numerically lower than that of Southeast Asia. This regional difference is likely driven by the fact that Xishuangbanna, one of China’s key production areas, is situated at the northern climatic margin for rubber cultivation, resulting in lower carbon flux compared to other growing regions [66]. The consequently lower carbon sequestration efficiency in this region contributes to the numerically lower average for China.
Various factors exert distinct regulatory effects on carbon fluxes. NEE and Reco exhibit divergent responses to stand age: NEE decreases with stand maturation, whereas Reco increases. Moreover, literature suggests that the relationship between stand age and carbon sink capacity is not strictly linear [67]. Carbon sequestration strength increases progressively from young to mature plantations. However, this trend reverses in over-mature stands, likely due to senescence-induced reductions in physiological and ecological activity, which diminish carbon uptake efficiency [68,69]. Elevation influences rubber plantation ecosystems through climatic mediation. Research [70] has indicated that, at equivalent stand ages, carbon sink capacity in high-elevation areas is lower than that in low-elevation regions. In addition, the relationship between the environmental variables (MAT and MAP) and carbon fluxes was not significantly correlated. This results from temporal averaging effects in annual-scale climate analyses, which dampen seasonal fluctuations in temperature and precipitation, obscuring their relationships with carbon fluxes. In contrast, studies based on monthly-scale observations have demonstrated a clearer influence of climatic factors on carbon fluxes [24,71].
The carbon sequestration capacity of rubber plantation ecosystems is jointly regulated by climatic conditions and physiological-ecological processes. Temperature directly affects photosynthetic and respiratory rates by modulating enzymatic activity. Extreme heat events inhibit Rubisco activity in the Calvin cycle [72], thereby reducing CO2 fixation by vegetation. Studies have shown that during periods of elevated temperature, GPP in rubber plantation ecosystems can decrease by 5%–40% [25]. Photosynthetically active radiation (PAR) contributes 58%–72% directly to GPP, serving as the primary limiting factor for carbon uptake, and indirectly influences respiration by affecting temperature and vapor pressure deficit [73]. Consequently, optimizing PAR penetration is essential for enhancing light-use efficiency in plantation management. Research suggests that an optimal rubber planting density of 6–7 m (row spacing) × 3 m (plant spacing) reduces upper-canopy shading and improves light utilization efficiency [74]. Leaf Area Index (LAI) is positively correlated with the carbon sequestration capacity of rubber plantations, explaining the dominant role of biomass growth in carbon sinks. As LAI increases, NEE shows a declining trend [16], indicating that leaf growth enhances carbon sequestration capacity. Water conditions (humidity, vapor pressure deficit, soil moisture) are also important factors affecting rubber plantation ecosystems. Under suitable water conditions, an adequate water supply promotes stomatal opening, enhances photosynthetic enzyme activity, and thus increases GPP. However, under drought and water-deficient conditions, stomata close to prevent excessive water loss through transpiration, which limits the photosynthetic carbon fixation process, resulting in a decrease in NEE of up to 40% under drought conditions as reported in some studies [25,73].
The combined influence of climatic conditions and ecophysiological processes on carbon sequestration capacity drives distinct diurnal and seasonal variations in carbon exchange within rubber plantation ecosystems. On a diurnal scale, NEE follows a characteristic U-shaped pattern. During the daytime, rising temperature and solar radiation enhance photosynthetic activity, leading to net carbon uptake, whereas at night carbon emissions prevail because suppressed photosynthesis, combined with lower temperatures and minimal radiation, results in respiration exceeding photosynthesis [24,71]. On a seasonal scale, carbon uptake capacity is significantly higher in wet seasons than in dry seasons [58,65]. Peak physiological activity occurs around August when abundant heat and humidity maximize GPP, NEE, and Reco, resulting in net carbon uptake. Conversely, from December to February, leaf flushing combined with temperature and moisture limitations shifts the system to net carbon emissions [75].
It should be noted that due to variations in data completeness among primary studies, this work is a systematic literature synthesis based on comparisons of mean values rather than a formal meta-analysis. Therefore, the reported regional and temporal patterns of carbon stocks and fluxes should be understood within these methodological limitations.

5. Conclusions and Prospects

This study synthesizes published literature to consolidate carbon stocks and fluxes in rubber plantation ecosystems and analyzes patterns of carbon stocks and fluxes dynamics across stand ages, elevations, and cultivation regions. We examine the impacts of stand age, elevation, and climatic factors (MAT and MAP) on carbon exchange and draw the following main conclusions:
(1) Carbon stocks in rubber plantation ecosystems show a pronounced numerical increase with stand maturation, particularly during the Mid-aged plantation and Pre-mature plantation stages. Among the three major carbon pools, plant carbon stocks dominate the overall increase, while soil and litter carbon stocks are relatively stable. (2) Rubber plantation ecosystems exhibit robust carbon sequestration capabilities during the rotation phase, though numerical regional divergence exists in carbon sink strength. (3) Rubber plantations ecosystems act as net carbon sinks, with photosynthetic uptake exceeding respiratory losses, showing their significant potential to contribute to regional and global carbon neutrality goals.
Nevertheless, it must be explicitly acknowledged that due to the lack of complete and consistent variance data (such as sample sizes, standard errors, or standard deviations) across the collected primary literature, this study does not constitute a formal meta-analysis. This study provides a baseline by synthesizing and comparing the average results reported across various studies. Despite the limitations inherent in this mean-value approach, the integrated results successfully capture the representative characteristics of rubber ecosystems. On one hand, the specific carbon stock and flux values establish a baseline, with observations from broader literature largely falling within our synthesized ranges. Furthermore, the reported temporal patterns across stand ages align with the developmental trends documented in independent studies.
Current studies on carbon fluxes in rubber plantation ecosystems generally support the conclusion that rubber plantations function as carbon sinks. However, based on this synthesis, several research gaps are identified: Most studies have focused primarily on the carbon fluxes characteristics during the plantation phase, while overlooking the long-term impacts of land-use change. The expansion of rubber plantations often involves converting primary or secondary forests, starting with seedling establishment and cultivation—a process typically accompanied by substantial carbon losses [21]. In addition, natural rubber (latex), as a unique biogenic carbon carrier [42], has not been adequately quantified or incorporated into assessments of carbon pool composition. Furthermore, existing research on the drivers of carbon fluxes in rubber plantation ecosystems tends to emphasize linear responses to individual environmental variables, often neglecting the interactive effects among factors and the potential for nonlinear relationships.
Therefore, future research should concentrate on: (1) establish a comprehensive carbon accounting framework that incorporates the latex carbon pool; (2) examine the nonlinear responses of rubber plantation carbon fluxes to environmental factors, assess the interactive effects among key drivers, and identify threshold values for dominant environmental variables; (3) develop a full life-cycle assessment framework that accounts for the long-term impacts of land-use change on ecosystem carbon pools, thereby providing a more reliable scientific basis for sustainable rubber plantation management strategies; (4) explore resource utilization pathways for post-rotation rubber wood, including durable products (e.g., furniture) and bioenergy applications (e.g., biodiesel), to enhance life-cycle carbon benefits through value-added conversion.

Supplementary Materials

The following supporting information can be downloaded at: https://www.mdpi.com/article/10.3390/f17060653/s1, Figure S1: Specific selection process of publications for this synthesis.; Dataset S1: Carbon stocks (including references [17,36,39,40,41,42,51,54,57,60,61,76,77,78,79,80,81,82,83,84,85,86,87,88,89,90,91,92,93,94,95,96,97,98,99]); Dataset S2: Carbon fluxes (including references [21,25,65,70,71,73,74,84,92,100,101,102,103,104,105,106,107,108,109,110,111,112]). All the literature data sources involved in Dataset S1 and Dataset S2 have been fully cited and integrated into the main text reference list. Additionally, the corresponding main text reference numbers can also be directly cross-checked within Dataset S1 and Dataset S2.

Author Contributions

H.D.: Writing—original draft, Methodology, Formal analysis, Data curation. X.F.: Writing—review & editing, Supervision, Resources, Funding acquisition. Y.H.: Data curation, visualization, and review. Y.Z.: Visualization, Formal analysis. Y.S.: Data curation, visualization. P.X.: Supervision, Funding acquisition. A.Y.: Supervision, review & editing. All authors have read and agreed to the published version of the manuscript.

Funding

This study is supported by the National Natural Science Foundation of China (32160290); the Cultivation Project of Natural Science of Guizhou University, China ([2019]69); the Science and Technology Planned Project in Guizhou Province, China (Qian Kehe Support [2022] General 209); the Science and Technology Research Project of Guizhou Province, China Qian Kehe Foundation ([2020]1Y073); Open Project of Guizhou Provincial Double Carbon and Renewable Energy Technology Innovation Research Institute, China (DCRE-2023-10).

Data Availability Statement

The data presented in this study are included in the article. Further inquiries can be directed to the corresponding authors.

Acknowledgments

We would like to thank Qinghai Song for his review and guidance. We are also grateful to Xingyi Mu and Renhai Zhang for their assistance with the figures and review. During the preparation of this work, the authors used ChatGPT 5 to improve the readability of certain sentences. After using this tool, the authors reviewed and edited the content as needed and take full responsibility for the content of the published article.

Conflicts of Interest

The authors declare that they have no known competing financial interests or personal relationships that could have appeared to influence the work reported in this paper.

References

  1. Gibson, L.; Lee, T.M.; Koh, L.P.; Brook, B.; Gardner, T.A.; Barlow, J.; Peres, C.; Bradshaw, C.; Laurance, W.F.; Lovejoy, T.E.; et al. Primary forests are irreplaceable for sustaining tropical biodiversity. Nature 2011, 478, 378–381. [Google Scholar] [CrossRef]
  2. Pan, Y.; Birdsey, R.A.; Fang, J.; Houghton, R.; Kauppi, P.E.; Kurz, W.A.; Phillips, O.L.; Shvidenko, A.; Lewis, S.L.; Canadell, J.G.; et al. A Large and persistent carbon sink in the world’s forests. Science 2011, 333, 988–993. [Google Scholar] [CrossRef]
  3. Harris, N.L.; Gibbs, D.A.; Baccini, A.; Birdsey, R.A.; de Bruin, S.; Farina, M.; Fatoyinbo, L.; Hansen, M.C.; Herold, M.; Houghton, R.A.; et al. Global maps of twenty-first century forest carbon fluxes. Nat. Clim. Change 2021, 11, 234–240. [Google Scholar] [CrossRef]
  4. Litton, C.M.; Raich, J.W.; Ryan, M.G. Carbon allocation in forest ecosystems. Glob. Change Biol. 2007, 13, 2089–2109. [Google Scholar] [CrossRef]
  5. Klein, T.; Hoch, G. Tree carbon allocation dynamics determined using a carbon mass balance approach. New Phytol. 2015, 205, 147–159. [Google Scholar] [CrossRef] [PubMed]
  6. Mo, L.; Zohner, C.M.; Reich, P.B.; Liang, J.; de Miguel, S.; Nabuurs, G.-J.; Renner, S.S.; Hoogen, J.v.D.; Araza, A.; Herold, M.; et al. Integrated global assessment of the natural forest carbon potential. Nature 2023, 624, 92–101. [Google Scholar] [CrossRef]
  7. Tiko, J.M.; Ndjadi, S.S.; Obandza-Ayessa, J.L.; Mweru, J.P.M.; Michel, B.; Beeckman, H.; Rakotondrasoa, O.L.; Hulu, J.P.M.T. Carbon Sequestration Potential in Rubber Plantations: A Complementary Approach to Tropical Forest Conservation Strategies, a Review. Earth 2025, 6, 21. [Google Scholar] [CrossRef]
  8. Payn, T.; Carnus, J.-M.; Freer-Smith, P.; Kimberley, M.; Kollert, W.; Liu, S.; Orazio, C.; Rodriguez, L.; Silva, L.N.; Wingfield, M.J. Changes in planted forests and future global implications. For. Ecol. Manag. 2015, 352, 57–67. [Google Scholar] [CrossRef]
  9. Zhang, L.; Kono, Y.; Kobayashi, S.; Hu, H.; Zhou, R.; Qin, Y. The expansion of smallholder rubber farming in Xishuangbanna, China: A case study of two Dai villages. Land Use Policy 2015, 42, 628–634. [Google Scholar] [CrossRef]
  10. Zhai, J.; Liu, Y.; Xiao, C. Spatio-temporal changes and linear characteristics of rubber plantations in Xishuangbanna, southwest China from 1987 to 2018. Trop. Geogr. 2022, 42, 1376–1385. [Google Scholar] [CrossRef]
  11. Yang, X.; Blagodatsky, S.; Lippe, M.; Liu, F.; Hammond, J.; Xu, J.; Cadisch, G. Land-use change impact on time-averaged carbon balances: Rubber expansion and reforestation in a biosphere reserve, South-West China. For. Ecol. Manag. 2016, 372, 149–163. [Google Scholar] [CrossRef]
  12. Wang, Y.; Hollingsworth, P.M.; Zhai, D.; West, C.D.; Green, J.M.H.; Chen, H.; Hurni, K.; Su, Y.; Warren-Thomas, E.; Xu, J.; et al. High-resolution maps show that rubber causes substantial deforestation. Nature 2023, 623, 340–346. [Google Scholar] [CrossRef] [PubMed]
  13. Zhang, J.; Xue, D. The impacts of rubber plantation on the eco—Environment in Xishuangbanna of Yunnan Province. China Popul. Resour. Environ. 2013, 2, 304–307. [Google Scholar]
  14. Hemati, Z.; Selvalakshmi, S.; Xia, S.; Yang, X. Identification of indicators: Monitoring the impacts of rubber plantations on soil quality in Xishuangbanna, Southwest China. Ecol. Indic. 2020, 116, 106491. [Google Scholar] [CrossRef]
  15. Wang, Y.; Zhang, L. From primary forests to rubber plantations: A huge ecological loss. Innovation 2025, 6, 100836. [Google Scholar] [CrossRef]
  16. Wu, Z.X.; Tao, Z.L.; Lan, G.Y.; Wang, J.; Xie, G.; Zhou, Z. The net ecosystem carbon exchange and its environmental factors in a tropical rubber plantation ecosystem in Hainan island. Chin. J. Trop. Crops 2014, 35, 2099–2108. [Google Scholar] [CrossRef]
  17. Zhu, M.; Wang, X.; Wang, S.; Wang, W.; Zou, Y.; Liang, Q. Carbon storage and distribution of rubber and eucalyptus plantations in Danzhou, Hainan Island. Ecol. Sci. 2016, 35, 43–51. [Google Scholar] [CrossRef]
  18. Xu, R.; Xie, J.; Yan, X.S.; Zhang, Y.B.; Chen, G.Y.; Huang, J.; Zhou, H.P. Comparison on biomass and carbon storage of rubber plantation with other types of forest in Xishuangbanna. Chin. J. Trop. Crops 2021, 42, 1145–1153. [Google Scholar] [CrossRef]
  19. Qi, D.; Lang, G.; Chen, B.; Sun, R.; Xie, G.; Wu, Z. Review of ecological function of rubber plantation ecosystem. J. Biol. 2021, 38, 102–105. [Google Scholar] [CrossRef]
  20. Mesike, C.S.; O Idoko, S. An overview of Carbon sequestration potential of Rubber tree plantations. Clim. Change 2024, 10, e10cc1043. [Google Scholar] [CrossRef]
  21. Song, Q.-H.; Tan, Z.-H.; Zhang, Y.-P.; Sha, L.-Q.; Deng, X.-B.; Deng, Y.; Zhou, W.-J.; Zhao, J.-F.; Zhao, J.-B.; Zhang, X.; et al. Do the rubber plantations in tropical China act as large carbon sinks? Iforest-Biogeosci. For. 2014, 7, 42–47. [Google Scholar] [CrossRef]
  22. Liu, J.; Wu, Z.; Yang, S.; Yang, C. Sensitivity Analysis of Biome-BGC for Gross Primary Production of a Rubber Plantation Ecosystem: A Case Study of Hainan Island, China. Int. J. Environ. Res. Public Health 2022, 19, 14068. [Google Scholar] [CrossRef]
  23. Huang, C.; Zhang, C.; Li, H. Assessment of the Impact of Rubber Plantation Expansion on Regional Carbon Storage Based on Time Series Remote Sensing and the InVEST Model. Remote Sens. 2022, 14, 6234. [Google Scholar] [CrossRef]
  24. Yang, S.; Yang, C.; Gong, Y.; Zhang, J.; Song, B.; Wu, Z. Phenological characteristics of net ecosystem carbon exchange in Hainan rubber forest ecosystem. Chin. J. Trop. Crops 2022, 43, 1288–1296. [Google Scholar] [CrossRef]
  25. Yang, S.; Wu, Z.; Yang, C.; Song, B.; Liu, J.; Chen, B.; Lan, G.; Sun, R.; Zhang, J. Responses of carbon exchange characteristics to meteorological factors, phenology, and extreme events in a rubber plantation of Danzhou, Hainan: Evidence based on multi-year data. Front. Ecol. Evol. 2023, 11, 1194147. [Google Scholar] [CrossRef]
  26. Liu, Y.; Shen, J.; Zhang, C.; Chen, Z. Impact of rubber-based land use changes on soil properties and carbon pools: A meta-analysis. Catena 2023, 227, 107121. [Google Scholar] [CrossRef]
  27. Zhang, W. Economic plants of the Belt and Road; Southeast University Press: Nanjing, China, 2017. [Google Scholar]
  28. Ahrends, A.; Hollingsworth, P.M.; Ziegler, A.D.; Fox, J.M.; Chen, H.; Su, Y.; Xu, J. Current trends of rubber plantation expansion may threaten biodiversity and livelihoods. Glob. Environ. Change 2015, 34, 48–58. [Google Scholar] [CrossRef]
  29. Chen, B.; Xiao, X.; Wu, Z.; Yun, T.; Kou, W.; Ye, H.; Lin, Q.; Doughty, R.; Dong, J.; Ma, J.; et al. Identifying Establishment Year and Pre-Conversion Land Cover of Rubber Plantations on Hainan Island, China Using Landsat Data during 1987–2015. Remote Sens. 2018, 10, 1240. [Google Scholar] [CrossRef]
  30. Warren-Thomas, E.; Dolman, P.M.; Edwards, D.P. Increasing Demand for Natural Rubber Necessitates a Robust Sustainability Initiative to Mitigate Impacts on Tropical Biodiversity. Conserv. Lett. 2015, 8, 230–241. [Google Scholar] [CrossRef]
  31. Thomas, S.C.; Martin, A.R. Carbon Content of Tree Tissues: A Synthesis. Forests 2012, 3, 332–352. [Google Scholar] [CrossRef]
  32. Szatmári, G.; Pásztor, L.; Heuvelink, G.B. Estimating soil organic carbon stock change at multiple scales using machine learning and multivariate geostatistics. Geoderma 2021, 403, 115356. [Google Scholar] [CrossRef]
  33. Reichstein, M.; Falge, E.; Baldocchi, D.; Papale, D.; Aubinet, M.; Berbigier, P.; Bernhofer, C.; Buchmann, N.; Gilmanov, T.; Granier, A.; et al. On the separation of net ecosystem exchange into assimilation and ecosystem respiration: Review and improved algorithm. Glob. Change Biol. 2005, 11, 1424–1439. [Google Scholar] [CrossRef]
  34. Chapin, F.S., III; Woodwell, G.M.; Randerson, J.T.; Rastetter, E.B.; Lovett, G.M.; Baldocchi, D.D.; Clark, D.A.; Harmon, M.E.; Schimel, D.S.; Valentini, R.; et al. Reconciling Carbon-cycle Concepts, Terminology, and Methods. Ecosystems 2006, 9, 1041–1050. [Google Scholar] [CrossRef]
  35. Hanson, P.J.; Edwards, N.T.; Garten, C.T.; Andrews, J. Separating root and soil microbial contributions to soil respiration: A review of methods and observations. Biogeochemistry 2000, 48, 115–146. [Google Scholar] [CrossRef]
  36. Jong, Y.W.; Beirne, C.; Meunier, Q.; Biyogo, A.P.M.; Mbélé, A.E.; Stewart, C.G.; Poulsen, J.R. Expected carbon emissions from a rubber plantation in Central Africa. For. Ecol. Manag. 2021, 480, 118668. [Google Scholar] [CrossRef]
  37. Xu, W.; Liu, W.; Song, B.; Zhang, Y.; Tahir, A.; Cao, Y.; Kuang, C.; Guo, X.; Sun, R.; Zhang, X.; et al. Rubber-based agroforestry systems enhancing soil carbon sequestration through improved soil aggregate stability. Soil Tillage Res. 2026, 257, 106943. [Google Scholar] [CrossRef]
  38. Mo, H.; Sha, L. The carbon stock and carbon sequestration potential of rubber plantations under different agro-forestry systems in Xishuangbanna, SW China. Mt. Res. 2016, 34, 707–715. [Google Scholar] [CrossRef]
  39. Saha, K.; Kumar, K.S.A.; Nair, K.M.; Jessy, M.D.; Ghosh, S.; Lalitha, M.; Karthika, K.S.; Jayaramaiah, M.; Sujata, K.; Parvathy, S.; et al. Impact of Rubber Cultivation on Soil Quality and Carbon Stocks in Southern Peninsular India. Soil Use Manag. 2025, 41, e70110. [Google Scholar] [CrossRef]
  40. Nizami, S.M.; Zhang, Y.P.; Sha, L.Q.; Wei, Z.; Xiang, Z. Managing carbon sinks in rubber (Hevea brasilensis) plantation by changing rotation length in SW China. PLoS ONE 2014, 9, e115234. [Google Scholar] [CrossRef] [PubMed]
  41. Pang, J. Carbon Storage and Its Allocation of Rubber Plantation in Xishuangbanna, Southwest China. Master’s Thesis, Graduate University of Chinese Academy of Sciences, Beijing, China, 2009. [Google Scholar]
  42. Liu, C.; Pang, J.; Jepsen, M.R.; Lü, X.; Tang, J. Carbon stocks across a fifty year chronosequence of rubber plantations in tropical China. Forests 2017, 8, 209. [Google Scholar] [CrossRef]
  43. Poudel, A.; Sasaki, N.; Abe, I. Assessment of carbon stocks in oak forests along the altitudinal gradient: A case study in the Panchase Conservation Area in Nepal. Glob. Ecol. Conserv. 2020, 23, e01171. [Google Scholar] [CrossRef]
  44. Jia, K.; Zheng, Z.; Zhang, Y. Changes of rubber plantation aboveground biomass along elevation gradient in Xishuangbanna. China. J. Ecol. 2006, 25, 1028–1032. [Google Scholar] [CrossRef]
  45. Liu, C.-A.; Nie, Y.; Zhang, Y.-M.; Tang, J.-W.; Siddique, K.H.M. Introduction of a leguminous shrub to a rubber plantation changed the soil carbon and nitrogen fractions and ameliorated soil environments. Sci. Rep. 2018, 8, 17324. [Google Scholar] [CrossRef]
  46. Li, X.; Ou, X.; Chen, D.; Wu, J. Rubber intercropped with Coffea liberica increases carbon and nitrogen stocks in soils in Xishuangbanna, China. Forests 2025, 16, 13. [Google Scholar] [CrossRef]
  47. Ren, Y.; Lin, F.; Jiang, C.; Tang, J.; Fan, Z.; Feng, D.; Zeng, X.; Jin, Y.; Liu, C.; Olatunji, O.A. Understory vegetation management regulates soil carbon and nitrogen storage in rubber plantations. Nutr. Cycl. Agroecosyst. 2023, 127, 209–224. [Google Scholar] [CrossRef]
  48. Zhu, X.; Liu, W.; Chen, H.; Deng, Y.; Chen, C.; Zeng, H. Effects of forest transition on litterfall, standing litter and related nutrient returns: Implications for forest management in tropical China. Geoderma 2019, 333, 123–134. [Google Scholar] [CrossRef]
  49. Ma, Z.; Liu, L.; Qi, D.; Wu, Z.; Tang, M.; Yang, C.; Fu, Q.; Zhang, Y. The opportunities and challenges associated with developing rubber plantations as carbon sinks in China. J. Rubber Res. 2024, 27, 309–321. [Google Scholar] [CrossRef]
  50. Tang, J.-W.; Cao, M.; Zhang, J.-H.; Li, M.-H. Litterfall production, decomposition and nutrient use efficiency varies with tropical forest types in Xishuangbanna, SW China: A 10-year study. Plant Soil 2010, 335, 271–288. [Google Scholar] [CrossRef]
  51. Guillaume, T.; Damris, M.; Kuzyakov, Y. Losses of soil carbon by converting tropical forest to plantations: Erosion and decomposition estimated by δ(13) C. Glob. Change Biol. 2015, 21, 3193–3560. [Google Scholar] [CrossRef]
  52. Wu, Z.; Xie, G.; Tao, Z.; Zhou, Z.; Wang, X. Characteristics of soil carbon and tatal nitrogen contents of rubber plantations at different age stages in Danzhou, Hainan island. Ecol. Environ. Sci. 2009, 30, 135–141. [Google Scholar] [CrossRef]
  53. Jobbágy, E.G.; Jackson, R.B. The vertical distribution of soil organic carbon and its relation to climate and vegetation. Ecol. Appl. 2000, 10, 423–436. [Google Scholar] [CrossRef]
  54. Toriyama, J.; Imaya, A.; Hirai, K.; Lim, T.K.; Hak, M.; Kiyono, Y. Effects of forest conversion to rubber plantation and of replanting rubber trees on soil organic carbon pools in a tropical moist climate zone. Agric. Ecosyst. Environ. 2022, 323, 107699. [Google Scholar] [CrossRef]
  55. He, J.; Dai, Q.; Xu, F.; Peng, X.; Yan, Y. Variability in Carbon Stocks across a Chronosequence of Masson Pine Plantations and the Trade-Off between Plant and Soil Systems. Forests 2021, 12, 1342. [Google Scholar] [CrossRef]
  56. Sun, Y.; Zhang, Y.; Wang, L.; Zhang, X.; Jiang, Y.; Tigabu, M.; Wu, P.; Li, M.; Hu, X. From Young to Over-Mature: Long-Term Cultivation Effects on the Soil Nutrient Cycling Dynamics and Microbial Community Characteristics Across Age Chronosequence of Schima superba Plantations. Forests 2025, 16, 172. [Google Scholar] [CrossRef]
  57. Xiong, Z.; Wang, X.; Yang, H.; Weng, G.; Wu, H.; Yu, L.; Ma, Y. Analysis of carbon stock changes and carbon sequestration potential in rubber plantation. J. Trop. Subtrop. Bot. 2024, 33, 159–166. [Google Scholar] [CrossRef]
  58. Wu, Z. Carbon Balance of the Rubber Plantation Ecosystem in Hainan Island. Doctoral Dissertation, Hainan University, Haikou, China, 2013. [Google Scholar]
  59. Wu, Z.; Jin, L.; Yang, C.; Guan, L.; Lai, H.; Qi, D. Effects of different factors on leaf litter decomposition in rubber plantations in Danzhou, South China. J. Rubber Res. 2021, 24, 771–782. [Google Scholar] [CrossRef]
  60. de Blécourt, M.; Brumme, R.; Xu, J.; Corre, M.D.; Veldkamp, E. Soil carbon stocks decrease following conversion of secondary forests to rubber (Hevea brasiliensis) plantations. PLoS ONE 2013, 8, e69357. [Google Scholar] [CrossRef]
  61. Bruun, T.B.; Berry, N.; de Neergaard, A.; Xaphokahme, P.; McNicol, I.; Ryan, C.M. Long rotation swidden systems maintain higher carbon stocks than rubber plantations. Agric. Ecosyst. Environ. 2018, 256, 239–249. [Google Scholar] [CrossRef]
  62. Li, X.; Ge, T.; Chen, Z.; Wang, S.; Ou, X.; Wu, Y.; Chen, H.; Wu, J. Enhancement of soil carbon and nitrogen stocks by abiotic and microbial pathways in three rubber-based agroforestry systems in Southwest China. Land Degrad. Dev. 2020, 31, 2507–2515. [Google Scholar] [CrossRef]
  63. Rodda, S.R.; Thumaty, K.C.; Praveen, M.; Jha, C.S.; Dadhwal, V.K. Multi-year eddy covariance measurements of net ecosystem exchange in tropical dry deciduous forest of India. Agric. For. Meteorol. 2021, 301–302, 108351. [Google Scholar] [CrossRef]
  64. Sun, M.; Mo, W.H.; Xie, M.; Chen, Y.L.; Pan, L.H. Characteristics of net ecosystem carbon exchange and its influence factors over the mangrove in Guangxi. J. Ecol. Rural Environ. 2021, 37, 909–916. [Google Scholar] [CrossRef]
  65. Liu, Y.; Zheng, H.; Zhang, J.; Jiao, L.; Zhang, Y.; Chen, X.; Chen, Y.; Song, Q. Comparison of net ecosystem carbon exchange and the driving factors in the Xishuangbanna tropical rainforest and rubber plantation. Earth Environ. 2025, 53, 164–175. [Google Scholar] [CrossRef]
  66. Ya, X.; Yang, S.; Song, Q.; Sun, Z.; Zheng, H.; Yang, C.; Wu, L.; Wu, Z. Comparative Study on Carbon Sequestration Function of Rubber Forests in Hainan and Yunnan Based on Long term Positioning Observations. Southwest For. Univ. (Nat. Sci.) 2026, online ahead of print. Available online: https://link.cnki.net/urlid/53.1218.s.20260323.1142.002 (accessed on 24 May 2026).
  67. Pregitzer, K.S.; Euskirchen, E.S. Carbon cycling and storage in world forests: Biome patterns related to forest age. Glob. Change Biol. 2004, 10, 2052–2077. [Google Scholar] [CrossRef]
  68. Blagodatsky, S.; Xu, J.; Cadisch, G. Carbon balance of rubber (Hevea brasiliensis) plantations: A review of uncertainties at plot, landscape and production level. Agric. Ecosyst. Environ. 2016, 221, 8–19. [Google Scholar] [CrossRef]
  69. Shang, R.; Chen, J.M.; Xu, M.; Lin, X.; Li, P.; Yu, G.; He, N.; Xu, L.; Gong, P.; Liu, L.; et al. China’s current forest age structure will lead to weakened carbon sinks in the near future. Innovation 2023, 4, 100515. [Google Scholar] [CrossRef]
  70. Song, Q.; Zhang, Y. Biomass, carbon sequestration and its potential of rubber plantations in Xishuangbanna, Southwest China. Chin. J. Ecol. 2010, 29, 1887–1891. [Google Scholar] [CrossRef]
  71. Zheng, H.; Zhang, J.; Liu, Y.; Zhang, Y.; Palingamoorthy, G.; Deng, Y.; Zhou, W.; Sawasdchai, B.; Li, Y.; Huang, L.; et al. Flux dynamics of CO2 in a rubber plantation in Xishuangbanna and its influencing factors. Earth Environ. 2024, 52, 713–722. [Google Scholar] [CrossRef]
  72. Berry, J.; Bjorkman, O. Photosynthetic response and adaptation to temperature in higher plants. Annu. Rev. Plant Biol. 1980, 31, 491–543. [Google Scholar] [CrossRef]
  73. Wang, X.; Blanken, P.D.; Kasemsap, P.; Petchprayoon, P.; Thaler, P.; Nouvellon, Y.; Gay, F.; Chidthaisong, A.; Sanwangsri, M.; Chayawat, C.; et al. Carbon and water cycling in two rubber plantations and a natural forest in mainland southeast asia. J. Geophys. Res.-Biogeosci. 2022, 127, e2022JG006840. [Google Scholar] [CrossRef]
  74. Kumagai, T.; Mudd, R.G.; Miyazawa, Y.; Liu, W.; Giambelluca, T.W.; Kobayashi, N.; Lim, T.K.; Jomura, M.; Matsumoto, K.; Huang, M.; et al. Simulation of canopy CO2/H2O fluxes for a rubber Hevea brasiliensis) plantation in central Cambodia: The effect of the regular spacing of planted trees. Ecol. Model. 2013, 265, 124–135. [Google Scholar] [CrossRef]
  75. Lin, Y.; Zhang, Y.; Zhou, L.; Li, J.; Zhou, R.; Guan, H.; Zhang, J.; Sha, L.; Song, Q. Phenology-related water-use efficiency and its responses to site heterogeneity in rubber plantations in Southwest China. Eur. J. Agron. 2022, 137, 126519. [Google Scholar] [CrossRef]
  76. Sun, Y.; Ma, Y.; Cao, K.; Li, H.; Shen, J.; Liu, W.; Di, L.; Mei, C. Temporal Changes of Ecosystem Carbon Stocks in Rubber Plantations in Xishuangbanna, Southwest China. Pedosphere 2017, 27, 737–746. [Google Scholar] [CrossRef]
  77. Li, H.; Ma, Y.; Aide, T.M.; Liu, W. Past, present and future land-use in Xishuangbanna, China and the implications for carbon dynamics. For. Ecol. Manag. 2008, 255, 16–24. [Google Scholar] [CrossRef]
  78. Razaq, M.; Huang, Q.; Wang, F.; Liu, C.; Gnanamoorthy, P.; Liu, C.; Tang, J. Carbon stock dynamics in rubber plantations along an elevational gradient in tropical china. Forests 2024, 15, 1933. [Google Scholar] [CrossRef]
  79. de Blécourt, M.; Hänsel, V.M.; Brumme, R.; Corre, M.D.; Veldkamp, E. Soil redistribution by terracing alleviates soil organic carbon losses caused by forest conversion to rubber plantation. For. Ecol. Manag. 2014, 313, 26–33. [Google Scholar] [CrossRef]
  80. Lü, X.-T.; Yin, J.-X.; Jepsen, M.R.; Tang, J.-W. Ecosystem carbon storage and partitioning in a tropical seasonal forest in Southwestern China. For. Ecol. Manag. 2010, 260, 1798–1803. [Google Scholar] [CrossRef]
  81. Liang, Y.; Zhang, Y.; Fu, Q.; Yang, C.; Wu, Z.; Zhang, X. Effects of different management measures on soil organic carbon in rubber plantations. Southwest China J. Agric. Sci. 2025, 38, 2230–2237. [Google Scholar] [CrossRef]
  82. Guo, F. Carbon stock estimation and sequestration potential of rubber plantation ecosystems in western Hainan island. China For. Ind. 2025, 29–30. [Google Scholar]
  83. Petsri, S.; Chidthaisong, A.; Pumijumnong, N.; Wachrinrat, C. Greenhouse gas emissions and carbon stock changes in rubber tree plantations in Thailand from 1990 to 2004. J. Clean. Prod. 2013, 52, 61–70. [Google Scholar] [CrossRef]
  84. Charoenjit, K.; Zuddas, P.; Allemand, P.; Pattanakiat, S.; Pachana, K. Estimation of biomass and carbon stock in Para rubber plantations using object-based classification from Thaichote satellite data in Eastern Thailand. J. Appl. Remote Sens. 2015, 9, 096072. [Google Scholar] [CrossRef]
  85. Chiarawipa, R.; Somboonsuke, B.; Wandao, S.; Thongsong, A.; Jirakajohnkool, S. Investigating Drivers Impacting Carbon Stock and Carbon Offset in a Large-Scale Rubber Plantation in the Middle South of Thailand. Trop. Life Sci. Res. 2024, 35, 139–160. [Google Scholar] [CrossRef] [PubMed]
  86. Nath, A.J.; Brahma, B.; Sileshi, G.W.; Das, A.K. Impact of land use changes on the storage of soil organic carbon in active and recalcitrant pools in a humid tropical region of India. Sci. Total Environ. 2018, 624, 908–917. [Google Scholar] [CrossRef]
  87. Brahma, B.; Nath, A.; Das, A. Managing Rubber Plantations for Advancing Climate Change Mitigation Strategy. Curr. Sci. 2016, 110, 2015–2019. [Google Scholar] [CrossRef]
  88. Brahma, B.; Nath, A.J.; Sileshi, G.W.; Das, A.K. Estimating biomass stocks and potential loss of biomass carbon through clear-felling of rubber plantations. Biomass Bioenergy 2018, 115, 88–96. [Google Scholar] [CrossRef]
  89. Bonini, I.; Hur Marimon-Junior, B.; Matricardi, E.; Phillips, O.; Petter, F.; Oliveira, B.; Marimon, B.S. Collapse of ecosystem carbon stocks due to forest conversion to soybean plantations at the Amazon-Cerrado transition. For. Ecol. Manag. 2018, 414, 64–73. [Google Scholar] [CrossRef]
  90. Sha, L.Q. Study on Carbon Stock and Soil Carbon Emissions in Tropical Seasonal Rainforests, Rubber Plantations and Rice Paddy Ecosystems in Xishuangbanna. Doctoral Dissertation, XiShuangBanNa Tropical Botanical Garden, Chinese Academy of Sciences, Kunming, China, 2008. [Google Scholar]
  91. Wang, L.Z.; Shi, Z.T.; Liu, X.Y.; Yang, F. Distribution characteristics of soil organic carbon of rubber plantation in Xishuangbanna. Acta Agric. Zhejiangensis 2016, 28, 1200–1205. [Google Scholar]
  92. Song, Q.H. Study on Carbon and Water Fluxes in Artificial Rubber Plantations in Xishuangbanna. Doctoral Dissertation, University of Chinese Academy of Sciences, Beijing, China, 2013. [Google Scholar]
  93. Yu, L.; Lu, W.; Song, P.; Yang, Q.; Yang, H.; Liu, W.; Luan, J.; Liu, S. Carbon density and carbon sequestration potential of rubber plantations under different compound management patterns in Hainan Island. Chin. J. Ecol. 2025, 44, 1097–1103. [Google Scholar] [CrossRef]
  94. Miao, X.L.; Jiang, J.S.; Wang, C.Y.; Peng, Z.B.; Li, J.H.; Cui, Z.F. Comparison of annual returned carbon content of litters and annual carbon emission of the rubber trees of different ages. Ecol. Sci. 2012, 31, 625–630. [Google Scholar] [CrossRef]
  95. Wu, Z.X.; Xie, G.S.; Tao, Z.L.; Zhou, Z.D. Soil Organic Carbon Content and Stock Characteristics in Rubber Plantations of Different Ages. In Proceedings of the First China Natural Rubber Industry Development Conference, Xishaungbanna, China; 2008; pp. 434–446. Available online: https://d.wanfangdata.com.cn/conference/7491705 (accessed on 24 May 2026).
  96. Zheng, Z.B.; Xu, W.; Zhou, Z.D.; Yang, H. Carbon Storage and Distribution Law of the RubberForest Ecological System in Danzhou of Hainan. Trop. Agric. Eng. 2010, 34, 45–50. [Google Scholar]
  97. Guan, L.M. Soil Carbon Budgets of Rubber Plantations Ecosystems in the Western Region of Hainan. Master’s Dissertation, Hainan University, Haikou, China, 2015. [Google Scholar]
  98. Miao, X.L. Study on the Carbon Sequestration Potential of the PR107 Rubber Plantation Ecosystem in Qiongzhong Rubber Planting Area, Hainan Province. Master’s Dissertation, Hainan University, Haikou, China, 2014. [Google Scholar]
  99. Peng, Y. Researches on Carbon Sequestration Function of Plant Subsystem in Rubber (Hevea brasiliensis) Plantation Ecosystem in Western Hainan. Master’s Dissertation, Hainan University, Haikou, China, 2010. [Google Scholar]
  100. Wu, Z.; Guan, L.; Chen, B.; Yang, C.; Lan, G.; Xie, G.; Zhou, Z. Components of Soil Respiration and Its Monthly Dynamics in Rubber Plantation Ecosystems. In Proceedings of the 2013 Fourth International Conference on Digital Manufacturing & Automation, Shinan, China, 29–30 June 2013; Volume 2013, pp. 361–369. [Google Scholar] [CrossRef]
  101. Zhou, R.W.; Zhang, Y.P.; Song, Q.H.; Lin, Y.X.; Sha, L.Q.; Jin, Y.Q.; Liu, Y.T.; Fei, X.H.; Gao, J.B.; He, Y.L.; et al. Relationship between gross primary production and canopy colour indices from digital camera images in a rubber (Hevea brasiliensis) plantation, Southwest China. For. Ecol. Manag. 2019, 437, 222–231. [Google Scholar] [CrossRef]
  102. Lang, R.; Blagodatsky, S.; Xu, J.; Cadisch, G. Seasonal differences in soil respiration and methane uptake in rubber plantation and rainforest. Agric. Ecosyst. Environ. 2017, 240, 314–328. [Google Scholar] [CrossRef]
  103. Zhao, Y.-l.; Goldberg, S.D.; Xu, J.-C.; Harrison, R.D. Spatial and seasonal variation in soil respiration along a slope in a rubber plantation and a natural forest in Xishuangbanna, Southwest China. J. Mt. Sci. 2018, 15, 695–707. [Google Scholar] [CrossRef]
  104. Gao, J.B.; Zhang, Y.P.; Song, Q.H.; Lin, Y.X.; Zhou, R.W.; Dong, Y.X.; Zhou, L.G.; Li, J.; Jin, Y.Q.; Zhou, W.J.; et al. Stand age-related effects on soil respiration in rubber plantations (Hevea brasiliensis) in southwest China. Eur. J. Soil Sci. 2019, 70, 1221–1233. [Google Scholar] [CrossRef]
  105. Li, W.; Hou, M.; Liu, S.; Zhang, J.; Zou, H.; Chen, X.; Bai, R.; Lv, R.; Hou, W. Assessing Drought Impacts on Gross Primary Productivity of Rubber Plantations Using Flux Observations and Remote Sensing in China and Thailand. Forests 2024, 15, 1732. [Google Scholar] [CrossRef]
  106. Chayawat, C.; Satakhun, D.; Kasemsap, P.; Sathornkich, J.; Phattaralerphong, J. Environmental controls on net CO2 exchange over a young rubber plantation in Northeastern Thailand. ScienceAsia 2019, 45, 50–59. [Google Scholar] [CrossRef]
  107. Charoenjit, K.; Zuddas, P.; Allemand, P. Estimation of Natural Carbon Sequestration in Eastern Thailand: Preliminary Results. Procedia Earth Planet. Sci. 2013, 7, 139–142. [Google Scholar] [CrossRef]
  108. Hassler, E.; Corre, M.D.; Tjoa, A.; Damris, M.; Utami, S.R.; Veldkamp, E. Soil fertility controls soil-atmosphere carbon dioxide and methane fluxes in a tropical landscape converted from lowland forest to rubber and oil palm plantations. Biogeosciences 2015, 12, 5831–5852. [Google Scholar] [CrossRef]
  109. Wakhid, N.; Hirano, T.; Okimoto, Y.; Nurzakiah, S.; Nursyamsi, D. Soil carbon dioxide emissions from a rubber plantation on tropical peat. Sci. Total Environ. 2017, 581–582, 857–865. [Google Scholar] [CrossRef]
  110. Wu, Z.X.; Xie, G.S.; Yang, C.; Chen, B.Q.; Zhou, Z.D. Characteristics of Carbon Fluxes in a Rubber Plantation Ecosystem in Danzhou Area, Hainan Province. J. Northwest For. Univ. 2015, 30, 51–59+107. [Google Scholar] [CrossRef]
  111. Wu, Z.X.; Chen, B.Q.; Yang, C.; Xie, G.S. Study on the Carbon Sink of Rubber Plantations in Hainan Island. In Proceedings of the 2017 National Annual Conference on Tropical Crops, Guiyang, China, 12–15 November 2017; p. 2. [Google Scholar]
  112. Cheng, S.; Zhang, G.; Zhang, N.; Huang, C.; Liu, R.; He, Y.; Zhou, X. Effects of management patterns on soil respiration and its components in tropical rubber plantations. J. Beijing For. Univ. 2025, 47, 82–91. [Google Scholar] [CrossRef]
Figure 1. Region-wise count of research related to carbon stocks and fluxes in rubber plantations. Notes: Based on literature retrieved from China National Knowledge Infrastructure (CNKI) and Web of Science databases (WOS). n represents the article counts extracted from the database for the corresponding study site.
Forests 17 00653 g001
Figure 2. Plant carbon stocks of rubber plantations at different stand ages. Young plantation (YP), Mid-aged plantation (MIP), Pre-mature plantation (PMP), Mature plantation (MP), Over-mature plantation (OMP). (The plant carbon stock refers exclusively to the carbon stored in rubber trees, including the biomass carbon stock of trunks, branches, leaves, and roots. Understory vegetation is not included. The box represents the interquartile range of the data set, and the upper and lower limits of the box show the first quartile and third quartile of the data. The Middle line and red dot show the median and mean value, respectively. Whiskers represent the upper and lower range of the data. Different alphabetical letters indicate significant difference between the ecosystems at p < 0.05. n represents the number of independent data points.
Forests 17 00653 g002
Figure 3. Plant carbon stocks of rubber plantations at different stand ages under two elevational gradients (Mean ± SD). Young plantation (YP), Mid-aged plantation (MIP), Pre-mature plantation (PMP), Mature plantation (MP), Over-mature Plantation (OMP). ns indicates no significant difference within the group (p > 0.05). n represents the number of independent data points.
Forests 17 00653 g003
Figure 4. Litter carbon stocks of rubber plantations at different stand ages. Young plantation (YP), Mid-aged plantation (MIP), Pre-mature plantation (PMP), Mature plantation (MP), Over-mature Plantation (OMP). The box represents the interquartile range of the data set, and the upper and lower limits of the box show the first quartile and third quartile of the data. The Middle line and red dot show the median and mean value, respectively. Whiskers represent the upper and lower range of the data. Different alphabetical letters indicate significant difference between the ecosystems at p < 0.05. n represents the number of independent data points.
Forests 17 00653 g004
Figure 5. Soil carbon stocks of rubber plantations at different stand ages. Young plantation (YP), Mid-aged plantation (MIP), Pre-mature plantation (PMP), Mature plantation (MP), Over-mature Plantation (OMP). The box represents the interquartile range of the data set, and the upper and lower limits of the box show the first quartile and third quartile of the data. The Middle line and red dot show the median and mean value, respectively. Whiskers represent the upper and lower range of the data. Different alphabetical letters indicate significant difference between the ecosystems at p < 0.05. n represents the number of independent data points.
Forests 17 00653 g005
Figure 6. Soil carbon stocks (Mean ± SD) of rubber plantations at different soil depths and stand ages. Young plantation (YP), Mid-aged plantation (MIP), Pre-mature plantation (PMP), Mature plantation (MP), Over-mature Plantation (OMP). ns indicates no significant difference within the group (p > 0.05). n represents the number of independent data points.
Forests 17 00653 g006
Figure 7. Proportional distribution of carbon pools in rubber plantation ecosystems at different stand ages: (a) Young Plantation; (b) Middle-aged Plantation; (c) Pre-mature Plantation; (d) Mature Plantation; and (e) Over-mature Plantation.
Forests 17 00653 g007
Figure 8. Pearson correlation analysis between carbon fluxes and major influencing factors in rubber plantation ecosystems. * p < 0.05; *** p < 0.01. (The heatmap was generated using carbon flux data along with site-specific variables, including Mean Annual Temperature (MAT), Mean Annual Precipitation (MAP), Elevation, and Stand Age.
Forests 17 00653 g008
Figure 9. Carbon budget diagram of rubber plantation ecosystems (Rs represents soil respiration, Ra,s represents root respiration, both extracted from published literature). Rh,s denotes soil heterotrophic. respiration, Rh,s = Rs − Ra,s, Ra,a denotes aboveground autotrophic respiration, Ra,a = Reco − Rs).
Forests 17 00653 g009
Table 1. Classification of rubber plantation age stages based on growth characteristics and national forestry standards.
StagesCharacteristicsStand Age
Young plantation (YP)Early developmental stage before reaching rotation age1–7
Mid-aged plantation (MIP)Period of vigorous vegetative growth with rapid biomass accumulation8–15
Pre-mature plantation (PMP)Yield peaks and stabilizes as plantations approach rotation age16–25
Mature plantation (MP)Phase of maximized economic value at designated harvest age26–30
Over-mature Plantation (OMP)Significant yield decline and weakened ecological functions beyond rotation age, necessitate timely regeneration to sustain plantation productivity>30
Table 2. Carbon stocks across stand age classes and carbon pools in rubber plantation ecosystems.
Carbon PoolPlantLitterSoilTotal
Stage
YP15.28 ± 8.22
(n = 18)
1.71 ± 0.60
(n = 14)
96.42 ± 20.00
(n = 9)
113.41 ± 21.63
MIP31.64 ± 14.41
(n = 26)
2.21 ± 1.10
(n = 22)
123.85 ± 17.25
(n = 11)
157.70 ± 22.50
PMP67.42 ± 16.62
(n = 20)
2.92 ± 1.32
(n = 17)
135.33 ± 8.93
(n = 7)
205.67 ± 18.91
MP112.42 ± 26.82
(n = 12)
2.90 ± 1.80
(n = 7)
135.89 ± 13.90
(n = 4)
251.21 ± 30.26
OMP124.47 ± 21.28
(n = 9)
2.77 ± 1.70
(n = 7)
125.40 ± 12.25
(n = 7)
252.64 ± 24.61
Average70.25 ± 17.472.50 ± 1.30123.38 ± 14.47196.13 ± 23.58
Note: All values are presented as mean ± standard deviation. Units are tC ha−1. Young plantation (YP), Mid-aged plantation (MIP), Pre-mature plantation (PMP), Mature plantation (MP), Over-mature Plantation (OMP).
Table 3. Carbon fluxes (NEE, GPP, and Reco) of rubber plantations in different regions.
RegionNEEGPPReco
Literature ValuesCalculated Values
ChinaXishuangbanna−6.97 ± 2.93
(n = 4)
21.78 ± 3.22
(n = 4)
9.70 ± 0.80
(n = 2)
14.81 ± 4.35
Hainan−10.49 ± 0.93
(n = 7)
23.60 ± 1.13
(n = 2)
15.28 ± 2.54
(n = 1)
13.11 ± 1.46
Average (China)−8.73 ± 1.9322.69 ± 2.1812.49 ± 1.6713.96 ± 2.91
Southeast Asia−9.41 ± 1.91
(n = 7)
23.29 ± 2.09
(n = 4)
11.55 ± 1.49
(n = 2)
13.88 ± 2.83
Average (all region)−9.07 ± 1.9122.99 ± 2.1412.02 ± 1.5813.92 ± 2.87
Note: All values are presented as mean ± standard deviation (tC ha−1yr−1). Reco (Calculated Values) was obtained by summing GPP and NEE. Literature Values were extracted from published literature. n represents the number of independent data points.
Disclaimer/Publisher’s Note: The statements, opinions and data contained in all publications are solely those of the individual author(s) and contributor(s) and not of MDPI and/or the editor(s). MDPI and/or the editor(s) disclaim responsibility for any injury to people or property resulting from any ideas, methods, instructions or products referred to in the content.