Review

Decoding the “Green Premium”: A Systematic Review of Multidimensional Economic Value Drivers from Urban Forests and Green Spaces


School of Landscape Architecture, Nanjing Forestry University, No. 159, Longpan Road, Nanjing 210037, China
*
Author to whom correspondence should be addressed.
Forests 2026, 17(6), 650; https://doi.org/10.3390/f17060650
Submission received: 1 April 2026 / Revised: 26 May 2026 / Accepted: 26 May 2026 / Published: 28 May 2026

Abstract

This study deciphers the impacts of urban forests and green spaces (UFGSs) on housing prices through a systematic review of 180 peer-reviewed articles (440 empirical cases) to delineate how various UFGS attributes drive housing price changes, focusing on the direction, intensity, and contextual dependency of these impacts. We identified specific UFGS attributes (e.g., proximity, size, type, quality, accessibility, landscape patterns) and the methodologies assessing their price impacts, primarily hedonic pricing models. Our findings confirm a consistent, albeit highly variable, positive premium from urban forests and related green infrastructure on housing prices. Key drivers include not only proximity and size, but also crucial qualitative attributes like perceived UFGS quality (e.g., tree canopy coverage, wooded park maintenance), which often show stronger or more consistent effects than simple quantitative measures. The analysis also highlights that negative impacts can arise from poorly managed urban forests or certain disamenity-prone green typologies. Significant spatio-temporal heterogeneity is evident, with price effects varying by urban context (e.g., density, development stage) and over time. Socio-economic factors, particularly manifesting as “green gentrification”, which can exacerbate inequalities by disproportionately benefiting higher-income groups, critically moderate these relationships. Furthermore, prevalent non-linear effects (e.g., distance-decay patterns, threshold effects for UFGS size) and complex interactions between different UFGS attributes underscore the nuanced nature of the UFGS–price nexus. This review provides a structured understanding of urban forest and green space capitalization drivers, emphasizing the need for nuanced, evidence-based urban forestry planning and green space management that considers UFGS quality, diversity, and equitable distribution for sustainable urban development.

1. Introduction

As a crucial spatial medium that fulfills fundamental human needs and supports socio-economic activities, housing commands a price that is not only a key indicator of regional economic development and residents’ cost of living, but also profoundly impacts urban spatial structure, resource allocation efficiency, and social equity [1,2]. The formation of housing prices is a complex process, comprehensively driven by multiple factors such as the macro-economic environment, regional development policies, land supply conditions, demographic structural changes, transportation accessibility, infrastructure completeness, and environmental quality [3,4]. Among the numerous factors influencing housing prices, urban forests and green spaces (UFGSs) play an increasingly significant role, providing crucial ecosystem services (such as microclimate regulation, air purification, water resource conservation, and biodiversity maintenance) and important social functions (such as offering spaces for leisure and recreation, promoting residents’ physical and mental health, and enhancing community cohesion) [5,6]. In this study, UFGSs are broadly defined to encompass urban forest patches, street trees, public parks, and other vegetated green infrastructure, which collectively constitute the urban forest ecosystem.
Numerous studies indicate that residences proximate to UFGSs such as urban forests, parks, and associated green-blue infrastructure, or those possessing favorable green views, typically command higher prices [7,8,9]. Underlying this phenomenon is the willingness of residents to pay additional costs for the multiple values afforded by UFGSs [10]. With the acceleration of urbanization processes and the continually rising public demand for residential quality, the importance of UFGSs and their manifestation in the real estate market have become increasingly prominent [11,12]. Increased investment in UFGSs and green infrastructure by government and planning authorities has not only improved the urban ecological environment but, through high-quality UFGSs, has also stimulated housing price premium effects [13]. This phenomenon indicates that UFGSs are gradually transitioning from a singular function of landscape and ecological improvement to an important driver influencing residents’ housing decisions and propelling housing price increases. The role of high-quality UFGSs in enhancing community quality of life and attracting high-quality populations is becoming a key force driving up regional housing prices and achieving urban sustainable development.
The volume of research addressing the relationship between UFGSs and housing prices is substantial and continually growing, a trend that not only reflects the importance of this topic, but also propels the refinement of research methodologies and the detailed exploration of analytical dimensions. The Hedonic Pricing Method (HPM) [14], as a primary method for assessing the value of environmental resources, plays a central role in studies concerning the relationship between housing prices and UFGSs [15,16]. This method is based on the hypothesis that housing prices can be decomposed into the sum of implicit prices of various attributes, including structural characteristics (e.g., area, age of the building), locational attributes (e.g., transport convenience, school quality), and environmental features (e.g., green space accessibility, air quality) [11,17]. By establishing regression models between housing prices and these characteristics, the marginal contribution of environmental attributes such as UFGSs to housing prices can be estimated [18,19]. In addition to the HPM, methods such as the Contingent Valuation Method and the Travel Cost Method are also used to assess the economic value of UFGS [20,21]; however, the HPM is widely adopted due to its reliance on actual market transaction data [22].
Although the positive impact of UFGSs on housing prices is widely acknowledged, in-depth research into their relationship reveals significant inherent complexities. The UFGS attributes that influence housing prices are exceedingly numerous and diverse, encompassing not only traditional metrics like proximity, quantity (area, greening rate), and type, but also multiple dimensions such as visibility, vegetation conditions, landscape ecological patterns, and environmental climate benefits [23,24]. The impact of UFGSs is not always positive; under specific conditions, such as poor maintenance, safety hazards, or certain types of UFGSs, negative effects can occur [25]. The influence of UFGSs on housing prices is not static and can be significantly moderated by spatio-temporal contexts and socio-economic conditions [26,27]. Therefore, understanding the role of UFGSs in enhancing residential environments, stimulating premium effects, and shaping urban structure cannot be limited to merely determining “whether an impact exists” or “whether the impact is positive or negative”. It necessitates a comprehensive, multi-angled, and multi-layered analysis of UFGSs as a driver and its complex underlying driving effects. A systematic understanding of this complexity is a critical prerequisite for effective urban planning, the formulation of equitable environmental policies, and the achievement of sustainable urban development goals.
In recent years, research on the economic valuation of UFGSs has proliferated, and several review articles have synthesized these studies. These reviews often focus on discussions of valuation methodologies, such as comparing market and non-market valuation methods in UFGS assessment [28]. The application of the HPM, a common tool for quantifying the economic value of non-market goods like UFGSs, in assessing the value of urban assets such as green spaces, parks, and forests, has received particular attention [16]. Currently, there are few reviews specifically on the application of the HPM to UFGS valuation [29]. While these studies provide an important methodological foundation for understanding how to estimate UFGS value, they have several limitations: First, reviews tend to focus on specific types of green spaces (e.g., nature reserves, forest wetlands) or only address the relationship between a single UFGS attribute (e.g., distance or coverage) and housing prices [30], resulting in a limited research scope. Second, the sample sizes in these studies are typically limited, with the number of original studies included in analyses often only in the dozens, making it difficult to comprehensively reflect the full picture and complexity of research in this field. Furthermore, although some studies indicate that UFGS attributes such as tree canopy coverage and high-level green views generally have a positive impact on housing prices [15,31], there is a lack of quantitative analysis regarding the direction, intensity, and non-linear characteristics of these impacts, leading to ambiguous research conclusions. Additionally, while some research has revealed the moderating role of socio-economic factors [30] and pointed out that the relationship between different UFGS attributes and housing prices varies [32], there is a lack of systematic analysis. These studies have not deeply explored the mechanisms and patterns underlying these differences, and insufficient attention has been paid to the social equity and spatio-temporal heterogeneity of UFGS impact on housing prices. Overall, there is a relative scarcity of systematic, large-scale literature reviews specifically dedicated to integrating research on how UFGSs, as a driver, concretely affect housing prices.
This study aims, through a systematic literature review, to comprehensively and profoundly synthesize and analyze the evidence in the existing research on how UFGSs drive changes in housing prices. It seeks to move beyond the simplistic understanding that “UFGSs affect housing prices” to systematically reveal the various attributes of UFGSs, their mechanisms of action, and their heterogeneous manifestations in different contexts. Specifically, the research objectives include: (1) To identify and categorize the ways in which the multifaceted values of UFGSs, as reflected in housing prices, are measured in the existing literature. (2) Based on published studies, to statistically analyze the overall patterns of UFGS impact on housing prices, including the proportion of significant impacts, primary directions of influence, and forms of relationships. (3) To systematically identify, classify, and evaluate the key UFGS drivers examined in the literature, and to summarize the specific impact patterns of various types of drivers on housing prices. (4) To investigate whether differences exist in UFGS driving effects among different social groups, thereby uncovering potential social equity issues. (5) To examine the spatial heterogeneity and temporal dynamics of UFGS impact on housing prices. This study can provide a structured and comprehensive knowledge map for the rapidly developing field of “UFGS–housing price” research. It will help identify the main findings, gaps, and future research directions in existing studies, offer a reference for related theoretical development, and contribute to a more scientific assessment of the economic returns of UFGS investments, the optimization of UFGS system planning layout, design standards, and management strategies, and the formulation of more inclusive and sustainable urban development policies and the achievement of sustainable urban development goals. While empirical findings form the core of this systematic review, the interpretation of these capitalization mechanisms is fundamentally grounded in housing economic frameworks—such as Utility Theory and Bid-Rent Models—which are systematically discussed in Section 4.

2. Materials and Methods

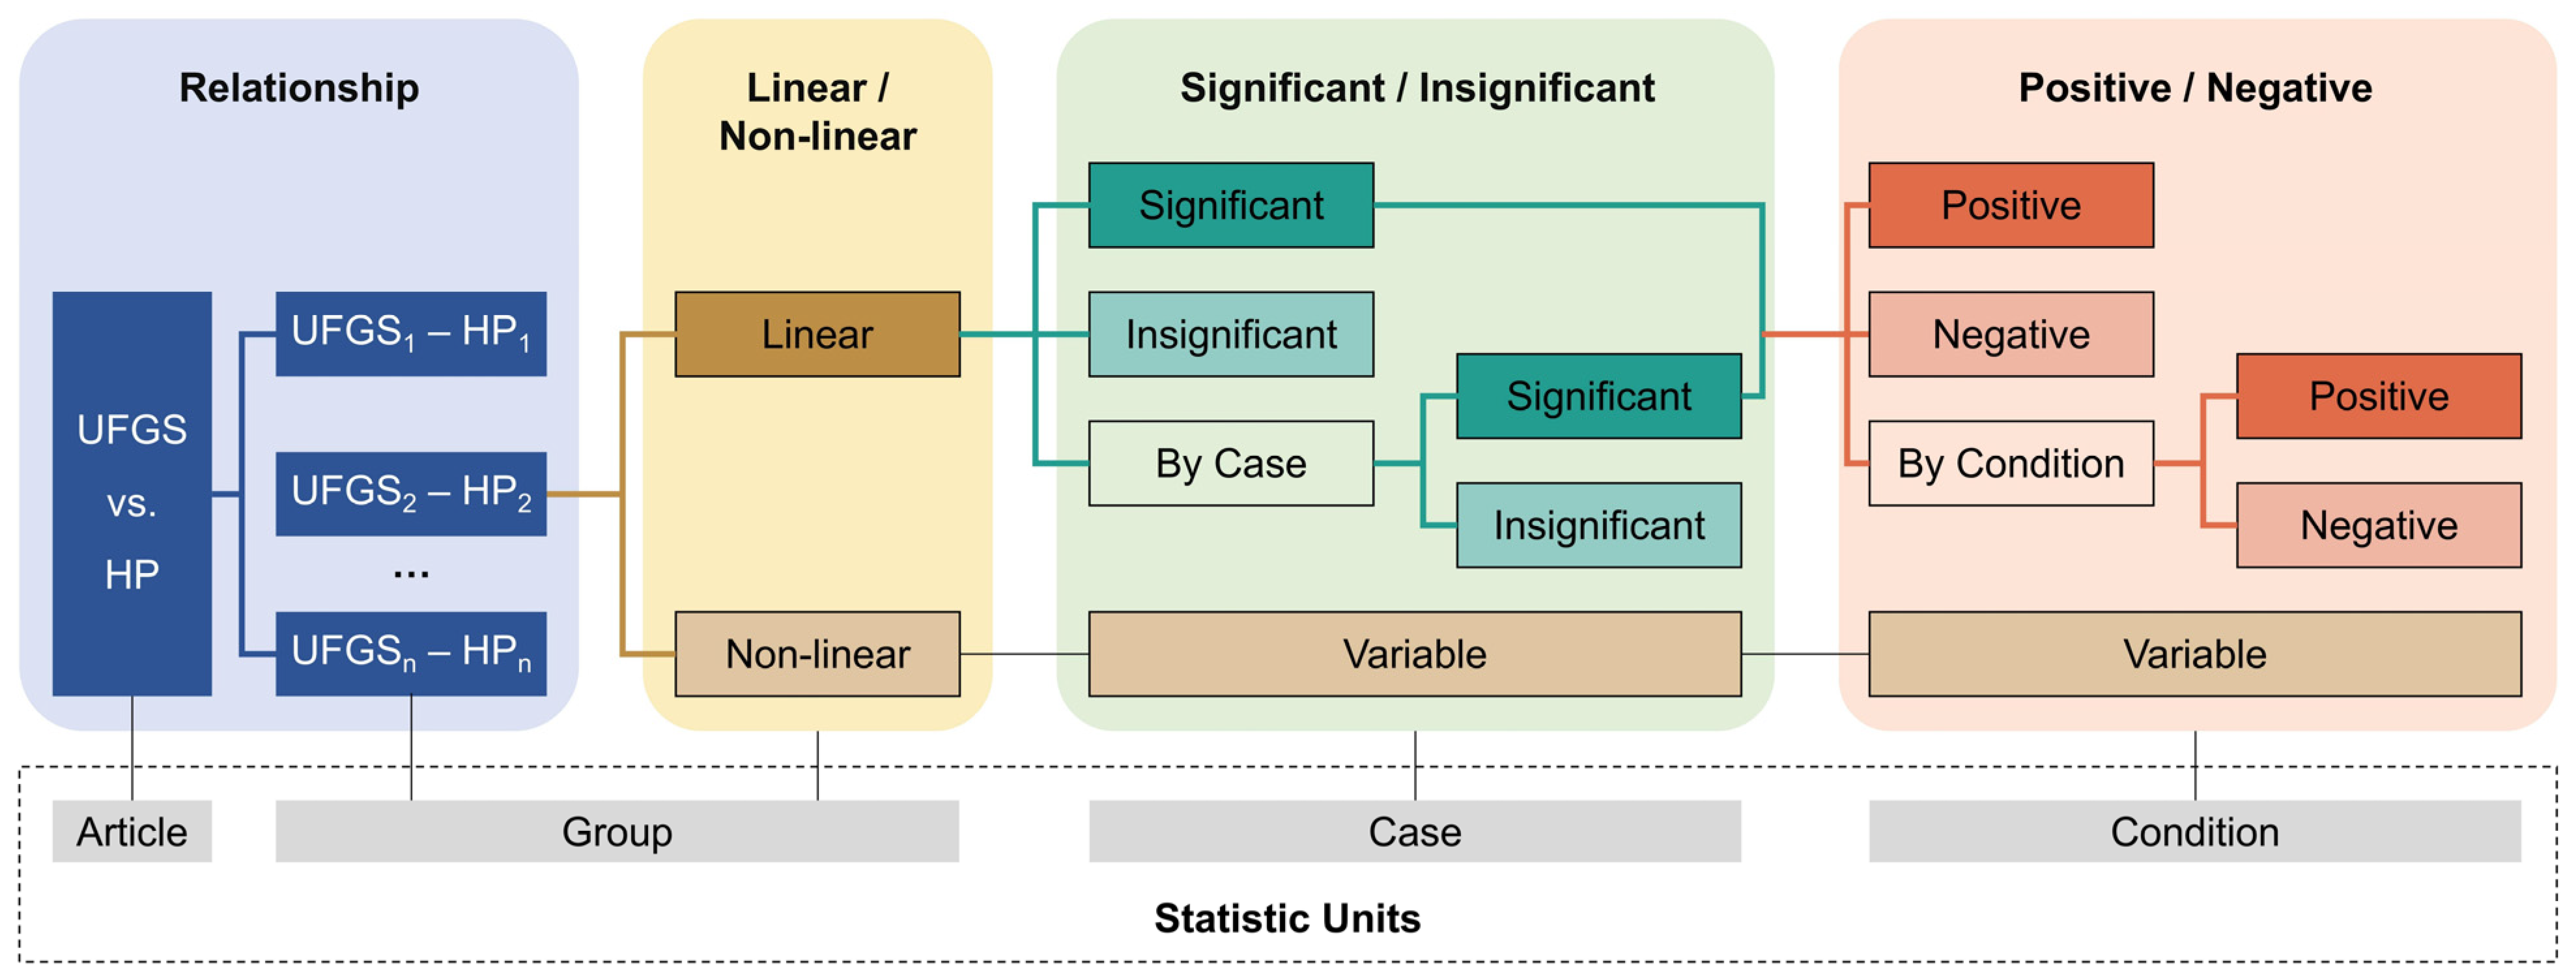
This systematic literature review utilized the Web of Science database to search for the literature published before 1 July 2023, using keywords related to UFGSs and housing prices. The articles were then discriminated, quality-appraised, and screened based on their research content and quality (Table S1; details in Supplementary Section S1), resulting in the final selection of 182 articles (listed in Supplementary Section S4). Given that these articles encompass diverse research methodologies and perspectives, we employed a multi-level statistical analysis unit to comprehensively assess the impact of UFGSs on housing prices (Figure 1): (1) Article: Each individual article served as a basic unit. (2) Group: This unit represents a specific impact relationship between a UFGS driver and housing prices, as extracted from the literature. Each relationship group can be either linear or non-linear. For non-linear relationships, the presence and direction of the impact are considered variable. Linear relationships, in contrast, involve a clear determination of impact presence and direction. (3) Case: This study further distinguishes, for each impact group characterized by a clear linear relationship, whether an impact is present. This is based on the premise that previous research may have investigated different situations, leading to different “Yes” (significant impact) or “No” (non-significant impact) outcomes. For instance, within a group representing the relationship between a specific UFGS attribute and housing prices, the attribute might have a significant impact in some reported cases but not in others. (4) Condition: In instances of a significant impact (a case with a “Yes” outcome), the direction of the impact might be investigated under different conditions, leading to different “Positive” or “Negative” results. For example, when a UFGS attribute significantly affects housing prices, its impact might be positive under some conditions and negative under others. This multi-level statistical approach allows for a more comprehensive understanding of the complex impact of UFGSs on housing prices, and provides a basis for future policies and urban planning.

3. Results

3.1. Diverse Value Embodiments of UFGSs in Housing Price

As an important ecological and social infrastructure in cities, UFGSs exert diverse impacts on surrounding housing prices. The multifaceted values of UFGSs reflected in housing prices in previous research include: the impact of UFGSs on housing prices, the implicit price or premium price of UFGSs, willingness to pay for UFGSs, and the economic value and benefits of UFGSs (details in Supplementary Section S2). As one of the factors influencing housing prices, related research on UFGSs can be categorized into two types. The first type incorporates UFGSs along with other environmental factors (e.g., water bodies and mountains) or urban factors (e.g., transportation facilities, medical facilities, and cultural facilities) to study the comprehensive impact of the natural environment, urban infrastructure, etc., on housing prices [33,34]. These studies tend to focus on analyzing the formation and changes in the real estate market, as well as the various factors affecting housing prices [35,36]. The second type of research specifically focuses on the impact of UFGSs on housing prices; as research deepens, the analysis of UFGS impact becomes increasingly detailed [37,38,39,40]. These studies not only investigate whether UFGSs have an impact, but also explore the direction and magnitude of the impact, as well as how the impact varies with time, space, and socio-economic levels. According to utility theory, the value of a commodity is not derived from the commodity itself, but from its individual characteristics [41]. Therefore, the impact of UFGSs on real estate prices generates an implicit price or premium [42]. Residents’ perception of the marginal implicit price (or price premium) of UFGSs can be inferred through the HPM [14]. Analyzing which UFGS attributes positively affect housing prices and which have negative effects depends on the outcomes of market transactions.
UFGSs intrinsically attract people to express their willingness to pay by accepting higher housing prices [15]. The marginal willingness to pay generated by UFGSs is often interpreted as the marginal implicit price brought by UFGSs, which is the marginal effect or impact of UFGSs on real estate prices [43,44]. Some studies use the HPM to analyze changes in the implicit price of UFGSs to explore how people’s willingness to pay for housing attributes brought by UFGSs varies [45,46,47,48,49,50,51]. Other studies, after analyzing the impact of UFGSs on housing prices using the HPM, further convert the relationship between UFGSs and housing prices into the monetary amount people are willing to pay for UFGSs by using average housing prices [52,53,54,55,56]. This method allows for a more intuitive understanding of the economic value of UFGSs. UFGSs valuation is crucial for formulating rational urban and UFGSs planning policies and decisions, as well as for urban sustainable development. UFGSs valuation can be divided into two approaches: monetary valuation and non-monetary valuation. The HPM has become the most widely used method in evaluating the economic benefits of UFGSs [49,57]. As most studies have confirmed the positive impact of UFGSs on surrounding housing prices, many studies specifically analyze the economic benefits generated by UFGSs through increased property prices [58]. In some studies, the economic value of UFGSs is also referred to as capitalization effects, which have been accurately estimated and meticulously analyzed [59,60,61]. Quantifying the economic value of UFGSs can provide a better basis for urban planning and management.

3.2. Impact of UFGSs on Housing Price

A quantitative assessment of the geographical distribution of the 182 included studies reveals a pronounced spatial concentration. A significant majority of the empirical cases are situated in Asia, predominantly driven by studies from China (accounting for approximately 31.32%), followed by North America (30.22%) and Europe (17.58%). This distribution is noted, as it shapes the predominant capitalization trends identified in this review. Regarding the question of whether UFGSs impact housing prices, the reviewed studies collectively encompassed 440 impact groups. Within these studies, UFGSs were found to have an impact on housing prices in 60.93% of the reported cases (786 out of 1290), establishing it as an important factor in housing price variations. However, findings from the remaining studies, representing 39.07% of cases (504 out of 1290), concluded that UFGSs had no impact on housing prices.
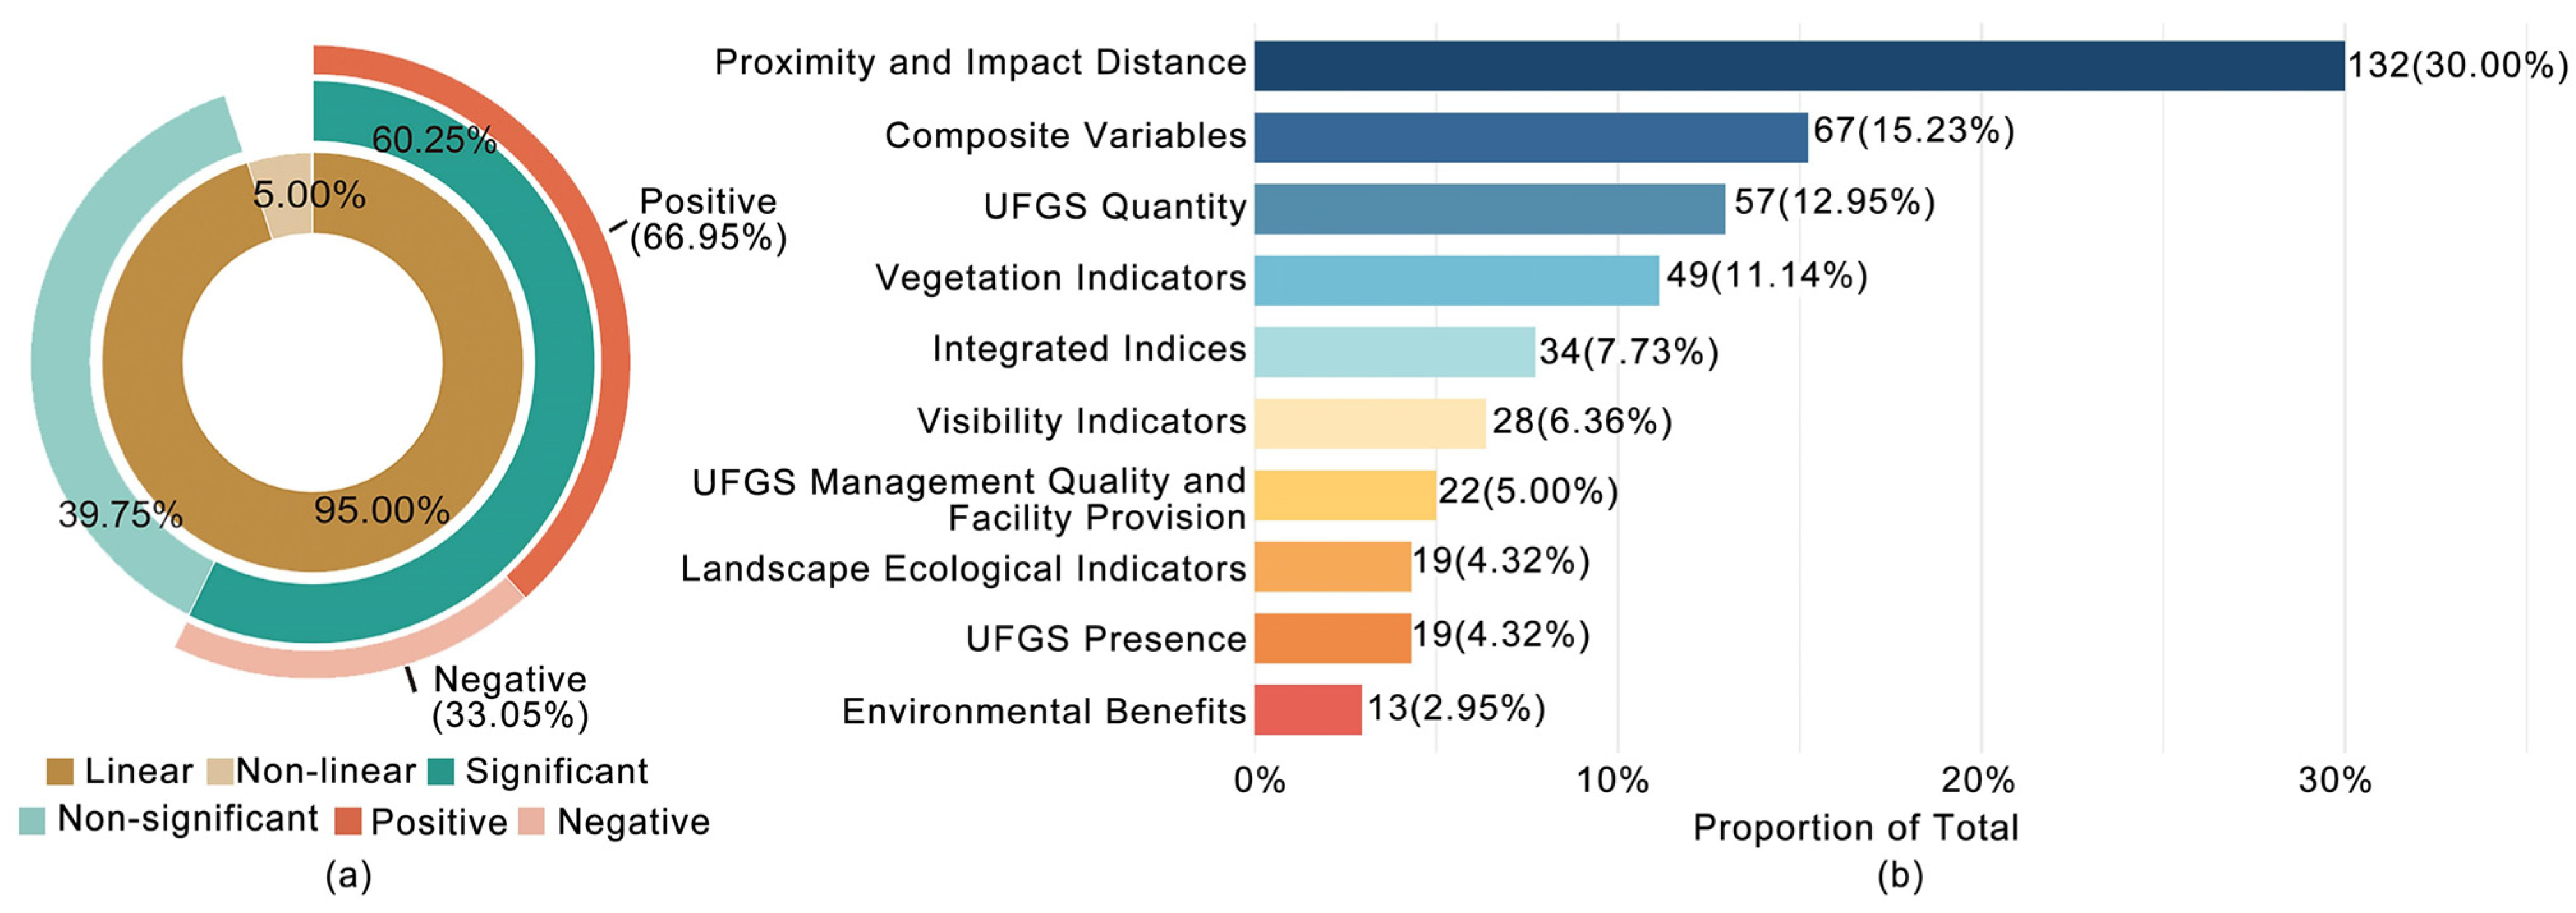
In studies on the impact of UFGSs on housing prices, most relationships were described using linear functions to represent a definite and clear connection (95.00%; 418 out of 440 groups). Among these linear relationships, 60.25% of the findings affirmed that UFGSs had a significant impact on housing prices (Figure 2a). Of these significant impacts, a majority (66.95%; 470 out of 702 conditions) showed that UFGSs or their facets had a positive effect on housing prices, indicating that UFGSs led to an increase in these prices. Conversely, some impacts (33.05%; 232 out of 702 conditions) demonstrated a negative effect, suggesting that instead of providing communal benefits, UFGSs were associated with costs or disamenities.
As research has progressed, an increasing number of studies (5.00%; 22 out of 440 impact groups) have posited that the impact of UFGSs on housing prices is not constant, but rather varies with changes in UFGS attributes, indicative of non-linear effects. Some studies (representing 40.91% of these non-linear instances, or 9 out of 22 groups) confirmed that the impact of UFGSs on housing prices is not merely positive or negative, nor strictly an increase or decrease; rather, it exhibits an inverted U-shaped or U-shaped pattern [62,63,64]. This indicates that as UFGS attributes improve, housing prices exhibit an initial increase followed by a subsequent decline (or vice versa), thereby revealing a critical inflection point. Furthermore, other research (constituting 59.09% of these non-linear instances, or 13 out of 22 groups) modeled the influence of UFGSs on housing prices as a highly complex phenomenon. Analysis using non-linear models in these studies indicated that variations in housing prices attributable to UFGSs follow non-linear patterns corresponding to changes in UFGS attributes [47,65].

3.3. Key Drivers of UFGSs on Housing Price

3.3.1. UFGS Proximity and Impact Distance

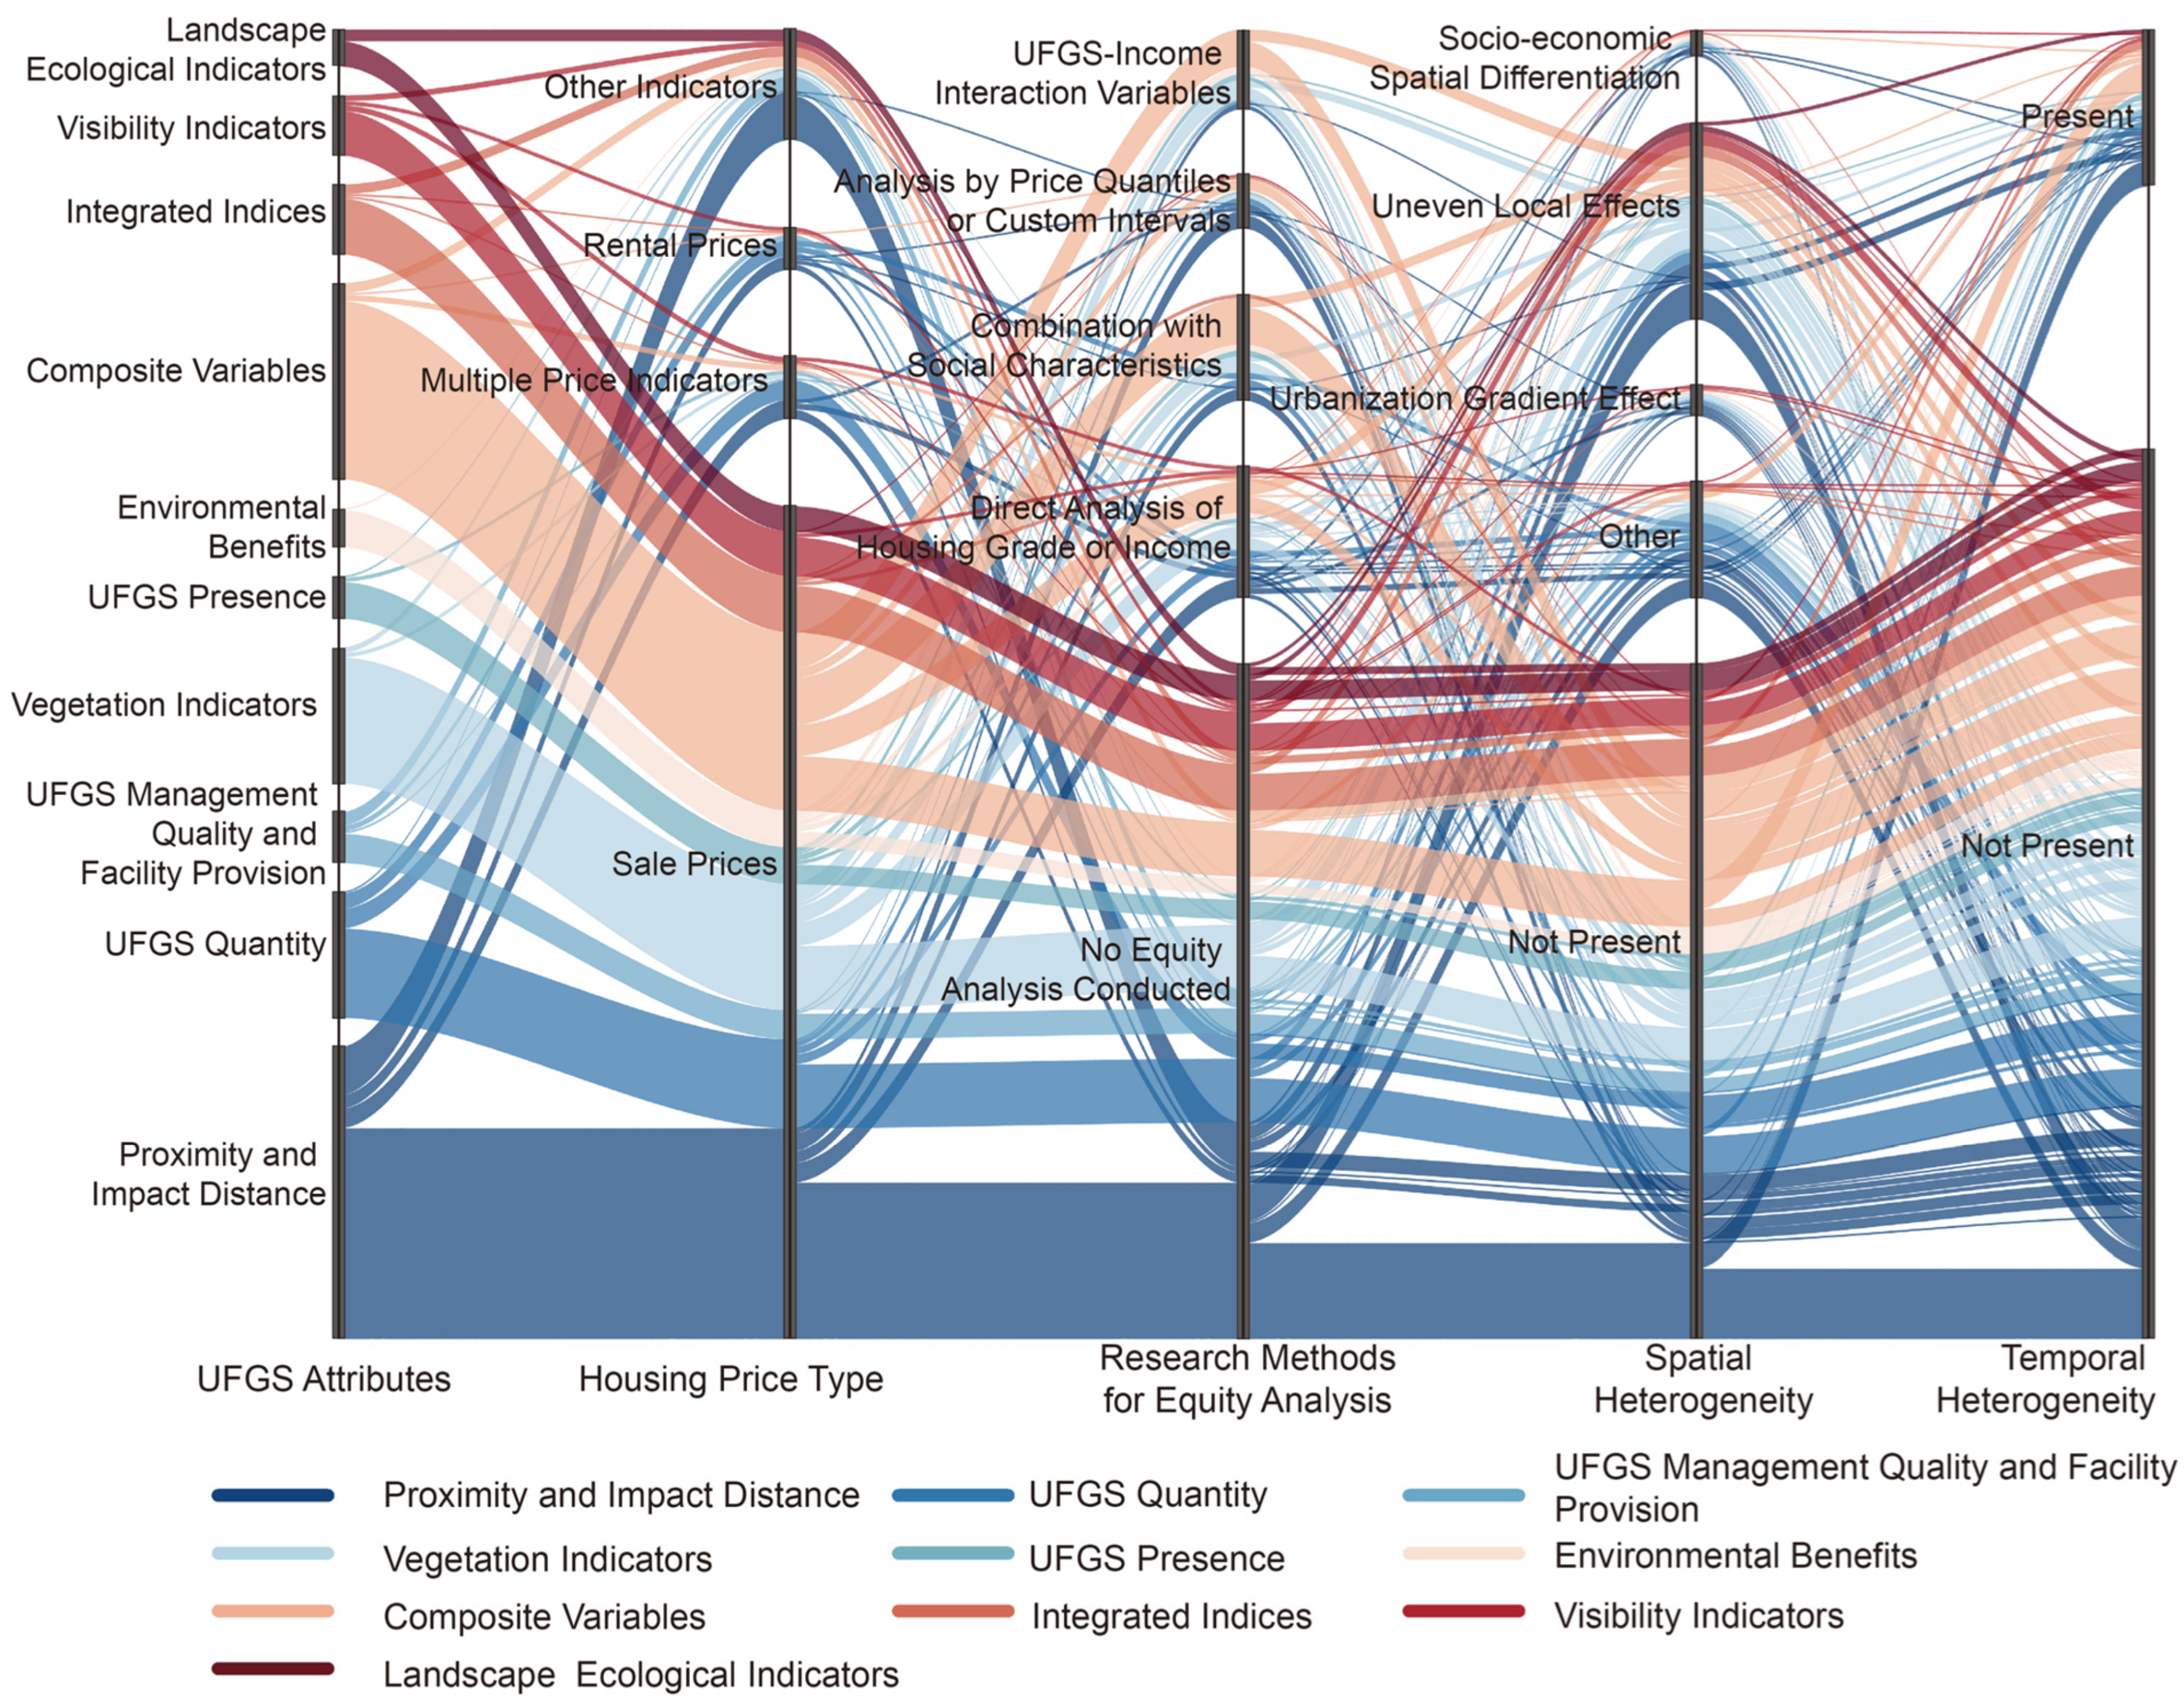
The analysis of the UFGS–housing price relationship necessitates matching UFGS attributes with property locations. Studies are commonly based on the characteristics of the UFGSs nearest to a residence or those within specific buffer zones, such as 500 m or 1000 m radii [45,66] (details in Supplementary Section S3). Following the assumption that households have a declining marginal utility of goods [67], many studies have posited a corresponding hypothesis for housing prices and UFGSs—namely, that housing prices exhibit a declining marginal utility of UFGSs—and have empirically supported this [51,54]. In this sense, some research has proposed and investigated the hypothesis that the relationship between UFGSs and housing prices varies with changes in the distance or range between them, and that this influence diminishes or ceases beyond a certain threshold [8,68]. In 30.00% (132 out of 440 impact groups) of studies, the distance between residences and UFGSs was treated as a variable (Figure 2b and Figure 3). This encompassed measures such as the distance from the residence to the nearest UFGS or its inverse [69,70], distances from the residence to various individual UFGSs [71,72], and the characteristics or presence of UFGSs within different distance buffers around the residence [68,73], among others, to investigate the relationship between the property attribute of distance to UFGSs and housing prices (details in Supplementary Section S3). Among these studies utilizing distance as a variable, 84.85% of the analyzed groups (112 out of 132 groups) addressed Euclidean distance, whereas 23.48% of the analyzed groups (31 out of 132 groups) focused on transport network distance.
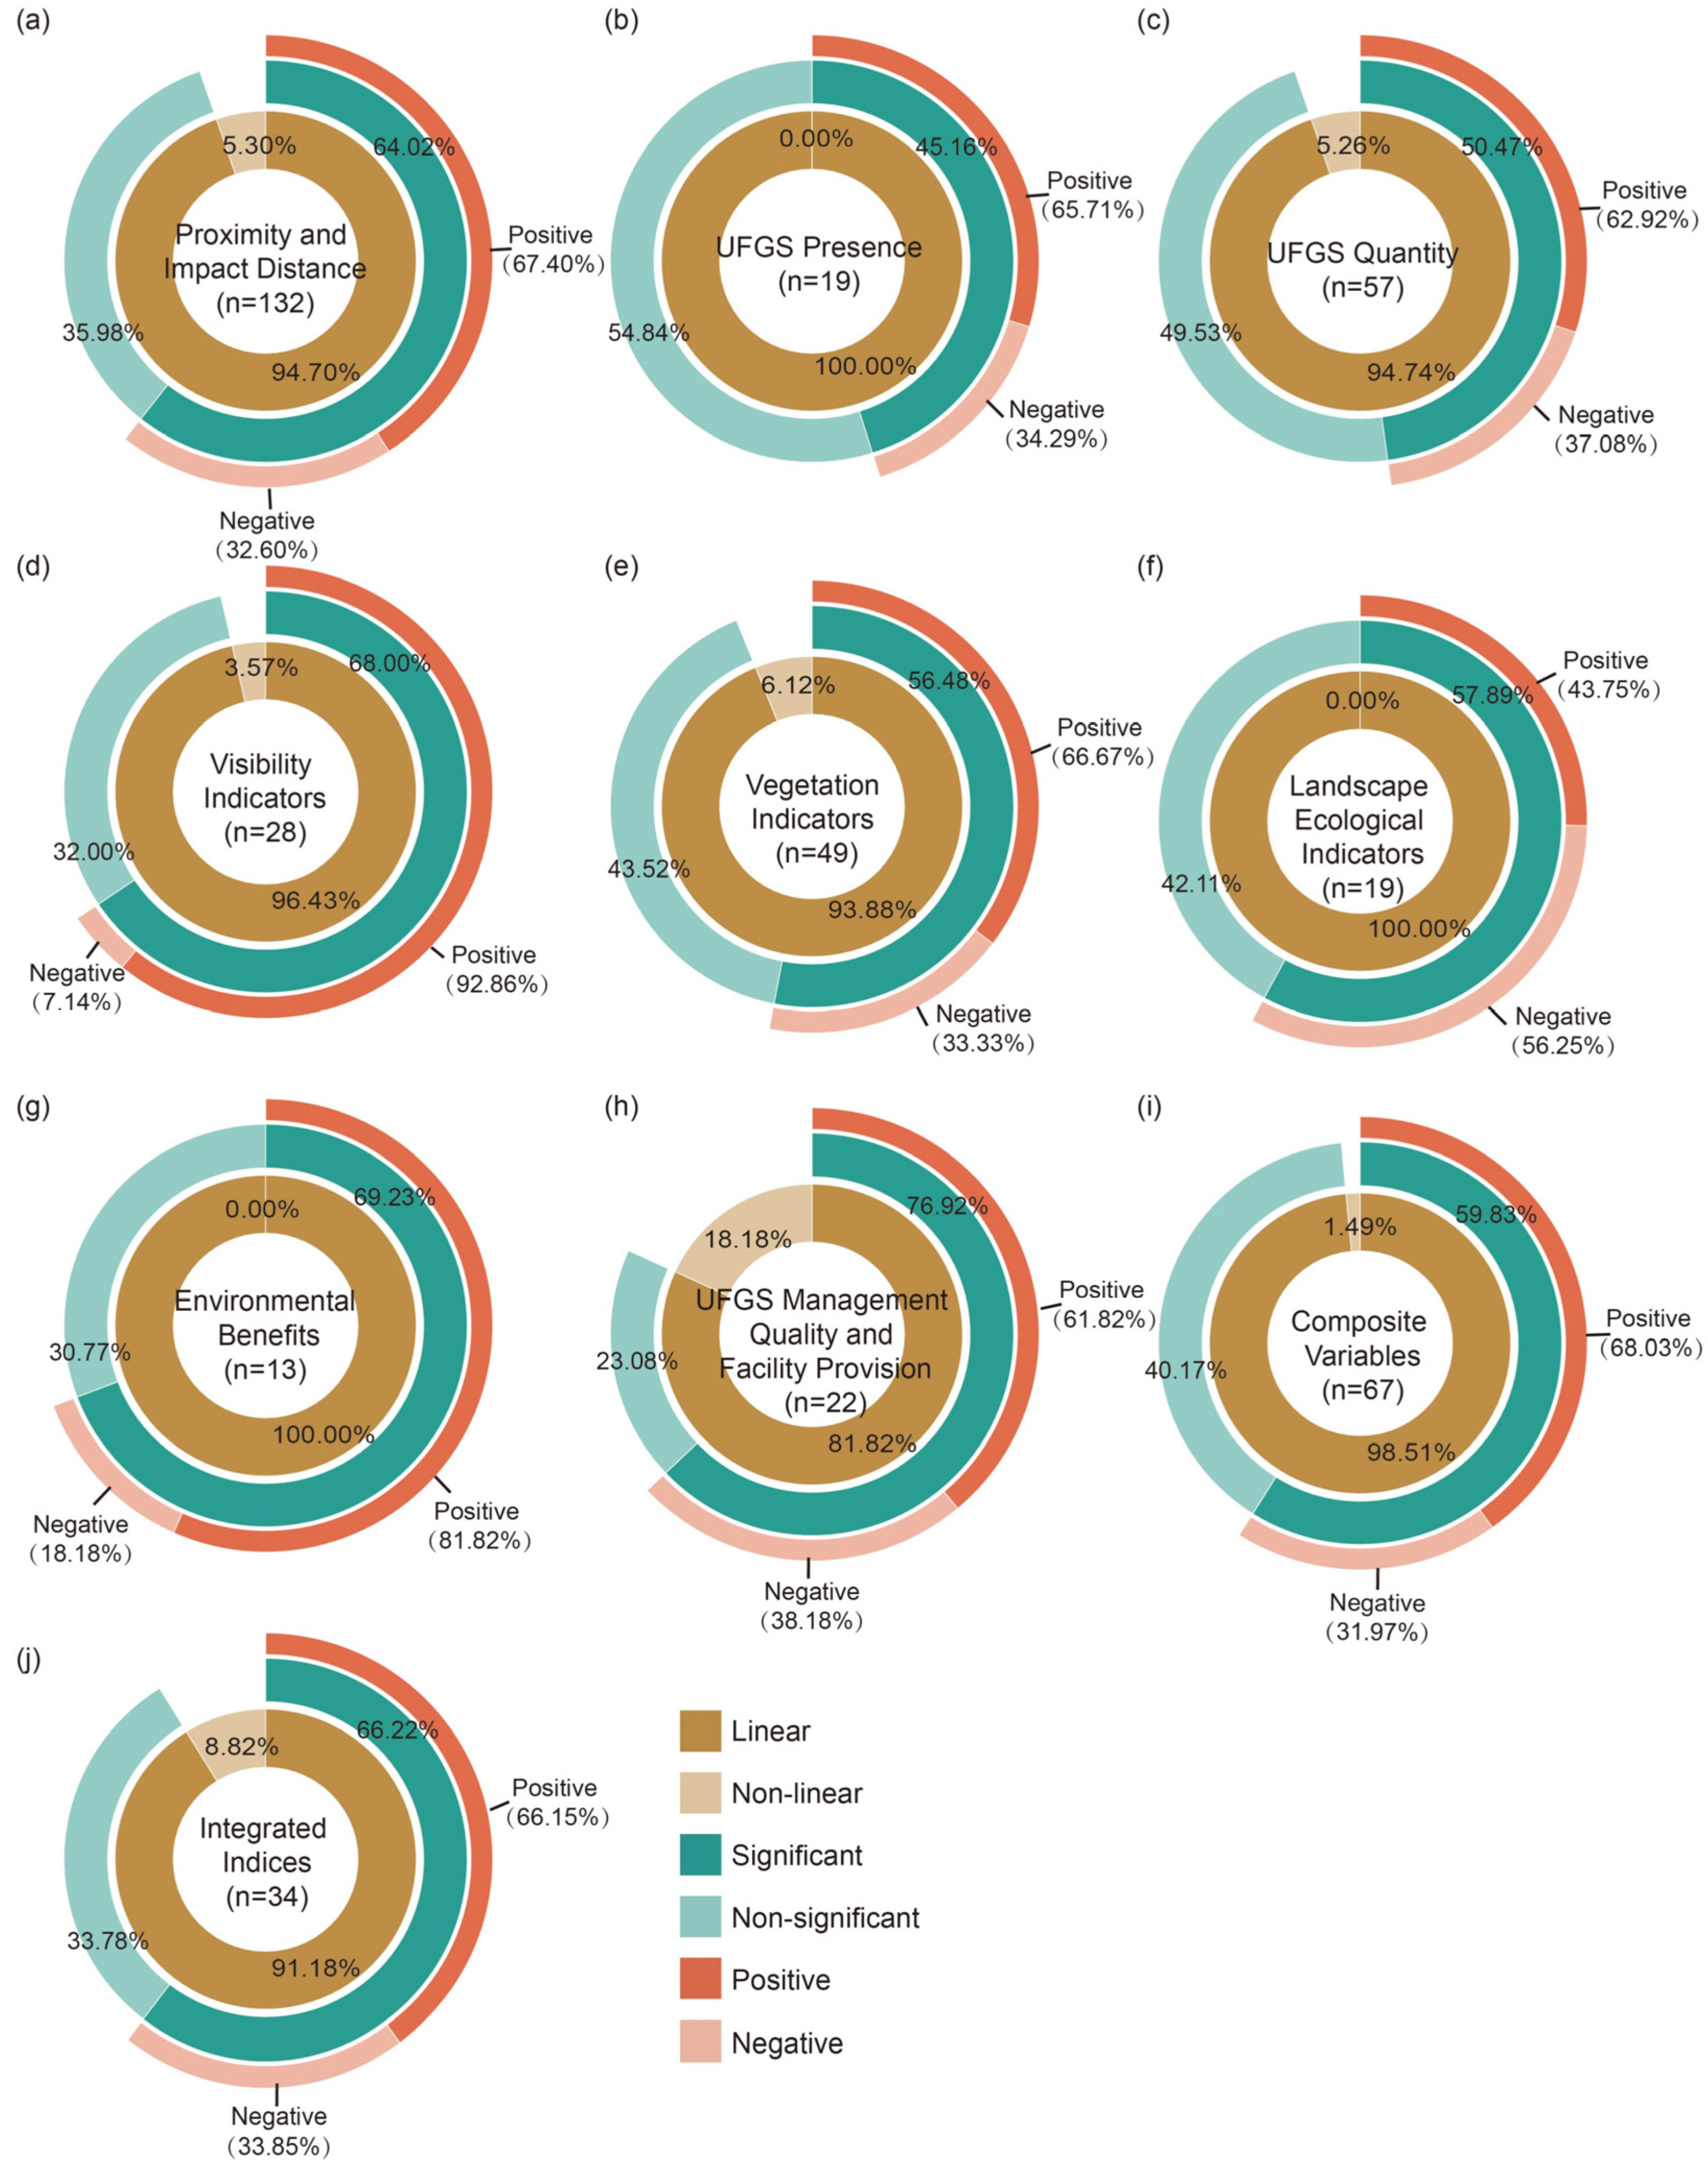
The relationship between housing prices and distance was modeled using a linear specification in 94.70% (125 out of 132 groups) of the impacts analyzed (Figure 4a). It is critical to note that this high percentage reflects methodological convenience—such as the standard application of Ordinary Least Squares (OLS) regression—rather than a profound economic reality. While classic urban economic frameworks, such as bid-rent theory, dictate a non-linear spatial decay for environmental amenities, the widespread reliance on linear models in the literature likely oversimplifies the true non-linear spatial dynamics of housing markets. Among these linear relationships, the results from 64.02% (242 out of 378 cases) indicated that the distance between residences and UFGSs has a significant, distance-dependent driving effect on housing prices. This was manifested in two primary patterns: first, a predominant positive effect was found in 67.40% of conditions (153 out of 227), where closer proximity correlated with higher housing price premiums [48,74]; and second, exceptional negative effects were found in 32.60% of conditions (74 out of 227), where closer proximity paradoxically led to a decrease in housing prices [75,76]. Additionally, isolated instances of non-linear effects were identified, with 5.30% (7 out of 132 groups) of impacts revealing that the relationship between housing prices and distance exhibited U-shaped or inverted U-shaped characteristics [77].

3.3.2. UFGS Quantity, Quality, and Associated Attributes

The quantity, quality, and associated attributes of UFGS are important drivers affecting housing prices, influencing homebuyer decisions through multiple pathways. Research has found significant differences in the intensity and direction of the impact of various UFGS attributes on housing prices, indicating that residents have diverse preferences for UFGS characteristics. Analysis indicates that only 4.32% of the reviewed studies focused on the fundamental characteristic of UFGS presence (Figure 2b and Figure 3). In all of the studies, the relationship was revealed to exhibit a linear effect. However, among these, 45.16% confirmed a significant impact, with positive effects being predominant (65.71%) (Figure 4b). Another 34.29% reported negative effects, such as those associated with poorly maintained parks [35] or parks situated in industrial zones [11]. In comparison, 12.95% of studies concentrated on UFGS quantity characteristics (e.g., area, green cover ratio, number, and proportion) (Figure 2b and Figure 3). Among these, 94.74% revealed that the relationship exhibited a linear effect. Of those linear relationships, 50.47% identified a significant association, primarily with positive impacts (62.92%) (Figure 4c). However, 37.08% also revealed negative effects; for instance, an excessively high proportion of green space was sometimes linked to decreased housing prices due to factors such as the concentration of low-income groups and higher crime rates [78]. These findings suggest that while the basic presence and quantitative aspects of UFGSs exert a generally stable positive influence on housing prices, the intensity of this impact appears relatively limited. This constitutes a profound conclusion regarding urban environmental valuation: it indicates that the mere quantitative provision or physical areal expansion of green space is fundamentally insufficient to drive substantial economic premiums. The housing market strictly prices functional utility; therefore, quantitative supply must be intrinsically coupled with qualitative enhancements to effectively translate into capitalized property value.
Analysis using visibility indicators (e.g., green view index, whether UFGSs are visible from the residence) accounted for 6.36% of studies (Figure 2b and Figure 3), of which 96.43% revealed a linear relationship. UFGS visibility was significantly correlated with housing prices in 68.00% of these linear cases; the effect was positive in 92.86% of these instances and exceptionally negative in 7.14% [79,80] (Figure 4d). In comparison, studies on vegetation indicators (e.g., NDVI, tree canopy coverage) were more frequent (11.14%) (Figure 2b and Figure 3). Among these, 93.88% reported a linear relationship, and 56.48% of those found a significant association, of which 66.67% were positive impacts (Figure 4e). For the 4.32% of studies on landscape ecological indicators (Figure 2b and Figure 3), 100.00% revealed linear effects. A significant association was found in 57.89% of these cases, but the directional effects were more balanced, with 43.75% being positive [81,82] and 56.25% being negative [83,84] (Figure 4f). This suggests that residents place a high value on the visual experience and vegetation quality of UFGSs, while their responses to complex landscape ecological characteristics are more diverse.
The environmental benefits of UFGSs (such as cooling and air quality improvement) were found to have a significant positive impact on housing prices. This topic was exclusively analyzed using linear approaches, which showed a significant correlation in 69.23% of cases, with 81.82% of these being positive in direction [85,86] (Figure 4g). Similarly, the management quality and facility provision of UFGSs also significantly affected housing prices. This relationship was explored in 81.82% of linear studies, which reported a significant correlation in 76.92% of cases. However, the direction of this impact was more diverse—with 61.82% being positive and 38.18% negative [51]—suggesting that different types of management measures and facilities can produce differentiated impacts (Figure 4h). A synthesis of the literature reveals that UFGS ‘quality’ is measured through three distinct methodological paradigms, which subsequently influence the identified housing market responses. First, macro-objective ecological metrics (e.g., NDVI or satellite-derived tree canopy) quantify broad environmental health. Second, micro-objective visual metrics calculate the human-scale Green View Index (GVI) using Street View Imagery and machine learning, quantifying actual visual exposure. Third, subjective and expert evaluations (e.g., resident perception surveys or field audits) assess functional reality, safety, and maintenance conditions. Comparative evaluation identifies that the measurement approaches most strongly associated with housing market responses are human-scale visual metrics (positively associated in 92.86% of significant cases, Figure 4d) and subjective maintenance evaluations (81.82% positive impacts, Figure 4h). This indicates that practical, eye-level experiential quality and perceived safety generate stronger market capitalization than abstract macro-scale vegetation density indices. Crucially, this underscores that empirical findings in Hedonic Pricing Models are highly sensitive to the specific variables selected for modeling. Substituting human-scale perceptual variables (like the Green View Index) with abstract macro-scale satellite metrics (like NDVI) can fundamentally alter the analytical outcomes, representing a methodological sensitivity that future researchers must explicitly consider.
Additionally, a minority of studies identified non-linear relationships between UFGS characteristics and housing prices. For instance, such non-linear effects were reported in relation to quantity characteristics (in 5.26% of relevant reported instances), visibility conditions (3.57%), vegetation conditions (6.12%), and management quality (18.18%) [65,87]. This suggests that the impact of UFGSs on housing prices involves optimal thresholds or complex interaction effects, where exceeding or falling below certain levels could lead to diminishing marginal utility or negative impacts.

3.3.3. Composite Variables and Integrated Indices

Beyond single UFGS attributes, 22.95% of studies analyzed the composite driving effects of UFGSs on housing prices by constructing composite variables or integrated indices. The analysis showed that 15.23% of studies quantified complex impact patterns resulting from multi-factor synergy by generating interaction terms through the multiplication of different variables (Figure 2b and Figure 3). The research findings show that within 98.51% of the linear studies, a significant correlation between composite variables and housing prices was found in 59.83% of cases, and 68.03% of these exhibited a positive effect (Figure 4i). Among these studies that utilized multiplicative interaction terms, 34.33% specifically investigated interactions between UFGS attributes themselves (e.g., distance with area, visibility with quality). In 57.97% of the reported cases involving such UFGS–attribute interactions, a significant impact on housing prices was observed, with these effects being predominantly positive (65.71% of significant cases) [12,51]. However, certain specific attribute combinations (e.g., protection status with distance, open status with distance, density with distance) were also found to yield negative impacts (in 34.29% of significant cases) [88,89]. Some research also identified a non-linear relationship for the interaction between park proximity and service capacity [40], wherein quality factors could moderate distance effects up to a critical point. Separately, 8.96% of the total reviewed studies revealed synergistic mechanisms between UFGSs and other attributes, such as building characteristics; this included interactions with floor level [90], distance to the central business district [91], property management fees [50], and neighborhood composite indices [92]. In 76.19% of the cases where these UFGS–building characteristic interactions were examined, they significantly affected housing prices, of which 68.75% constituted positive impacts [93] and 31.25% were negative impacts [91,92]. Furthermore, an additional 34.33% of total reviewed studies explored the interaction effects of UFGSs with social characteristic variables (e.g., population [94], age [95], income [96], crime rate [74], etc.), while 22.39% of total reviewed studies examined interactions between UFGSs and spatio-temporal dynamic variables (e.g., with time [97] and with construction period [68]) (for details, see Section 3.4 and Section 3.5).
The construction of integrated indices through the algorithmic combination of multidimensional UFGS attributes was a method employed in 7.73% of the analyzed groups (34 out of 440), offering a new perspective for assessing the overall benefits of UFGSs (Figure 2b and Figure 3). Analysis of the 91.18% of linear studies revealed that a significant correlation between integrated indices and housing prices was present in 66.22% of cases; of these significant correlations, 66.15% demonstrated a positive effect (Figure 4j). Among these, accessibility indicators, which accounted for 50.00% (17 out of 34 groups), integrated UFGS scale, population density, and transportation costs using gravity models or two-step floating catchment area methods [98]. These indicators were significantly correlated with housing prices in 68.09% of cases [99,100] and predominantly exhibited a significant positive impact (62.50%) [8,101]. However, under certain conditions (37.50%), green spaces with ostensibly high theoretical accessibility scores (e.g., merely falling within a broad geographic information system (GIS) radius) paradoxically correlated with reduced housing prices. A critical review reveals this anomaly to be a methodological misinterpretation in spatial modeling: these purely mathematical metrics often erroneously capture massive, undeveloped peripheral woodlands that severely lack adequate pedestrian infrastructure or perceived safety. Therefore, the negative impact stems from the objective disamenities of the specific site conditions, rather than a failure of the green amenity concept [89,102]. The other 50.00% (17 out of 34 groups) of these studies employed other integrated indices, such as environmental quality indices constructed through principal component analysis [103], Geographic Field Models [104], and UFGS diversity indices [105]. These were found to be significantly correlated with housing prices in 62.96% of cases [9,49], with positive effects being predominant (76.47%) [104,106], while negative impacts were observed under some conditions (23.53%) [107,108]. Furthermore, non-linear relationships were revealed in 8.82% of these groups (3 out of 34), such as the finding that a threshold may exist for the proximity effect of UFGS buffer zones [109].

3.3.4. UFGS Type

Research on the relationship between UFGSs and housing prices has encompassed multiple UFGS types, with studies primarily focusing on three main types: parks (51.28%; 180 out of 351 groups), water bodies (19.09%; 67 out of 351 groups), and forests (14.81%; 52 out of 351 groups). Additionally, 57.83% of studies involved various other types, including green space, wetlands, golf courses, and cemeteries, reflecting the diversity of UFGSs. Significant differences exist in the impact of these different UFGS types on housing prices.
In studies related to parks, a significant correlation with housing prices was shown in 61.07% of cases, with predominantly positive impacts (68.91%). For example, residences with good park views and close proximity had markedly higher prices [51]. Under some conditions (31.09%), parks empirically exert a suppressive effect [89,93]. Theoretically, the housing market actively re-designates these specific parks from amenities to disamenities when unmitigated negative externalities—such as severe physical degradation, documented safety risks, or associations with anti-social behavior—fundamentally dominate the site’s utility profile. In other conditions (5.56%), non-linear effects were observed, such as housing prices first increasing then decreasing with the proportion of park area, or threshold effects related to park service range [40]. For water bodies, studies indicated a significant impact on housing prices in 63.49% of cases, with 86.30% of these confirming higher prices for residences closer to water or with larger water body areas [109,110]. However, under certain conditions (13.70%), negative factors like water pollution actively suppresses housing price increases [111,112], confirming that severely impaired ecological functions transform a natural resource into a measurable market disamenity. Furthermore, an interaction effect between water body proximity and residential floor level exists, demonstrating that the value of water views objectively varies with differences in vantage point [90]. In research concerning forests, a significant relationship was found in 62.22% of cases. Within these significant instances, 71.15% of conditions showed that closer proximity to forests and larger forest areas had a more positive driving effect on housing prices [99,113]. In 28.85% of conditions, forest attributes actively lower housing prices; for example, excessive forest patch density raises safety concerns [114]. In other conditions (7.69%), non-linear effects were present, such as decreasing comfort levels with increased driving time to forests [115], or paradoxically higher prices for residences within a short walking distance to forests [47]. Additionally, 55.5% (101 out of 182 articles) of studies subdivided UFGSs, examining the relationship between different UFGS types and housing prices based on dimensions such as land cover type, UFGS category, scale, ownership (private/public), and recreational characteristics (details in Supplementary Section S3).

3.4. Equity Issues in UFGS-Driven Housing Price

The driving effect of UFGSs on housing prices exhibits significant differences among various social groups, reflecting social inequality in UFGS resource access and value realization. Related studies predominantly used a single housing price indicator (91.21%; 166 out of 182 articles). Among these, 80.12% focused on sale prices [54,87], only 4.22% used rental prices, and 15.66% employed other indicators (such as land prices) [88,116]. Another 8.79% simultaneously examined multiple price indicators to comprehensively capture the differential responses across various market segments [117] (Figure 3). Research findings indicate that systematic differences exist between the purchase and rental markets in their valuation of UFGSs. Homebuyers demonstrate a clear premium effect for UFGSs [118], whereas renter demand for UFGSs increases with improvements in overall community quality [50]. However, in specific urban contexts (e.g., Seoul), high-rent groups are frequently unwilling to pay extra for proximity to UFGSs because higher-income renters frequently prioritize access to core urban utilities—such as strict proximity to Central Business Districts (CBDs), elite educational resources, and primary transit hubs. This rigid demand for urban centrality effectively overshadows and neutralizes their willingness to pay an additional premium for peripheral green amenities [119].
In studies on the UFGS–housing price relationship, 79.12% (144 out of 182 articles) did not incorporate the demographic characteristics of transacting parties into their analytical framework (Figure 3). This omission obscures critical equity issues. Importantly, spatial equity cannot be assessed merely by ‘equal physical access,’ as doing so erroneously presupposes a ‘common utility’—an assumption that all demographics derive identical value from UFGSs. In reality, equity issues arise precisely because different socio-economic groups exhibit fundamentally heterogeneous marginal utilities and budget constraints regarding green amenities versus other urban necessities. Only 20.88% (38 out of 182 articles) analyzed the UFGS–housing price relationship specifically for different population groups. These latter studies can be categorized into four types based on their approach. First, 36.84% (of these 38 articles) employed quantile regression models (based on housing prices) or utilized custom-defined price intervals to indirectly characterize populations of different socio-economic levels, thereby revealing differences in housing price impacts between high- and low-income groups [48,54]. Second, 47.37% directly examined housing grades or resident income levels to explore the manifestation of UFGS effects among different income groups [120,121]. Third, 15.79% constructed interaction variables between UFGS attributes and income (e.g., NDVI and income, vegetation and income, distance and income) to analyze the joint effect of economic levels and UFGSs on housing prices [96,122]. Fourth, 28.95% combined UFGSs with social characteristics such as race, age, and population to analyze differences in UFGS effects among various groups [123]. The specific empirical findings generated by these methodological approaches are detailed in the subsequent paragraph.
Research confirms significant differences in the impact of UFGSs on housing prices among populations of varying economic levels. High-income groups, for instance, are more inclined to pay a premium for high-quality greened residences in core areas [118,124], whereas for low-income groups, the positive impact of UFGSs is relatively weak. For instance, direct analyses of resident income levels [120,121] reveal that lower-income households must prioritize immediate functional utilities—such as affordable mass transit and job accessibility—over green amenities. Consequently, the capitalization effect of parks is frequently overpowered by these fundamental economic constraints in segregated housing markets [49,125]. In studies combining UFGSs with social characteristics such as race, age, and population, 45.45% (5 out of 11 articles) addressed population density, with results indicating that demand for UFGSs is stronger in densely populated areas, thereby driving up housing prices [95,126]. A total of 54.55% (6 out of 11 articles) involved age, showing that while the impact of UFGSs on housing prices varies across different age groups, it is generally positive for all age cohorts. Older individuals exhibit a stronger preference for park proximity and density [53]; in communities with a higher proportion of children, the price premium for residences near parks is more pronounced [77]. A total of 27.27% (3 out of 11 articles) concerned race, confirming that ethnic composition moderates UFGS effects. Areas with a high proportion of Hispanics show greater demand for UFGSs [77]; residences near UFGSs are priced higher in areas with a high proportion of African Americans [95]; whereas in areas with a high proportion of Asians, the UFGS effect presents a complex picture. Specifically, the ‘negative aspects’ refer to instances where culturally specific demands—such as an overriding priority for premium school districts or proximity to major transit nodes—mathematically crowd out or penalize the price premium for green spaces, or where unmanaged vegetation is actively avoided due to heightened perceptions of safety risks [95,123]. A total of 45.45% (5 out of 11 articles) revealed the significant moderating role of crime rates on the realization of UFGS value. When crime rates are low, the value of residences near UFGSs increases; elevated crime rates significantly reduce the housing price premium around UFGSs [74,93]. Furthermore, longitudinal analyses correlating these temporal price dynamics with demographic shifts highlight the mechanics of ‘green gentrification’. Because anticipatory capitalization inflates housing and rental costs early in the UFGS development timeline, low-income renters are often subjected to ecological displacement before the green infrastructure is completed. Consequently, the introduction of UFGSs directly alters the socio-economic composition of neighborhoods over time, functioning as a market-driven filtering mechanism that can transform inclusive environmental interventions into exclusive spatial enclaves.

3.5. Spatio-Temporal Heterogeneity of UFGSs on Housing Price

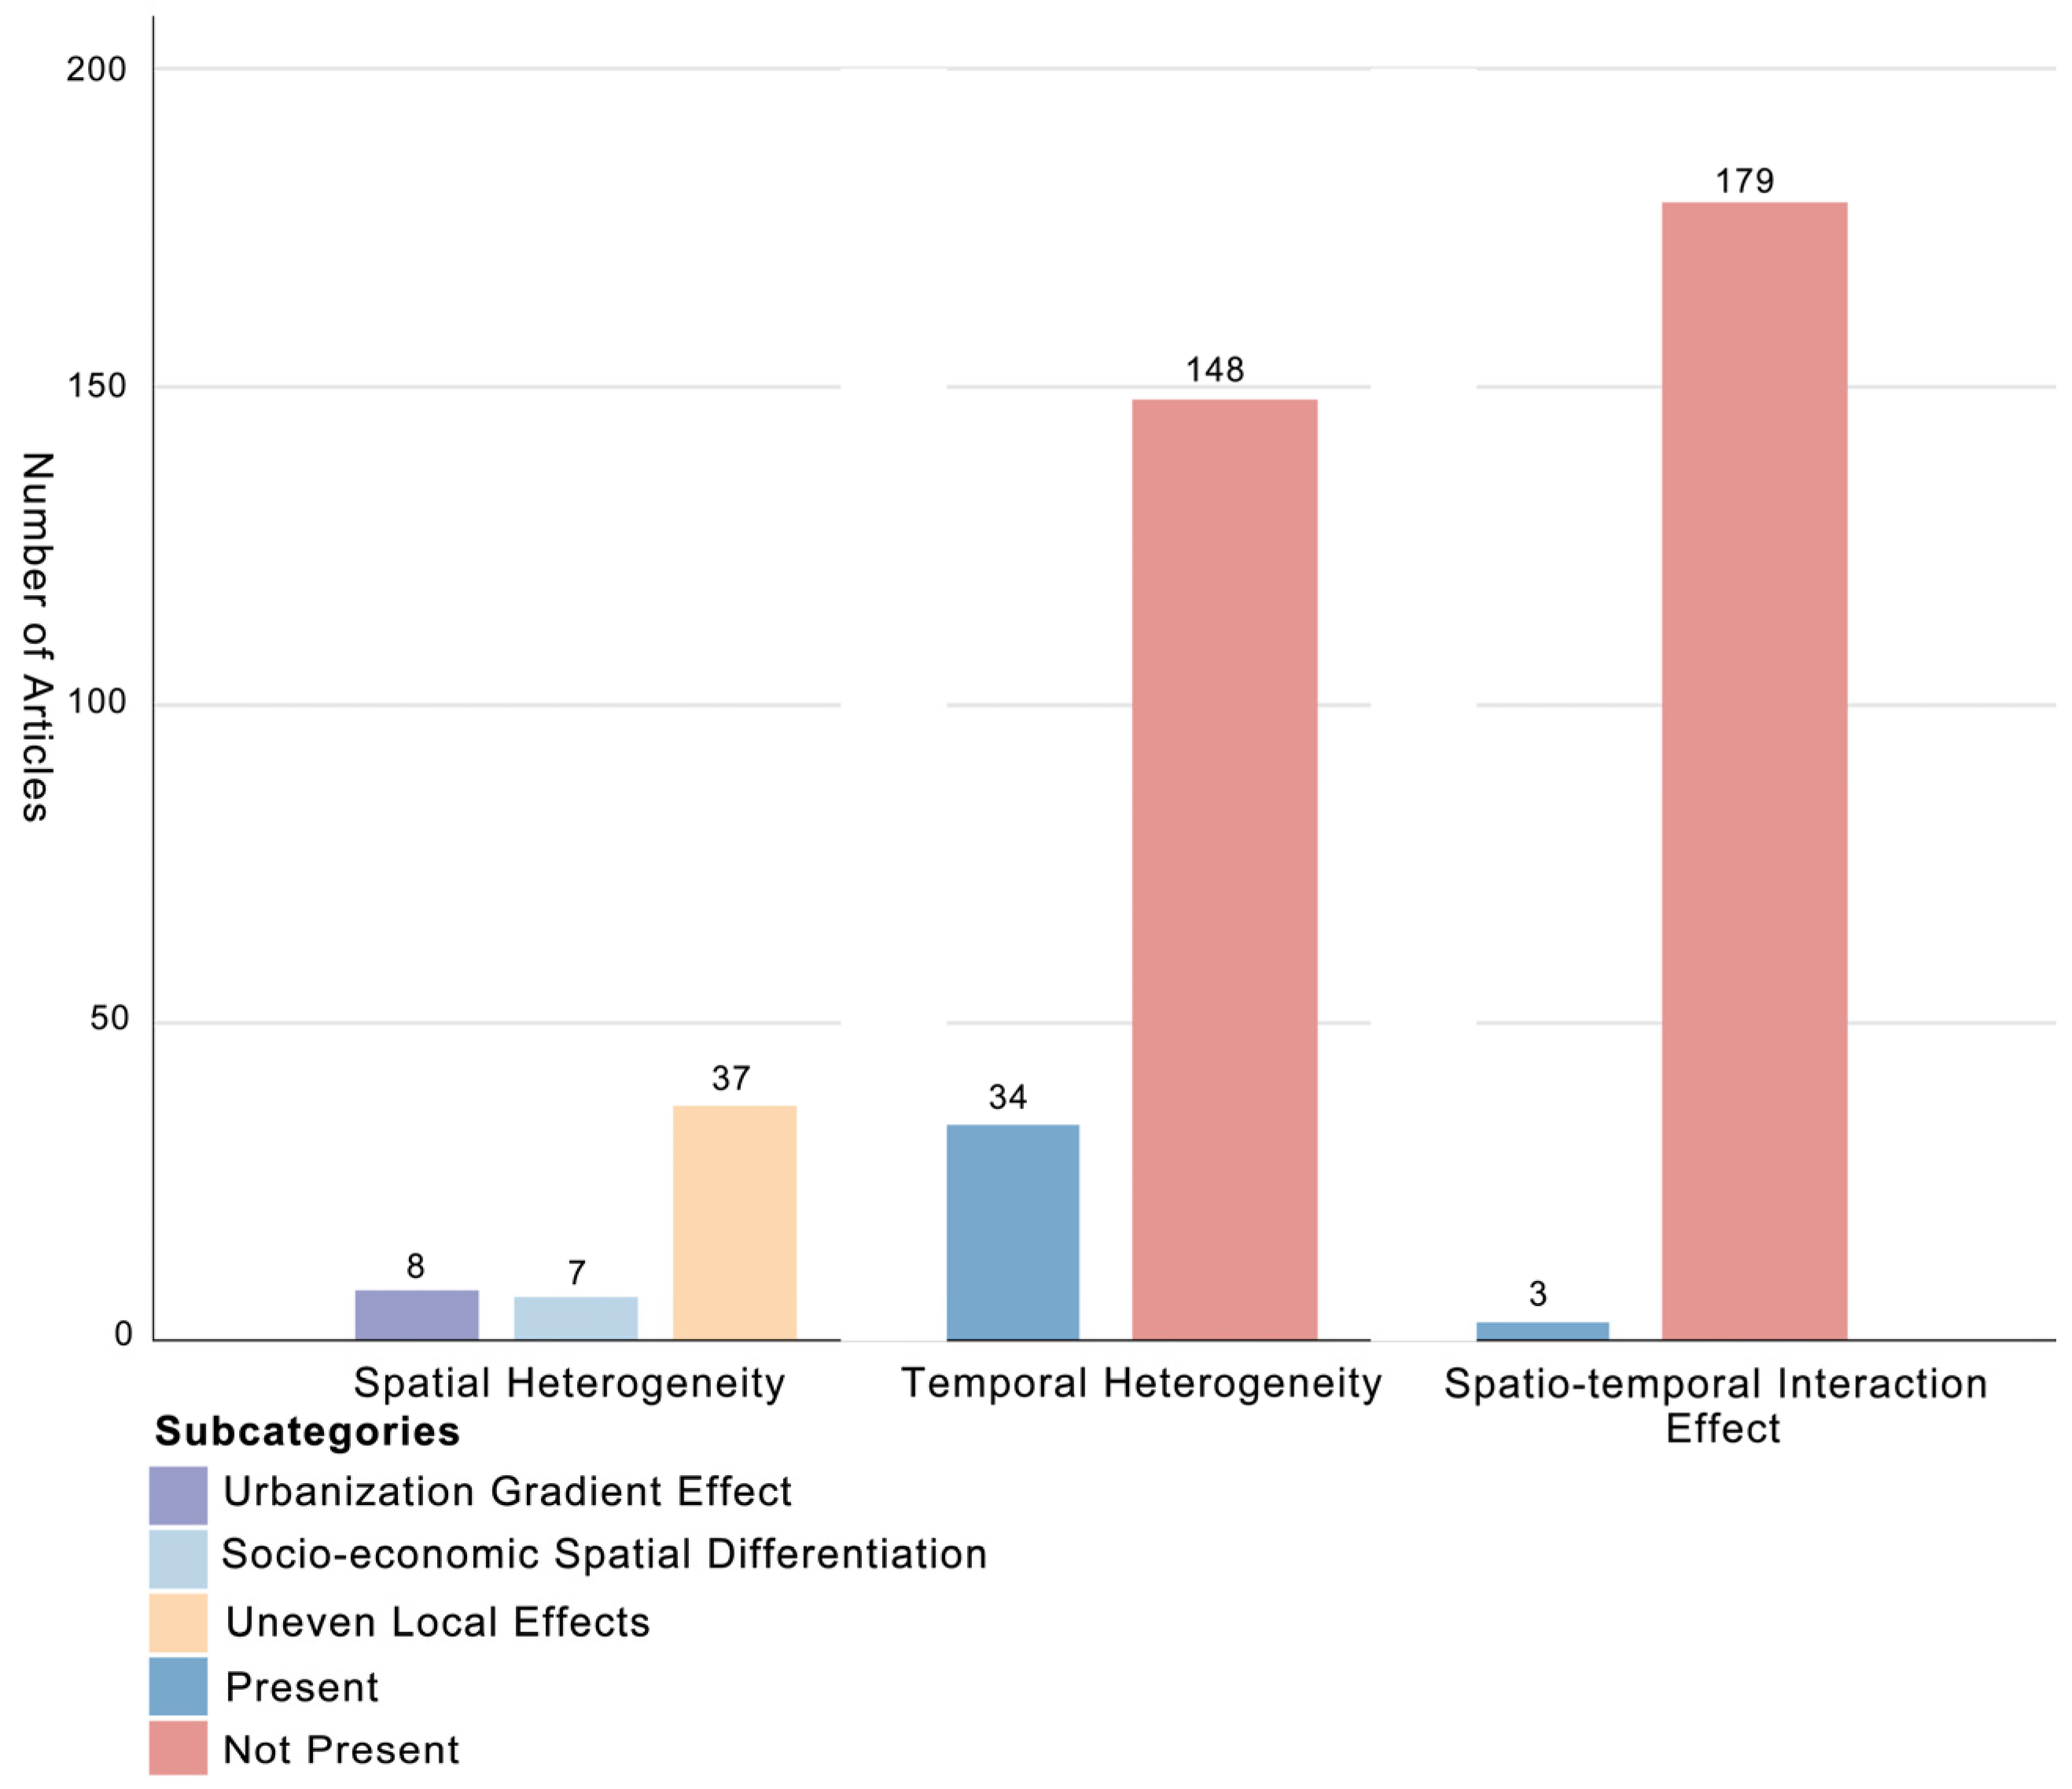
The impact of UFGSs on housing prices is not static or homogeneous, but rather exhibits complex spatio-temporal heterogeneity. In studies on the UFGS–housing price relationship, approximately 36.26% (66 out of 182 articles) explored spatial heterogeneity, finding that the capitalization effect of UFGSs exhibits significant spatial heterogeneity. In this economic context, spatial heterogeneity does not imply the mere physical uneven distribution or absence of UFGSs; rather, it refers to the phenomenon where the implicit price (capitalization rate) generated by a standard unit of green space varies dramatically across different geographical submarkets. This uneven spatial valuation primarily manifests in three patterns: First, the urbanization gradient effect. Approximately 12.12% (8 out of the 66 articles focusing on spatial heterogeneity) revealed differences in UFGS effects along an urbanization gradient by dividing areas into urban core, expansion zones, and suburban areas. In urban core areas (e.g., the inner ring region of Shanghai), the scarcity of UFGSs significantly strengthens its capitalization effect [125,127]. This is related to the supply–demand contradiction for ecological services in the context of high-intensity development in core areas [128]. In contrast, in suburban areas, alternative factors such as transportation accessibility and housing density often dominate, and the UFGS effect is relatively weaker [125,129,130]. However, some studies have also found that certain suburban communities exhibit higher sensitivity to UFGSs [131]. Second, socio-economic spatial differentiation. Approximately 10.61% (7 out of 66 articles) indicated that the capitalization effect of UFGSs exhibits significant socio-economic spatial filtering characteristics. In high-end residential areas (e.g., the Shenzhen Special Economic Zone), high-quality UFGSs as a status symbol can generate super-premiums [132,133]. Conversely, in economically distressed areas, while newly built greenways have a positive impact by improving environmental justice, they are simultaneously accompanied by Not In My Backyard effects [60]. This duality is manifested spatially: high-income groups pay more attention to the landscape aesthetic value of UFGSs, while low-income groups prioritize its practical functions, reflecting social inequality in accessing environmental resources [134]. Third, uneven local effects. Approximately 56.06% (37 out of 66 articles) employed local HPM approaches, finding that the choice of research scale significantly influences the measurement results of UFGS effects. Global models often mask local spatial heterogeneity, whereas local models reveal that the impact of UFGSs on housing prices within the same city is markedly uneven. For example, in urban core areas, due to the concentration of UFGSs and high-quality environments, the effect is stronger [57,107]. Conversely, in peripheral or suburban areas, the price premium for public UFGSs is demonstrably weaker. Economically, this is driven by a strong substitution effect: the inherent natural abundance of green resources in suburbs eliminates scarcity, and the widespread ownership of private residential gardens in low-density housing fundamentally diminishes the marginal utility that homebuyers demand from public parks [135]. Some studies have explicitly pointed out that parks closer to the city center typically command higher premiums, while large parks located further away fail to generate equivalent premiums [136].
Although most studies did not differentiate transaction times, approximately 18.68% (34 out of 182 articles) focused on the temporal dynamic effects of UFGSs on housing prices (Figure 3 and Figure 5). These studies conducted analyses based on different stages, such as UFGS construction phases, policy enactments, or economic cycles [45,97,137], using combined variables or phased estimation methods, revealing the following temporal heterogeneity characteristics. First, longitudinal studies tracking property values across UFGS lifecycles establish a specific temporal trajectory, reflecting the dynamic assessment of future utility and development risk. During the project announcement or planning phase, housing and rental prices frequently surge prior to the actual physical establishment of the green space. This early fluctuation is driven by an anticipatory capitalization mechanism, where buyers pay an early premium based on expected future amenities [100,138,139]. However, this early price spike inherently incorporates a risk premium reflecting the uncertainty of the project’s successful completion, and certain types of parks trigger negative impacts when they remain solely in the planning stage [140]. During the construction phase, this premium frequently decreases [137] because temporary construction disamenities (e.g., noise, dust) overshadow the anticipated benefits. The premium only stabilizes into a permanent capitalization effect upon project completion and actual utility delivery. After project completion, most studies found that UFGSs have a sustained positive promotional effect on surrounding housing prices, with the premium typically being higher than before project implementation and during construction [97,100,138]. However, over time, the premium effect of some projects gradually diminishes due to the emergence of negative externalities (such as noise or compromised privacy) [141], exhibiting an inverted U-shaped temporal curve. Second, the macro-economic environment significantly moderates the capitalization effect of UFGSs. Studies have found that during periods of economic prosperity, high income levels and market confidence contribute to amplifying the effects of high-quality environments [72]. Interestingly, during economic downturns, the premium effect can also remain resilient or strengthen, but through an entirely different mechanism: a substitution effect. As household budgets tighten, residents substitute costly private recreation with free public amenities like UFGSs, thereby sustaining robust localized demand despite broader market deflation [45]. Third, specific events such as natural disasters or policy enactments can trigger sharp short-term fluctuations in UFGS effects. For example, after a natural disaster, UFGSs increase housing prices due to scarcity [142], but risk perception concurrently depresses prices [143].
A small number of studies (approximately 1.65%; 3 out of 182 articles) have revealed the dynamic geographical differentiation patterns of UFGS impacts on housing prices by integrating both spatial and temporal dimensions (Figure 3 and Figure 5). These studies employed spatio-temporal combined variables (e.g., “year-by-zip code,” “district-by-year,” “street-by-year”) [100,144] or geographically and temporally weighted regression models [103], finding that the capitalization effect of UFGSs exhibits significant spatio-temporal interaction characteristics. First, spatial proximity must be combined with time to fully reflect UFGS premium characteristics. For example, properties within an 80 m radius of New York’s High Line Park had a higher price premium than those further away, but this premium showed a decaying trend within three years after the project’s completion [141]. Conversely, residences near certain infrastructure-type UFGSs (such as stormwater retention ponds) frequently depreciate after construction because these functional sites generate specific localized disamenities—such as stagnant water, unpleasant odors, or becoming breeding grounds for mosquitoes—which penalize surrounding property values once operational [145]. Second, policy interventions further exacerbate the spatio-temporal heterogeneity of UFGS effects. Studies have found that regional green space protection policies not only affect the implementation area, but also generate cross-administrative spillover effects through market mechanisms. For instance, after Riverside County in California implemented green space protection measures, its spillover effect led to an increase in the marginal value of open spaces in the neighboring San Bernardino County [97]. Third, the spatio-temporal effects of UFGSs are significantly constrained by research scale. Macro-level time and space fixed-effects analysis, while able to control for confounding biases, inherently masks micro-geographical differences [144], whereas micro-level analysis structurally overlooks broader market dynamics. The impact of UFGSs on housing prices is essentially a product of the non-linear coupling of spatio-temporal elements, requiring dynamic modeling to reveal its complex evolutionary mechanisms.

4. Discussion

4.1. Interpreting Key Findings and Implications

This review has revealed that UFGSs are not merely an urban embellishment, but a key driving force that profoundly impacts real estate values. However, this driving effect is far from being encapsulated by a simple “green equals added value” logic; it exhibits significant complexity, multidimensionality, and context-dependency. This study has identified 10 categories of key UFGS attribute drivers—including proximity and impact distance, presence, quantity, visibility, and vegetation indicators, among others—revealing the diverse mechanisms through which UFGSs influence housing prices. These driving factors form a hierarchical structure, ranging from basic presence to complex integrated indices, and from single attributes to combined variables, reflecting the multidimensional nature of UFGS values. Furthermore, the differing impact mechanisms of various UFGS types on housing prices indicate that the functional positioning and social perception of UFGSs play important roles in their value formation. The synthesized capitalization mechanisms are notably influenced by the underlying political-economic contexts, a critical consideration given the concentration of the literature in specific regions. In state-led and rapid-urbanization systems (e.g., China), large-scale UFGS planning is frequently utilized as a mechanism for land value capture. Public green spaces in these high-density urban environments are highly scarce and often systematically bundled with other premium public infrastructures, resulting in exceptionally high housing price premiums driven by policy expectations. Conversely, in market-oriented systems characterized by lower-density suburban development (e.g., North America), public UFGS capitalization patterns reflect micro-environmental preferences that are often diluted by the substitution effect of abundant private residential gardens.
The widely observed positive effects in the reviewed literature—whereby increased proximity, larger area, enhanced visibility, improved vegetation, greater environmental benefits, and effective planning and management are typically associated with housing price premiums—robustly confirm that the diverse benefits provided by UFGSs, including recreational value, aesthetic pleasure, ecosystem services, health and well-being, and even symbols of social status, are actively recognized and capitalized upon by the market. The finding that most studies demonstrate a significant impact of UFGSs on housing prices inherently highlights the pivotal role of UFGSs in shaping residential value in contemporary urban settings.
However, the equally significant presence of negative impacts identified in the research (accounting for approximately one-third of significant linear impacts) and the progressively revealed non-linear relationships (such as U-shaped or inverted U-shaped curves, constituting 5.00% of total impact groups) demonstrate that the value of UFGSs is not absolute, and its underlying mechanisms are more intricate. Empirical evidence explicitly demonstrates that these anomalous phenomena originate directly from specific negative externalities (disamenities) objectively identified in the literature. Studies confirm that housing markets actively penalize proximity to green spaces burdened by unmitigated noise disturbances, documented safety hazards, or the direct transference of high maintenance costs. This further underscores that one cannot simply equate all “green” elements with “added value” without considering the specific environmental and social context. Grounded in housing Utility Theory and Externality Theory, property prices reflect the marketized valuation of spatial utility. The presence of non-linear patterns (e.g., inverted U-shaped curves) indicates a spatial trade-off between environmental amenities and localized negative externalities. Extreme proximity to specific UFGSs (e.g., within 50 m) often subjects residents to severe disamenities—such as noise, visitor congestion, or compromised privacy—which outweigh the recreational amenities and depress property utility. As distance moderately increases to an optimal buffer zone, these localized disamenities decay faster than the visual amenities, maximizing the price premium before eventually tapering off due to the Law of Diminishing Marginal Utility. Conversely, explicitly negative impacts arise when objectively measured disamenities (e.g., poor maintenance, safety hazards) fundamentally dominate the perceived utility of the property. A U-shaped relationship, conversely, emerges in specific markets or for particular attributes; for instance, the negative perception of park proximity in the lower-priced housing market lessens beyond a certain distance, or the sensitivity to distance in the higher-priced housing market rebounds beyond immediate adjacencies. The identification of these non-linear characteristics signifies a cognitive progression in research, moving from simplistic linear assumptions toward a more nuanced understanding that better accommodates real-world complexities.
Significant social equity issues exist within the impact of UFGSs on housing prices. However, merely critiquing the premium paid by affluent demographics overlooks a fundamental economic reality: if competitive bidding is artificially suppressed, the market mechanism that generates the premium—and economically justifies the green investment—collapses. A more robust theoretical framework resolving this tension relies on the concept of path dependence and durable housing [146]. The pricing of spatial locales is highly path-dependent; areas characterized by older, depreciated housing stocks mechanically filter downward, structurally attracting and retaining lower-income demographics. Therefore, the uneven distribution of UFGS premiums is a specific manifestation of environmental justice issues operating through these underlying, path-dependent housing market dynamics. High-income groups typically possess greater purchasing power and stronger environmental preferences, enabling them to pay more for UFGS premiums. UFGSs in high-end residential areas are often of higher quality and better maintained, thereby generating greater premium effects. Disparities in social capital and political influence lead to an uneven spatial distribution of UFGS resources, further reinforcing this inequality. Furthermore, the moderating effect of social factors such as crime rates on UFGS premiums indicates that the realization of UFGS value is influenced by the broader social environment. In high-crime areas, UFGSs transform from a valuable asset into a liability, a shift that highlights the complex interplay between UFGS value and the social context.
The impact of UFGSs on housing prices exhibits significant spatio-temporal heterogeneity, reflecting the context-dependency of UFGS value. In the spatial dimension, the urbanization gradient effect, socio-economic spatial differentiation, and uneven local responses collectively shape the spatial patterns of UFGS value. In the temporal dimension, project lifecycles, economic cycles, and changes in the policy environment drive the dynamic evolution of UFGS value. The existence of this spatio-temporal heterogeneity indicates that the value of UFGSs is not inherent, but is socially constructed within specific spatio-temporal contexts. In urban core areas, UFGSs hold higher value due to scarcity. In high-end residential areas, UFGSs as a status symbol generate super-premiums. After the completion of a UFGS project, its value often peaks and subsequently declines due to the emergence of negative externalities. Furthermore, the spatio-temporal interaction effect in UFGS impacts on housing prices—meaning the phenomenon where the spatial distribution of UFGS value changes dynamically over time—challenges traditional static research paradigms and underscores the need to adopt dynamic systems thinking to understand the formation and evolution of UFGS value.

4.2. Policy Implications and Development Insights

The research findings confirming the positive capitalization effect of UFGSs on adjacent housing prices reflect market recognition of the ecological, social, and aesthetic values that UFGSs provide. This offers a strong economic rationale for government investment in constructing and maintaining UFGSs; however, approaches should extend beyond a singular focus on UFGS provision to prioritize UFGS quality and comprehensive benefits. This implies that urban planning departments should not only establish and enforce higher standards for UFGS design, construction, and maintenance—emphasizing the integration of ecological, recreational, and aesthetic functions—but also institute long-term management mechanisms to ensure that UFGSs are clean, facilities are in good condition, vegetation is healthy, and public use is safe. For large-scale or specific types of UFGSs that inherently generate noise, pose safety hazards, or lead to the transference of management costs, targeted mitigation strategies are necessary. Additionally, different types of UFGSs should be rationally allocated based on specific urban needs and regional characteristics to achieve functional complementarity and maximize overall benefits.
The housing price effects of UFGSs exhibit significant variations across different urban areas, development stages, and market cycles, necessitating policies that possess spatial sensitivity and temporal dynamism. For instance, in urban core areas characterized by high UFGS scarcity and significant premium effects, policy priorities could focus on tapping the potential of existing UFGSs, enhancing their quality, and promoting open sharing. In suburban areas, conversely, it is necessary to integrate the proactive planning and layout of high-quality, large-scale UFGSs with new area development, paying attention to their synergistic effects with transportation and other infrastructure. Attention must be paid to the full lifecycle impacts of UFGSs, from planning and construction to operation and maintenance. During the project planning phase, potential socio-economic impacts (including on housing prices) should be thoroughly assessed; construction disturbances need to be well-managed during the building phase; and after completion, there should be continuous monitoring of benefit realization and potential negative externalities, with timely adjustments to management strategies. Given that highly attractive green amenities will inevitably be capitalized into land values, enabling higher-income groups to outbid others, policies must be strategically calibrated to avoid green gentrification. Drawing on path dependence theory, state investment directed toward ‘modest’ or ‘just green enough’ UFGS developments in historically depreciated neighborhoods represents a strategic equilibrium. By focusing on essential functional enhancements rather than hyper-amenitized, large-scale aesthetic upgrades, such modest interventions yield profound public health and recreational results for target beneficiaries, without manufacturing the luxury aesthetic signals that trigger aggressive outbidding and undermine the original policy intent. However, planners must realistically acknowledge that market mechanisms frequently outpace planning intentions; highly attractive green amenities will inevitably be capitalized into land values, enabling higher-income groups to outbid others and colonize these spaces from the planning stage. To prevent this market-driven ecological displacement, municipal governments must legally couple UFGS development with strict anti-displacement housing policies, such as rent control and affordable housing preservation. Additionally, adopting “modest” or “just green enough” intervention strategies prioritizes community-specific functional improvements over grand aesthetic upgrades, providing essential environmental benefits without triggering aggressive speculative premiums.

4.3. Research Innovations, Limitations, and Outlook

By systematically reviewing 182 empirical articles, this study constructed a comprehensive analytical framework for UFGS-driven housing prices from four dimensions: UFGS attribute classification, impact effect quantification, social equity analysis, and spatio-temporal heterogeneity exploration. Unlike previous reviews that predominantly focused on methodologies or specific UFGS types, this research not only expanded the sample size, but also more comprehensively identified and classified the diverse UFGS drivers examined in the literature (including, but not limited to, distance or area, but also quality, visibility, landscape patterns, planning and management, and integrated indices). Furthermore, it innovatively conducted quantitative statistical and comprehensive analysis of the significance, direction (positive/negative), and relational form (linear/non-linear) of these factors’ impact on housing prices, thereby revealing the complexity and diversity of UFGS capitalization effects. Additionally, this study innovatively and systematically analyzed the differential impacts of UFGSs on housing prices across various socio-economic groups and their dynamic patterns of change across different urban development stages and spatial units. Through this large-scale, multidimensional systematic synthesis, this research provides a more comprehensive, detailed, and systematic knowledge map for an in-depth understanding of the complex mechanisms by which UFGSs drive housing prices, thereby offering more robust evidentiary support for urban planning and real estate market research.
Although this systematic review strived for comprehensiveness and rigor, some inherent limitations still exist. The possibility of publication bias cannot be entirely ruled out. Studies reporting statistically significant or expected directional impacts of UFGSs on housing prices (e.g., positive impacts) may be more likely to be published than those with non-significant or contrary findings, which could lead to our synthesized results somewhat overestimating the strength or consistency of the effects. While the literature search strategy was systematic, it primarily relied on English-language academic databases (such as Web of Science). This may have led to the omission of important research published in other languages, potentially introducing a degree of database selection bias. The 182 articles included exhibit significant heterogeneity in terms of their geographical contexts (development stages and cultural characteristics of different countries and cities), definitions and measurement methods for UFGSs (e.g., green space types, scale, accessibility calculations, quality indicators), types and sources of housing price data, and the selection and specification of control variables in HPM applications. While this heterogeneity reflects the diversity of research in the field, it also complicates direct comparison and comprehensive analysis, and may limit the generalizability of the conclusions.

4.3.1. Methodological Evolution: From Correlation to Causal Inference

Methodologically, advancing from the demonstration of spatial correlation to the rigorous identification of causality is a critical frontier. The majority of the reviewed literature relies on cross-sectional Hedonic Pricing Models. While these models effectively identify associative trends, they are fundamentally constrained by endogeneity issues and omitted variable bias, such as self-selection mechanisms where wealthier demographics inherently sort into greener neighborhoods. To accurately isolate the net causal treatment effect of UFGSs on property values, the recent literature exhibits a necessary shift towards quasi-experimental designs. Methodologies including Difference-in-Differences (DID) approaches to assess temporal price variations surrounding new park developments, Regression Discontinuity Design (RDD) based on strict spatial boundaries, and the application of Instrumental Variables (IV) are increasingly utilized. Expanding the use of these advanced econometric strategies to control for unobserved confounding factors constitutes a primary methodological priority for future research.

4.3.2. Future Thematic Directions: Depth, Dynamics, and Equity

In the future, research on the relationship between UFGSs and housing prices still has extensive scope for exploration, which can more precisely guide urban planning and policy formulation. In terms of research depth, the focus should shift from single dimensions to a refined consideration of UFGS multidimensional attributes (including quality, ecosystem service functions, landscape perception, etc.) and their complex interaction effects, to deeply understand how different UFGS combinations collectively affect housing prices. Exploration of the spatio-temporal heterogeneity and dynamic evolutionary patterns of impact effects urgently needs strengthening; for example, by using longitudinal data to analyze the long-term impacts of UFGS changes (such as new construction, upgrades, or degradation) on housing prices and comparing differences across various urban development stages and cultural contexts. Crucially, future research should pay greater attention to the social equity dimension, systematically assessing the “green gentrification” phenomenon triggered by UFGSs and their impacts on different income and social groups, and exploring mitigation strategies. Actively integrating multi-source big data from remote sensing, social media, and other avenues to enhance the precision and dynamism of UFGS characterization, and systematically investigating potential negative impacts of UFGSs (such as safety hazards or maintenance cost allocation) as well as non-linear effect thresholds, will provide key insights for formulating more comprehensive and adaptive urban development policies.

5. Conclusions

This systematic review has provided a comprehensive synthesis and critical analysis of the existing literature on the multifaceted ways in which UFGS attributes act as drivers of housing prices. Our extensive review of 182 studies confirms that UFGSs are indeed a significant determinant of residential property values, yet reveals that the nature of this relationship is profoundly complex, multidimensional, and highly context-dependent. The key findings underscore that the impact of UFGSs on housing prices extends far beyond simplistic notions of proximity or quantity. We identified a diverse array of UFGS attributes—ranging from quantity and accessibility to quality, visibility, landscape patterns, and even specific ecological and recreational benefits—that significantly influence housing values. Crucially, this review highlights that the direction and magnitude of these impacts are not universally positive; negative externalities associated with certain UFGS characteristics or poorly maintained green areas can also adversely affect property prices. Furthermore, this research has systematically documented the pervasive influence of spatio-temporal heterogeneity and socio-economic context. The value premium associated with UFGSs varies considerably across different urban forms, geographical locations, economic cycles, and among diverse demographic groups, leading to important social equity implications, including the well-documented phenomenon of “green gentrification”. By systematically mapping these diverse drivers and their varied effects, this review contributes a more nuanced and holistic understanding of the UFGS–housing price nexus than previously available. By integrating housing economic theories with empirical evidence, this review unpacks the dual mechanisms—specifically, the inherent spatial trade-off between green amenities and localized disamenities, as well as the temporal dynamics of risk premiums—that govern UFGS capitalization. Rather than viewing urban green spaces universally as absolute value-adders, this synthesis clarifies the specific mechanisms that generate property premiums and the conditions that trigger market penalties (i.e., what works and what backfires). These structured insights provide a realistic, evidence-based reference for urban planners, policymakers, real estate developers, and environmental managers. They strongly advocate for a shift towards more sophisticated, data-driven, and equitable urban planning and green space management strategies. This includes a deliberate focus on enhancing UFGS quality and diversity, ensuring fair distribution across all communities, and proactively addressing potential socio-economic disparities to maximize the broad societal benefits of urban greening while mitigating unintended negative consequences. Ultimately, understanding and effectively harnessing the power of urban green infrastructure as a driver of housing value is vital for fostering sustainable, resilient, and livable cities for all.

Supplementary Materials

The following supporting information can be downloaded at: https://www.mdpi.com/article/10.3390/f17060650/s1, Figure S1: PRISMA flow diagram of the literature selection, inclusion, and critical appraisal; Table S1: Literature quality assessment criteria; Supplementary Section S1: Methods; Supplementary Section S2: Diverse value embodiments of UFGS in housing price; Supplementary Section S3: Key drivers of UFGS on housing price; Supplementary Section S4: References.

Author Contributions

Conceptualization, H.L.; methodology, H.L. and Y.Z.; software, Y.Z. and Q.Z.; validation, W.L.; formal analysis, Y.Z. and Q.Z.; investigation, Y.Z. and Q.Z.; data curation, Y.Z. and Q.Z.; writing—original draft preparation, H.L.; writing—review and editing, H.L.; visualization, Y.Z. and Q.Z.; supervision, W.L.; project administration, H.L.; funding acquisition, H.L. All authors have read and agreed to the published version of the manuscript.

Funding

This research was funded by National Natural Science Foundation of China, grant number 32371940; Humanities and Social Science Fund of Ministry of Education of China, grant number 23YJCZH119; Priority Academic Program Development of Jiangsu Higher Education Institutions (PAPD).

Data Availability Statement

The data presented in this study are available in the article and Supplementary Materials.

Acknowledgments

During the preparation of this manuscript, the authors used Gemini (version 2.5 Pro) for the purposes of polishing the language. The authors have reviewed and edited the output and take full responsibility for the content of this publication.

Conflicts of Interest

The authors declare no conflicts of interest.

References

  1. Yang, Z.; Fang, H.; Wei, G.; Mo, J.; Gao, X.; Zhang, S. An assessment of urban park accessibility using multi-source data in Hefei, China: A social equity perspective. Land Degrad. Dev. 2024, 35, 3627–3641. [Google Scholar] [CrossRef]
  2. Zhuang, Y.; Xie, D.; Yu, X. Urban Tree Canopy and Environmental Justice: Examining the Distributional Equity of Urban Tree Canopy in Guangzhou, China. Int. J. Environ. Res. Public Health 2023, 20, 4050. [Google Scholar] [CrossRef]
  3. Zang, B.; Lv, P.; Warren, C.M.J. Housing prices, rural–urban migrants’ settlement decisions and their regional differences in China. Habitat Int. 2015, 50, 149–159. [Google Scholar] [CrossRef]
  4. Lan, F.; Zhang, Y. Spatial Autoregressive Model of Commodity Housing Price and Empirical Research. Syst. Eng. Procedia 2011, 1, 206–212. [Google Scholar] [CrossRef]
  5. Wu, G.; Yang, D.; Niu, X.; Mi, Z. The Impact of Park Green Space Areas on Urban Vitality: A Case Study of 35 Large and Medium-Sized Cities in China. Land 2024, 13, 1560. [Google Scholar] [CrossRef]
  6. Li, H.; Wu, Z.F.; Yang, X.R.; An, X.L.; Ren, Y.; Su, J.Q. Urban greenness and plant species are key factors in shaping air microbiomes and reducing airborne pathogens. Environ. Int. 2021, 153, 106539. [Google Scholar] [CrossRef]
  7. Yang, X.; Ye, Q.; Peng, Y.; Liu, S.; Feng, T. Effects of Urban Parks on Housing Prices in the Post-COVID-19 Pandemic Era in China. Land 2024, 13, 519. [Google Scholar] [CrossRef]
  8. Kovacs, K.F. Integrating property value and local recreation models to value ecosystem services from regional parks. Landsc. Urban Plan. 2012, 108, 79–90. [Google Scholar] [CrossRef]
  9. Wen, H.; Zhang, Y.; Zhang, L. Assessing amenity effects of urban landscapes on housing price in Hangzhou, China. Urban For. Urban Green. 2015, 14, 1017–1026. [Google Scholar] [CrossRef]
  10. Tuffery, L. Preferences for forest proximity and recreational amenities revealed by the random bidding model. Landsc. Urban Plan. 2019, 189, 181–188. [Google Scholar] [CrossRef]
  11. Lee, J.-W.; Lee, S.-W.; Kim, H.G.; Jo, H.-K.; Park, S.-R. Green Space and Apartment Prices: Exploring the Effects of the Green Space Ratio and Visual Greenery. Land 2023, 12, 2069. [Google Scholar] [CrossRef]
  12. Zhang, Y.; Zhang, T.; Zeng, Y.; Yu, C.; Zheng, S. The rising and heterogeneous demand for urban green space by Chinese urban residents: Evidence from Beijing. J. Clean. Prod. 2021, 313, 127781. [Google Scholar] [CrossRef]
  13. Feng, S.; Zhuo, Y.; Xu, Z.; Chen, Y.; Li, G.; Wang, X. Nature’s Neighborhood: The Housing Premium of Urban Parks in Dense Cities. Land 2024, 13, 1686. [Google Scholar] [CrossRef]
  14. Rosen, S. Hedonic prices and implicit markets: Product differentiation in pure competition. J. Political Econ. 1974, 82, 34–55. [Google Scholar] [CrossRef]
  15. Waltert, F.; Schläpfer, F. Landscape amenities and local development: A review of migration, regional economic and hedonic pricing studies. Ecol. Econ. 2010, 70, 141–152. [Google Scholar] [CrossRef]
  16. Chen, K.; Lin, H.; You, S.; Han, Y. Review of the impact of urban parks and green spaces on residence prices in the environmental health context. Front. Public Health 2022, 10, 993801. [Google Scholar] [CrossRef]
  17. Chen, Y.; Jones, C.A.; Dunse, N.A.; Li, E.; Liu, Y. Housing Prices and the Characteristics of Nearby Green Space: Does Landscape Pattern Index Matter? Evidence from Metropolitan Area. Land 2023, 12, 496. [Google Scholar] [CrossRef]
  18. Belcher, R.N.; Chisholm, R.A. Tropical Vegetation and Residential Property Value: A Hedonic Pricing Analysis in Singapore. Ecol. Econ. 2018, 149, 149–159. [Google Scholar] [CrossRef]
  19. Li, X.; He, Q.; Huang, W.; Tsim, S.-T.; Qiu, J.-W. Valuation of Urban Parks Under the Three-Level Park System in Shenzhen: A Hedonic Analysis. Land 2025, 14, 182. [Google Scholar] [CrossRef]
  20. Jaung, W.; Carrasco, L.R. Travel cost analysis of an urban protected area and parks in Singapore: A mobile phone data application. J. Environ. Manag. 2020, 261, 110238. [Google Scholar] [CrossRef]
  21. Wu, D.; Wang, S. Environment damage assessment: A literature review using social network analysis. Hum. Ecol. Risk Assess. Int. J. 2017, 24, 904–924. [Google Scholar] [CrossRef]
  22. Duan, L.; Niu, X.; Wang, B. The Urban Park Green Spaces Landscape Premium Functional Value Accounting System: Construction and Application. Sustainability 2024, 16, 612. [Google Scholar] [CrossRef]
  23. Cheung, L.; Fernandez, M.A. Close enough: Housing price effects of urban parks, reserves and volcanic parks in Auckland, New Zealand. Int. J. Hous. Mark. Anal. 2020, 14, 987–1003. [Google Scholar] [CrossRef]
  24. Melichar, J.; Kaprova, K. Revealing preferences of Prague’s homebuyers toward greenery amenities: The empirical evidence of distance-size effect. Landsc. Urban Plan. 2013, 109, 56–66. [Google Scholar] [CrossRef]
  25. Jim, C.Y.; Chen, W.Y. Value of scenic views: Hedonic assessment of private housing in Hong Kong. Landsc. Urban Plan. 2009, 91, 226–234. [Google Scholar] [CrossRef]
  26. Chen, D.; Long, X.; Li, Z.; Liao, C.; Xie, C.; Che, S. Exploring the Determinants of Urban Green Space Utilization Based on Microblog Check-In Data in Shanghai, China. Forests 2021, 12, 1783. [Google Scholar] [CrossRef]
  27. Chen, S.; Zhang, L.; Huang, Y.; Wilson, B.; Mosey, G.; Deal, B. Spatial impacts of multimodal accessibility to green spaces on housing price in Cook County, Illinois. Urban For. Urban Green. 2022, 67, 127370. [Google Scholar] [CrossRef]
  28. Vuletic, D.; Benko, M.; Dubravac, T.; Krajter, S.; Novotny, V.; Indir, K.; Balenovic, I. Review of nonmarket forest goods and services evaluation methods. Period. Biol. 2009, 111, 515–521. [Google Scholar]
  29. Reeves, T.; Mei, B.; Bettinger, P.; Siry, J. Review of the Effects of Conservation Easements on Surrounding Property Values. J. For. 2018, 116, 555–562. [Google Scholar] [CrossRef]
  30. Ewane, E.B.; Bajaj, S.; Velasquez-Camacho, L.; Srinivasan, S.; Maeng, J.; Singla, A.; Luber, A.; de-Miguel, S.; Richardson, G.; Broadbent, E.N.; et al. Influence of urban forests on residential property values: A systematic review of remote sensing-based studies. Heliyon 2023, 9, e20408. [Google Scholar] [CrossRef]
  31. Yoo, S.; Wagner, J.E. A review of the hedonic literatures in environmental amenities from open space: A traditional econometric vs. spatial econometric model. Int. J. Urban Sci. 2016, 20, 141–166. [Google Scholar] [CrossRef]
  32. Crompton, J.L.; Nicholls, S. The Impact of Park Views on Property Values. Leis. Sci. 2022, 44, 1099–1111. [Google Scholar] [CrossRef]
  33. Tian, S.-F.; Lin, C.-W.; Wang, J.-C.; Zhong, B.-Y.; Jiang, J.-A.; Wu, Y.-F.; Leu, S.-W.; Nee, T.-E. Lie symmetry analysis of the effects of urban infrastructures on residential property values. PLoS ONE 2021, 16, e0255233. [Google Scholar] [CrossRef]
  34. Zhang, L.; Zhou, T.; Mao, C. Does the Difference in Urban Public Facility Allocation Cause Spatial Inequality in Housing Prices? Evidence from Chongqing, China. Sustainability 2019, 11, 6096. [Google Scholar] [CrossRef]
  35. Bark, R.H.; Osgood, D.E.; Colby, B.G.; Halper, E.B. How Do Homebuyers Value Different Types of Green Space? J. Agric. Resour. Econ. 2011, 36, 395–415. [Google Scholar]
  36. Kovacs, K.; Holmes, T.P.; Englin, J.E.; Alexander, J. The Dynamic Response of Housing Values to a Forest Invasive Disease: Evidence from a Sudden Oak Death Infestation. Environ. Resour. Econ. 2011, 49, 445–471. [Google Scholar] [CrossRef]
  37. Liu, L.B.; Yu, H.C.; Zhao, J.; Wu, H.; Peng, Z.H.; Wang, R. Multiscale Effects of Multimodal Public Facilities Accessibility on Housing Prices Based on MGWR: A Case Study of Wuhan, China. ISPRS Int. J. Geo-Inf. 2022, 11, 57. [Google Scholar] [CrossRef]
  38. Donovan, G.H.; Landry, S.; Winter, C. Urban trees, house price, and redevelopment pressure in Tampa, Florida. Urban For. Urban Green. 2019, 38, 330–336. [Google Scholar] [CrossRef]
  39. Heckert, M.; Mennis, J. The economic impact of greening urban vacant land: A spatial difference-in-differences analysis. Environ. Plan. A 2012, 44, 3010–3027. [Google Scholar] [CrossRef]
  40. Tong, D.; Shen, Y.; Wang, X.; Sun, Y.; MacLachlan, I.; Li, X. From Proximity to Quality: The Capitalization of Public Facilities into Housing Prices. Ann. Am. Assoc. Geogr. 2023, 113, 2435–2455. [Google Scholar] [CrossRef]
  41. Lancaster, K.J. A New Approach to Consumer Theory. J. Political Econ. 1966, 74, 132–157. [Google Scholar] [CrossRef]
  42. Lautrup, M.; Panduro, T.E.; Olsen, J.V.; Pedersen, M.F.; Jacobsen, J.B. Is there more to trees than timber? Estimating the private amenity value of forests using a hedonic land model for combined agricultural properties. For. Policy Econ. 2023, 146, 102867. [Google Scholar] [CrossRef]
  43. Czembrowski, P.; Kronenberg, J.; Czepkiewicz, M. Integrating non-monetary and monetary valuation methods—SoftGIS and hedonic pricing. Ecol. Econ. 2016, 130, 166–175. [Google Scholar] [CrossRef]
  44. Dell’Anna, F.; Bravi, M.; Bottero, M. Urban Green infrastructures: How much did they affect property prices in Singapore? Urban For. Urban Green. 2022, 68, 127475. [Google Scholar] [CrossRef]
  45. Du, X.J.; Huang, Z.H. Spatial and temporal effects of urban wetlands on housing prices: Evidence from Hangzhou, China. Land Use Policy 2018, 73, 290–298. [Google Scholar] [CrossRef]
  46. Hu, Z.W.; Kobori, H.; Swallow, B.; Qiu, F. Willingness to pay for multiple dimensions of green open space: Applying a spatial hedonic approach. Can. J. Agr. Econ. 2022, 70, 179–201. [Google Scholar] [CrossRef]
  47. Laszkiewicz, E.; Czembrowski, P.; Kronenberg, J. Can proximity to urban green spaces be considered a luxury? Classifying a non-tradable good with the use of hedonic pricing method. Ecol. Econ. 2019, 161, 237–247. [Google Scholar] [CrossRef]
  48. Wen, H.Z.; Li, S.Y.; Hui, E.C.M.; Jia, S.J.; Cui, W.J. Purchase Motivation, Landscape Preference, and Housing Prices: Quantile Hedonic Analysis in Guangzhou, China. J. Urban Plan. Dev. 2021, 147, 04021033. [Google Scholar] [CrossRef]
  49. Xiao, Y.; Lu, Y.; Guo, Y.; Yuan, Y. Estimating the willingness to pay for green space services in Shanghai: Implications for social equity in urban China. Urban For. Urban Green. 2017, 26, 95–103. [Google Scholar] [CrossRef]
  50. Zhang, T.; Zeng, Y.; Zhang, Y.; Song, Y.; Li, H. The Heterogenous Demand for Urban Parks between Home Buyers and Renters: Evidence from Beijing. Sustainability 2020, 12, 9058. [Google Scholar] [CrossRef]
  51. Zhou, K.H.; Song, Y.; Tan, R.H. Public perception matters: Estimating homebuyers’ willingness to pay for urban park quality. Urban For. Urban Green. 2021, 64, 127275. [Google Scholar] [CrossRef]
  52. Hiebert, J.; Allen, K. Valuing Environmental Amenities across Space: A Geographically Weighted Regression of Housing Preferences in Greenville County, SC. Land 2019, 8, 147. [Google Scholar] [CrossRef]
  53. Panduro, T.E.; Jensen, C.U.; Lundhede, T.H.; von Graevenitz, K.; Thorsen, B.J. Eliciting preferences for urban parks. Reg. Sci. Urban. Econ. 2018, 73, 127–142. [Google Scholar] [CrossRef]
  54. Jensen, C.U.; Panduro, T.E.; Lundhede, T.H.; von Graevenitz, K.; Thorsen, B.J. Who demands peri-urban nature? A second stage hedonic house price estimation of household’s preference for peri-urban nature. Landsc. Urban Plan. 2021, 207, 104016. [Google Scholar] [CrossRef]
  55. Ramírez-Juidías, E.; Amaro-Mellado, J.-L.; Leiva-Piedra, J.L. Influence of the Urban Green Spaces of Seville (Spain) on Housing Prices through the Hedonic Assessment Methodology and Geospatial Analysis. Sustainability 2022, 14, 6613. [Google Scholar] [CrossRef]
  56. Roebeling, P.; Saraiva, M.; Palla, A.; Gnecco, I.; Teotónio, C.; Fidelis, T.; Martins, F.; Alves, H.; Rocha, J. Assessing the socio-economic impacts of green/blue space, urban residential and road infrastructure projects in the Confluence (Lyon): A hedonic pricing simulation approach. J. Environ. Plan. Manag. 2016, 60, 482–499. [Google Scholar] [CrossRef]
  57. Jia, J.; Zhang, X.Q. A human-scale investigation into economic benefits of urban green and blue infrastructure based on big data and machine learning: A case study of Wuhan. J. Clean. Prod. 2021, 316, 128321. [Google Scholar] [CrossRef]
  58. Ma, Y.X.; Gopal, S. Geographically Weighted Regression Models in Estimating Median Home Prices in Towns of Massachusetts Based on an Urban Sustainability Framework. Sustainability 2018, 10, 1026. [Google Scholar] [CrossRef]
  59. Wu, C.; Du, Y.; Li, S.; Liu, P.; Ye, X. Does visual contact with green space impact housing pricesʔ An integrated approach of machine learning and hedonic modeling based on the perception of green space. Land Use Policy 2022, 115, 106048. [Google Scholar] [CrossRef]
  60. Parton, L.C. Measuring the effects of public land use change: An analysis of greenways in Raleigh, North Carolina. Land Use Policy 2023, 131, 106689. [Google Scholar] [CrossRef]
  61. Tuofu, H.; Qingyun, H.; Xiao, O. The Capitalization Effect of Natural Amenities on Housing Price in Urban China: New Evidence From Changsha. Front. Environ. Sci. 2022, 10, 833831. [Google Scholar] [CrossRef]
  62. Liu, T.; Hu, W.Y.; Song, Y.; Zhang, A.L. Exploring spillover effects of ecological lands: A spatial multilevel hedonic price model of the housing market in Wuhan, China. Ecol. Econ. 2020, 170, 106568. [Google Scholar] [CrossRef]
  63. Mei, Y.D.; Sohngen, B.; Babb, T. Valuing urban wetland quality with hedonic price model. Ecol. Indic. 2018, 84, 535–545. [Google Scholar] [CrossRef]
  64. Pandit, R.; Polyakov, M.; Sadler, R. Valuing public and private urban tree canopy cover. Aust. J. Agric. Resour. Econ. 2014, 58, 453–470. [Google Scholar] [CrossRef]
  65. Chen, L.J.; Yao, X.J.; Liu, Y.L.; Zhu, Y.J.; Chen, W.; Zhao, X.Z.; Chi, T.H. Measuring Impacts of Urban Environmental Elements on Housing Prices Based on Multisource Data-A Case Study of Shanghai, China. ISPRS Int. J. Geo-Inf. 2020, 9, 106. [Google Scholar] [CrossRef]
  66. Lin, D.S.; Jensen, S.T.; Wachter, S.M. The price effects of greening vacant lots: How neighborhood attributes matter. Real Estate Econ. 2022, 51, 573–610. [Google Scholar] [CrossRef]
  67. Bajari, P.; Benkard, C.L. Demand Estimation with Heterogeneous Consumers and Unobserved Product Characteristics: A Hedonic Approach. J. Political Econ. 2005, 113, 1239–1276. [Google Scholar] [CrossRef]
  68. Trojanek, R.; Gluszak, M.; Tanas, J. The Effect of Urban Green Spaces on House Prices in Warsaw. Int. J. Strateg. Prop. Manag. 2018, 22, 358–371. [Google Scholar] [CrossRef]
  69. Tapsuwan, S.; MacDonald, D.H.; King, D.; Poudyal, N. A combined site proximity and recreation index approach to value natural amenities: An example from a natural resource management region of Murray-Darling Basin. J. Environ. Manag. 2012, 94, 69–77. [Google Scholar] [CrossRef]
  70. Anthon, S. The value of urban afforestation: A hedonic pricing case. Recent Accompl. Appl. For. Econ. Res. 2003, 74, 81–90. [Google Scholar]
  71. Turner, T.M.; Seo, Y. House Prices, Open Space, and Household Characteristics. J. Real Estate Res. 2021, 43, 204–225. [Google Scholar] [CrossRef]
  72. Fan, Q.; Hansz, J.A.; Yang, X.M. The Pricing Effects of Open Space Amenities. J. Real Estate Financ. Econ. 2016, 52, 244–271. [Google Scholar] [CrossRef]
  73. Daams, M.N.; Sijtsma, F.J.; Veneri, P. Mixed monetary and non-monetary valuation of attractive urban green space: A case study using Amsterdam house prices. Ecol. Econ. 2019, 166, 106430. [Google Scholar] [CrossRef]
  74. Troy, A.; Grove, J.M. Property values, parks, and crime: A hedonic analysis in Baltimore, MD. Landsc. Urban Plan. 2008, 87, 233–245. [Google Scholar] [CrossRef]
  75. Soltani, A.; Zali, N.; Mirzaei, R.; Heydari, M.; Rahimi, A.; Hamidi, A. Multilevel Impacts of Urban Amenities on Housing Price in Tehran, Iran. J. Urban Plan. Dev. 2023, 149, 05023028. [Google Scholar] [CrossRef]
  76. Tsai, H.; Huang, W.J.; Li, Y. The Impact of Tourism Resources on Tourism Real Estate Value. Asia Pac. J. Tour. Res. 2016, 21, 1114–1125. [Google Scholar] [CrossRef]
  77. Leonard, T.; Zhang, L.; Hoehner, C. Variations in Park Facility Valuations across Neighborhoods. Appl. Spat. Anal. Policy 2015, 8, 45–67. [Google Scholar] [CrossRef]
  78. Du, M.B.; Zhang, X.L. Urban greening: A new paradox of economic or social sustainability? Land Use Policy 2020, 92, 104487. [Google Scholar] [CrossRef]
  79. Walls, M.; Kousky, C.; Chu, Z.Y. Is What You See What You Get? The Value of Natural Landscape Views. Land Econ. 2015, 91, 1–19. [Google Scholar] [CrossRef]
  80. Zhu, J.; Gong, Y.; Liu, C.; Du, J.; Song, C.; Chen, J.; Pei, T. Assessing the Effects of Subjective and Objective Measures on Housing Prices with Street View Imagery: A Case Study of Suzhou. Land 2023, 12, 2095. [Google Scholar] [CrossRef]
  81. Sylla, M.; Lasota, T.; Szewranski, S. Valuing Environmental Amenities in Peri-Urban Areas: Evidence from Poland. Sustainability 2019, 11, 570. [Google Scholar] [CrossRef]
  82. Xu, L.Y.; You, H.; Li, D.H.; Yu, K.J. Urban green spaces, their spatial pattern, and ecosystem service value: The case of Beijing. Habitat Int. 2016, 56, 84–95. [Google Scholar] [CrossRef]
  83. Kim, J.H.; Li, W.; Newman, G.; Kil, S.H.; Park, S.Y. The influence of urban landscape spatial patterns on single-family housing prices. Environ. Plan. B-Urban Anal. City Sci. 2018, 45, 26–43. [Google Scholar] [CrossRef]
  84. Kong, F.; Yin, H.; Nakagoshi, N. Using GIS and landscape metrics in the hedonic price modeling of the amenity value of urban green space: A case study in Jinan City, China. Landsc. Urban Plan. 2007, 79, 240–252. [Google Scholar] [CrossRef]
  85. Li, H.; Wei, Y.D.; Yu, Z.; Tian, G. Amenity, accessibility and housing values in metropontan USA: A study of salt Lake county, utah. Cities 2016, 59, 113–125. [Google Scholar] [CrossRef]
  86. Wu, J.S.; Wang, M.J.; Li, W.F.; Peng, J.; Huang, L. Impact of Urban Green Space on Residential Housing Prices: Case Study in Shenzhen. J. Urban Plan. Dev. 2015, 141, 05014023. [Google Scholar] [CrossRef]
  87. Netusil, N.R.; Levin, Z.; Shandas, V.; Hart, T. Valuing green infrastructure in Portland, Oregon. Landsc. Urban Plan. 2014, 124, 14–21. [Google Scholar] [CrossRef]
  88. Sharma, V.R. Forest proximity and residential land values. J. For. Econ. 2013, 19, 78–86. [Google Scholar] [CrossRef]
  89. Liu, L.; Meng, L.; Zhang, R. Does Easy Accessibility to Urban Parks Always Raise Home Values? J. Hous. Econ. 2024, 63, 101981. [Google Scholar] [CrossRef]
  90. Xiao, Y.; Hui, E.C.M.; Wen, H.Z. Effects of floor level and landscape proximity on housing price: A hedonic analysis in Hangzhou, China. Habitat Int. 2019, 87, 11–26. [Google Scholar] [CrossRef]
  91. Votsis, A. Planning for green infrastructure: The spatial effects of parks, forests, and fields on Helsinki’s apartment prices. Ecol. Econ. 2017, 132, 279–289. [Google Scholar] [CrossRef]
  92. Payton, S.B.; Ottensmann, J.R. The implicit price of urban public parks and greenways: A spatial-contextual approach. J. Environ. Plan. Manag. 2015, 58, 495–512. [Google Scholar] [CrossRef]
  93. Sachs, A.L.; Boag, A.E.; Troy, A. Valuing urban trees: A hedonic investigation into tree canopy influence on property values across environmental and social contexts in Baltimore, Maryland. Urban For. Urban Green. 2023, 80, 127829. [Google Scholar] [CrossRef]
  94. Xiao, Y.; Li, Z.; Webster, C. Estimating the mediating effect of privately-supplied green space on the relationship between urban public green space and property value: Evidence from Shanghai, China. Land Use Policy 2016, 54, 439–447. [Google Scholar] [CrossRef]
  95. Saphores, J.D.; Li, W. Estimating the value of urban green areas: A hedonic pricing analysis of the single family housing market in Los Angeles, CA. Landsc. Urban Plan. 2012, 104, 373–387. [Google Scholar] [CrossRef]
  96. Holt, J.R.; Borsuk, M.E. Using Zillow data to value green space amenities at the neighborhood scale. Urban For. Urban Green. 2020, 56, 126794. [Google Scholar] [CrossRef]
  97. Fernandez, L.; Mukherjee, M.; Scott, T. The effect of conservation policy and varied open space on residential property values: A dynamic hedonic analysis. Land Use Policy 2018, 73, 480–487. [Google Scholar] [CrossRef]
  98. Tian, D.; Wang, J.; Xia, C.; Zhang, J.; Zhou, J.; Tian, Z.; Zhao, J.; Li, B.; Zhou, C. The relationship between green space accessibility by multiple travel modes and housing prices: A case study of Beijing. Cities 2024, 145, 104694. [Google Scholar] [CrossRef]
  99. Tuffery, L. The recreational services value of the nearby periurban forest versus the regional forest environment. J. For. Econ. 2017, 28, 33–41. [Google Scholar] [CrossRef]
  100. Wu, L.; Rowe, P.G. Green space progress or paradox: Identifying green space associated gentrification in Beijing. Landsc. Urban Plan. 2022, 219, 104321. [Google Scholar] [CrossRef]
  101. Jim, C.Y.; Chen, W.Y. Impacts of urban environmental elements on residential housing prices in Guangzhou (China). Landsc. Urban Plan. 2006, 78, 422–434. [Google Scholar] [CrossRef]
  102. Wu, C.; Ye, X.; Du, Q.; Luo, P. Spatial effects of accessibility to parks on housing prices in Shenzhen, China. Habitat Int. 2017, 63, 45–54. [Google Scholar] [CrossRef]
  103. Soltani, A.; Pettit, C.J.; Heydari, M.; Aghaei, F. Housing price variations using spatio-temporal data mining techniques. J. Hous. Built Environ. 2021, 36, 1199–1227. [Google Scholar] [CrossRef]
  104. Jiao, L.M.; Liu, Y.L. Geographic Field Model based hedonic valuation of urban open spaces in Wuhan, China. Landsc. Urban Plan. 2010, 98, 47–55. [Google Scholar] [CrossRef]
  105. Glaesener, M.L.; Caruso, G. Neighborhood green and services diversity effects on land prices: Evidence from a multilevel hedonic analysis in Luxembourg. Landsc. Urban Plan. 2015, 143, 100–111. [Google Scholar] [CrossRef]
  106. Czembrowski, P.; Laszkiewicz, E.; Kronenberg, J.; Engstrom, G.; Andersson, E. Valuing individual characteristics and the multifunctionality of urban green spaces: The integration of sociotope mapping and hedonic pricing. PLoS ONE 2019, 14, e0212277. [Google Scholar] [CrossRef]
  107. Liang, X.J.; Liu, Y.L.; Qiu, T.Q.; Jing, Y.; Fang, F.G. The effects of locational factors on the housing prices of residential communities: The case of Ningbo, China. Habitat Int. 2018, 81, 1–11. [Google Scholar] [CrossRef]
  108. Ardeshiri, A.; Ardeshiri, M.; Radfar, M.; Shormasty, O.H. The values and benefits of environmental elements on housing rents. Habitat Int. 2016, 55, 67–78. [Google Scholar] [CrossRef]
  109. Panduro, T.E.; Veie, K.L. Classification and valuation of urban green spaces—A hedonic house price valuation. Landsc. Urban Plan. 2013, 120, 119–128. [Google Scholar] [CrossRef]
  110. Zhang, Y.L.; Dong, R.C. Impacts of Street-Visible Greenery on Housing Prices: Evidence from a Hedonic Price Model and a Massive Street View Image Dataset in Beijing. ISPRS Int. J. Geo-Inf. 2018, 7, 104. [Google Scholar] [CrossRef]
  111. Zhang, Y.; Fu, X.; Lv, C.; Li, S. The Premium of Public Perceived Greenery: A Framework Using Multiscale GWR and Deep Learning. Int. J. Environ. Res. Public Health 2021, 18, 6809. [Google Scholar] [CrossRef] [PubMed]
  112. Peng, C.C.; Xiang, Y.; Chen, L.X.; Zhang, Y.Y.; Zhou, Z.X. The Impact of the Type and Abundance of Urban Blue Space on House Prices: A Case Study of Eight Megacities in China. Land 2023, 12, 865. [Google Scholar] [CrossRef]
  113. Mansfield, C.; Pattanayak, S.K.; McDow, W.; McDonald, R.; Halpin, P. Shades of Green: Measuring the value of urban forests in the housing market. J. For. Econ. 2005, 11, 177–199. [Google Scholar] [CrossRef]
  114. Cho, S.H.; Kim, S.G.; Roberts, R.K.; Jung, S. Amenity values of spatial configurations of forest landscapes over space and time in the Southern Appalachian Highlands. Ecol. Econ. 2009, 68, 2646–2657. [Google Scholar] [CrossRef]
  115. Cho, S.H.; Kim, T.; Roberts, R.K.; Hellwinckel, C.; Kim, S.G.; Wilson, B. Developing an amenity value calculator for urban forest landscapes. Comput. Environ. Urban Syst. 2014, 43, 34–41. [Google Scholar] [CrossRef]
  116. Mandic, A.; Petric, L. The impacts of location and attributes of protected natural areas on hotel prices: Implications for sustainable tourism development. Environ. Dev. Sustain. 2021, 23, 833–863. [Google Scholar] [CrossRef]
  117. Yasumoto, S.; Jones, A.; Shimizu, C. Longitudinal trends in equity of park accessibility in Yokohama, Japan: An investigation into the role of causal mechanisms. Environ. Plan. A-Econ. Space 2014, 46, 682–699. [Google Scholar] [CrossRef]
  118. Cui, N.N.; Gu, H.Y.; Shen, T.Y.; Feng, C.C. The Impact of Micro-Level Influencing Factors on Home Value: A Housing Price-Rent Comparison. Sustainability 2018, 10, 4343. [Google Scholar] [CrossRef]
  119. Jun, M.J.; Kim, H.J. Measuring the effect of greenbelt proximity on apartment rents in Seoul. Cities 2017, 62, 10–22. [Google Scholar] [CrossRef]
  120. Jiang, L.; Hagen-Zanker, A.; Kumar, P.; Pritchard, J. Equity in job accessibility and environmental quality in a segmented housing market: The case of Greater London. J. Transp. Geogr. 2021, 90, 102908. [Google Scholar] [CrossRef]
  121. Chen, Y.; Yue, W.; La Rosa, D. Which communities have better accessibility to green space? An investigation into environmental inequality using big data. Landsc. Urban Plan. 2020, 204, 103919. [Google Scholar] [CrossRef]
  122. Seo, Y. Varying Effects of Urban Tree Canopies on Residential Property Values across Neighborhoods. Sustainability 2020, 12, 4331. [Google Scholar] [CrossRef]
  123. Li, W.; Saphores, J.D.M.; Gillespie, T.W. A comparison of the economic benefits of urban green spaces estimated with NDVI and with high-resolution land cover data. Landsc. Urban Plan. 2015, 133, 105–117. [Google Scholar] [CrossRef]
  124. Tuofu, H.; Qingyun, H.; Dongxiao, Y.; Xiao, O.Y. Evaluating the Impact of Urban Blue Space Accessibility on Housing Price: A Spatial Quantile Regression Approach Applied in Changsha, China. Front. Environ. Sci. 2021, 9, 696626. [Google Scholar] [CrossRef]
  125. Li, H.; Wei, Y.D.; Wu, Y.Y.; Tian, G. Analyzing housing prices in Shanghai with open data: Amenity, accessibility and urban structure. Cities 2019, 91, 165–179. [Google Scholar] [CrossRef]
  126. Liebelt, V.; Bartke, S.; Schwarz, N. Revealing Preferences for Urban Green Spaces: A Scale-sensitive Hedonic Pricing Analysis for the City of Leipzig. Ecol. Econ. 2018, 146, 536–548. [Google Scholar] [CrossRef]
  127. Sander, H.A.; Haight, R.G. Estimating the economic value of cultural ecosystem services in an urbanizing area using hedonic pricing. J. Environ. Manag. 2012, 113, 194–205. [Google Scholar] [CrossRef] [PubMed]
  128. Gibbons, S.; Mourato, S.; Resende, G.M. The Amenity Value of English Nature: A Hedonic Price Approach. Environ. Resour. Econ. 2014, 57, 175–196. [Google Scholar] [CrossRef]
  129. Albouy, D.; Christensen, P.; Sarmiento-Barbieri, I. Unlocking amenities: Estimating public good complementarity. J. Public. Econ. 2020, 182, 104110. [Google Scholar] [CrossRef]
  130. Doll, C.; Polyakov, M.; Pannell, D.J.; Burton, M.P. Rethinking urban park irrigation under climate change. J. Environ. Manag. 2022, 314, 115012. [Google Scholar] [CrossRef]
  131. Schlapfer, F.; Waltert, F.; Segura, L.; Kienast, F. Valuation of landscape amenities: A hedonic pricing analysis of housing rents in urban, suburban and periurban Switzerland. Landsc. Urban Plan. 2015, 141, 24–40. [Google Scholar] [CrossRef]
  132. Li, H.; Chen, P.; Grant, R. Built environment, special economic zone, and housing prices in Shenzhen, China. Appl. Geogr. 2021, 129, 102429. [Google Scholar] [CrossRef]
  133. Zhang, Y.T.; Wang, S.M.; Ma, Y.W.; Peng, C.; Qu, M.P.; Xu, A.; Xing, X.J.; Yin, W.D. Value-added Benefits of Green Space: A Systematic Analysis of the Relationship between Urban Green Space and Commercial House Prices in Beijing Based on Remote Sensing Technology. Sens. Mater. 2022, 34, 4247–4262. [Google Scholar] [CrossRef]
  134. Su, S.; He, S.; Sun, C.; Zhang, H.; Hu, L.; Kang, M. Do landscape amenities impact private housing rental prices? A hierarchical hedonic modeling approach based on semantic and sentimental analysis of online housing advertisements across five Chinese megacities. Urban For. Urban Green. 2021, 58, 126968. [Google Scholar] [CrossRef]
  135. Cho, S.H.; Bowker, J.M.; Park, W.M. Measuring the contribution of water and green space amenities to housing values; An application and comparison of spatially weighted hedonic models. J. Agric. Resour. Econ. 2006, 31, 485–507. [Google Scholar]
  136. Wang, B.; He, S.K.; Ma, W.W. Does Park Size Affect Green Gentrification? Insights from Chongqing, China. Sustainability 2022, 14, 9916. [Google Scholar] [CrossRef]
  137. Jung, E.; Choi, Y.; Yoon, H. The impact of the Gyeongui Line Park project on residential property values in Seoul, Korea. Habitat Int. 2016, 58, 108–117. [Google Scholar] [CrossRef]
  138. Xu, H.Y.; Fu, F.; Miao, M. What Is the Effect of Cultural Greenway Projects in High-Density Urban Municipalities? Assessing the Public Living Desire near the Cultural Greenway in Central Beijing. Int. J. Environ. Res. Public Health 2022, 19, 2147. [Google Scholar] [CrossRef]
  139. Yoon, H. When and where do we see the proximity effect of a new park?-A case study of the Dream Forest in Seoul, Korea. J. Environ. Plan. Manag. 2018, 61, 1113–1136. [Google Scholar] [CrossRef]
  140. Kim, H.-S.; Lee, G.-E.; Lee, J.-S.; Choi, Y. Understanding the local impact of urban park plans and park typology on housing price: A case study of the Busan metropolitan region, Korea. Landsc. Urban Plan. 2019, 184, 1–11. [Google Scholar] [CrossRef]
  141. Black, K.J.; Richards, M. Eco-gentrification and who benefits from urban green amenities: NYC’s high Line. Landsc. Urban Plan. 2020, 204, 103900. [Google Scholar] [CrossRef]
  142. Tapsuwan, S.; Polyakov, M. Correctly Specifying Environmental Assets in Spatial Hedonic Pricing Models. Soc. Nat. Resour. 2016, 29, 233–249. [Google Scholar] [CrossRef]
  143. Kim, J.; Park, J.; Yoon, D.K.; Cho, G.H. Amenity or hazard? The effects of landslide hazard on property value in Woomyeon Nature Park area, Korea. Landsc. Urban Plan. 2017, 157, 523–531. [Google Scholar] [CrossRef]
  144. Kuroda, Y.; Sugasawa, T. The Value of Scattered Greenery in Urban Areas: A Hedonic Analysis in Japan. Environ. Resour. Econ. 2023, 85, 523–586. [Google Scholar] [CrossRef]
  145. Irwin, N.B.; Klaiber, H.A.; Irwin, E.G. Do Stormwater Basins Generate co-Benefits? Evidence from Baltimore County, Maryland. Ecol. Econ. 2017, 141, 202–212. [Google Scholar] [CrossRef]
  146. Glaeser, E.L.; Gyourko, J. Urban decline and durable housing. J. Political Econ. 2005, 113, 345–375. [Google Scholar] [CrossRef]
Figure 1. Framework for deconstructing and classifying the effects of UFGSs on housing prices from the literature. Abbreviation: UFGS, urban forests and green space; HP, housing price.
Forests 17 00650 g001
Figure 2. Quantitative synthesis of the literature on UFGS–housing price relationships. (a) Classification and prevalence of impact types. (b) Research focus distribution across different UFGS driver categories.
Forests 17 00650 g002
Figure 3. Literature distributions of UFGS–housing price relationships by attributes, pricing types, equity methods, and spatiotemporal heterogeneity. Abbreviation: UFGS, urban forests and green space.
Forests 17 00650 g003
Figure 4. Significance and direction of key UFGS attributes impacts on housing prices. (a) Proximity and impact distance; (b) UFGS presence; (c) UFGS quantity; (d) visibility indicators; (e) vegetation indicators; (f) landscape ecological indicators; (g) environmental benefits; (h) UFGS management quality and facility provision; (i) composite variables; (j) integrated indices. Abbreviation: UFGS, usrban forests and green space.
Forests 17 00650 g004
Figure 5. Article numbers of UFGS–housing price effects by spatial, temporal, and spatio-temporal dimensions.
Forests 17 00650 g005
Disclaimer/Publisher’s Note: The statements, opinions and data contained in all publications are solely those of the individual author(s) and contributor(s) and not of MDPI and/or the editor(s). MDPI and/or the editor(s) disclaim responsibility for any injury to people or property resulting from any ideas, methods, instructions or products referred to in the content.