Article

Production Trends and Portfolio Diversity of Non-Timber Forest Resources Under State-Controlled Forest Governance


by
Hasan Tezcan Yıldırım
1,
Pınar Topçu
2,
Özlem Yavuz
3,
Nilay Tulukcu Yıldızbaş
4,
Dalia Perkumienė
5,*,
Mindaugas Škėma
5,
Marius Aleinikovas
5 and
Benas Šilinskas
5
1
Department of Forest Engineering, Forest Policy and Administration Division, Faculty of Forestry, Istanbul University-Cerrahpaşa, 34473 Istanbul, Türkiye
2
Strategy and Budget Office, Department of Agricultural State Aid, 06560 Ankara, Türkiye
3
General Directorate of Nature Conservation and National Parks, Ministry of Agriculture and Forestry, 06560 Ankara, Türkiye
4
Department of Forest Engineering, Environment and Forestry Law Division, Faculty of Forestry, Istanbul University-Cerrahpaşa, 34473 Istanbul, Türkiye
5
Institute of Forestry, Lithuanian Research Centre for Agriculture and Forestry, 44221 Kaunas, Lithuania
*
Author to whom correspondence should be addressed.
Forests 2026, 17(5), 619; https://doi.org/10.3390/f17050619
Submission received: 31 March 2026 / Revised: 14 May 2026 / Accepted: 15 May 2026 / Published: 20 May 2026
(This article belongs to the Section Forest Economics, Policy, and Social Science)

Abstract

Non-timber forest products (NTFPs) constitute an important component of forest-based production systems and biomass supply chains in Türkiye. Despite their growing economic and ecological significance, the long-term structural dynamics of NTFP production remain insufficiently understood. This study examines temporal and structural changes in NTFP production in Türkiye during the period 1988–2024 using official production statistics and production support data. The analysis applies a quantitative framework that combines linear trend analysis, Shannon diversity and Herfindahl–Hirschman concentration indices, volatility measures based on the coefficient of variation, and regression models to evaluate production trends, structural transformations, stabilization patterns, and the effectiveness of production support mechanisms. The findings reveal a non-linear and multi-phase development pattern characterized by diversification and production growth after 2000, followed by increasing concentration and greater production volatility after 2018. Although total production volume increased substantially, portfolio diversity declined over time, and dependence on a limited number of high-volume products intensified, indicating growing structural vulnerability within the system. In addition, production support mechanisms showed a weak and heterogeneous relationship with production outcomes. A limited contextual comparison with Lithuania’s multifunctional NTFP system is also included to position the findings within a broader European context. Overall, the results suggest that increasing production alone is insufficient to ensure long-term system stability. Instead, diversification-oriented and risk-sensitive resource management strategies that account for production risks, regional disparities, and product heterogeneity are essential for developing sustainable and resilient NTFP production systems.

1. Introduction

Non-timber forest products (NTFPs) are generally defined as biological products harvested from forest ecosystems, including wild fruits, nuts, mushrooms, medicinal and aromatic plants, and labdanum (+resin) [1,2,3]. Wood-based products such as pulp and paper are excluded because they fall outside the standard definition of NTFPs. To avoid conceptual overlap and maintain analytical consistency, wood-based and livestock-derived products are not included within the scope of this study. The conceptual boundaries of NTFPs have varied across the literature over time, particularly regarding the inclusion or exclusion of fuelwood and livestock-derived forest products [4,5]. In recent decades, the concept of NTFPs has gained increasing attention in both scientific research and forestry and rural development policies. Although forests have traditionally been valued primarily for timber production, growing emphasis has been placed on the wide range of non-wood goods they provide, particularly those contributing to biodiversity conservation, rural livelihoods, and sustainable economic activities [6].
In this study, the term non-timber forest products (NTFPs) are used in a narrow sense, referring specifically to non-wood biological products derived from forest ecosystems, consistent with the definition provided by the Food and Agriculture Organization of the United Nations (FAO) [7]. Accordingly, the study focuses on non-wood biological forest products such as bay leaf, chestnut, and thyme, while timber, fuelwood, industrial wood-based products, and livestock-derived forest products are excluded because they fall outside the conceptual scope of NTFPs.
Globally, NTFPs play an important role in rural livelihoods, food security, biodiversity conservation, and local economies [8]. Millions of people worldwide depend on these products for subsistence, supplementary income, traditional medicine, and cultural practices, particularly in forest-dependent regions across Asia, Africa, Europe, and Latin America [9]. In recent decades, NTFPs have received growing attention within sustainable forest management and bioeconomy discussions because of their ecological and socio-economic importance [10].
NTFPs also contribute significantly to agricultural support systems, food security, and the preservation of local cultural practices [11,12,13,14]. In many forest-dependent communities, they represent an important source of livelihood and household income. Empirical studies indicate that NTFPs may account for 20%–30% of household income and, in some cases, up to half of total household income in forest-dependent regions [5,15].
NTFPs also contribute to food security, traditional medicine, livelihood resilience, and the preservation of traditional knowledge and local cultural practices, particularly in seasonally vulnerable rural communities [16,17,18,19]. However, ensuring the long-term sustainability of NTFP production systems remains challenging in many regions because of weak governance structures, limited monitoring capacity, and poorly organized value chains [20,21]. Compared with formal timber industries, NTFP markets are often characterized by informal commercialization processes, limited institutional regulation, and unequal bargaining power among stakeholders [22,23,24]. These conditions may increase the risks of overharvesting, production instability, and price volatility, particularly under growing market demand [25,26,27]. As a result, many countries have increasingly focused on developing governance frameworks, resource rights systems, and institutional support mechanisms aimed at improving the sustainability and resilience of NTFP production systems [9,28,29,30]. Given Türkiye’s rich biodiversity and diverse forest ecosystems, the use of NTFPs is widespread and constitutes an important component of rural livelihoods and traditional practices. Common NTFPs in Türkiye include chestnuts, bay leaves, labdanum (+resin), pine-derived products, and mushrooms, all of which are widely utilized in rural areas. In addition, recent studies emphasize that sustainable resource-use practices, including innovative waste management strategies in recreational activities, play an important role in maintaining a clean and safe environment in Türkiye [31,32,33]. Regional climatic, ecological, and socio-economic conditions strongly influence plant diversity and patterns of use across different ecosystems. The country’s high biodiversity and extensive traditional knowledge indicate considerable production potential for a wide range of NTFP species [34,35,36].
At the national level, NTFP production in Türkiye has expanded considerably over recent decades, driven by increasing international demand, institutional support mechanisms, and the commercialization of forest-based products [37]. Production volumes have grown rapidly, reaching approximately 30,000–35,000 tonnes in recent years as a result of rising global demand, improved supply capacities, and the continued development of the NTFP sector under increasing international competition [38,39,40]. In Türkiye, the use and management of NTFPs are regulated within the broader legal framework established by Article 169 of the Constitution and Forest Law No. 6831 (Official Gazette, 1956). Although the legislation does not provide a single explicit definition of NTFPs, it regulates forest resources in a manner that distinguishes non-wood biological products from timber-based resources. Within this framework, forest ownership remains under state control, while harvesting rights, production permits, and allocation processes are centrally administered by the General Directorate of Forestry. Consequently, the production and distribution of NTFPs are governed through formal administrative procedures and secondary legislation [41].
Production trends exhibited a non-linear pattern over time. During the 1990s, growth was largely driven by a limited number of traditional products, whereas the following years were characterized by increasing diversification. However, concentration and production volatility intensified again after 2018 [42]. Certain products, particularly bay leaves and pine nuts, gained greater economic prominence, while the overall product portfolio remained structurally heterogeneous [43]. These dynamics are consistent with the boom–bust cycles commonly observed in natural resource economies [44].
Regional heterogeneity also plays an important role in shaping the NTFP production system. Production activities are concentrated in certain provinces, particularly in the Mediterranean region, whereas inland and eastern regions of Türkiye remain comparatively underutilized. These regional disparities are associated with differences in institutional capacity, cooperative structures, and access to government support mechanisms [45,46,47].
Despite these structural developments, comprehensive national-level studies examining long-term production dynamics, portfolio diversity, volatility, and governance structures remain limited [38]. Many existing studies focus primarily on single species or localized case studies, meaning that broader system-level transformations have not yet been sufficiently explored [48,49,50]. To provide a broader European context for interpretation, selected observations from Lithuania’s multifunctional NTFP system are briefly referenced in Section 4.
Long-term structural transformations of this kind are relatively uncommon in contexts characterized by state-controlled forest ownership and high ecological diversity. In this respect, Türkiye represents a particularly relevant case, as its NTFP production system exhibits a relatively market-oriented and export-driven structure despite centralized forest governance. This makes Türkiye a valuable context for examining the interaction between governance dynamics and market competition over the period 1988–2024. This study contributes to a better understanding of the structural dynamics of NTFP production within a state-controlled forest governance system in Türkiye. By analyzing long-term trends in diversification, concentration, and volatility, the study provides empirical insights into the relationship between governance structures and market-oriented production patterns. The findings also offer practical implications for policymakers and forest managers, particularly with regard to improving resource allocation, supporting sustainable production strategies, and strengthening the resilience of rural livelihoods dependent on forest resources.
This analytical framework also enables the integrated assessment of production scale and volatility across different NTFP categories, allowing the identification of structurally differentiated product groups with varying levels of production intensity and risk exposure.

2. Materials and Methods

2.1. Data Sources and Study Scope

This study examines the long-term structural transformation of non-timber forest product (NTFP) production in Türkiye. The analysis is based on official statistics published by the General Directorate of Forestry [51], covering annual production data for the period 1988–2024. Using these data, annual production series were compiled for each NTFP category included in the analysis, summarizing production quantities (tonnes) across different product groups. In addition, regional production patterns were evaluated using multiple data formats and production indicators to capture spatial variations in production levels.
The main dataset used in this study consists of ten non-timber forest products—bay leaf, bushes, thyme, pinecone, chestnut, myrtle leaf, sage, carob, labdanum, and rosemary, unprocessed—selected based on data continuity and the availability of long-term production records. In addition, data on financial support provided to forest villagers between 1974 and 2024 were obtained from the General Directorate of Forestry (OGM). These support mechanisms primarily include rural development incentives and ORKÖY (Forest Villagers Support Programme) credits aimed at improving livelihoods in forest-dependent communities. They do not represent product-specific subsidies for the analyzed NTFPs, but rather broader institutional support instruments. These variables were included to explore the potential relationship between long-term production trends and institutional support structures.
All data were organized into annual time-series datasets and analyzed using SPSS (IBM SPSS Statistics 26, IBM Corp., Armonk, NY, USA). Production records from different years were subsequently reviewed and harmonized to ensure consistency in product classifications and reporting formats across the study period. Variations in terminology, classification structures, and reporting practices were carefully examined and standardized where necessary. Missing or incomplete records were assessed for relevance and consistency, and the dataset was refined where appropriate to enable meaningful long-term evaluation and comparison over time.

2.2. Data Processing

Production quantities (metric tonnes) were organized into continuous annual time-series datasets to enable long-term analysis. Differences in product classifications, coding structures, and reporting formats across individual years were carefully reviewed and reconciled to ensure consistency and comparability throughout the study period. Financial support data were converted into real terms using the Consumer Price Index (CPI), thereby eliminating inflation effects and enabling meaningful historical comparisons across years. All variables were subsequently compiled into continuous annual series and analyzed to examine production dynamics as well as long-term support and welfare mechanisms.
To ensure longitudinal comparability across the 1988–2024 period, all production records underwent a harmonization procedure prior to analysis. Product names, reporting categories, and coding structures that varied over time were manually reviewed and standardized into a unified nomenclature. Only products with sufficiently continuous and comparable annual records were retained in the analytical dataset. Products characterized by severe discontinuities, inconsistent classification structures, or insufficient temporal coverage were excluded from trend-based analyses.
Missing observations were not statistically imputed; instead, analyses relied on available official records in order to preserve the original structure of the dataset. In cases where reporting terminology changed over time but referred to the same biological product, categories were reconciled based on institutional reporting continuity and product descriptions provided in official forestry statistics. Supplementary Table S1 summarizes the standardization procedures applied to address terminology inconsistencies, classification differences, and reporting discontinuities across annual production records.

2.3. Trend Analysis

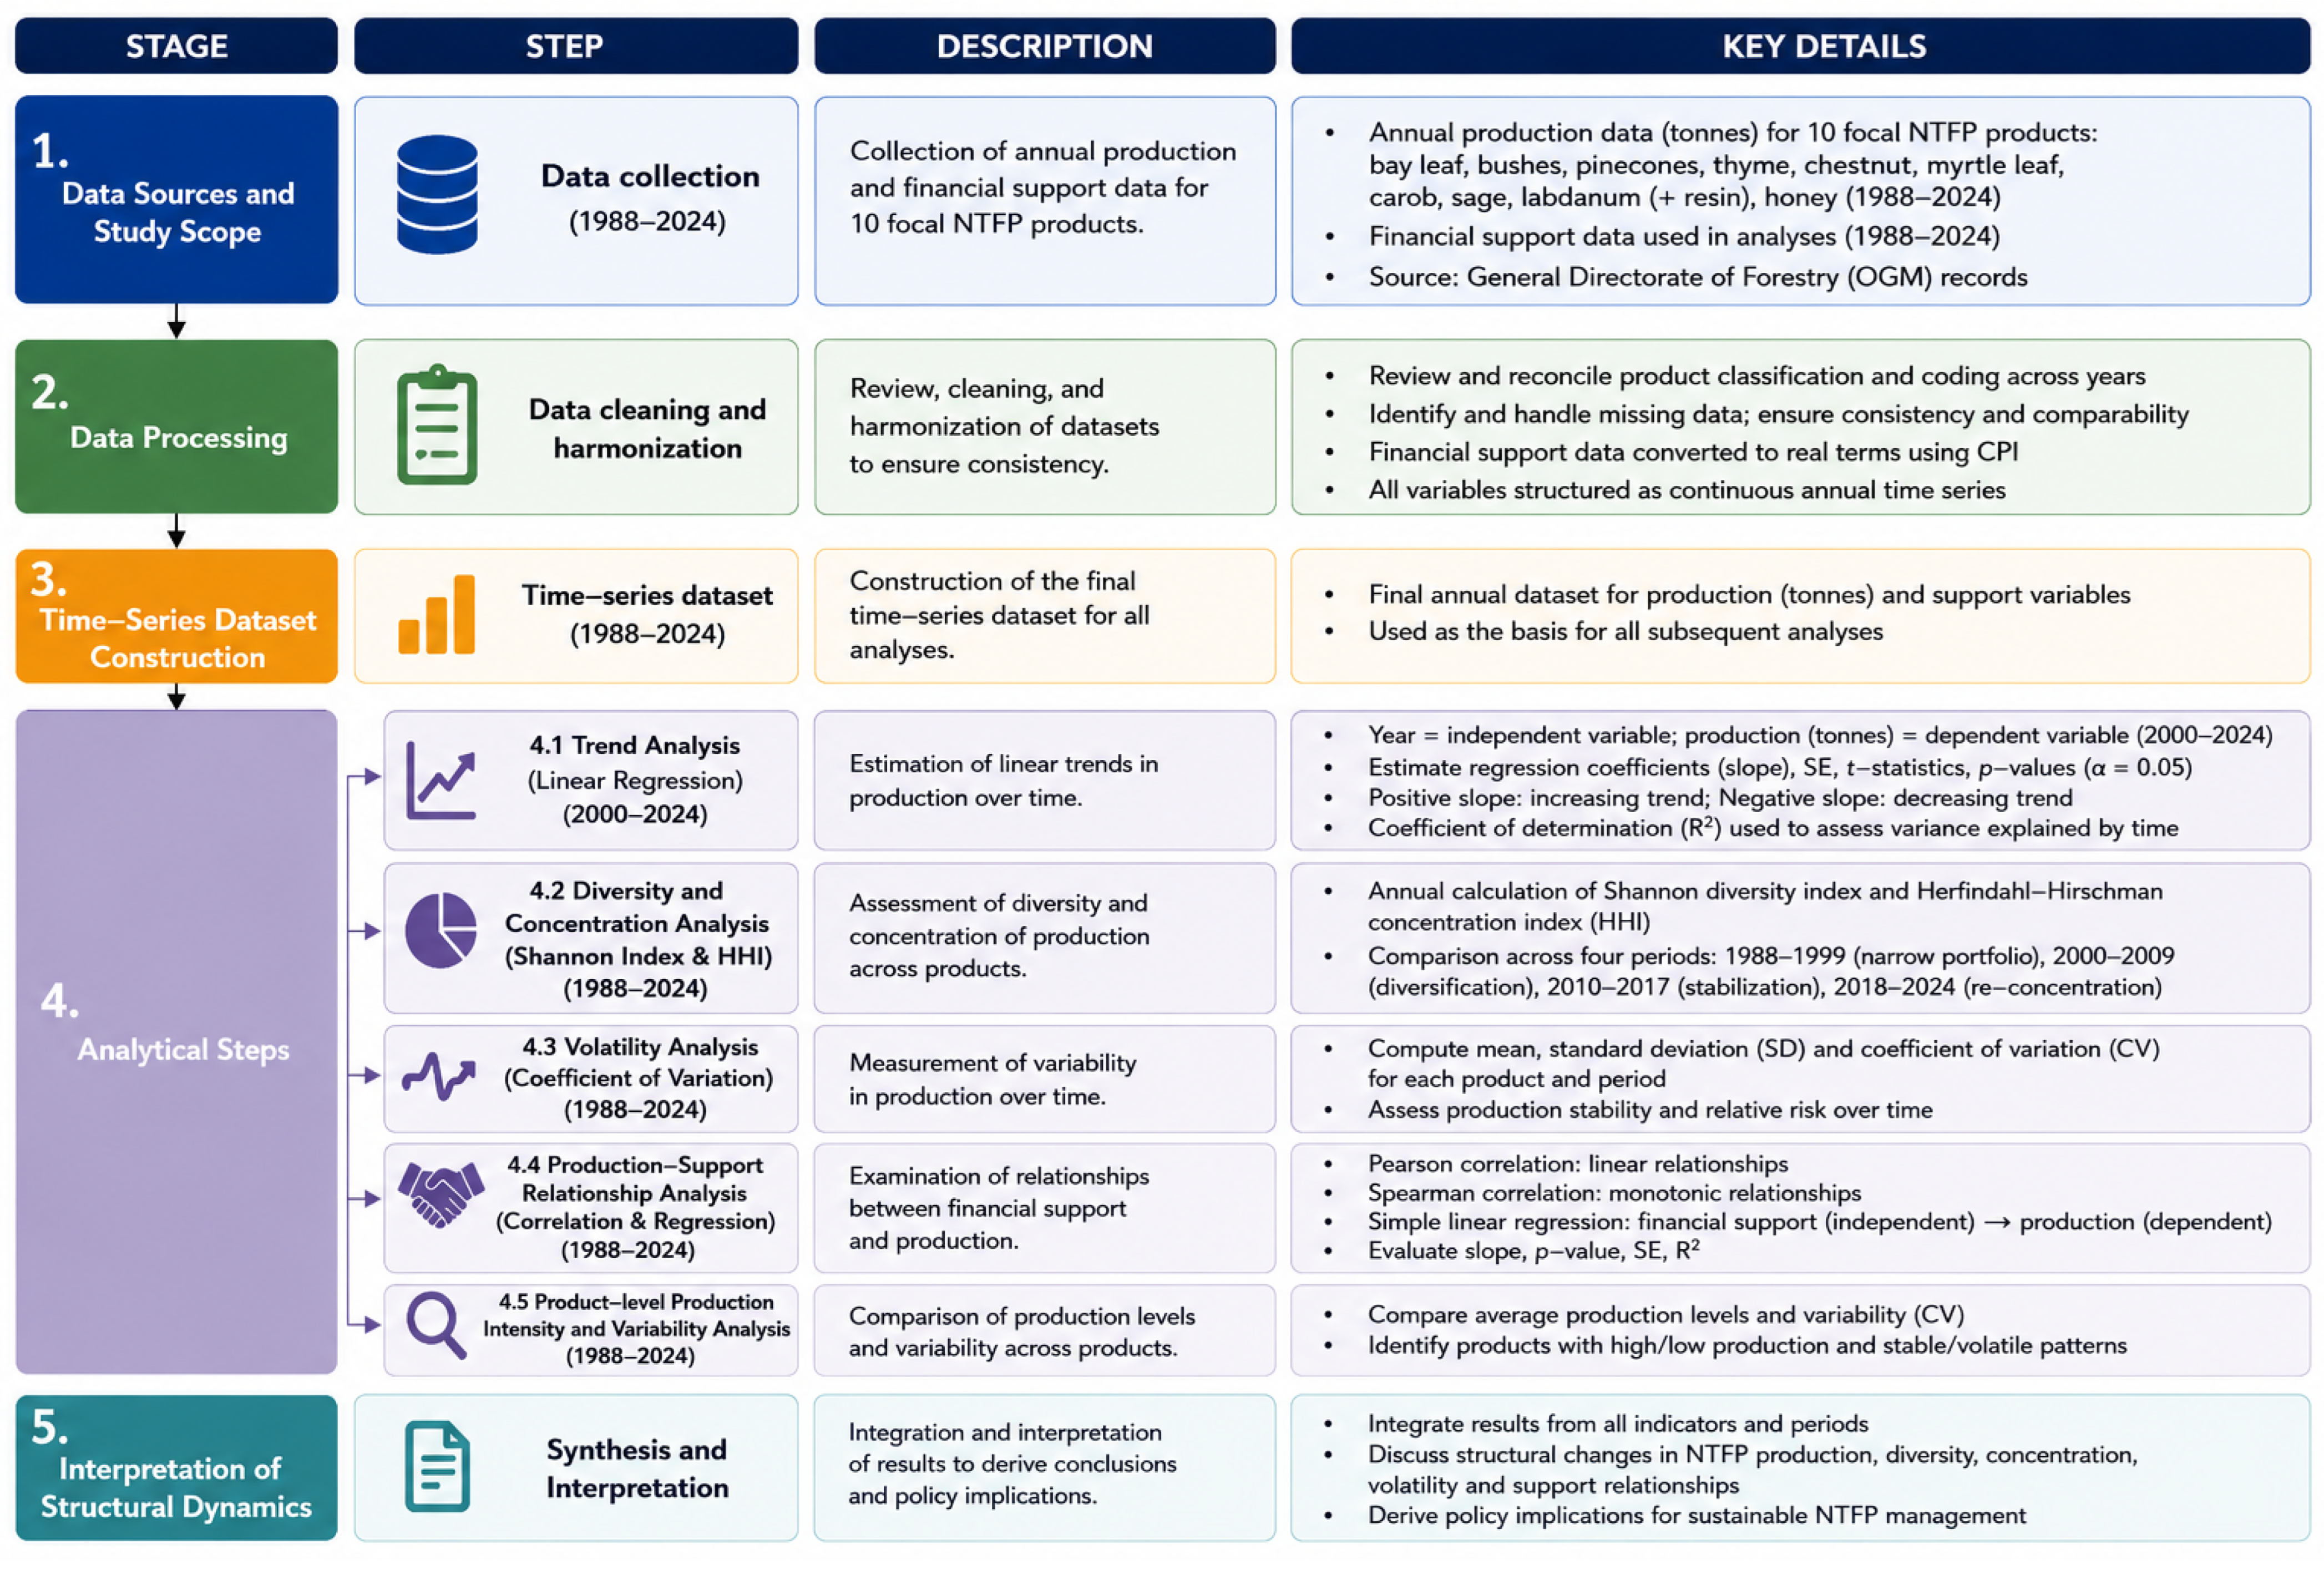
Although the available dataset covers the period 1988–2024, the regression analysis was conducted for the 2000–2024 period (Figure 1). This restriction was applied to ensure data consistency and comparability across products, as earlier records contain reporting discontinuities and inconsistencies. In the regression models, year was treated as the independent variable and production quantity (tonnes) as the dependent variable. This approach enabled the identification of long-term monotonic relationships and facilitated the detection of increasing or decreasing production trends over time.
For each product, the slope coefficient representing the direction and magnitude of temporal change was evaluated together with the overall compatibility of the model with the production series. In addition, the coefficient of determination (R2) was used to assess the proportion of variance in production explained by temporal change.
Given the ecological nature of NTFP production systems, which are influenced by climatic variability, biological cycles, and market dynamics, high explanatory power was not expected. Therefore, relatively low R2 values were considered acceptable for ecological production systems characterized by substantial year-to-year variability. Accordingly, greater emphasis was placed on the direction and statistical significance of trends rather than on overall model fit.
No data transformations were applied, as preliminary inspection of the time-series data did not reveal systematic non-linear patterns requiring alternative functional forms. Nevertheless, linear regression provides a simplified representation of temporal dynamics and may not fully capture short-term fluctuations, non-linear trends, or structural breaks in time-series data [52,53,54].
Long-term trends in national NTFP production during the period 1988–2024 were evaluated using simple linear regression models estimated separately for the ten focal products [55]. For each product, year was specified as the independent variable and annual national production (tonnes) as the dependent variable. All models were estimated using SPSS. The regression model can be expressed as:
Productionₜ = α + β·Yearₜ + εₜ,
where β represents the average annual change in production (tonnes), α is the intercept, and εₜ is the error term.
Although the overall NTFP production system exhibits non-linear and multi-phase characteristics, simple linear regression was employed in this study as a descriptive tool to identify long-term directional trends across products. The objective was not to model short-term fluctuations or structural break processes, but rather to provide a standardized and comparable measure of long-term production change across multiple NTFP categories. In addition, non-linear structural transitions within the system were evaluated separately through period-based diversity and concentration analyses presented in subsequent sections.

2.4. Diversity and Concentration Analysis

Portfolio diversification and concentration were evaluated using the Shannon diversity index and the Herfindahl–Hirschman Index (HHI) [56,57,58] (Figure 1). The Shannon index was used to assess product diversity and the balance of production distribution, whereas the HHI measured the degree of concentration within the NTFP portfolio. Both indicators were calculated annually to examine long-term structural dynamics in production patterns.
Based on temporal changes observed in these indices, the study period was divided into four analytical phases: narrow portfolio structure (1988–1999), diversification (2000–2009), stabilization (2010–2017), and re-concentration (2018–2024). These phases were subsequently used to interpret shifts in portfolio structure, production concentration, and the interaction between market dynamics and institutional support mechanisms.

2.5. Volatility Analysis

Production variability was quantified using the coefficient of variation (CV), calculated from period-specific mean and standard deviation (SD) values [59] (Figure 1). Because the CV is a scale-independent measure, it enables direct comparison of variability across products and time periods with differing production levels. Volatility analysis [60] was incorporated into the trend assessment framework to evaluate production stability and risk, as well as to examine potential production fluctuations associated with climatic variability, market dynamics, and biotic stress factors.

2.6. Production–Support Relationship

Pearson’s and Spearman correlation analyses were used to examine the linear and monotonic relationships between production volume and institutional support levels [21,61]. In addition, a simple linear regression approach was applied to assess the relationship between financial support and production outcomes. Regression coefficients, t-statistics, p-values, and R2 values were calculated for each model. All analyses were conducted for the full study period covering 1988–2024.
The production–support analysis was designed as an exploratory assessment of broad long-term associations rather than as a causal modelling framework. Because NTFP production systems are simultaneously influenced by ecological conditions, climatic variability, market dynamics, and institutional factors, the findings should be interpreted with caution. The applied correlation and bivariate regression models do not fully account for lag effects, endogeneity, or unobserved confounding variables; instead, they provide a simplified overview of long-term relationships between production dynamics and institutional support within the study period.

2.7. Product-Level Risk Profiling

Accordingly, descriptive statistics—including mean, minimum, maximum, standard deviation, and coefficient of variation (CV)—were used to evaluate the variability structure of each product over the period 1988–2024. These measures capture differences in production variability and provide an indication of relative production stability across NTFP categories. Products were subsequently positioned within a two-dimensional analytical matrix based on average production level (scale) and coefficient of variation (volatility) [62].

3. Results

3.1. Long-Term Production Trends (1988–2024)

Table 1 presents the results of the trend analysis for the ten focal NTFPs over the period 1988–2024, including estimated slope coefficients, statistical significance levels, and model fit indicators.
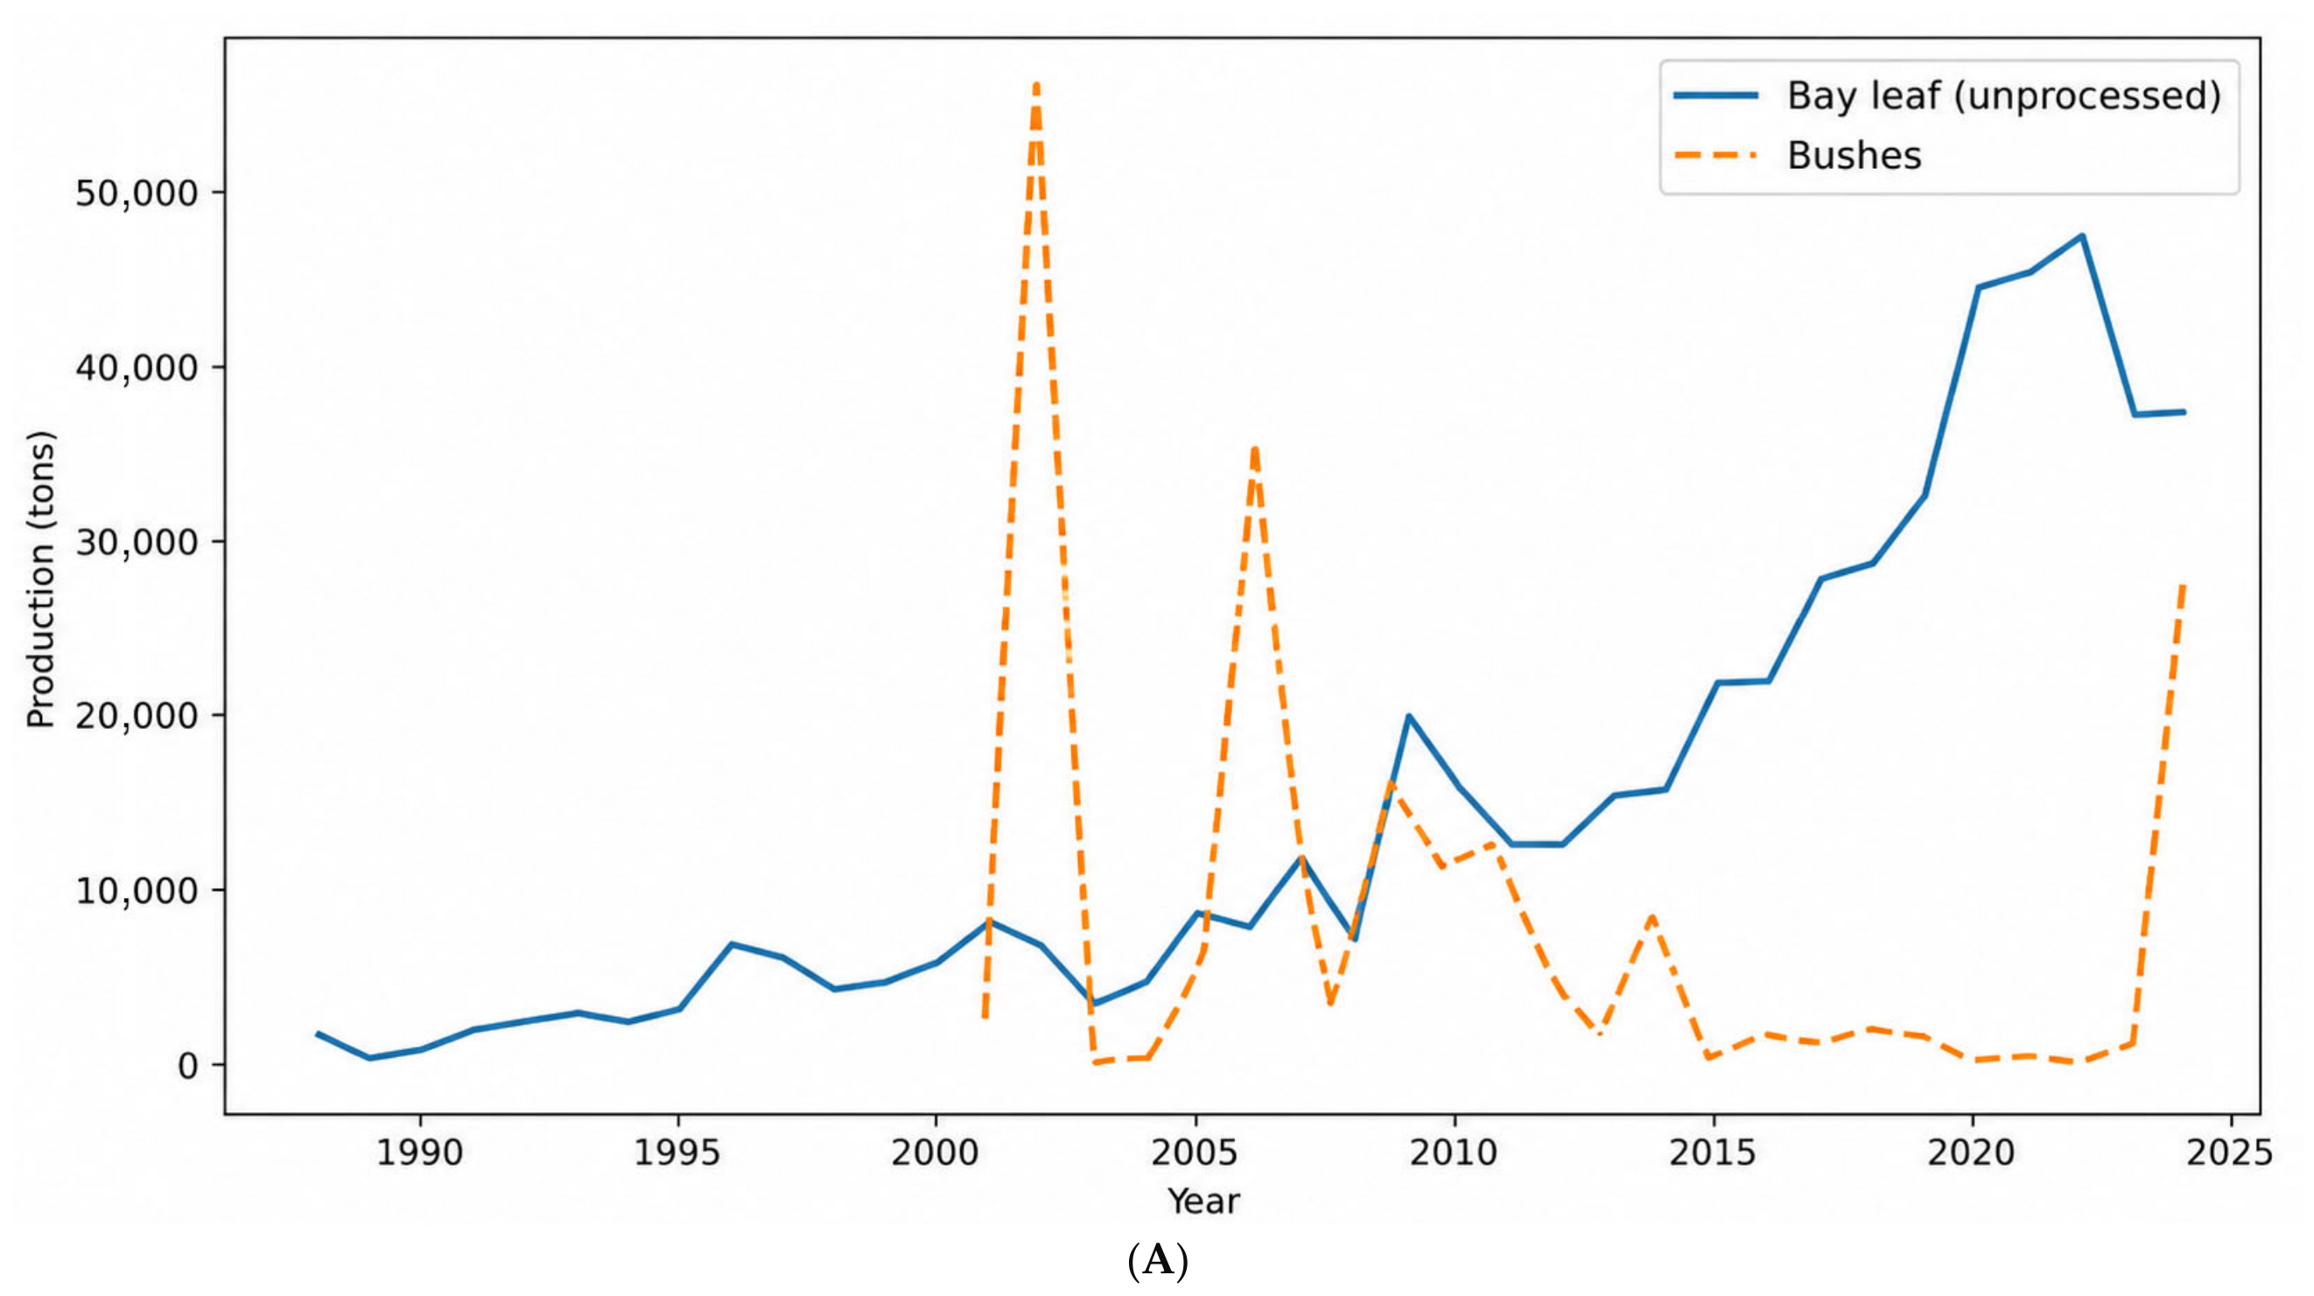
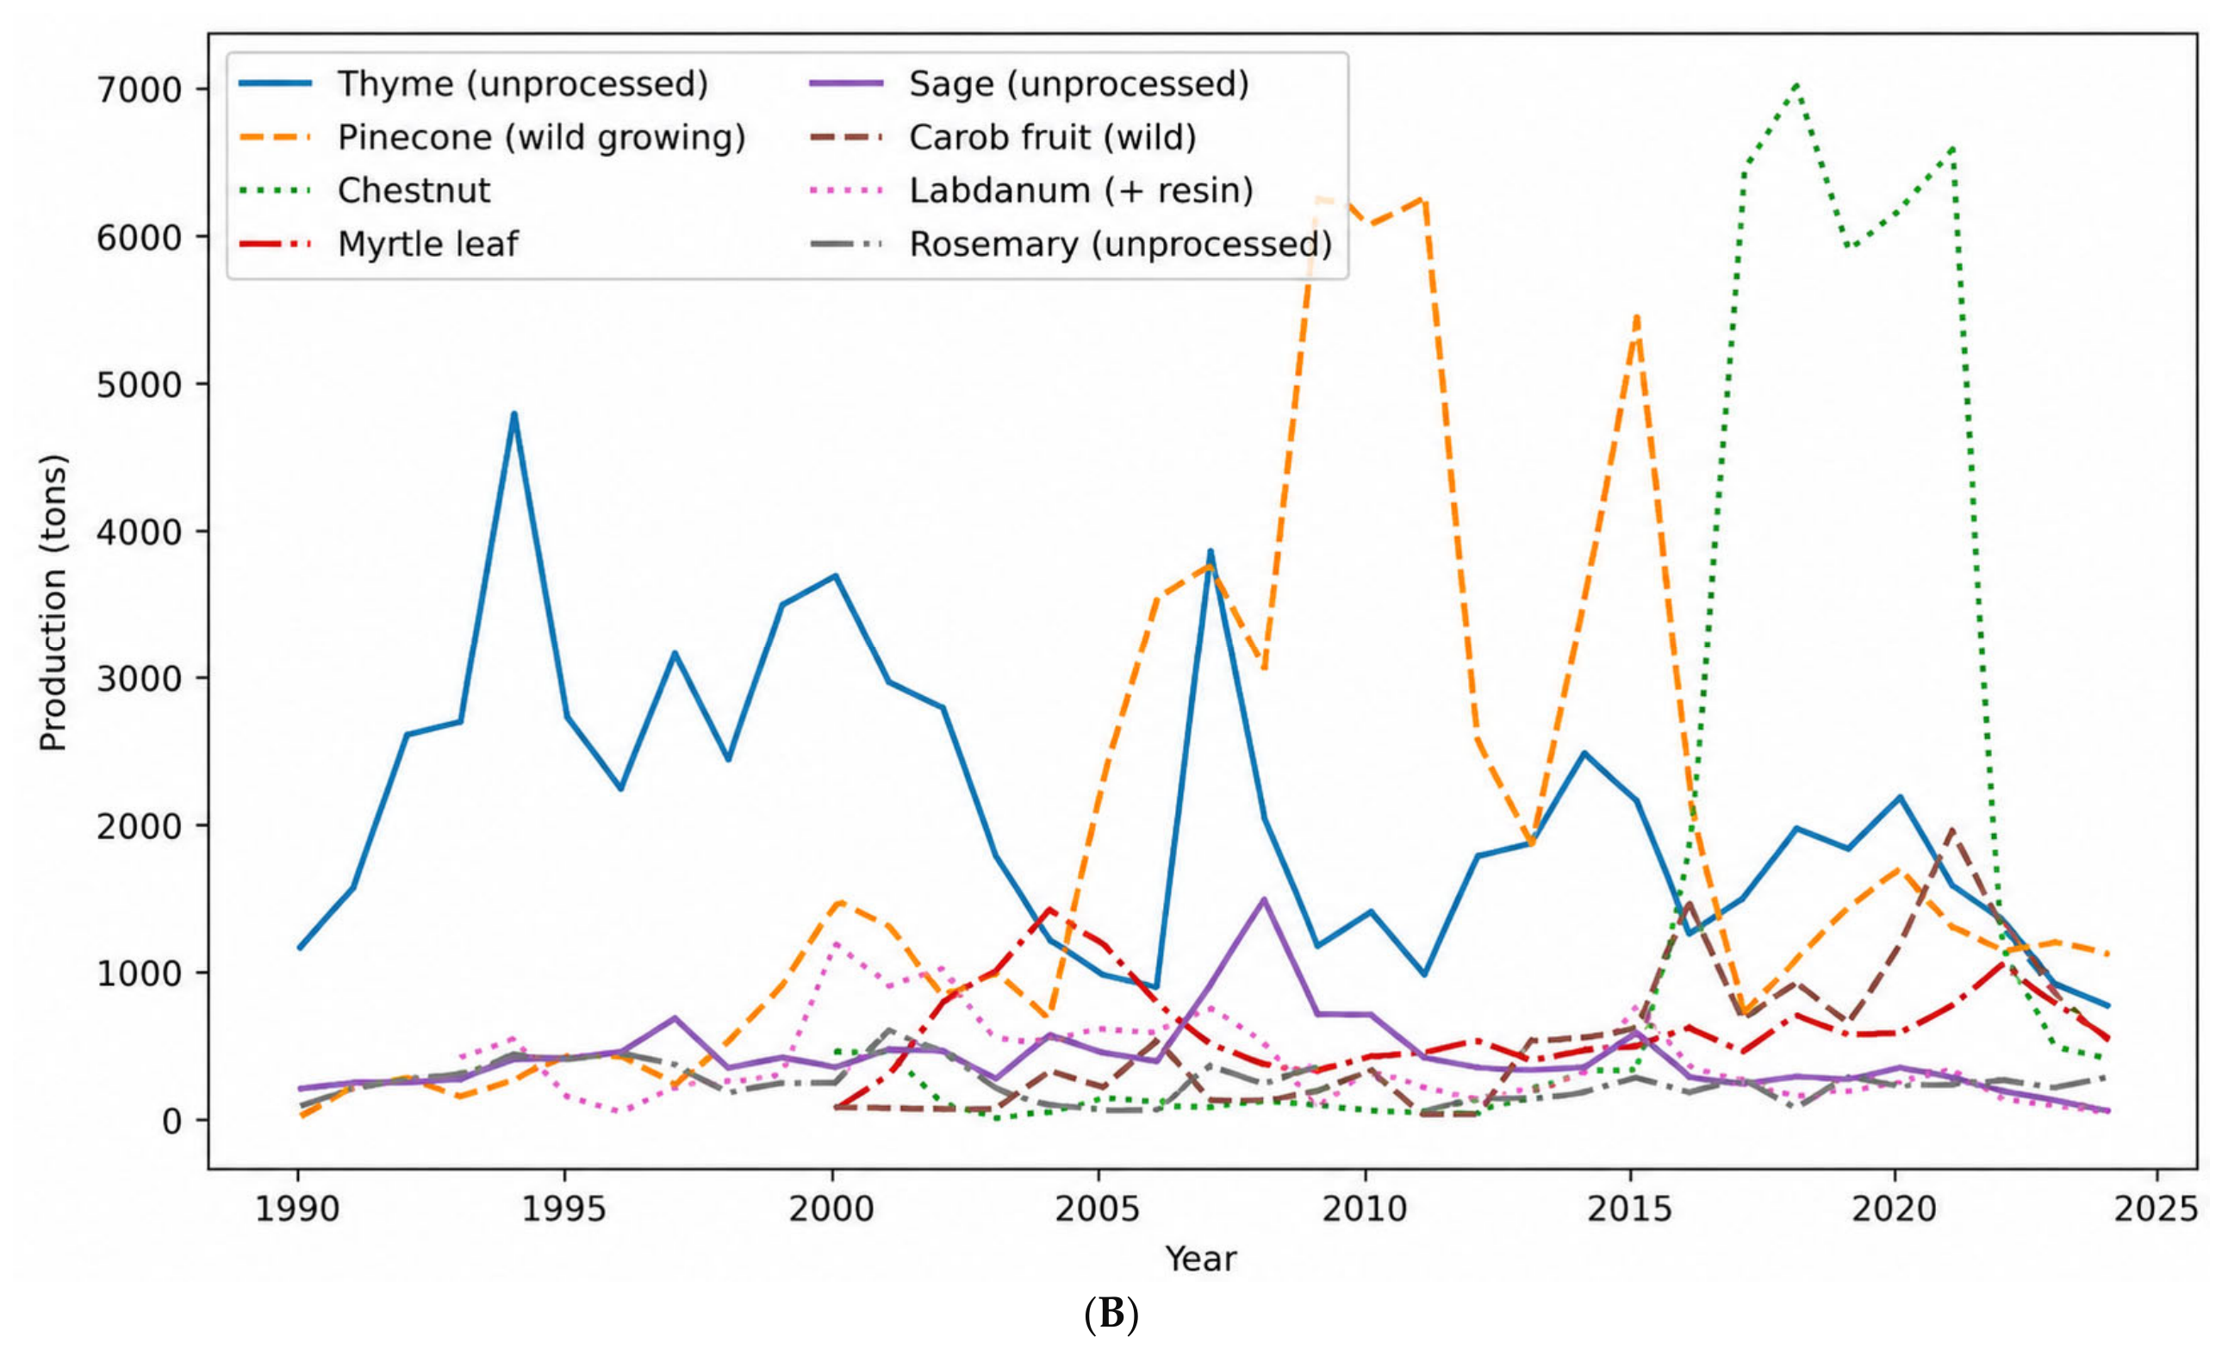
As shown in Table 1 and Figure 2A,B, the ten focal products exhibit distinct trend and variability patterns, with several displaying statistically significant upward trajectories, while others show declining or non-significant trends. Figure 2A,B separate high-volume products from medium- and lower-volume products in order to more clearly illustrate differences in production dynamics across scales.
Bay leaf production demonstrates a strong and highly significant increase (β = 1156.60; t = 11.83; p < 0.001; R2 = 0.80), corresponding to an average annual increase of approximately 1157 tonnes. The relatively large slope coefficient reflects the substantial expansion of production over the study period, particularly after the early 2000s, and should therefore be interpreted as a long-term average change rather than short-term variability. Chestnut production also increased significantly (β = 186.11; p = 0.005; R2 = 0.29), although the moderate explained variance indicates considerable interannual fluctuations. Similarly, carob production exhibited a statistically significant upward trend (β = 50.81; t = 5.12; p < 0.001; R2 = 0.53), with the model explaining approximately half of the observed variation. Pinecone production showed a smaller but statistically significant increase (β = 64.05; p = 0.033; R2 = 0.13), accompanied by relatively high variability.
In contrast, thyme production displayed a significant decline over time (β = −44.41; t = −3.04; p = 0.005; R2 = 0.22). Labdanum production also decreased significantly (β = −11.10; p = 0.044; R2 = 0.13). For bushes and Rosemary, unprocessed, slope coefficients were negative but not statistically significant (p = 0.197 and p = 0.161, respectively), indicating that linear trends could not be confirmed. In the case of bushes, the combination of a relatively large slope coefficient and low R2 value reflects high interannual variability and limited consistency in the trend pattern. Myrtle leaf and sage showed no detectable long-term trend (p > 0.40; R2 ≈ 0), suggesting relatively stable production levels within a narrow range.

3.2. Diversity and Concentration Dynamics (1988–2024)

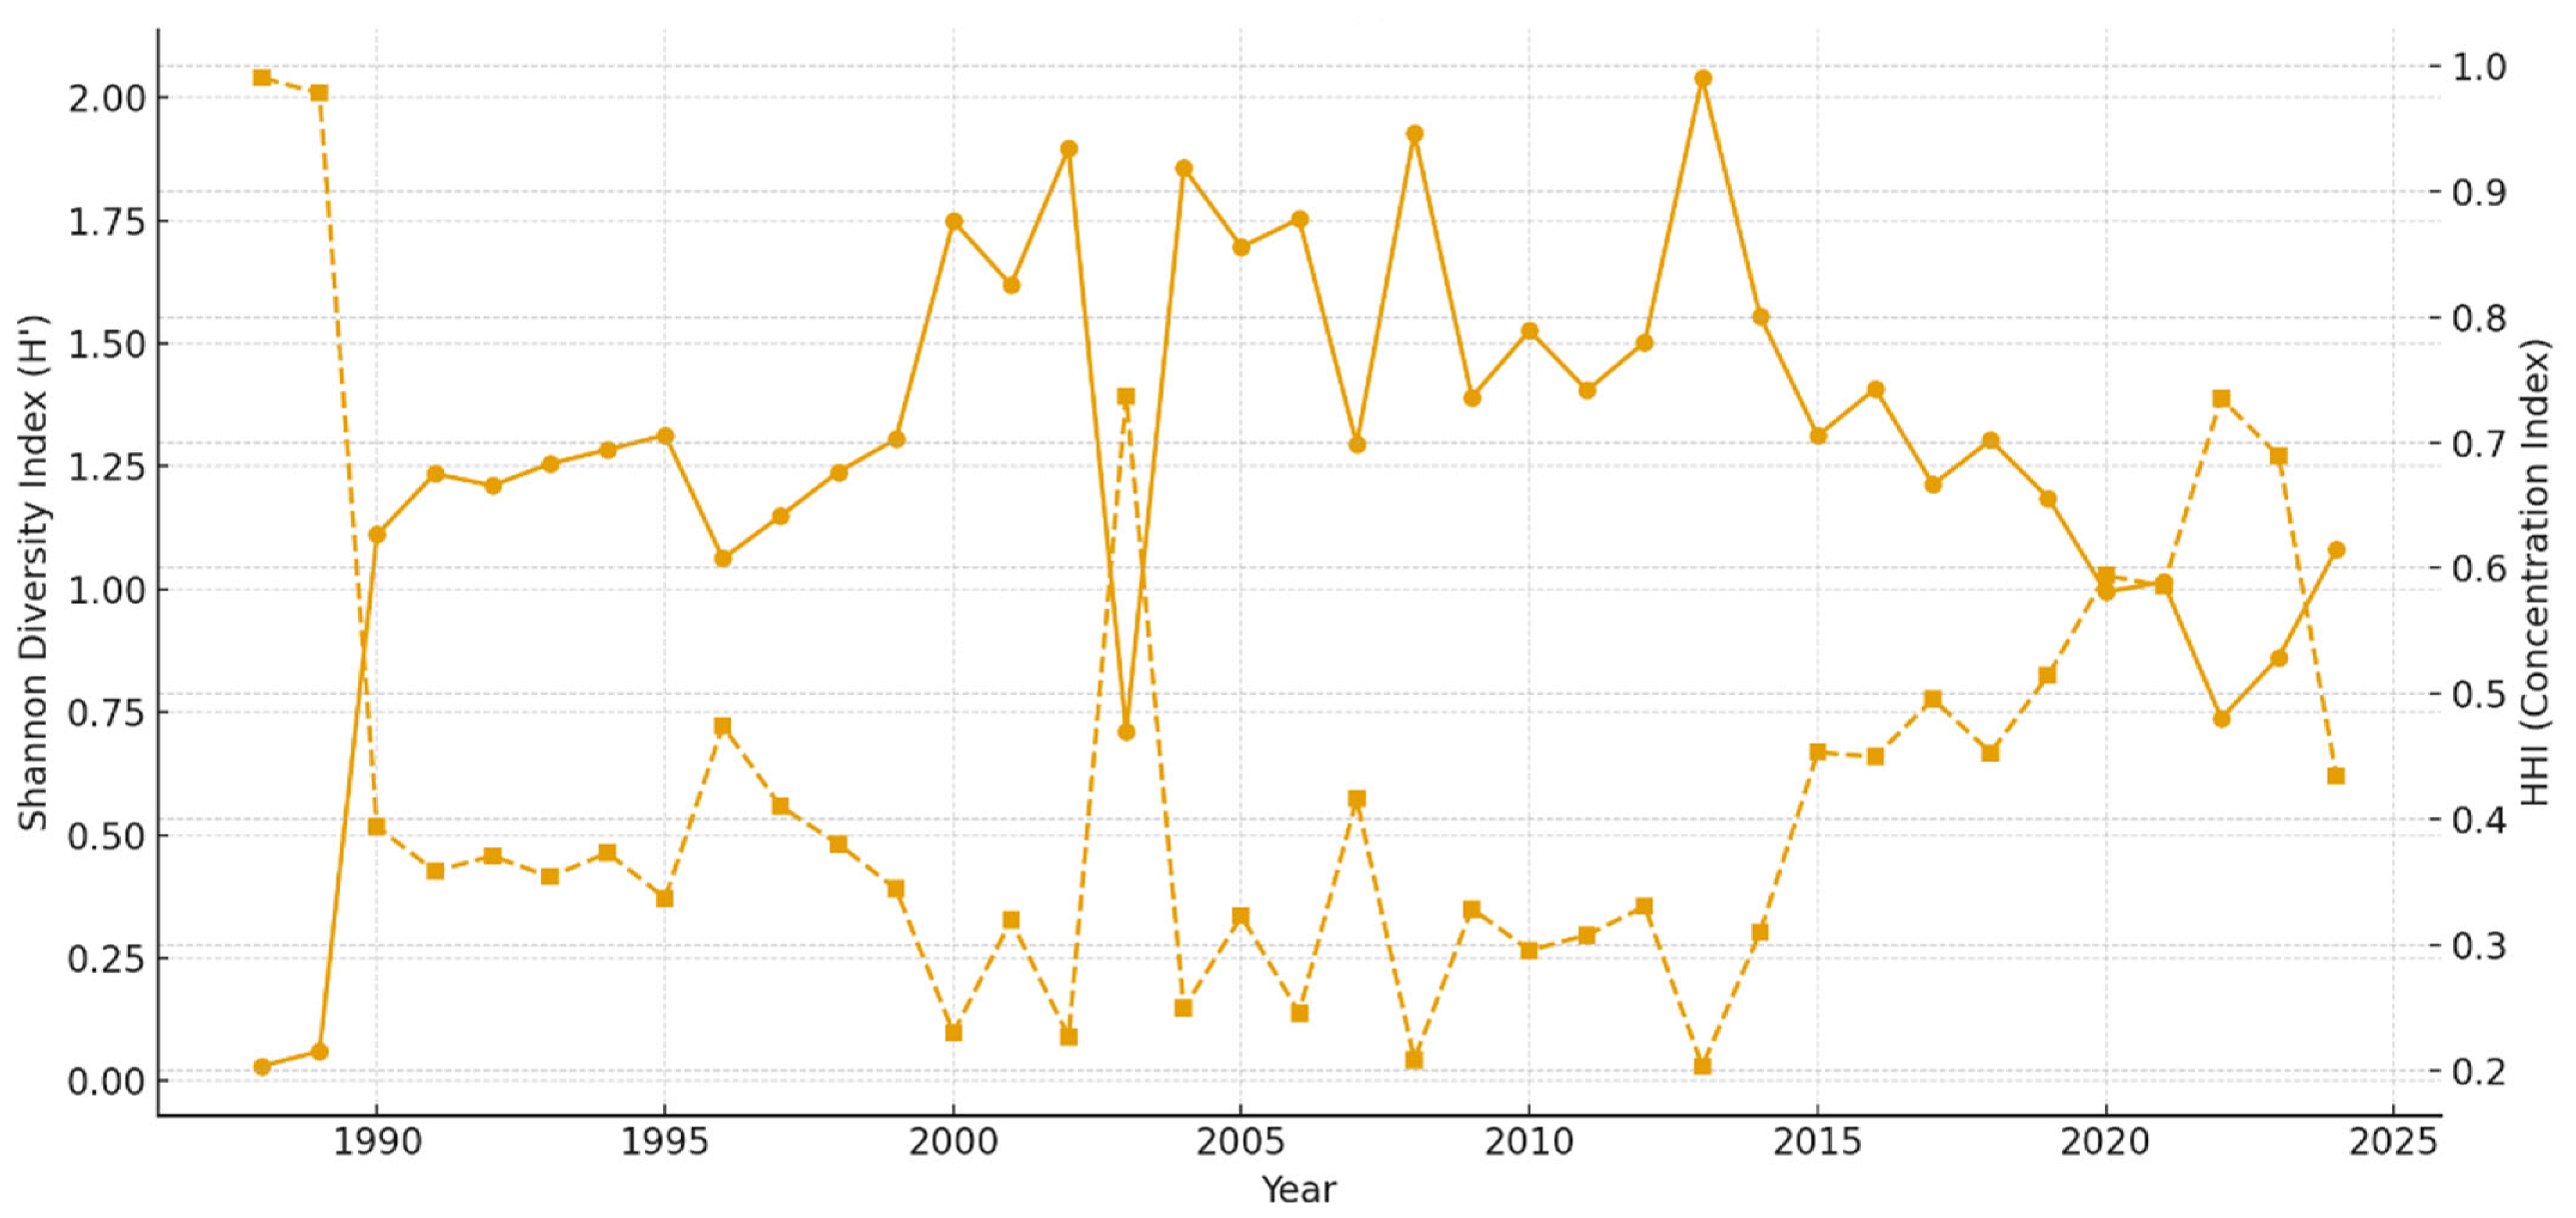
Figure 3 presents the annual trajectories of the Shannon diversity and Herfindahl–Hirschman concentration (HHI) indices for Türkiye’s NTFP production system during the period 1988–2024. The combined behavior of these indices indicates a non-linear structural evolution characterized by phases of diversification, stabilization, and re-concentration.
During the late 1980s, diversity levels remained low while concentration levels were relatively high, indicating strong dependence on a limited number of dominant products. Diversity increased substantially throughout the 1990s and reached its highest levels during the 2000s, whereas concentration declined over the same period. After 2010, the indices indicate a partial shift back toward concentration, which became more pronounced after 2018 as diversity declined and product dominance increased.
Based on these trajectories, four structural phases were identified: 1988–1999 (early/narrow portfolio structure), 2000–2009 (diversification phase), 2010–2017 (stabilization phase), and 2018–2024 (re-concentration phase).
Period averages for Shannon diversity and HHI concentration indices corresponding to these four structural periods are presented in Table 2.
Table 2 shows that the diversification phase during 2000–2009 exhibited the highest mean Shannon diversity value (1.59) and the lowest mean HHI value (0.33), indicating the broadest and most balanced distribution of production shares among products throughout the study period. In contrast, the 2018–2024 period was characterized by lower diversity and substantially higher concentration levels (HHI = 0.57), suggesting a renewed dominance of a smaller number of products within the production portfolio. The intermediate period of 2010–2017 reflects a partial shift toward concentration relative to the diversification peak observed during the 2000s, while still maintaining a more balanced portfolio structure than that observed during the late 1980s.

3.3. Periodic Volatility Dynamics (Mean, Standard Deviation, and CV)

To assess production stability, period-specific mean values, standard deviations, and coefficients of variation (CV) were calculated for four structural periods. Table 3 summarizes the resulting patterns of production volatility across these periods.
Average production increased substantially across the study periods, rising by more than threefold between the earliest and most recent phases. However, this growth was not accompanied by a consistent decline in production volatility. The 2000–2009 period exhibited the highest level of production stability despite higher production volumes relative to the earlier period. In contrast, volatility increased again after 2010 and became particularly pronounced during 2018–2024, when the system combined the highest production volumes with the greatest degree of instability. Figure 3 illustrates these period-level differences in production variability.

3.4. Temporal Evolution of Individual Support and Governance Shifts (1974–2024)

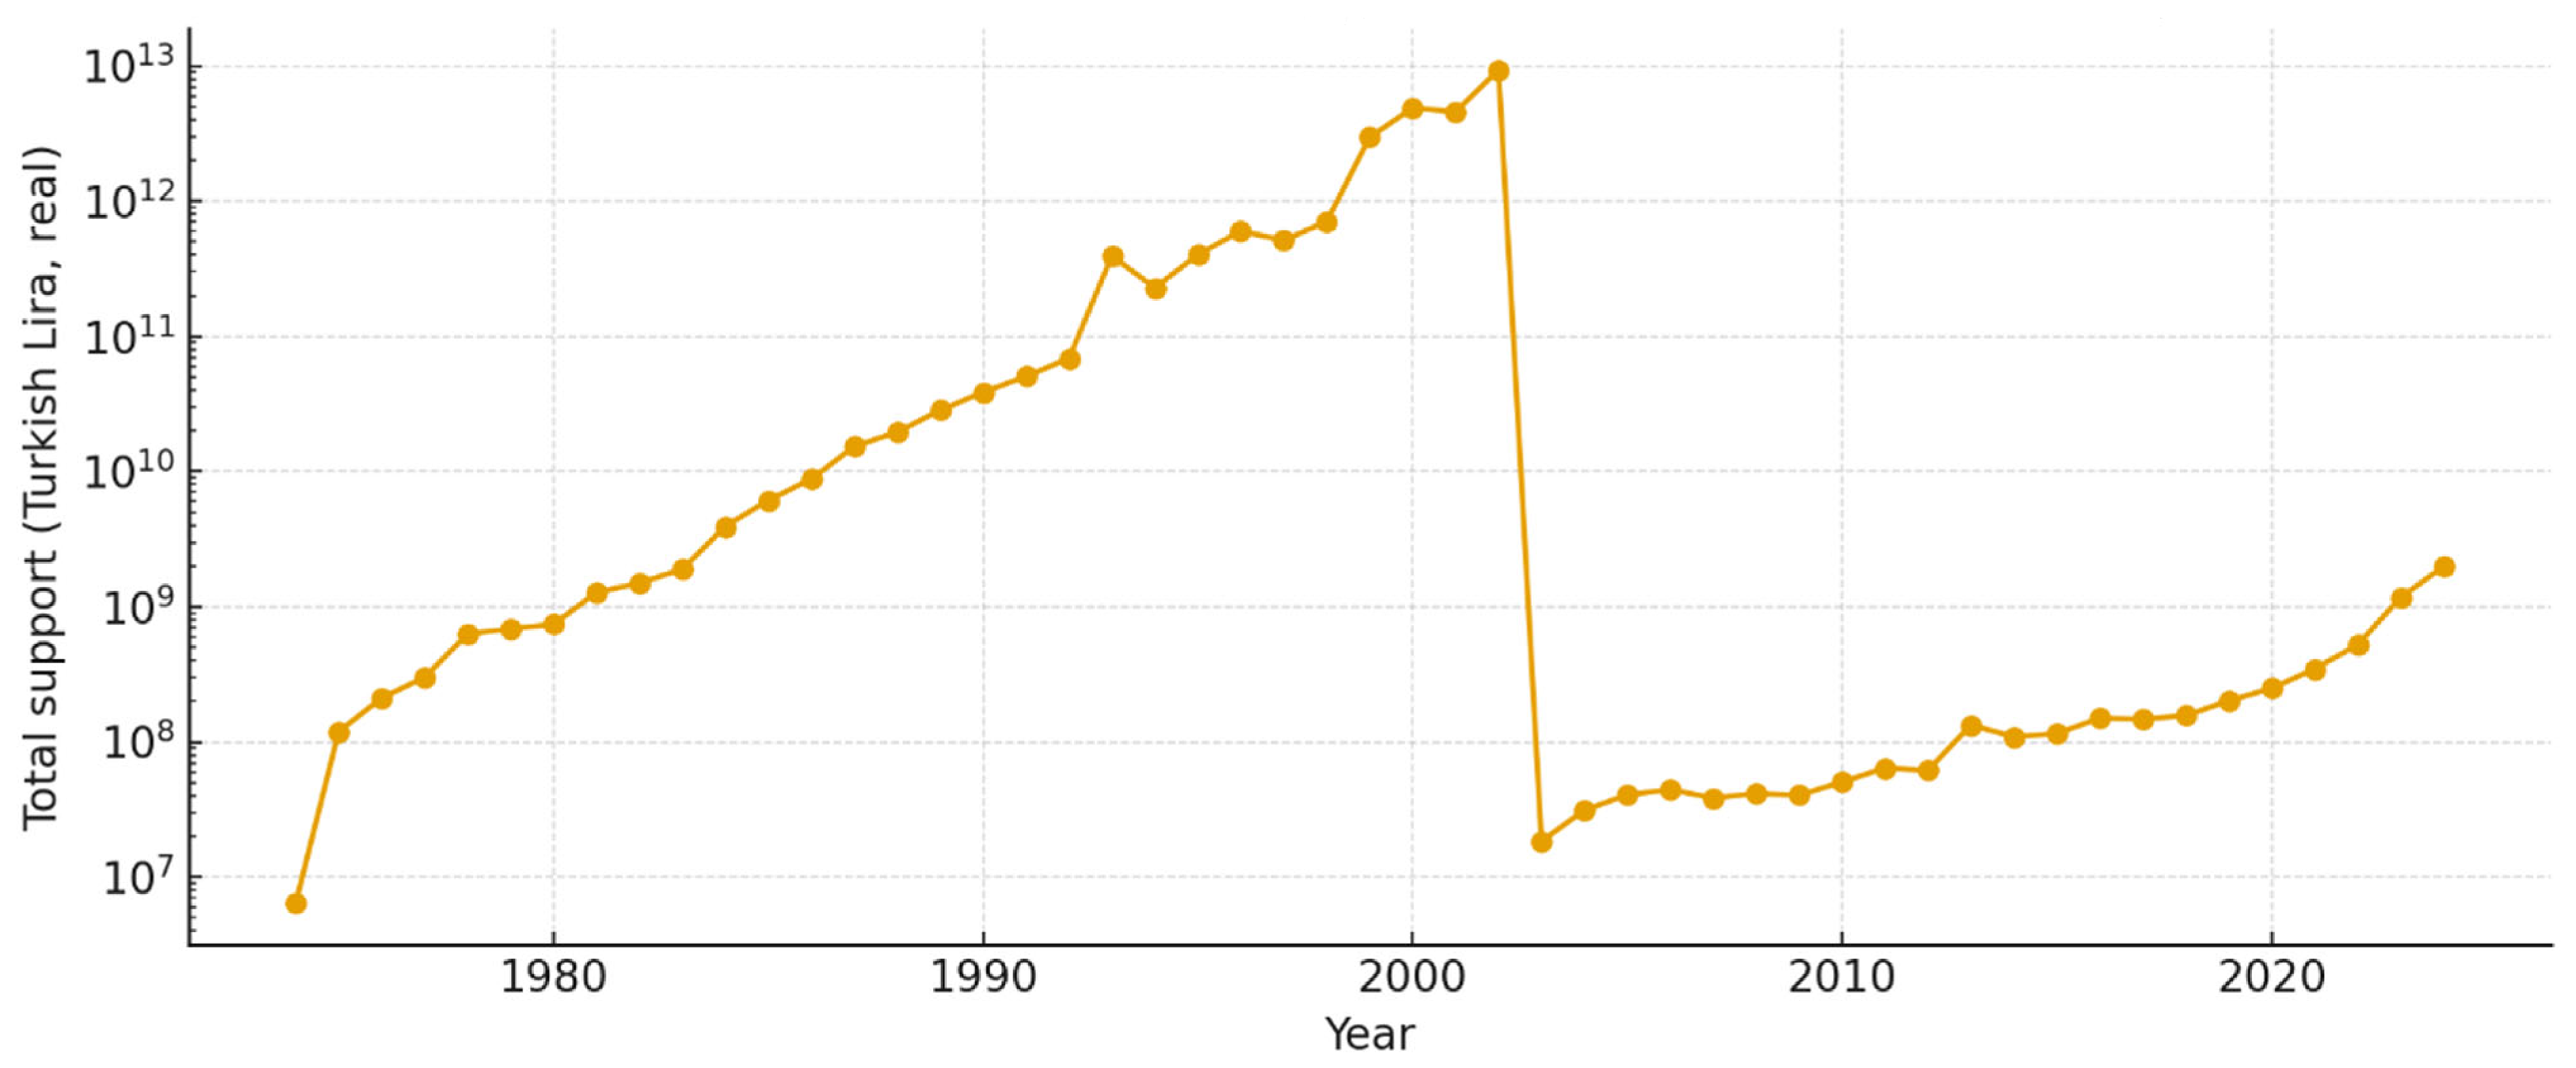
The annual series of real (inflation-adjusted) individual support provided to forest villagers during the period 1974–2024 exhibits a multi-phase trajectory characterized by alternating periods of expansion and contraction (Figure 4).
The first phase (1974–1990) has low and stable support. The second phase (1990–2005) shows high levels of variability and steep declines in response to large macroeconomic shocks. In the last phase (2006–2024) there is a large magnitude of increase in support, increased inter-annual volatility (especially after 2018).

3.5. Production–Support Relationship: Correlation and Regression

The relationship between total NTFP production and inflation-adjusted individual support levels was evaluated for the period 1988–2024 using correlation analyses. As shown in Table 4, both Pearson and Spearman correlation coefficients indicate a moderate positive association between production levels and institutional support.
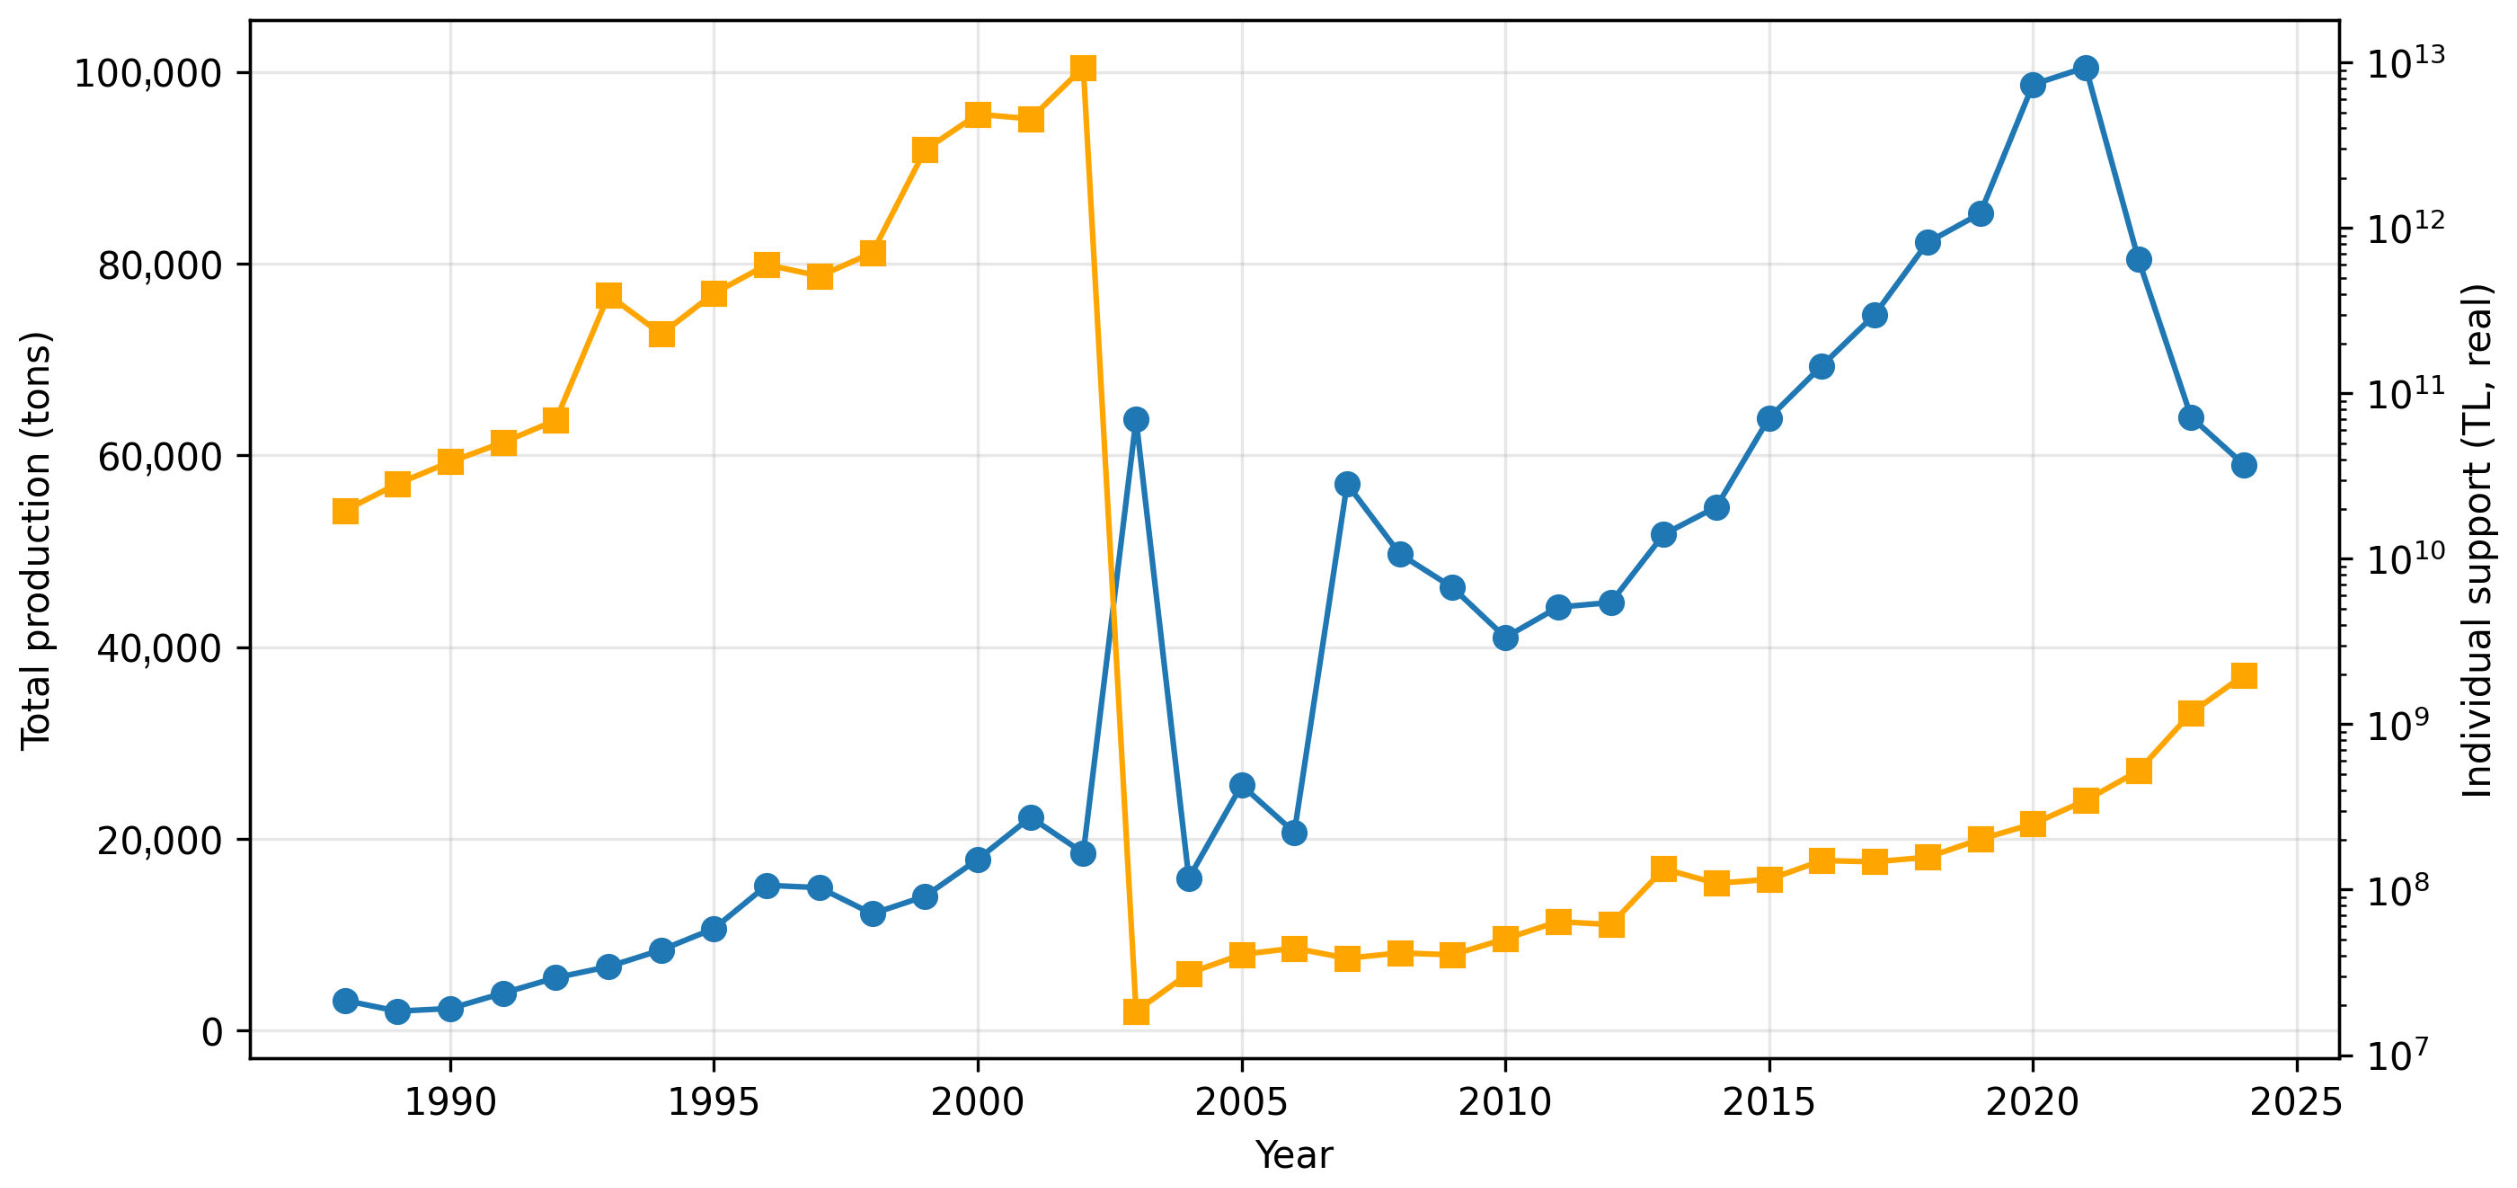
The correlation results suggest that higher levels of institutional support tend to be associated with increased production levels, although the strength of the relationship remains moderate. To further examine the extent to which individual support levels are associated with production dynamics, a simple linear regression analysis was subsequently conducted, and the results are presented in Table 5.
Although the regression results indicate a statistically significant association between individual support and production levels, the relatively low explained variance (R2 = 0.17) suggests that support mechanisms account for only a limited proportion of inter-annual production variability. As illustrated in Figure 5, this finding indicates that additional ecological, climatic, institutional, and market-related factors likely play a substantial role in shaping production dynamics.
The comparison of the two series indicates that production and support levels generally followed similar long-term directional patterns, although both series exhibited substantial year-to-year fluctuations. The discontinuity observed in the support trajectory after the early 2000s primarily reflects monetary redenomination and inflation-adjustment procedures rather than an abrupt decline in institutional support levels.

3.6. Product-Level Production Intensity and Risk Profile (2000–2024)

Descriptive statistics—including mean, minimum–maximum values, standard variation, and coefficient of variation (CV)—were calculated for selected NTFPs with sufficiently consistent and comparable production records during the period 2000–2024 in order to evaluate differences in production scale and variability across products (Table 6).
The descriptive statistics reveal substantial heterogeneity in both production intensity and variability across products. Bay leaf exhibited the highest average production level among the analyzed products, although production levels also showed considerable variability over time. Bushes and chestnut displayed particularly high volatility relative to their average production levels, indicating unstable production patterns across years. In contrast, products such as thyme and myrtle leaf exhibited comparatively lower variability, suggesting more stable production dynamics. Several medium- and lower-volume products also demonstrated distinct variability profiles, indicating that production scale alone does not adequately capture production stability characteristics.
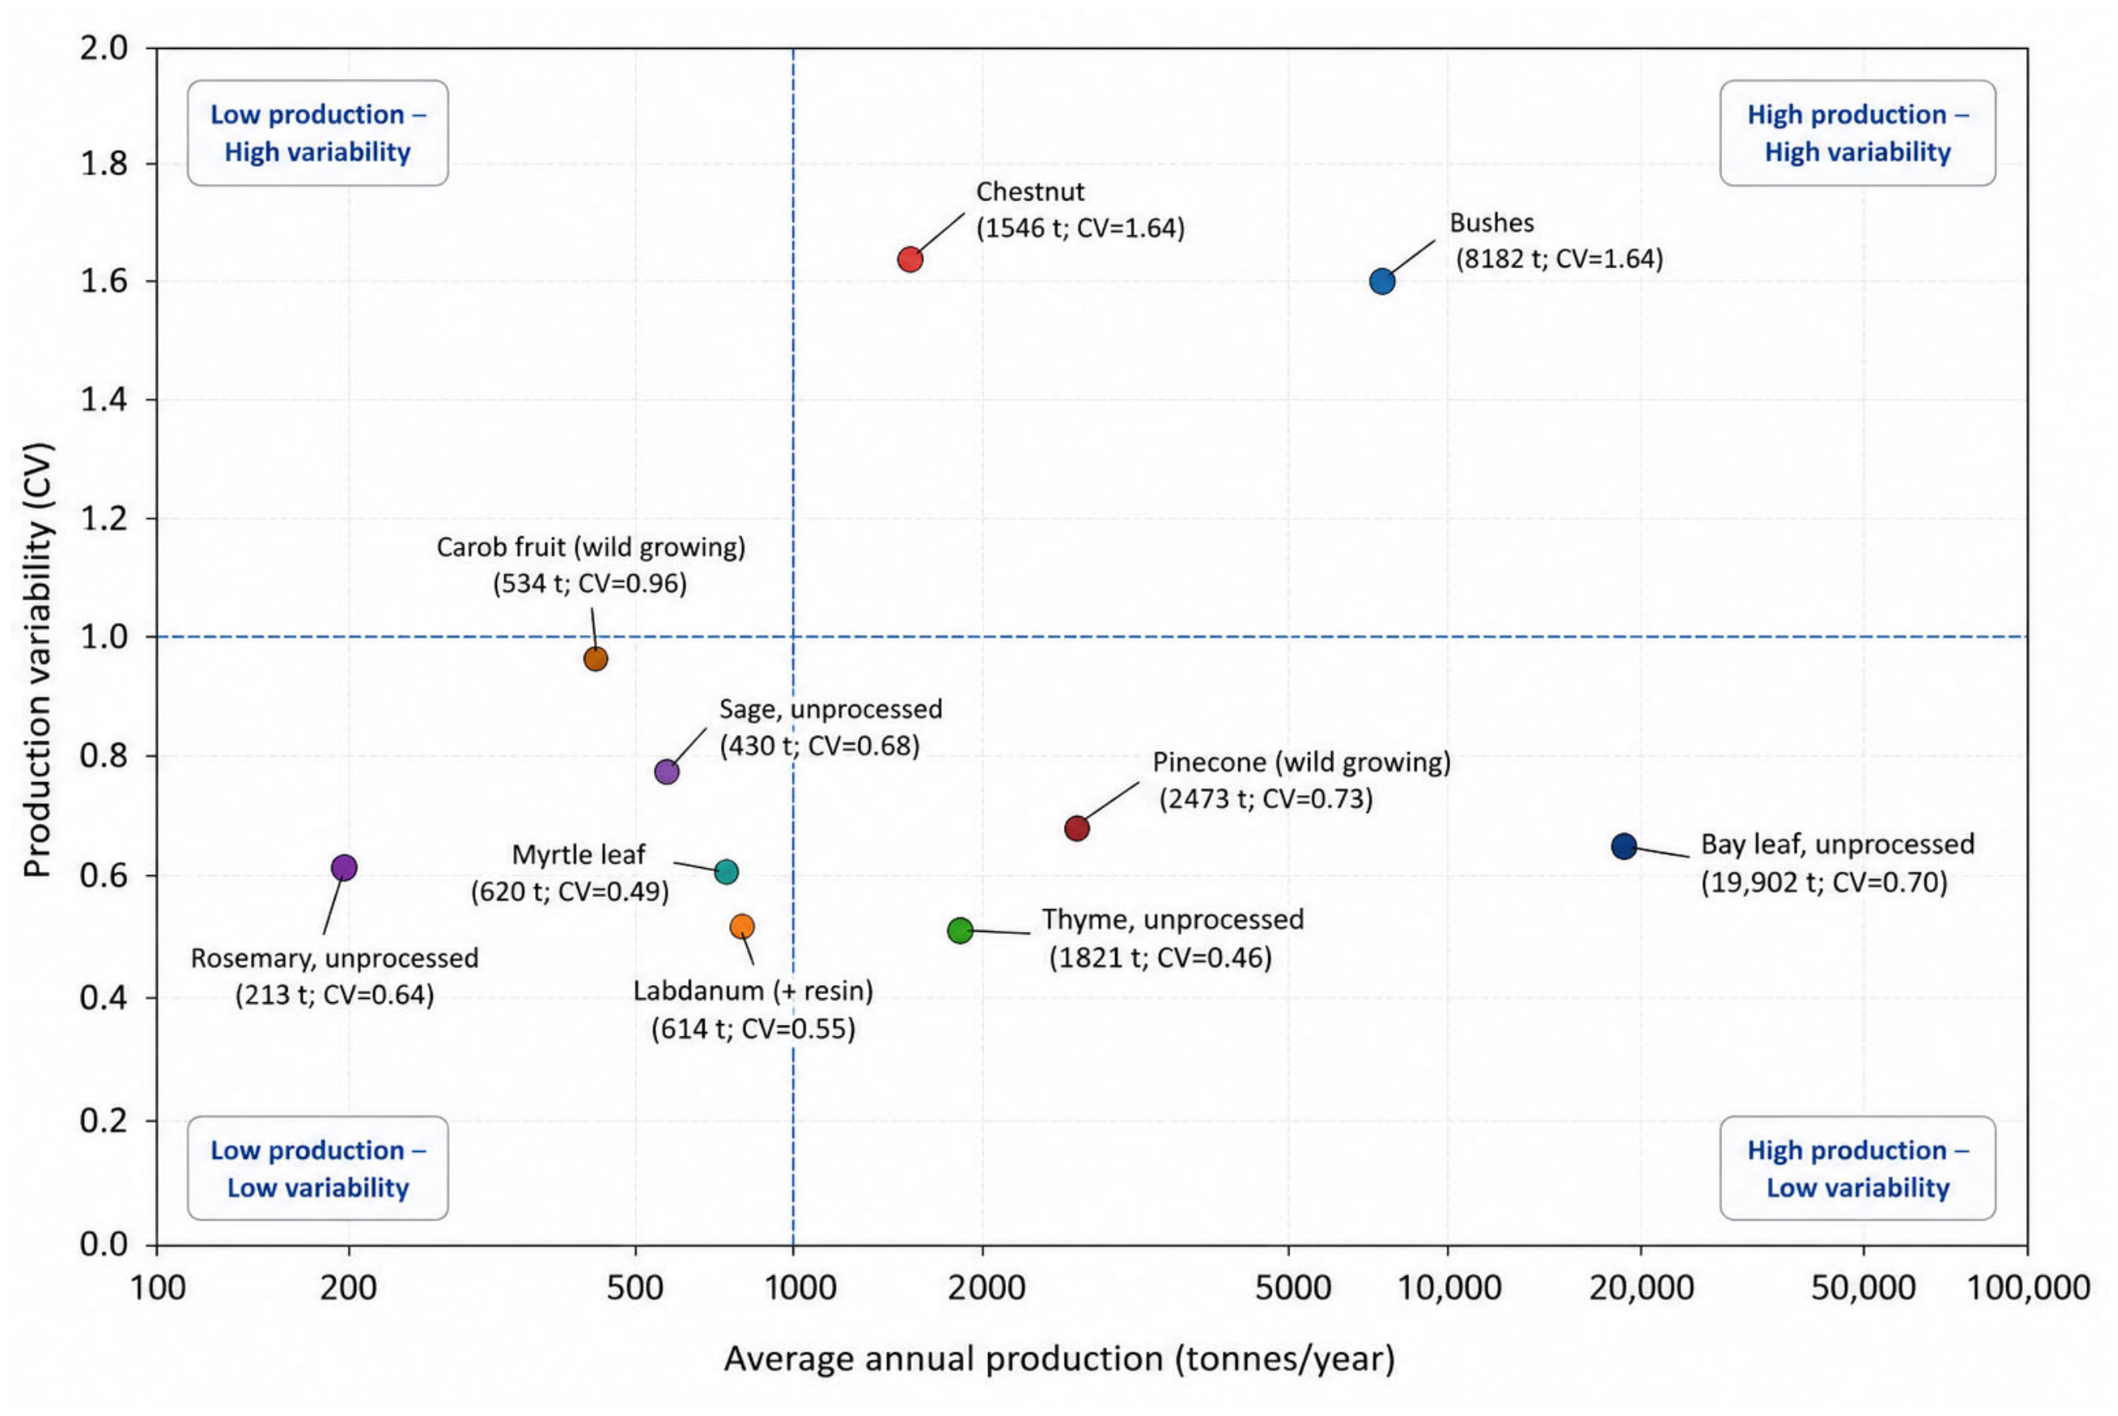
Figure 6 positions the analyzed NTFPs within a two-dimensional analytical framework defined by average production scale and production variability measured by the coefficient of variation (CV). Rather than applying predefined cluster categories, the figure uses reference thresholds based on median production levels and a CV threshold value of 1 to distinguish relatively high- and low-production products, as well as relatively stable and volatile production patterns.
The distribution of products presented in Figure 6 reveals a structurally differentiated and multi-layered NTFP production portfolio in which products with similar production levels may exhibit substantially different variability characteristics. High production levels do not necessarily correspond to stable production patterns, while some lower-volume products demonstrate relatively consistent outputs across years. These findings suggest that variability constitutes an independent dimension of portfolio structure alongside production scale.
Accordingly, the NTFP portfolio cannot be adequately evaluated on the basis of production intensity alone but should instead be understood as a heterogeneous risk structure shaped by the interaction between production scale and volatility. From a policy and management perspective, this highlights the importance of differentiated strategies that consider both production magnitude and stability characteristics when identifying strategic products and addressing volatility-related risks.

4. Discussion

The structural and volumetric transformation of Türkiye’s NTFP production system between 1988 and 2024 has been substantial. The diversification observed after 2000 suggests a gradual transition from a production structure dominated by a limited number of traditional products—such as chestnut, bay leaf, and carob—toward a broader portfolio including medicinal and aromatic products. This pattern is consistent with international evidence indicating that NTFP portfolios in developing countries tend to diversify in response to increasing market demand and export pressures [4,53]. From a portfolio theory perspective, diversification may reduce dependence on a limited number of dominant products while enhancing the adaptive capacity of resource-based production systems under changing market and environmental conditions.
Similarly, the simultaneous increase in diversity (Shannon index) and decline in concentration levels (HHI) during the 2000–2015 period reflects the emergence of a more balanced multi-product structure. Greater diversity is generally associated with improved resilience and reduced dependence on individual commodities [54]. However, the decline in diversity observed after 2018, together with increasing concentration levels, suggests a partial reversal of this trend and the renewed dominance of several core products [63]. This recent re-concentration process is most clearly reflected in the rapid expansion of bay leaf production. Such dynamics correspond closely to the diversification–concentration trade-off commonly discussed in socio-ecological production systems, in which increasing specialization may support short-term production growth while simultaneously increasing long-term systemic vulnerability. Comparable diversification and re-concentration processes have also been documented in other forest-based production systems undergoing commercialization and export expansion [64,65,66].
A limited contextual comparison with Lithuania’s multifunctional NTFP system further suggests that governance structures and socio-ecological use patterns may shape long-term portfolio dynamics differently across forest governance systems. Compared with the more multifunctional and socially embedded NTFP structures reported in Lithuania, the Turkish system appears relatively more production-oriented and market-driven. Nevertheless, the Lithuanian case is referenced here only as an illustrative European context rather than as a direct comparative analytical framework [64,65,66,67,68].
Production volatility also emerges as a defining characteristic of Türkiye’s NTFP system. In particular, bushes, chestnut, and labdanum (+resin) exhibit high coefficient of variation (CV) values, indicating strong sensitivity to environmental conditions, climatic variability, and institutional factors. This finding is consistent with previous studies linking ecological sensitivity to instability in NTFP supply chains [69]. In the Turkish context, these fluctuations may also be associated with chestnut diseases and broader biological stress factors [70,71]. Such patterns align with resilience-based approaches in natural resource management, which emphasize that ecological sensitivity and external shocks can substantially affect the stability of forest-dependent production systems.
Bay leaf represents the dominant product within the portfolio and simultaneously exhibits one of the highest levels of production volatility. Its combination of high production volume and high variability reflects a demand-driven and export-sensitive trajectory similar to those observed in commercialized NTFP markets [72]. This suggests that production variability is shaped not only by ecological constraints, but also by fluctuations in market conditions and supply-chain dynamics.
In contrast, several lower-volume products, including myrtle leaf and sage, display comparatively stable production trajectories [73]. Although these products contribute less to total production volume, their relatively stable outputs may play an important role in supporting rural livelihood resilience. This observation is consistent with previous research suggesting that small-scale NTFPs often function as relatively stable supplementary income sources within forest-dependent communities [12,44,74].
The relatively weak association identified between institutional support and production levels suggests that existing support mechanisms have limited explanatory power in accounting for long-term production variability [75]. Although financial support increased substantially, particularly after 2018, the results indicate that current support structures may not be sufficiently aligned with diversification-oriented and resilience-based management objectives. This finding implies that institutional support alone may be insufficient to strengthen long-term system resilience unless it is integrated with broader adaptive governance and risk-sensitive management strategies.
The product-level clustering analysis further demonstrates the usefulness of the volume–volatility framework in evaluating NTFP portfolio structures. The coexistence of highly volatile products alongside relatively stable low-volume products indicates a structurally heterogeneous production system in Türkiye, suggesting that production intensity alone is insufficient to explain systemic vulnerability. More broadly, declining diversity, increasing concentration, and rising volatility collectively point to a progressively less balanced production system. Although institutional support mechanisms appear to have contributed to overall production growth, they have not substantially strengthened portfolio resilience.
Overall, these findings highlight the importance of portfolio-based management approaches in NTFP systems. Long-term sustainability depends not only on increasing production volumes, but also on maintaining an appropriate balance between diversification, stability, and adaptive capacity. From a governance perspective, this underscores the need for diversification-oriented and risk-sensitive management strategies capable of addressing volatility, regional disparities, and product heterogeneity within the NTFP sector.

5. Conclusions

This study examined the structural transformation of Türkiye’s non-timber forest product (NTFP) production system during the period 1988–2024 using a comprehensive quantitative framework. The findings demonstrate that the system evolved through alternating phases of diversification, stabilization, and re-concentration rather than following a stable linear growth trajectory. These results indicate that structural change within the NTFP sector is shaped not only by increases in production volume, but also by shifts in portfolio composition, concentration patterns, and production stability.
Trend and diversity analyses suggest that Türkiye’s NTFP sector expanded and diversified substantially after 2000, particularly through the growing importance of medicinal and aromatic products. At the same time, traditional high-volume products such as bay leaf, chestnut, and carob continued to maintain a dominant position within the port-folio. However, the decline in diversity and the renewed concentration observed after 2018 indicate increasing structural dependence on a limited number of products, potentially reducing the resilience of the production system. Volatility analyses further reveal that production risks are unevenly distributed across products and that even dominant commodities may exhibit high levels of instability.
Although institutional support mechanisms expanded considerably over time, their relatively weak relationship with production dynamics suggests that existing governance instruments have limited capacity to strengthen diversification and long-term system resilience. Current support structures appear to prioritize production growth more strongly than portfolio resilience, indicating that increased output alone may be insufficient to reduce systemic vulnerability within the sector.
From a governance perspective, the findings highlight the need to move beyond product- or volume-oriented interventions toward a more portfolio-based management approach. Within the legal framework established by Forest Law No. 6831, NTFP governance in Türkiye is largely structured around centralized allocation and administrative planning mechanisms. Consequently, future governance strategies may need to incorporate diversification-oriented and risk-sensitive approaches within these existing institutional structures. Such strategies could include diversification incentives, adaptive support instruments, sustainable harvest planning, and stronger consideration of regional variability and ecological risk factors. Improved monitoring systems and more consistent long-term production data will also be essential for supporting evidence-based decision making.
Beyond the Turkish case, the findings contribute to broader discussions on the governance and sustainability of NTFP systems in forest-dependent economies. The results demonstrate that increasing production alone does not necessarily lead to resilience and that long-term sustainability depends equally on diversification, stability, and adaptive capacity.
By integrating trend analysis, diversity indicators, volatility assessment, and production–support relationships within a single analytical framework, this study provides a long-term portfolio-based perspective on NTFP system dynamics in Türkiye. Future research may benefit from more advanced time-series and causal modelling approaches incorporating lag structures, ecological variables, and market indicators in order to better understand the complex interactions shaping NTFP production systems over time.

Supplementary Materials

The following supporting information can be downloaded at: https://www.mdpi.com/article/10.3390/f17050619/s1. Table S1: Harmonization procedures applied to long-term NTFP production records (1988–2024).

Author Contributions

Conceptualization, H.T.Y., P.T., Ö.Y., N.T.Y., D.P., M.Š., M.A. and B.Š.; methodology, H.T.Y., N.T.Y., D.P., M.Š., M.A. and B.Š.; software, H.T.Y., P.T. and Ö.Y.; validation, H.T.Y., P.T., Ö.Y., N.T.Y. and D.P.; formal analysis, H.T.Y., P.T., Ö.Y., N.T.Y., D.P., M.Š., M.A. and B.Š.; investigation, H.T.Y., P.T. and Ö.Y.; resources, data curation, writing—original draft preparation, H.T.Y., P.T., Ö.Y., N.T.Y. and D.P.; writing—review and editing, H.T.Y., N.T.Y., D.P., M.Š., M.A. and B.Š.; visualization, H.T.Y., D.P., M.Š., M.A. and B.Š.; supervision, D.P., M.Š., M.A. and B.Š. All authors have read and agreed to the published version of the manuscript.

Funding

This research received no external funding.

Data Availability Statement

Data are contained within the article.

Conflicts of Interest

The authors declare no conflicts of interest.

References

  1. FAO. State of the World’s Forests 2014: Enhancing the Socioeconomic Benefits from Forests. FAO Website. 2014. Available online: https://openknowledge.fao.org/handle/20.500.14283/i3710e (accessed on 12 February 2026).
  2. FAO. Non-Wood Forest Products from Broad-Leaved Temperate Forests. 2021. Available online: https://www.fao.org/4/ae428e/ae428e02.htm (accessed on 12 February 2026).
  3. Weis, G.; Ludvig, A.; Živojinović, I. Embracing the non-wood forest products potential for bioeconomy: Analysis of innovation cases across Europe. Land 2023, 12, 305. [Google Scholar] [CrossRef]
  4. Shackleton, C.M.; Pandey, A.K. Positioning non-timber forest products on the development agenda. For. Policy Econ. 2014, 38, 1–7. [Google Scholar] [CrossRef]
  5. Wunder, A.; Angelsen, A.; Belcher, B. Forests, livelihoods, and conservation: Broadening the empirical base. World Dev. 2014, 64, 11. [Google Scholar] [CrossRef]
  6. Luo, Y.; Zhu, Z.; Zhang, X. Does Production and Trade in Non-Timber Forest Products Contribute to Sustainable Forest Economy Development? Evidence from the Bamboo Industry in Nanping, China. J. Sustain. For. 2026, 1–41. [Google Scholar] [CrossRef]
  7. FAO. FAO Forestry-Towards a Harmonised Definition of Non-Wood Forest Products; Unasylva, 198; Food and Agriculture Organisation: Rome, Italy, 1999. [Google Scholar]
  8. Botomia, J.E.; Bessone, M.; Lucungu, P.B.; Admettons, Z.; Baraka, J.A.; Miezi, E.; Mukole, J.N.; Nsilu, B.; Ngabinzeke, J.S.; Fruth, B. Importance of non-timber forest products in the livelihoods of rural communities in the Democratic Republic of the Congo. Trees For. People 2026, 25, 101266. [Google Scholar] [CrossRef]
  9. Boyapati, T.; Muthukumarappan, K. Non-timber forest products and the bioeconomy: Linking livelihood security and biodiversity conservation (2015–2025 trends). Front. Sustain. Food Syst. 2025, 9, 1714576. [Google Scholar] [CrossRef]
  10. Mann, C.; Loft, L.; Hernández-Morcillo, M. Assessing forest governance innovations in Europe: Needs, challenges and ways forward for sustainable forest ecosystem service provision. Ecosyst. Serv. 2021, 52, 101384. [Google Scholar] [CrossRef]
  11. Hailemicheal, H.G.; Senbeta, F.; Tefera, T.; Seyoum, A. Rural household livelihood strategy, household reliance on forest goods, and its effect on protected areas: Evidence from communities adjacent to Kafta-Sheraro National Park, Ethiopia. J. Agric. Food Res. 2024, 17, 101233. [Google Scholar] [CrossRef]
  12. Scott, M.M.; Carolan, M.S.; Long, M.A. The role of wild food in fostering healthy, sustainable, and equitable food systems. Sustainability 2024, 16, 9556. [Google Scholar] [CrossRef]
  13. Shackleton, C.; Adeyemi, A.; Setty, S. Why are non-wood forest products still the poor relative in global forest resources assessments? For. Policy Econ. 2024, 163, 103232. [Google Scholar] [CrossRef]
  14. Yıldızbaş, N.T.; Gençay, G.; Birben, Ü.; Oskay, F.; Perkumienė, D.; Škėma, M.; Aleinikovas, M. Benefits beyond the physical: How urban green areas shape public health and environmental awareness in Istanbul. Forests 2025, 16, 786. [Google Scholar] [CrossRef]
  15. Angelsen, A.; Jagger, P.; Babigumira, R.; Belcher, B.; Hogarth, N.J.; Bauch, S.; Börner, J.; Smith-Hall, C.; Wunder, S. Environmental income and rural livelihoods: A global-comparative analysis. World Dev. 2014, 64, 12–28. [Google Scholar] [CrossRef]
  16. Amadu, F.O.; Miller, D.C. The impact of forest product collection and processing on household income in rural Liberia. For. Policy Econ. 2024, 158, 103098. [Google Scholar] [CrossRef]
  17. Laird, S.A.; McLain, R.; Wynberg, R. Wild Product Governance: Finding Policies That Work for Non-Timber Forest Products; Earthscan: London, UK, 2010; 384p. [Google Scholar]
  18. Ali, N.; Hu, X.; Hussain, J. The dependency of rural livelihood on forest resources in Northern Pakistan’s Chaprote Valley. Glob. Ecol. Conserv. 2020, 22, e01001. [Google Scholar] [CrossRef]
  19. Constant, N.L.; Taylor, P.J. Restoring the forest revives our culture: Ecosystem services and values for ecological restoration across the rural–urban nexus in South Africa. For. Policy Econ. 2020, 118, 102222. [Google Scholar] [CrossRef]
  20. Kurttila, M.; Pukkala, T.; Miina, J. Synergies and trade-offs in the production of non-wood forest products in boreal forests. Forests 2018, 9, 417. [Google Scholar] [CrossRef]
  21. Benedum, M.E.; Cook, N.J.; Vallury, S. Remittance income weakens participation in community-based natural resource management. Ecol. Soc. 2025, 30, 34. [Google Scholar] [CrossRef]
  22. Croitoru, L. Valuing the non-timber forest products in the Mediterranean region. Ecol. Econ. 2007, 63, 768–775. [Google Scholar] [CrossRef]
  23. Hanley, N. Valuing Mediterranean forests: Towards total economic value. Mt. Res. Dev. 2008, 28, 339–340. [Google Scholar] [CrossRef]
  24. Miina, J.; Kurttila, M.; Calama, R.; de Miguel, S.; Pukkala, T. Modelling non-timber forest products for forest management planning in Europe. Curr. For. Rep. 2020, 6, 309–322. [Google Scholar] [CrossRef]
  25. Belcher, B.; Ruiz-Pérez, M.; Achdiawan, R. Global patterns and trends in the use and management of commercial NTFPs: Implications for livelihoods and conservation. World Dev. 2005, 33, 1435–1452. [Google Scholar] [CrossRef]
  26. Sheppard, J.P.; Chamberlain, J.; Agúndez, D.; Bhattacharya, P.; Chirwa, P.W.; Gontcharov, A.; Sagona, W.C.J.; Shen, H.; Tadesse, W.; Mutke, S. Sustainable forest management beyond the timber-oriented status quo: Transitioning to co-production of timber and non-wood forest products. Curr. For. Rep. 2020, 6, 26–40. [Google Scholar] [CrossRef]
  27. Ticktin, T. The ecological implications of harvesting non-timber forest products. J. Appl. Ecol. 2004, 41, 11–21. [Google Scholar] [CrossRef]
  28. Şahin, G.; Yurdakul Erol, S.; Yorulmaz, Ö. Understanding perceived impacts of large-scale projects on forest-edge populations. Forests 2025, 16, 879. [Google Scholar] [CrossRef]
  29. Schimetka, L.R.; Ingram, V.J. Leveraging the value chain–landscape governance nexus for non-wood forest products and tropical forest restoration. For. Policy Econ. 2024, 169, 103340. [Google Scholar] [CrossRef]
  30. European Commission. A Sustainable Bioeconomy for Europe: Strengthening the Connection Between Economy, Society and the Environment. European Commission Website. 2019. Available online: https://ecrn.net/wp-content/uploads/2019/05/COR-Opinion-on-Bioeconomy.pdf (accessed on 12 February 2026).
  31. Faydaoğlu, E.; Sürücüoğlu, M. Aromatik bitkilerin Türkiye’de kullanımı ve önemi. Kastamonu Üniv. Orman Fak. Derg. 2011, 11, 52–67. (In Turkish) [Google Scholar]
  32. Acıbuca, V.; Bostan Budak, D. Dünya’da ve Türkiye’de tıbbi ve aromatik bitkilerin yeri ve önemi. Çukurova Tarım Gıda Bilim. Derg. 2018, 33, 37–44. (In Turkish) [Google Scholar]
  33. Perkumienė, D.; Atalay, A.; Safaa, L.; Škėma, M.; Aleinikovas, M. Innovative strategies of sustainable waste management in recreational activities for a clean and safe environment in Turkey, Lithuania, and Morocco. Forests 2025, 16, 997. [Google Scholar] [CrossRef]
  34. Büyükgebiz, T.; Fakir, H.; Negiz, M.G. Sütçüler (Isparta) yöresinde doğal odun dışı bitkisel orman ürünleri ve geleneksel kullanımları. Süleyman Demirel Üniv. Orman Fak. Derg. A 2008, 1, 109–120. (In Turkish) [Google Scholar]
  35. Fidan, M.S.; Öz, A.; Adanur, H.; Turan, B. Gümüşhane yöresinde yetişen bazı önemli odun dışı orman ürünleri ve kullanım miktarları. Gümüşhane Üniv. Fen Bilim. Derg. 2013, 3, 40–48. (In Turkish) [Google Scholar]
  36. Gedik Sarı, S.; Güneş, Y.; Eker, Ö.; Görücü, Ö. Bazı odun dışı orman ürünlerinin sosyo-ekonomik analizi: Elazığ Orman Bölge Müdürlüğü örneği. Turk. J. For. Sci. 2023, 7, 223–242. (In Turkish) [Google Scholar] [CrossRef]
  37. Yurdakul Erol, S.; Topcu, Y.I.; Şahin, G. Identifying and prioritizing traditional knowledge-related strategies within Turkish forest policy: The perspective of forest managers. Int. For. Rev. 2023, 25, 264–282. [Google Scholar] [CrossRef]
  38. Yıldırım, H.T.; Yurdakul Erol, S. Non-wood forest products as an instrument for rural development: Perspective of forest villagers from Istanbul. J. Environ. Prot. Ecol. 2018, 19, 1182–1192. [Google Scholar]
  39. Yıldırım, H.T. Orman toplum ilişkileri açısından odun dışı orman ürünleri üretiminin sosyo-ekonomik etkilerinin irdelenmesi. In Proceedings of the 1st International Symposium on Silvopastoral Systems and Nomadic Societies in Mediterranean Countries, Isparta, Turkey, 22–24 October 2018. [Google Scholar]
  40. Başar, H. Ege Bölgesi odun dışı orman ürünleri sanayinin mevcut durumu. Orman. Araştırma Derg. 2021, 8, 69–79. (In Turkish) [Google Scholar] [CrossRef]
  41. Elvan, O.D.; Uyar, Ç.; Perkumienė, D.; Baimuratkyzy Umbetbayeva, Z.; Afrand Sorkhani, H.R.; Czakowska, M.; Velioğlu, N.; Škėma, M.; Aleinikovas, M.; Beriozovas, O. Comparison of Forest Laws According to Sustainable Forest Management Criteria: The Example of Türkiye, Lithuania, Poland, Kazakhstan, Iran. Forests 2026, 17, 82. [Google Scholar] [CrossRef]
  42. Pakdemirli, B.; Birişik, N.; Akay, M. General overview of medicinal and aromatic plants in Turkey. Anadolu J. Aegean Agric. Res. Inst. 2021, 31, 126–135. [Google Scholar] [CrossRef]
  43. Uzun, H.; Bekiroğlu Öztürk, S.; Kalkan Balcı, K.K. ORKÖY ferdi proje uygulamalarının orman köylüsüne sosyoekonomik katkısı (Sakarya Orman Bölge Müdürlüğü örneği). Orman. Araştırma Derg. 2023, 10, 152–167. (In Turkish) [Google Scholar] [CrossRef]
  44. Belcher, B.; Schreckenberg, K. Commercialisation of non-timber forest products: A reality check. Dev. Policy Rev. 2007, 25, 355–377. [Google Scholar] [CrossRef]
  45. Demirci, U.; Aydın, İ.Z. Kırsal kalkınma desteklemeleri üzerine bir değerlendirme: Artvin ili örneği. Artvin Çoruh Üniv. Uluslararası Sos. Bilim. Derg. 2022, 8, 53–68. (In Turkish) [Google Scholar] [CrossRef]
  46. Kurt, R.; Karayılmazlar, S.; İmren, E.; Çabuk, Y. Türkiye ormancılık sektöründe odun dışı orman ürünleri: İhracat analizi. Bartın Orman Fak. Derg. 2016, 18, 158–167. (In Turkish) [Google Scholar] [CrossRef]
  47. Okumuş, A.; Pak, M. Türkiye ormancılığındaki odun dışı orman ürünleri ve hizmetlerine yönelik işletmecilik yaklaşımlarındaki değişimlerin analizi. Artvin Çoruh Üniv. Orman Fak. Derg. 2025, 26, 230–243. (In Turkish) [Google Scholar] [CrossRef]
  48. Samet, H.; Cikili, Y. Importance of medicinal and aromatic plants as an alternative crop in the rural development of Turkey. J. Rural Community Dev. 2015, 10, 75–84. [Google Scholar]
  49. Karık, Ü.; Tunçtürk, M. Production, trade and future perspective of medicinal and aromatic plants in Turkey. Anadolu J. Aegean Agric. Res. Inst. 2019, 29, 154–163. [Google Scholar] [CrossRef]
  50. Raimov, R.; Fakir, H. Orman köylülerinin odun dışı orman ürünlerini kullanım olanakları (Eğirdir yöresi örneği). Bilge Int. J. Sci. Technol. Res. 2018, 2, 132–144. (In Turkish) [Google Scholar] [CrossRef]
  51. OGM. Orman Genel Müdürlüğü Istatistzik Verileri 2024. OGM Website. 2024. Available online: https://www.ogm.gov.tr/tr/e-kutuphane/resmi-istatistikler (accessed on 12 February 2026). (In Turkish)
  52. Gujarati, D.N.; Porter, D.C. Basic Econometrics, 5th ed.; McGraw-Hill/Irwin: New York, NY, USA, 2009; ISBN 978-0-07-337577-9. [Google Scholar]
  53. Pergola, M.; De Falco, E.; Belliggiano, A.; Ievoli, C. The most relevant socio-economic aspects of medicinal and aromatic plants through a literature review. Agriculture 2024, 14, 405. [Google Scholar] [CrossRef]
  54. Rosenfeld, T.; Pokorny, B.; Marcovitch, J.; Poschen, P. Bioeconomy based on non-timber forest products for development and forest conservation: Untapped potential or false hope? For. Policy Econ. 2024, 163, 103228. [Google Scholar] [CrossRef]
  55. Wooldridge, J.M. Introductory Econometrics: A Modern Approach, 5th ed.; Cengage Learning: Mason, OH, USA, 2013; ISBN 978-1-111-53104-1. [Google Scholar]
  56. Lande, R. Statistics and Partitioning of Species Diversity, and Similarity among Multiple Communities. Oikos 1996, 76, 5–13. [Google Scholar] [CrossRef]
  57. Brezina, I.; Pekár, J.; Cicková, Z.; Reiff, M. Herfindahl–Hirschman index level of concentration values modification and analysis of their change. Cent. Eur. For. J. 2016, 24, 49–72. [Google Scholar] [CrossRef]
  58. Ortiz-Burgos, S. Shannon–Weaver diversity index. In Encyclopedia of Estuaries; Kennish, M.J., Ed.; Springer: Dordrecht, The Netherlands, 2016. [Google Scholar] [CrossRef]
  59. Cai, Z.; Hong, H.; Wang, S. Econometric modeling and economic forecasting. J. Manag. Sci. Eng. 2018, 3, 178–182. [Google Scholar] [CrossRef]
  60. Eryılmaz, Ü. Türkiye ekonomisine ilişkin bir makroekonometrik model üzerinde bifurkasyon analizi. BDDK Bankacılık Finans. Piyas. Derg. 2021, 15, 289–311. [Google Scholar] [CrossRef]
  61. Piñeiro, V.; Arias, J.; Dürr, J.; Elverdin, P.; Ibáñez, A.M.; Kinengyere, A.; Opazo, C.M.; Owoo, N.; Page, J.R.; Prager, S.D.; et al. A scoping review on incentives for adoption of sustainable agricultural practices and their outcomes. Nat. Sustain. 2020, 3, 809–820. [Google Scholar] [CrossRef]
  62. Huber, P.; Kurttila, M.; Hujala, T.; Wolfslehner, B.; Sanchez-Gonzalez, M.; Pasalodos-Tato, M.; de Miguel, S.; Bonet, J.A.; Marques, M.; Borges, J.G.; et al. Expert-based assessment of the potential of non-wood forest products to diversify forest bioeconomy in six European regions. Forests 2023, 14, 420. [Google Scholar] [CrossRef]
  63. Acemoğlu, D. Directed technical change. Rev. Econ. Stud. 2002, 69, 781–809. [Google Scholar] [CrossRef]
  64. Lovrić, M.; Da Re, R.; Vidale, E.; Prokofieva, I.; Wong, J.; Pettenella, D.; Verkerk, P.J.; Mavsar, R. Non-wood forest products in Europe. For. Policy Econ. 2020, 116, 102175. [Google Scholar] [CrossRef]
  65. Wolfslehner, B.; Prokofieva, I.; Mavsar, R. (Eds.) Non-Wood Forest Products in Europe: Seeing the Forest Around the Trees; European Forest Institute: Joensuu, Finland, 2019. [Google Scholar]
  66. State Data Agency (Lithuania). Forests Statistics 2023. Available online: https://osp.stat.gov.lt/en/lietuvos-aplinka-zemes-ukis-ir-energetika-2023/aplinka/miskai (accessed on 14 May 2026).
  67. Balčiauskas, L. Red Deer in Lithuania: History, Status and Management. Sustainability 2022, 14, 14091. [Google Scholar] [CrossRef]
  68. Saoualih, A.; Perkumienė, D.; Safaa, L.; Škėma, M.; Aleinikovas, M. Computational mining of empirical literature on forest recreation: A semantic-driven topic modeling approach based on advanced contextual embeddings. Trees For. People 2025, 20, 100877. [Google Scholar] [CrossRef]
  69. Meinhold, K.; Dumenu, W.K.; Darr, D. Connecting rural non-timber forest product collectors to global markets: The case of baobab. For. Policy Econ. 2022, 134, 102628. [Google Scholar] [CrossRef]
  70. Meleti, E.; Kossyva, V.; Maisoglou, I.; Vrontaki, M.; Manouras, V.; Tzereme, A.; Alexandraki, M.; Koureas, M.; Malissiova, E.; Manouras, A. The nutritional benefits and sustainable by-product utilization of chestnuts: A comprehensive review. Agriculture 2024, 14, 2262. [Google Scholar] [CrossRef]
  71. Fernandes, P.; Colavolpe, M.B.; Serrazina, S.; Costa, R.L. European and American chestnuts: An overview of the main threats and control efforts. Front. Plant Sci. 2022, 13, 951844. [Google Scholar] [CrossRef]
  72. Alexiades, M.N.; Shanley, P. Forest products, livelihoods and conservation: Case studies of non-timber forest product systems. In Productos Forestales, Medios de Subsistencia y Conservación; Alexiades, M.N., Shanley, P., Eds.; CIFOR: Rome, Italy, 2004; pp. 1–23. [Google Scholar]
  73. Güngör, E.; Çoban, M. Kırsal kalkınma aracı olarak defne toplayıcılığının durum analizi. Bartın Orman Fak. Derg. 2024, 26, 119–136. (In Turkish) [Google Scholar] [CrossRef]
  74. Hajjar, R.; Kozak, R.A.; Innes, J.L. Is decentralization leading to “real” decision-making power for forest-dependent communities? Ecol. Soc. 2012, 17, 12. [Google Scholar] [CrossRef]
  75. Adam, Y.O.; Pretzsch, J.; Pettenella, D. Contribution of non-timber forest product livelihood strategies to rural development in drylands of Sudan: Potentials and failures. Agric. Syst. 2013, 117, 90–97. [Google Scholar] [CrossRef]
Figure 1. Methodological framework and analytical workflow of the study.
Forests 17 00619 g001
Figure 2. (A) Annual production of bay leaf (unprocessed) and bushes (tons) over the period 1988–2024. (B) Medium- and lower-volume products illustrate finer-scale production dynamics.
Forests 17 00619 g002aForests 17 00619 g002b
Figure 3. Annual trends in Shannon diversity index (solid line) and Herfindahl–Hirschman concentration index (dashed line) in Türkiye’s NTFP production system (1988–2024).
Forests 17 00619 g003
Figure 4. Annual trend in real terms of individual support provided to forest villagers (1974–2024).
Forests 17 00619 g004
Figure 5. Comparison of total NTFP production and inflation-adjusted individual support levels in Türkiye during the period 1988–2024 using a dual-axis time-series framework. (The blue line represents total NTFP production (tons) using the left Y-axis, whereas the orange line represents inflation-adjusted individual support values (real TL) using the right Y-axis.)
Forests 17 00619 g005
Figure 6. Production scale and variability (CV) of focal NTFPs in Türkiye (2000–2024). Note: The plotted points correspond exclusively to the focal NTFP categories analyzed throughout the study, including bay leaf, bushes, pinecone, thyme, chestnut, myrtle leaf, sage, carob fruit, labdanum (+resin), and rosemary, unprocessed.
Forests 17 00619 g006
Table 1. Linear trend analysis for the ten focal NTFPs (1988–2024).
Productβ (Slope)Std. Errort-Valuep-ValueR2
Bay leaf, unprocessed1156.6097.7811.83<0.0010.80
Bushes−518.02389.61−1.330.1970.07
Thyme, unprocessed−44.4114.63−3.040.0050.22
Pinecone (wild growing)64.0528.772.230.0330.13
Chestnut186.1160.423.080.0050.29
Myrtle leaf0.988.590.110.9100.00
Sage, unprocessed−3.414.35−0.780.4390.02
Carob fruit (wild growing)50.819.925.12<0.0010.53
Labdanum−11.105.28−2.100.0440.13
Rosemary, unprocessed−3.102.16−1.430.1610.06
Table 2. Period averages of Shannon diversity and HHI concentration indices (1988–2024).
PeriodExplanationShannon (Mean)HHI (Mean)
1988–1999Early stage: narrow portfolio, high concentration1.020.48
2000–2009Diversification phase: low concentration, expanding portfolio1.590.33
2010–2017Balancing period: medium diversity, medium concentration1.410.39
2018–2024Refocusing period: diversified but increasingly unbalanced portfolio1.030.57
Table 3. Period averages, standard deviations, and CV for total NTFP production.
PeriodAverage Production (Tonnes)Std. DeviationCV
1988–199962142.9870.48
2000–200998733.1140.32
2010–201713,4424.8850.36
2018–202419,73110.4420.53
Table 4. Pearson and Spearman correlations between NTFPs production and individual subsidies (1988–2024).
VariablesPearson rp-ValueSpearman ρp-Value
Production (total tonnes)—Individual supports (TL, real)0.410.0180.370.029
Table 5. Linear regression results between production (dependent variable) and individual support (independent variable).
CoefficientsβStd. Errort-Valuep-Value
Constant4.8121.3383.590.001
Individual support (TL, real)0.000370.000152.430.020
Table 6. Descriptive production statistics for selected NTFPs with comparable records during the period 2000–2024.
NoProduct TypeAverage Production (Tonnes/Year)Min (Ton)Max (Ton)Std. DeviationCV
1Bay leaf, unprocessed19,901.903350.0047,250.0013,843.600.7
2Bushes8181.50056,266.0013,393.601.64
3Pinecone (wild growing)2473.406756266.001816.000.73
4Thyme, unprocessed1820.607683863.00830.60.46
5Chestnut1546.0037019.002534.601.64
6Myrtle leaf620591418.00303.20.49
7Sage, unprocessed430.2511489.00292.80.68
8Carob fruit (wild growing)533.6231962.00512.20.96
9Labdanum (+resin)613.6751374.003400.55
10Rosemary, unprocessed213.20599136.60.64
Note: Resin and labdanum were combined under the category “Labdanum (+resin)” to ensure consistency with the focal product classification used throughout the study.
Disclaimer/Publisher’s Note: The statements, opinions and data contained in all publications are solely those of the individual author(s) and contributor(s) and not of MDPI and/or the editor(s). MDPI and/or the editor(s) disclaim responsibility for any injury to people or property resulting from any ideas, methods, instructions or products referred to in the content.