Article

Spatiotemporal Dynamics of Soil Organic Carbon in the Qinling Mountains and Its Responses to Future Climate Change


1
School of Human Settlements and Civil Engineering, Xi’an Jiaotong University, Xi’an 710049, China
2
College of Grassland Science and Technology, China Agricultural University, Beijing 100193, China
3
Inner Mongolia Academy of Agricultural & Animal Husbandry Sciences, Hohhot 010031, China
4
College of Grassland Agriculture, Northwest A&F University, Yangling 712100, China
5
Department of Agroecology, Aarhus University, 4200 Slagelse, Denmark
6
Shaanxi Key Laboratory of Qinling Ecological Intelligent Monitoring and Protection, School of Life Science and Technology, Northwestern Polytechnical University, Xi’an 710012, China
*
Author to whom correspondence should be addressed.
These authors contributed equally to this work.
Forests 2026, 17(5), 581; https://doi.org/10.3390/f17050581
Submission received: 31 March 2026 / Revised: 2 May 2026 / Accepted: 6 May 2026 / Published: 9 May 2026
(This article belongs to the Special Issue Carbon Dynamics of Forest Soils Under Climate Change)

Abstract

Soil organic carbon (SOC) is pivotal to the terrestrial carbon cycle and climate regulation, yet its spatiotemporal dynamics and future climate responses across soil layers remain insufficiently understood in mountainous ecosystems. Taking the Qinling Mountains, a typical mountainous ecological barrier in central China with a total area of approximately 38.18 × 10⁴ km2, as the study area, we analyzed historical SOC changes (1980s–2010s) and projected its future dynamics under different scenarios using a validated Random Forest model (R2 = 0.81 for 0–20 cm, SOC20; 0.73 for 0–100 cm, SOC100), and further disentangled dominant drivers. Results showed historical mean SOC density increased, with higher storage in western/central high-elevation zones and lower values in southern/eastern low-elevation areas. Climate was the primary driver of SOC20 dynamics, while SOC100 was jointly regulated by climate, vegetation, and environmental factors, indicating weakened climatic control with increasing soil depth. Precipitation increases partially offset warming-induced SOC loss, leading to small changes in regional mean SOC density, but strong spatial heterogeneity resulted in substantial total SOC stock losses (SOC20: −1.41 to −6.59 Tg C; SOC100: −6.86 to −28.76 Tg C), with net losses in high-elevation zones and gains in low-elevation areas. SOC within the whole 1 m soil profile exhibited larger climate-driven changes than topsoil. These findings advance understanding of SOC dynamics in complex mountainous ecosystems and provide key scientific insights for regional carbon cycle assessments under climate change.

1. Introduction

Soil organic carbon (SOC) is a core component of terrestrial carbon cycles, modulating global climate change and sustaining ecosystem stability via carbon sequestration and turnover [1]. Mountainous ecosystems, with their complex topographic and hydrothermal heterogeneity, serve as critical terrestrial carbon sinks and are highly sensitive to climate change, making them key to studying carbon cycle responses to global environmental change [2,3,4,5]. The Qinling Mountains, a pivotal ecological barrier and biogeographic boundary between northern and southern China, demarcate climatic and vegetative transitions and form the core of central China’s terrestrial carbon pool, with diverse forest, shrub and grassland ecosystems supporting substantial SOC storage across soil depths [2,6,7,8]. As a representative mountainous ecosystem sensitive to climate change, clarifying the spatiotemporal dynamics of SOC in the Qinling Mountains and its responses to future climate change can reveal the general patterns of mountain SOC responses to global warming. This region has undergone notable hydrothermal changes in recent decades [9], and such clarification is scientifically vital for quantifying regional carbon sink capacity, optimizing ecological management strategies, and supporting national carbon neutrality goals [7].
Despite considerable advances in understanding SOC dynamics and climate change responses in mountainous regions [10,11,12], our understanding of SOC dynamics in the Qinling Mountains remains incomplete, particularly with regard to the systematic characterization of spatiotemporal and vertical differentiation patterns and their underlying driving mechanisms [13,14,15]. Most previous studies on mountain SOC have concentrated on static distribution patterns or single-period investigations, with relatively limited long-term continuous monitoring and multi-decadal simulations of SOC dynamics [16,17,18,19]. Consequently, the temporal evolution of SOC in both topsoil and whole 1 m soil layers has not yet been fully documented. In terms of driving mechanism analysis, existing research has mostly focused on the single effect of climate or vegetation on SOC [20,21,22,23,24], ignoring the synergistic and coupled effects of multiple drivers including climate change, vegetation growth and environmental variation (e.g., atmospheric CO2 concentration and nitrogen deposition) [25,26,27], and there is a lack of quantitative differentiation of the relative contributions of different drivers to SOC dynamics in different soil layers [6,28]. This deficiency leads to an incomplete understanding of the vertical differentiation of SOC driving mechanisms in the Qinling Mountains, especially the unclear regulatory role of belowground vegetation processes and environmental factors on deep SOC storage.
Current projections of SOC responses to future climate change in the Qinling Mountains remain relatively preliminary. Most studies have focused on changes in regional mean SOC density, with less attention given to variations in total SOC stock and the spatial heterogeneity of SOC responses [7]. Given the complex topography of the Qinling Mountains, hydrothermal conditions and ecosystem types exhibit strong spatial variability [29], and SOC responses to climate change are likely to differ considerably across elevation zones [4,30,31]. However, existing studies have not fully addressed the spatial trade-offs in SOC changes between high- and low-elevation zones under future climate scenarios, nor have they quantified how offsetting SOC changes across subregions may influence the regional carbon budget [4]. Moreover, the differential SOC dynamics across contrasting elevation zones remain poorly quantified in future projections. These gaps reduce the robustness of regional carbon sink capacity assessments and complicate the development of targeted ecological conservation and management strategies for the Qinling Mountains.
To address these research gaps, this study takes the Qinling Mountains as a representative mountainous case to investigate the spatiotemporal dynamics of topsoil (0–20 cm) and whole 1 m soil profile (0–100 cm) SOC and their responses to future climate change, drawing on long-term in situ observations and multi-source environmental covariates. We employed a validated Random Forest model to simulate historical SOC variations and a factorial simulation framework to quantify the relative contributions of climate change, vegetation growth and environmental variation to SOC dynamics, clarifying their vertical and spatial differentiation characteristics. Future SOC changes under three SSP scenarios were projected based on bias-corrected and downscaled climate data from multiple global climate models, with a focused analysis of the spatial heterogeneity of SOC responses to climate change. This study aims to reveal the long-term evolution and driving mechanisms of SOC in different soil layers of the Qinling Mountains, identify key regions of SOC change under future climate scenarios, and elucidate the spatial trade-offs in SOC responses to climate change across elevation gradients. The results are expected to provide novel insights and supplementary evidence for understanding SOC dynamics and their responses to climate change in mountainous ecosystems worldwide and offer a scientific basis for ecological protection and carbon sink management in typical mountainous ecological barriers.

2. Materials and Methods

2.1. Study Area

This study was conducted in the Qinling Mountains (101° E–113° E, 32° N–35° N), with a total area of approximately 38.18 × 10⁴ km2. As a pivotal ecological barrier and biogeographic boundary in central China, it demarcates the climatic and vegetative transition between northern and southern China (Figure 1a). Stretching approximately 1600 km from west to east, the mountain range encompasses a complex topographic gradient and diverse soil-forming environments, supporting a mosaic of forest, shrub, and grassland ecosystems that form the core of China’s central terrestrial carbon pool [8]. The region experiences a continental monsoon climate, with annual precipitation ranging from 600 to 1200 mm and annual mean temperature varying from 6 to 16 °C, creating heterogeneous hydrothermal conditions that drive spatial variability in SOC storage across different soil depths. As a representative and typical mountainous ecosystem in China, the Qinling Mountains are highly sensitive to climate change and anthropogenic disturbances, making it an ideal study area to investigate the temporal and vertical dynamics of SOC storage in mountainous ecosystems [7]. The SOC measurement sites (Figure 1b,c) cover the full extent of the Qinling Mountains, with datasets spanning the 1980s, 2000s, and 2010s, enabling a comprehensive assessment of SOC changes in both topsoil (0–20 cm, SOC20) and whole 1 m soil profile (0–100 cm, SOC100) across the study region.

2.2. Data

We compiled long-term measurements of SOC across the Qinling Mountains from three independent datasets. SOC records for the 1980s were obtained from the Second National Soil Survey of China [32,33,34,35]. Measurements spanning 2000–2014 were derived from Xu et al. [36]. The SOC density dataset covering 2010–2024 was acquired from Chen et al. [37]. From these compilations, SOC density values were extracted for two standard soil layers: 0–20 cm (SOC20) and 0–100 cm (SOC100). Topsoil is defined as the 0–20 cm mineral soil layer, and the whole 1 m soil profile refers to the 0–100 cm mineral soil layer. All SOC measurements adopted in this study represent mineral soil carbon only, and the forest floor litter layer is explicitly excluded from all calculations. The datasets for the 2000s have already been standardized to these two depth intervals in the original published literature. For methodological consistency, we unified the data extraction depth of the 1980s and 2010–2024 datasets following the identical 0–20 cm and 0–100 cm criteria, ensuring consistent depth definition across all three periods. For SOC20, a total of 109, 46, and 249 sampling sites were available for the 1980s, 2000s, and 2010s, respectively. Correspondingly, the site numbers of SOC100 were 126 in the 1980s, 20 in the 2000s, and 80 in the 2010s (Figure 1b,c). All SOC records adopted in this study are publicly available synthesized datasets from the Second National Soil Survey of China and peer-reviewed published datasets, where the detailed field sampling design and laboratory measurement protocols have been explicitly reported in their original studies [32,33,34,35,36,37].
Notably, direct SOC density measurements were available for the two periods 2000–2024, whereas only soil organic matter (SOM) content data were provided in the Second National Soil Survey. We therefore converted SOM to SOC density using the following mass-balanced calculation:
S O C = i = 1 n D i × B i × S O M i × 0.58 × ( 1 C i / 100 ) / 100
where Di is soil layer thickness (cm), Bi is bulk density (g cm−3), and Ci is volume fraction (%) of the rock fragments >2 mm in diameter for each soil layer (i), respectively. SOM is soil organic matter content (g kg−1). This conversion approach has been widely adopted in existing soil carbon studies focused on the Qinling Mountains [7,8]. Although the SOM–SOC conversion ratio may vary with geographic conditions and soil types, site-specific time-varying calibrated coefficients are unavailable for historical periods. Consistent with previous studies conducted in the Qinling Mountains, this study adopted a unified conversion coefficient. Moreover, the SOC datasets for the 2000s and 2010s compiled from published studies also applied the same conversion protocol [36,37]. The consistent conversion standard adopted across the three periods ensures data comparability and temporal consistency for spatiotemporal simulation.
It is worth noting that the sampling sites for SOC20 and SOC100 are not spatially matched one-to-one across the three datasets. For this reason, it is methodologically infeasible to mathematically isolate the pure 20–100 cm subsoil layer by simple subtraction. Accordingly, we established two independent models for the 0–20 cm topsoil and the 0–100 cm integrated profile, respectively. The differences in SOC dynamics and driving contributions between SOC100 and SOC20 can largely reflect the inherent response characteristics of the deeper 20–100 cm layer, enabling us to compare vertical variations in driving mechanisms between shallow topsoil and the full one-meter profile.
One-kilometer elevation data was obtained from the Global Land One-km Base Elevation Project (GLOBE) and used to derive slope gradient and aspect [38]. Soil physical and chemical properties—including clay, silt, and sand fractions—were acquired from the SoilGrids dataset at 250 m resolution [39]. The soil type map was obtained from the Resource and Environment Data Cloud Platform (REDCP, www.resdc.cn), which was incorporated into the model to represent the spatial heterogeneity of soil types across the Qinling Mountains.
Monthly mean air temperature and total precipitation at 1 km resolution were obtained from a high-resolution gridded dataset [40]. Solar radiation and potential evapotranspiration (PET) at 1/24° (~4 km) were taken from the TerraClimate dataset [41]. Annual mean temperature was calculated as the average of monthly values; annual total precipitation, potential evapotranspiration, and solar radiation were computed as the sum of monthly values. The humidity index was defined as the ratio of annual precipitation to annual potential evapotranspiration.
Annual net primary production (NPP) at 500 m resolution for 2001–2024 was obtained from the Moderate Resolution Imaging Spectroradiometer (MODIS) MOD17A3HGF Version 6.1 product [42]. NPP for 1982–2000 with a spatial resolution of 1 km × 1 km was simulated using the Carnegie-Ames-Stanford Approach (CASA) model [43]. Annual land-use and land-cover (LULC) data at 300 m resolution were derived from the European Space Agency Climate Change Initiative (ESA CCI) Land Cover dataset (https://www.esa-landcover-cci.org/). Annual atmospheric CO2 concentrations for 2000–2015 were obtained from in situ measurements at Mauna Loa, provided by the Global Monitoring Laboratory (https://gml.noaa.gov/). Gridded total nitrogen deposition was obtained from the North American Carbon Program (https://data.nasa.gov/dataset/global-maps-of-atmospheric-nitrogen-deposition-1860-1993-and-2050-e7ca9, accessed on 3 May 2025). Gridded nitrogen fertilizer consumption data were derived from national rural socioeconomic statistical surveys (https://data.cnki.net/), together with 0.5° gridded fertilizer and manure datasets from the Socioeconomic Data and Applications Center (SEDAC, https://data.nasa.gov/dataset/global-fertilizer-and-manure-version-1-nitrogen-in-manure-production, accessed on 3 May 2025). All datasets were resampled to a consistent 1 km spatial resolution using the nearest neighbor interpolation method.
Future climate projections were driven by five global climate models (GCMs) from the NEX-GDDP-CMIP6 dataset: BCC-CSM2-MR, CIESM, CMCC-CM2-SR5, IPSL-CM6A-LR, and MRI-ESM2-0 (https://registry.opendata.aws/nex-gddp-cmip6, accessed on 3 May 2025). Three Shared Socioeconomic Pathways (SSPs) were selected: SSP1-2.6 (a 2 °C scenario approximately equal to Representative Concentration Pathways 2.6, RCP2.6), SSP2-4.5 (approximately equal to RCP4.5), and SSP5-8.5 (a high scenario similar to RCP8.5), to represent low-, medium-, and high-impact climate trajectories over the 21st century.

2.3. SOC Simulation and Validation in the Qinling Mountains

We used our previously established and rigorously validated Random Forest (RF) model with robust spatiotemporal prediction capability [13] to simulate the spatiotemporal dynamics of SOC in different soil layers across the Qinling Mountains. This model was originally developed with a strict time-series sample partitioning protocol that independently separates training and validation subsets across distinct periods, effectively eliminating precision biases caused by temporal autocorrelation and sample overlap, thereby ensuring independence and reliability of predictions across different time windows. Furthermore, its spatiotemporal generalization ability has been comprehensively verified through independent cross-regional and cross-period validation tests, confirming its robust performance in extrapolating SOC dynamics across unmeasured spatial and temporal domains. This model has demonstrated strong applicability and stability in national and regional soil carbon mapping applications.
The model is driven by multi-source covariates covering five major categories including soil properties, terrain attributes, climate factors, vegetation characteristics, and environmental variables. Climate factors adopted in this study mainly include air temperature, precipitation, solar radiation, and humidity index, which characterize direct meteorological conditions and act as fundamental drivers regulating SOC turnover and accumulation. By contrast, environmental variables represent large-scale external forcing factors that affect SOC dynamics indirectly through regulating vegetation growth and soil decomposition processes, mainly involving atmospheric CO2 concentration, nitrogen deposition, and nitrogen fertilizer application rate. Detailed information regarding the category, specific indicators, spatial resolution and data source of all model driving variables is summarized in Table 1. The detailed dataset preprocessing and standardized technical workflow have been systematically described in our previous study [13].
A standardized preprocessing workflow, consistent with our previous protocol, was applied to ensure spatial alignment and temporal normalization of topographic, climatic, vegetation, soil, and land-use covariates, guaranteeing uniformity in spatial resolution, temporal reference, and data format across all periods [13,28]. Model input variables were pre-screened through strict multicollinearity tests and independent feature selection procedures, retaining critical environmental determinants while removing redundant predictors. This optimized covariate set aligns with the dominant controls of regional SOC spatial variability, further enhancing the accuracy and reliability of model estimates.
In this study, the spatiotemporal prediction performance of the model was further validated using field-measured SOC data across discrete periods in the Qinling Mountains. Validation was conducted separately for each period to evaluate the model’s ability to reproduce the spatial distribution of SOC and capture its temporal trends.

2.4. Driving Mechanisms of SOC Spatiotemporal Dynamics

To quantify the contributions of three time-varying drivers—climate change, vegetation growth, and environmental variation—to the spatiotemporal dynamics of SOC, we implemented a factorial control simulation framework to isolate and evaluate individual driver effects [13]. In each experiment, one target driver category was fixed at its initial state (year 2000), while the other two categories were allowed to vary naturally over time, yielding a set of SOC simulations under constrained conditions. The actual contribution (AC) of each driver was quantified as the difference between simulations driven by all variables and those under the single-driver-fixed scenario, which was further converted to relative contribution (RC, %).
A C l - V i , p = S O C l - A l l , p S O C l - V i , p
R C l - V i , p = A C l - V i , p i n A C l - V i , p × 100 %
where SOCl-All,p denotes SOC value simulated using all drivers for soil layer l in period p, and SOCl-Vi,p denotes the SOC value simulated with the i-th driver category held constant.
At the pixel level, a driver category was defined as solely dominant if its relative contribution exceeded 60%. If no single category surpassed this threshold, the dominant control was identified as a combined effect of the two categories with the highest relative contributions. For deep-soil simulations, the corresponding topsoil SOC estimates under the same constrained scenario were used as an auxiliary input.

2.5. Projection of SOC Dynamics Under Future Climate Trajectories

Raw outputs from global climate models (GCMs) typically exhibit inconsistent spatial resolutions and systematic biases relative to observational climate data, rendering them unsuitable for direct regional-scale SOC modeling [28]. We therefore applied a Delta downscaling and bias-correction routine to adjust future annual mean temperature and annual precipitation [4,44]. This method assumes high spatiotemporal consistency in climate change signals, enabling bias adjustment while preserving the original temporal trends and spatial patterns of climate projections, and has been widely adopted for regional climate downscaling.
Specifically, all GCM outputs were first spatially downscaled to 1 km × 1 km resolution using bilinear interpolation to match the grid of observational datasets. Bias correction was then performed using the 2000–2015 climatological mean as a reference baseline. Gridded biases between model simulations and observations during this baseline period were computed and applied to correct future climate projections for 2015–2100.

3. Results

3.1. Validation for SOC Spatiotemporal Predictions in the Qinling Mountains

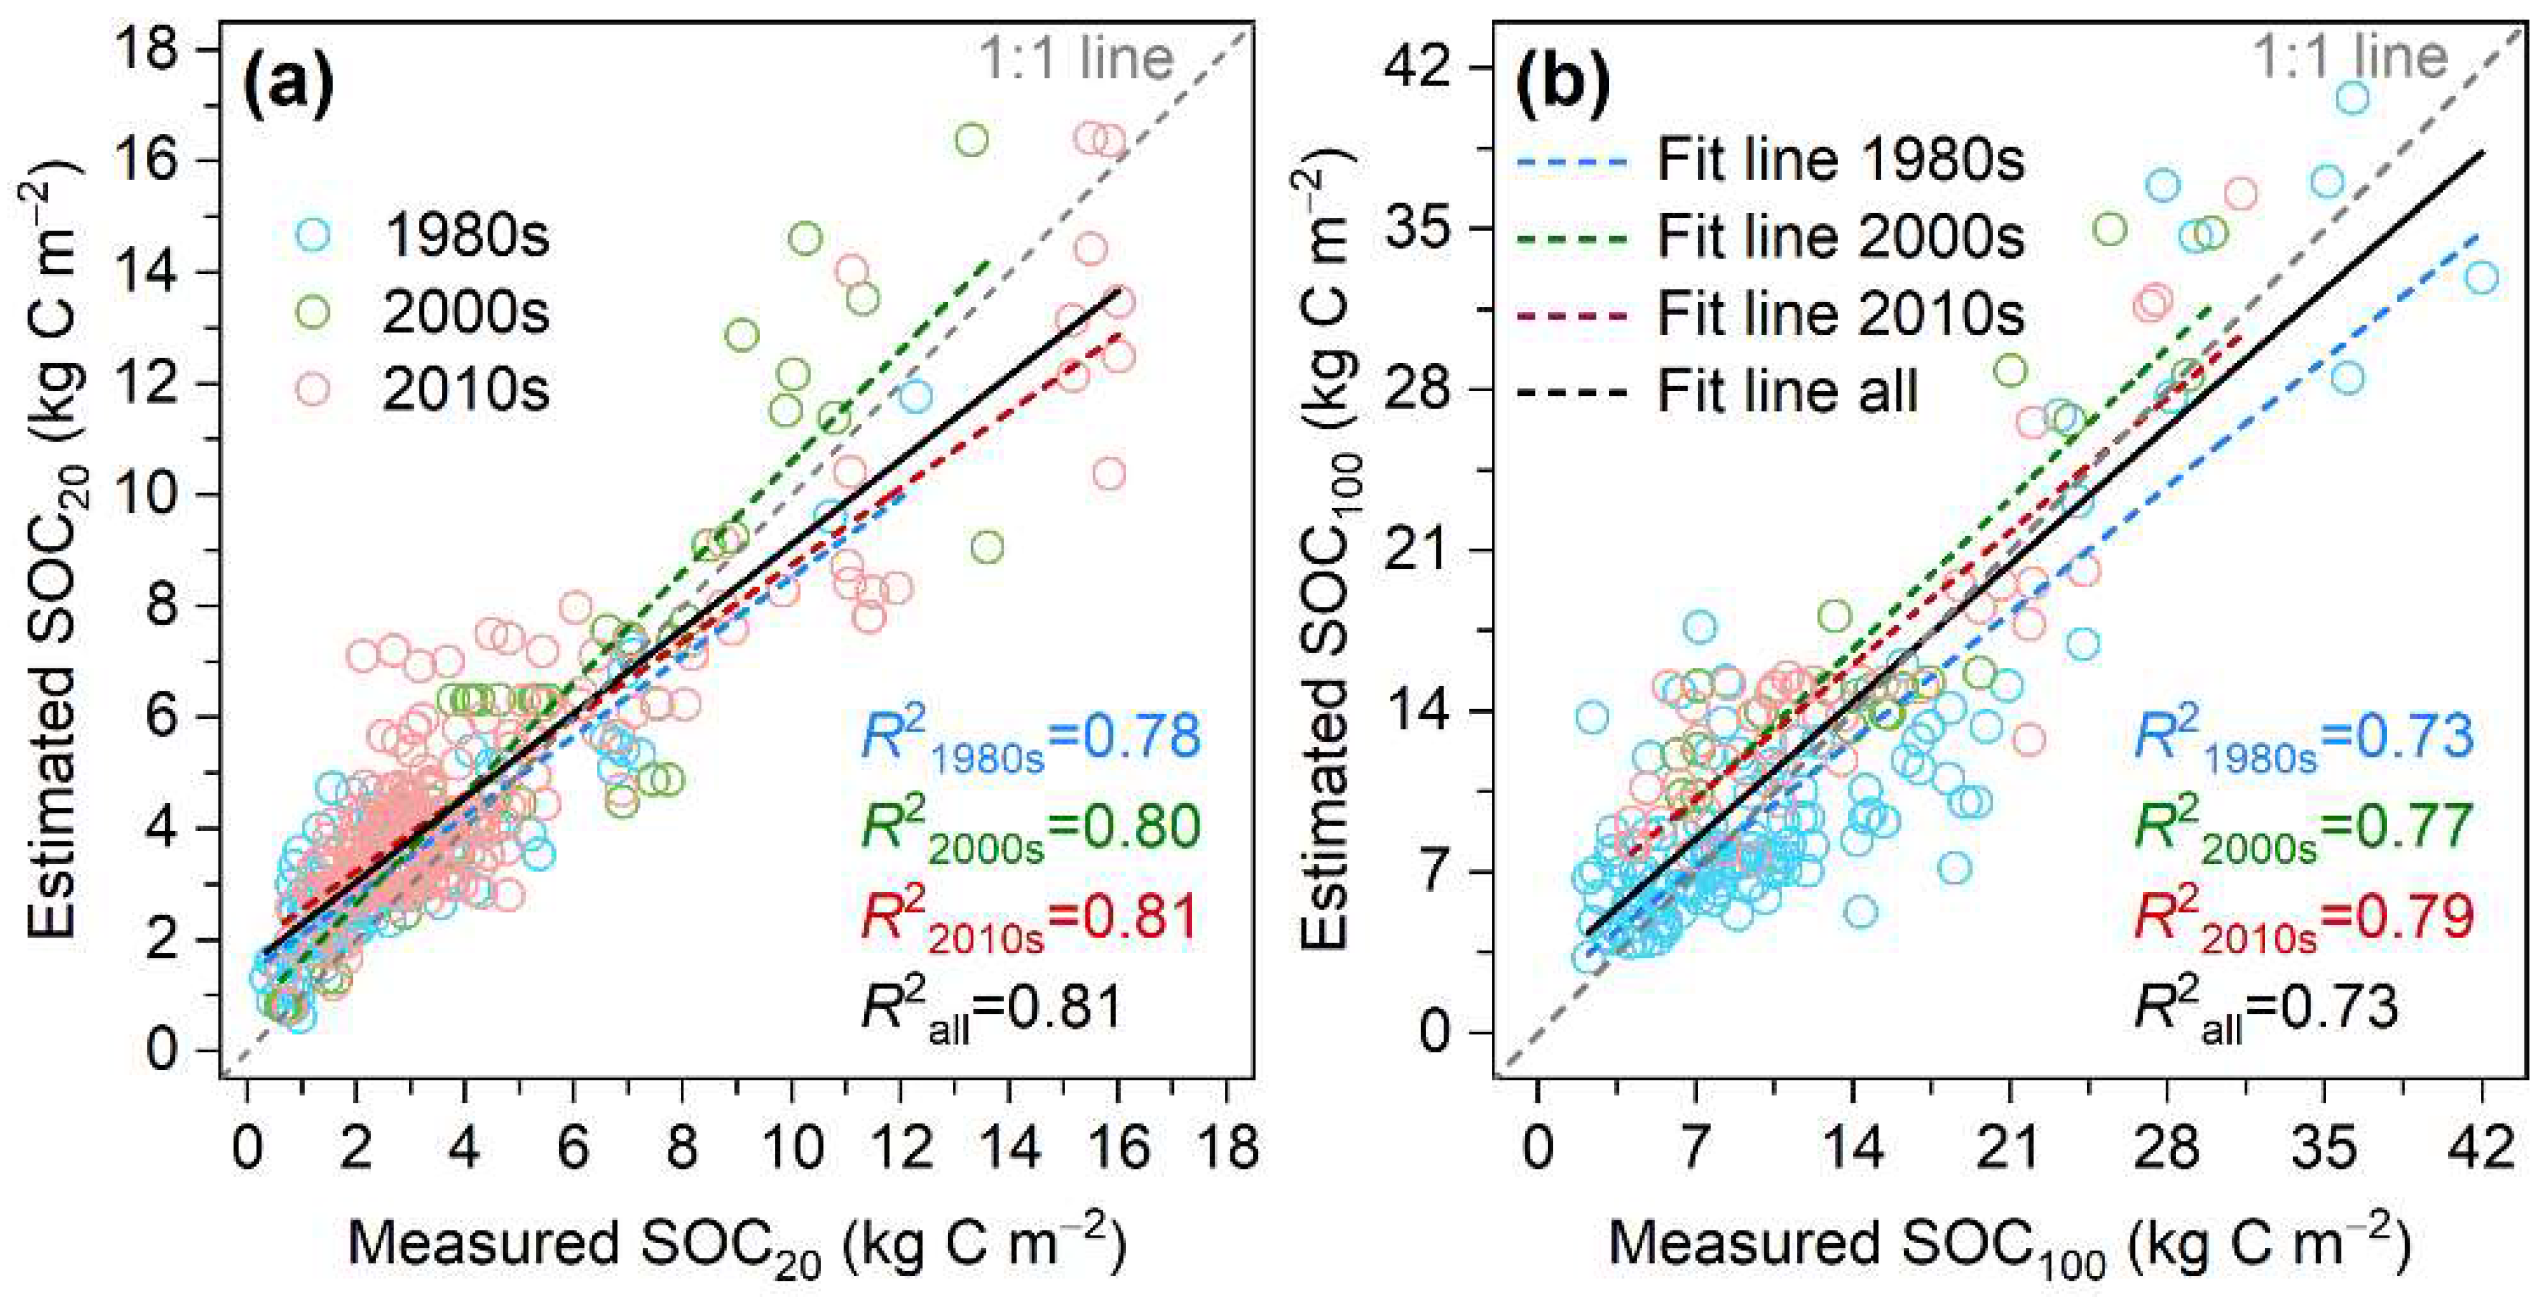
Figure 2 presents the validation of simulated SOC20 and SOC100 against in situ measurements across three periods (1980s, 2000s, 2010s) and the whole study period in the Qinling Mountains. For SOC20 (Figure 2a), the model achieved high predictive accuracy across all periods, with R2 values ranging from 0.78 (1980s) to 0.81 (2010s and whole period). RMSE varied between 1.16 and 1.76 kg C m−2, and PB remained within ±26% (Table 2). The overall R2 for the whole period reached 0.81, indicating the model reliably captures the spatiotemporal variability of topsoil SOC. For SOC100 (Figure 2b), the model also performed well, with R2 values of 0.73 (1980s), 0.77 (2000s), and 0.79 (2010s). RMSE ranged from 3.85 to 4.55 kg C m−2, and PB was within ±20% (Table 2). The whole-period R2 was 0.73, confirming the model’s ability to reproduce whole 1 m soil profile SOC dynamics, though with slightly lower precision than for topsoil. Overall, the model exhibits robust spatiotemporal predictive performance for both soil layers across different historical periods and the whole study period, supporting its application in long-term SOC dynamic analysis in the Qinling Mountains.

3.2. Spatiotemporal Dynamics of SOC

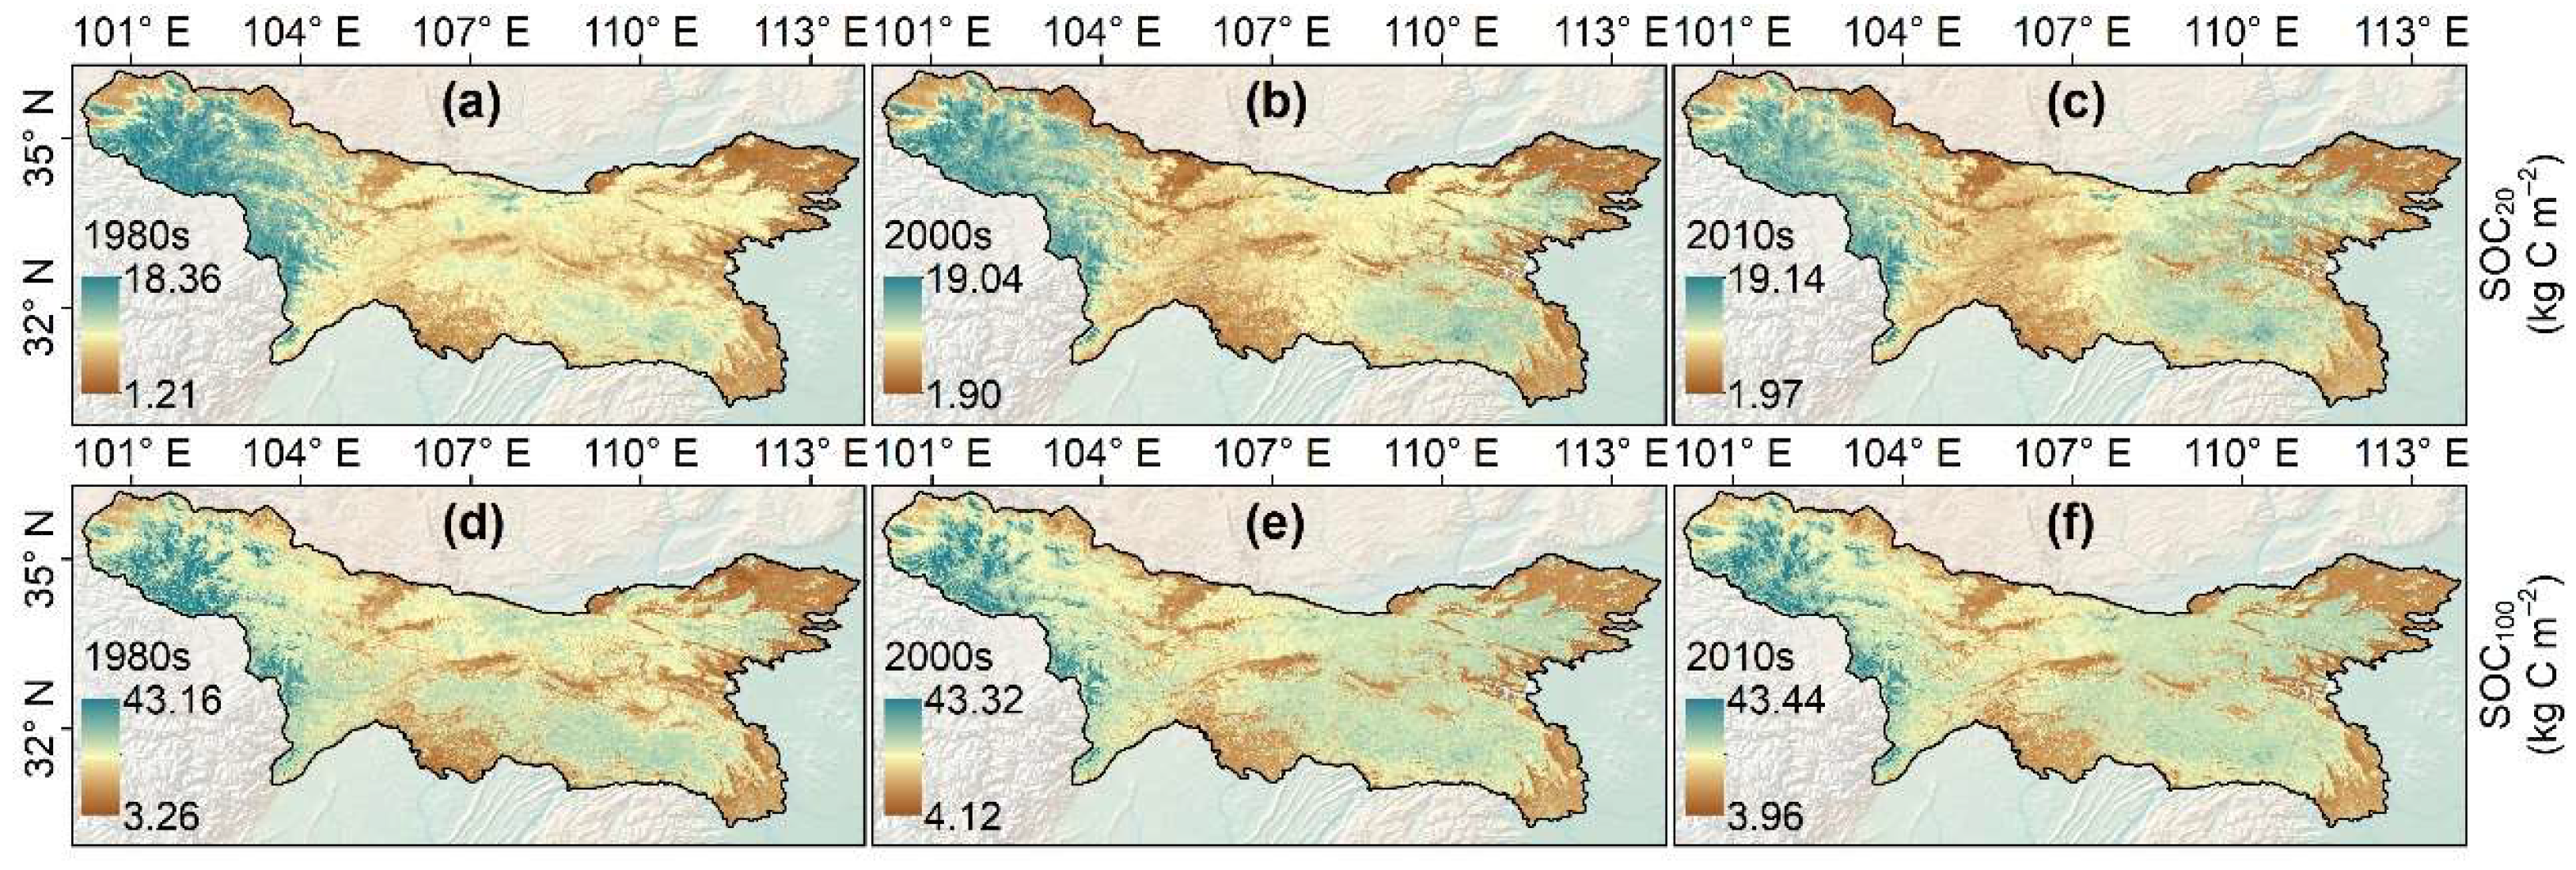
Figure 3 illustrates the spatial distribution of simulated SOC20 and 0 SOC100 across three historical periods (1980s, 2000s, 2010s) in the Qinling Mountains. For SOC20, the regional mean SOC density increased gradually from 4.86 kg C m−2 in the 1980s to 5.18 kg C m−2 in the 2000s and further to 5.37 kg C m−2 in the 2010s. Similarly, SOC100 exhibited a continuous upward trend, rising from 12.97 kg C m−2 (1980s) to 13.45 kg C m−2 (2000s) and 13.58 kg C m−2 (2010s). Spatially, SOC densities were consistently higher in the western and central high-elevation zones, while lower values were concentrated in the southern and eastern low-elevation areas across all periods.

3.3. Driving Mechanisms of SOC Dynamics

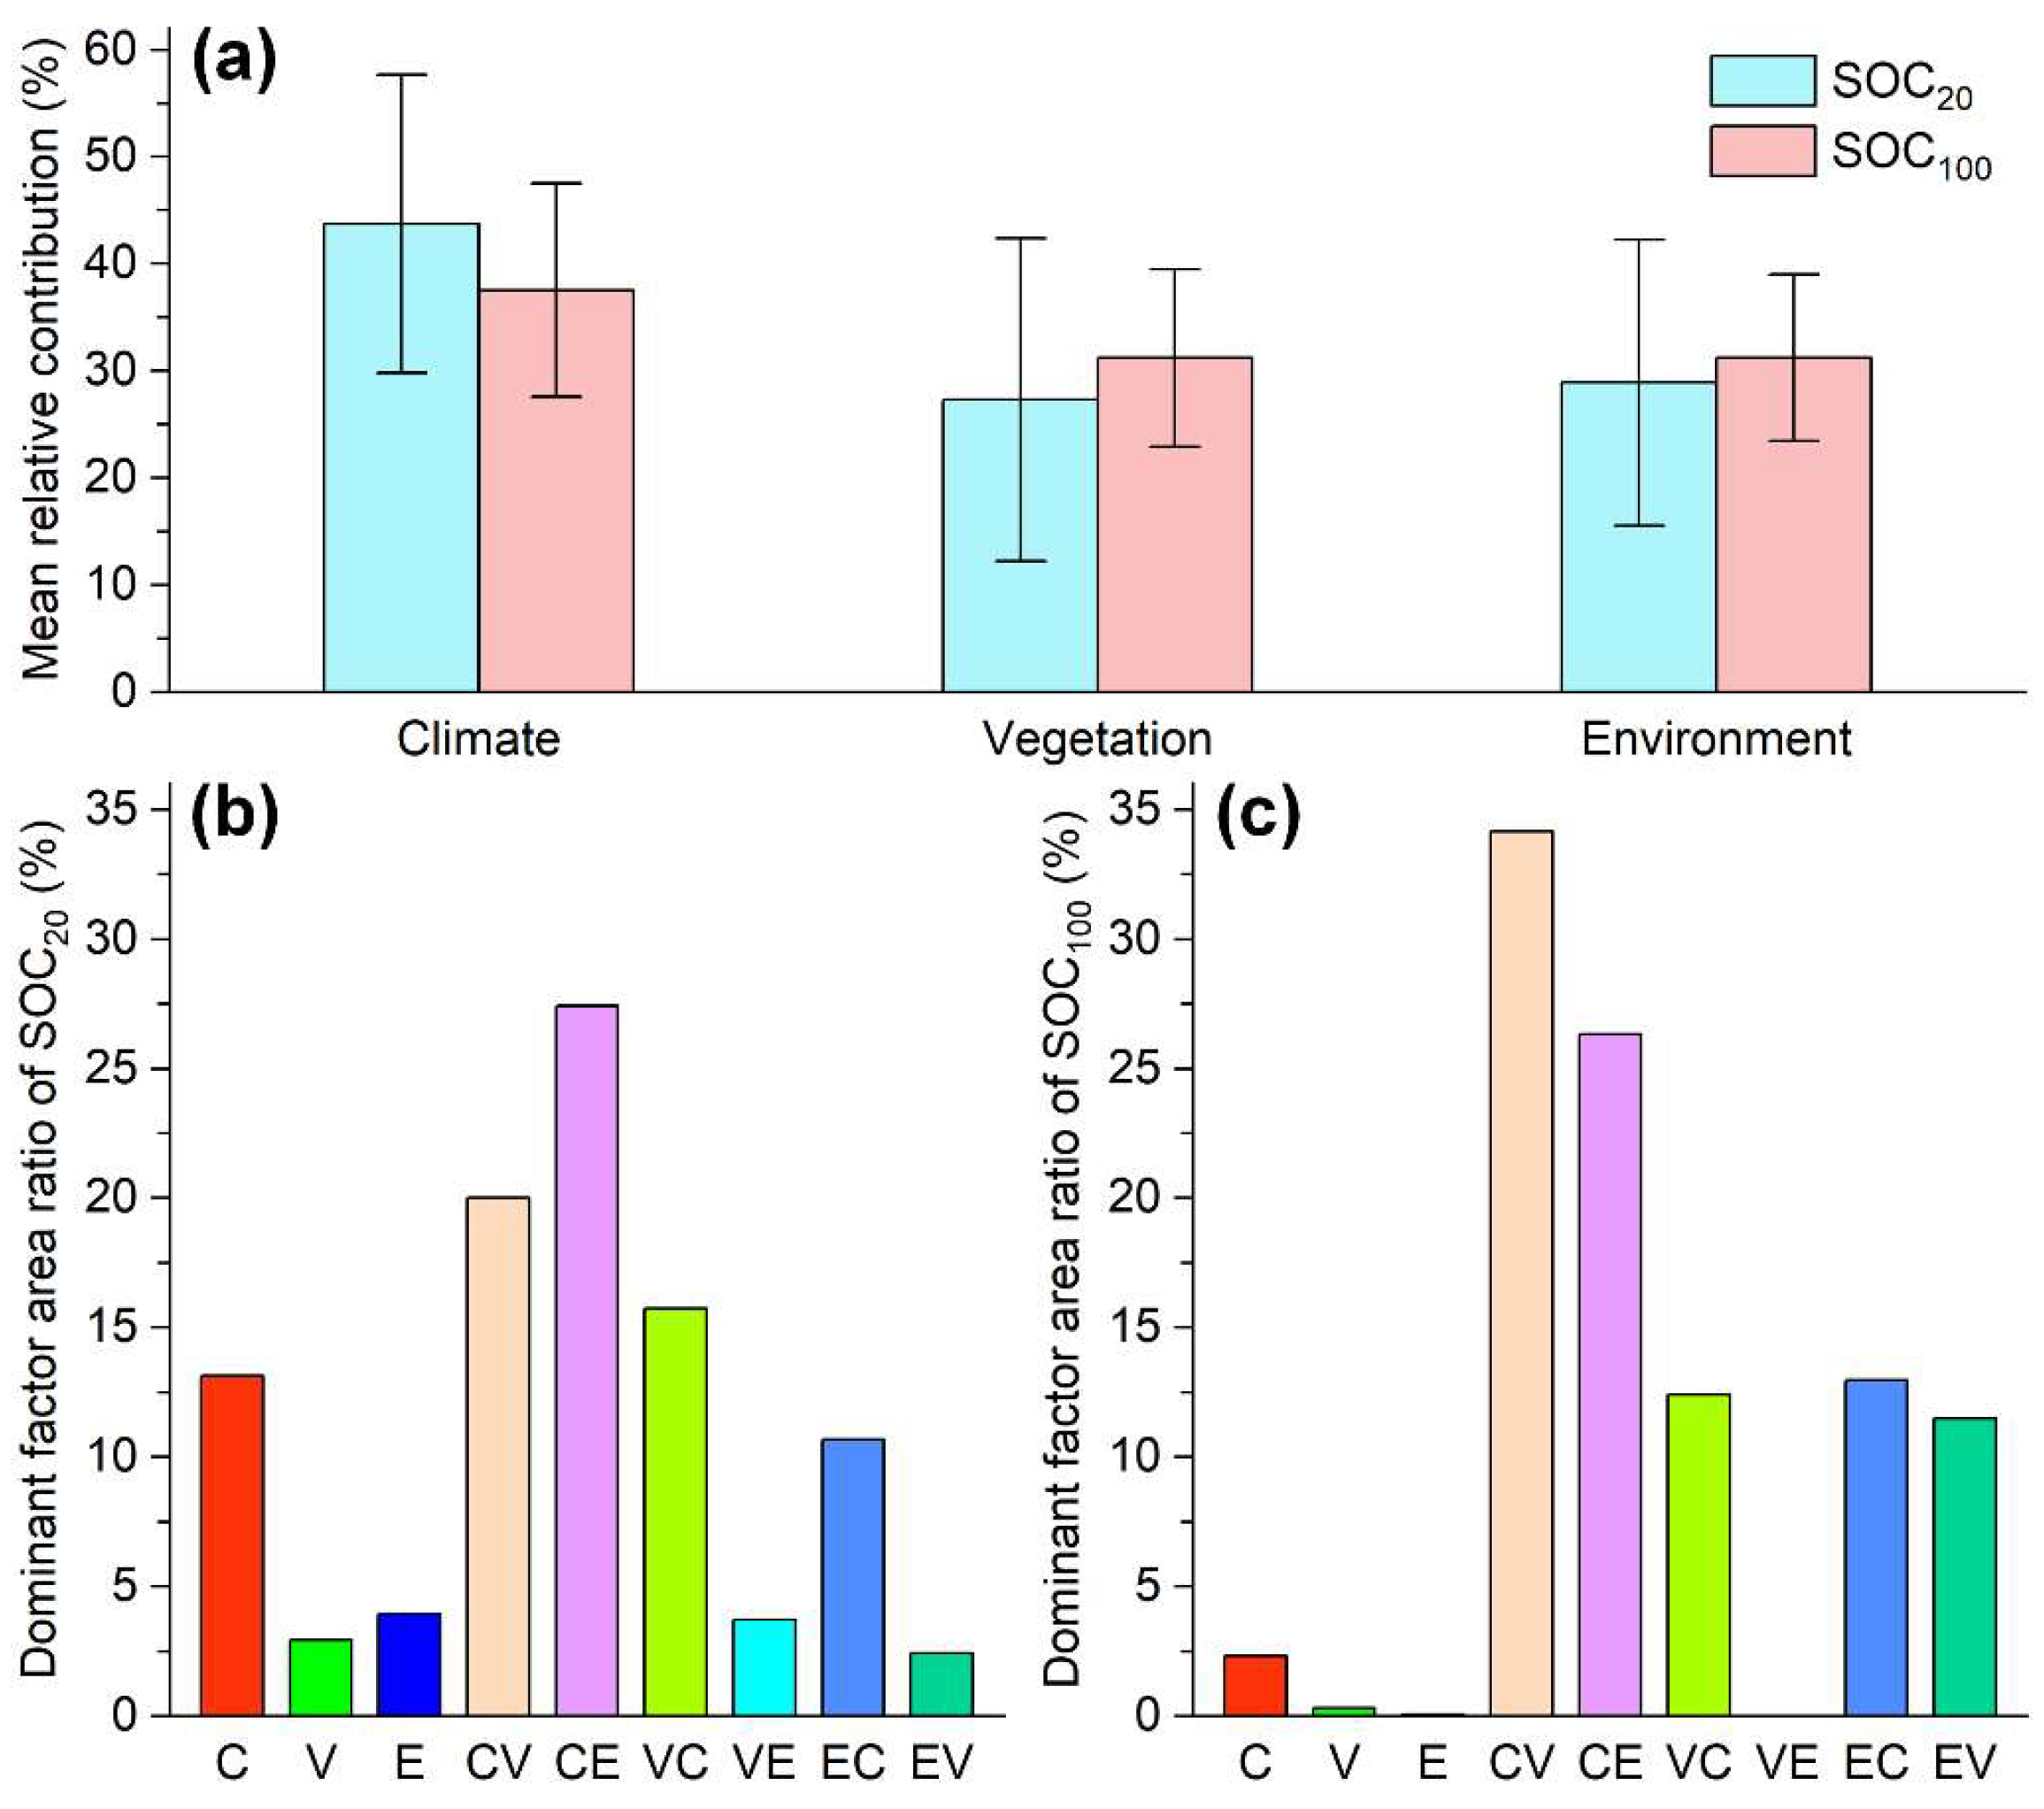
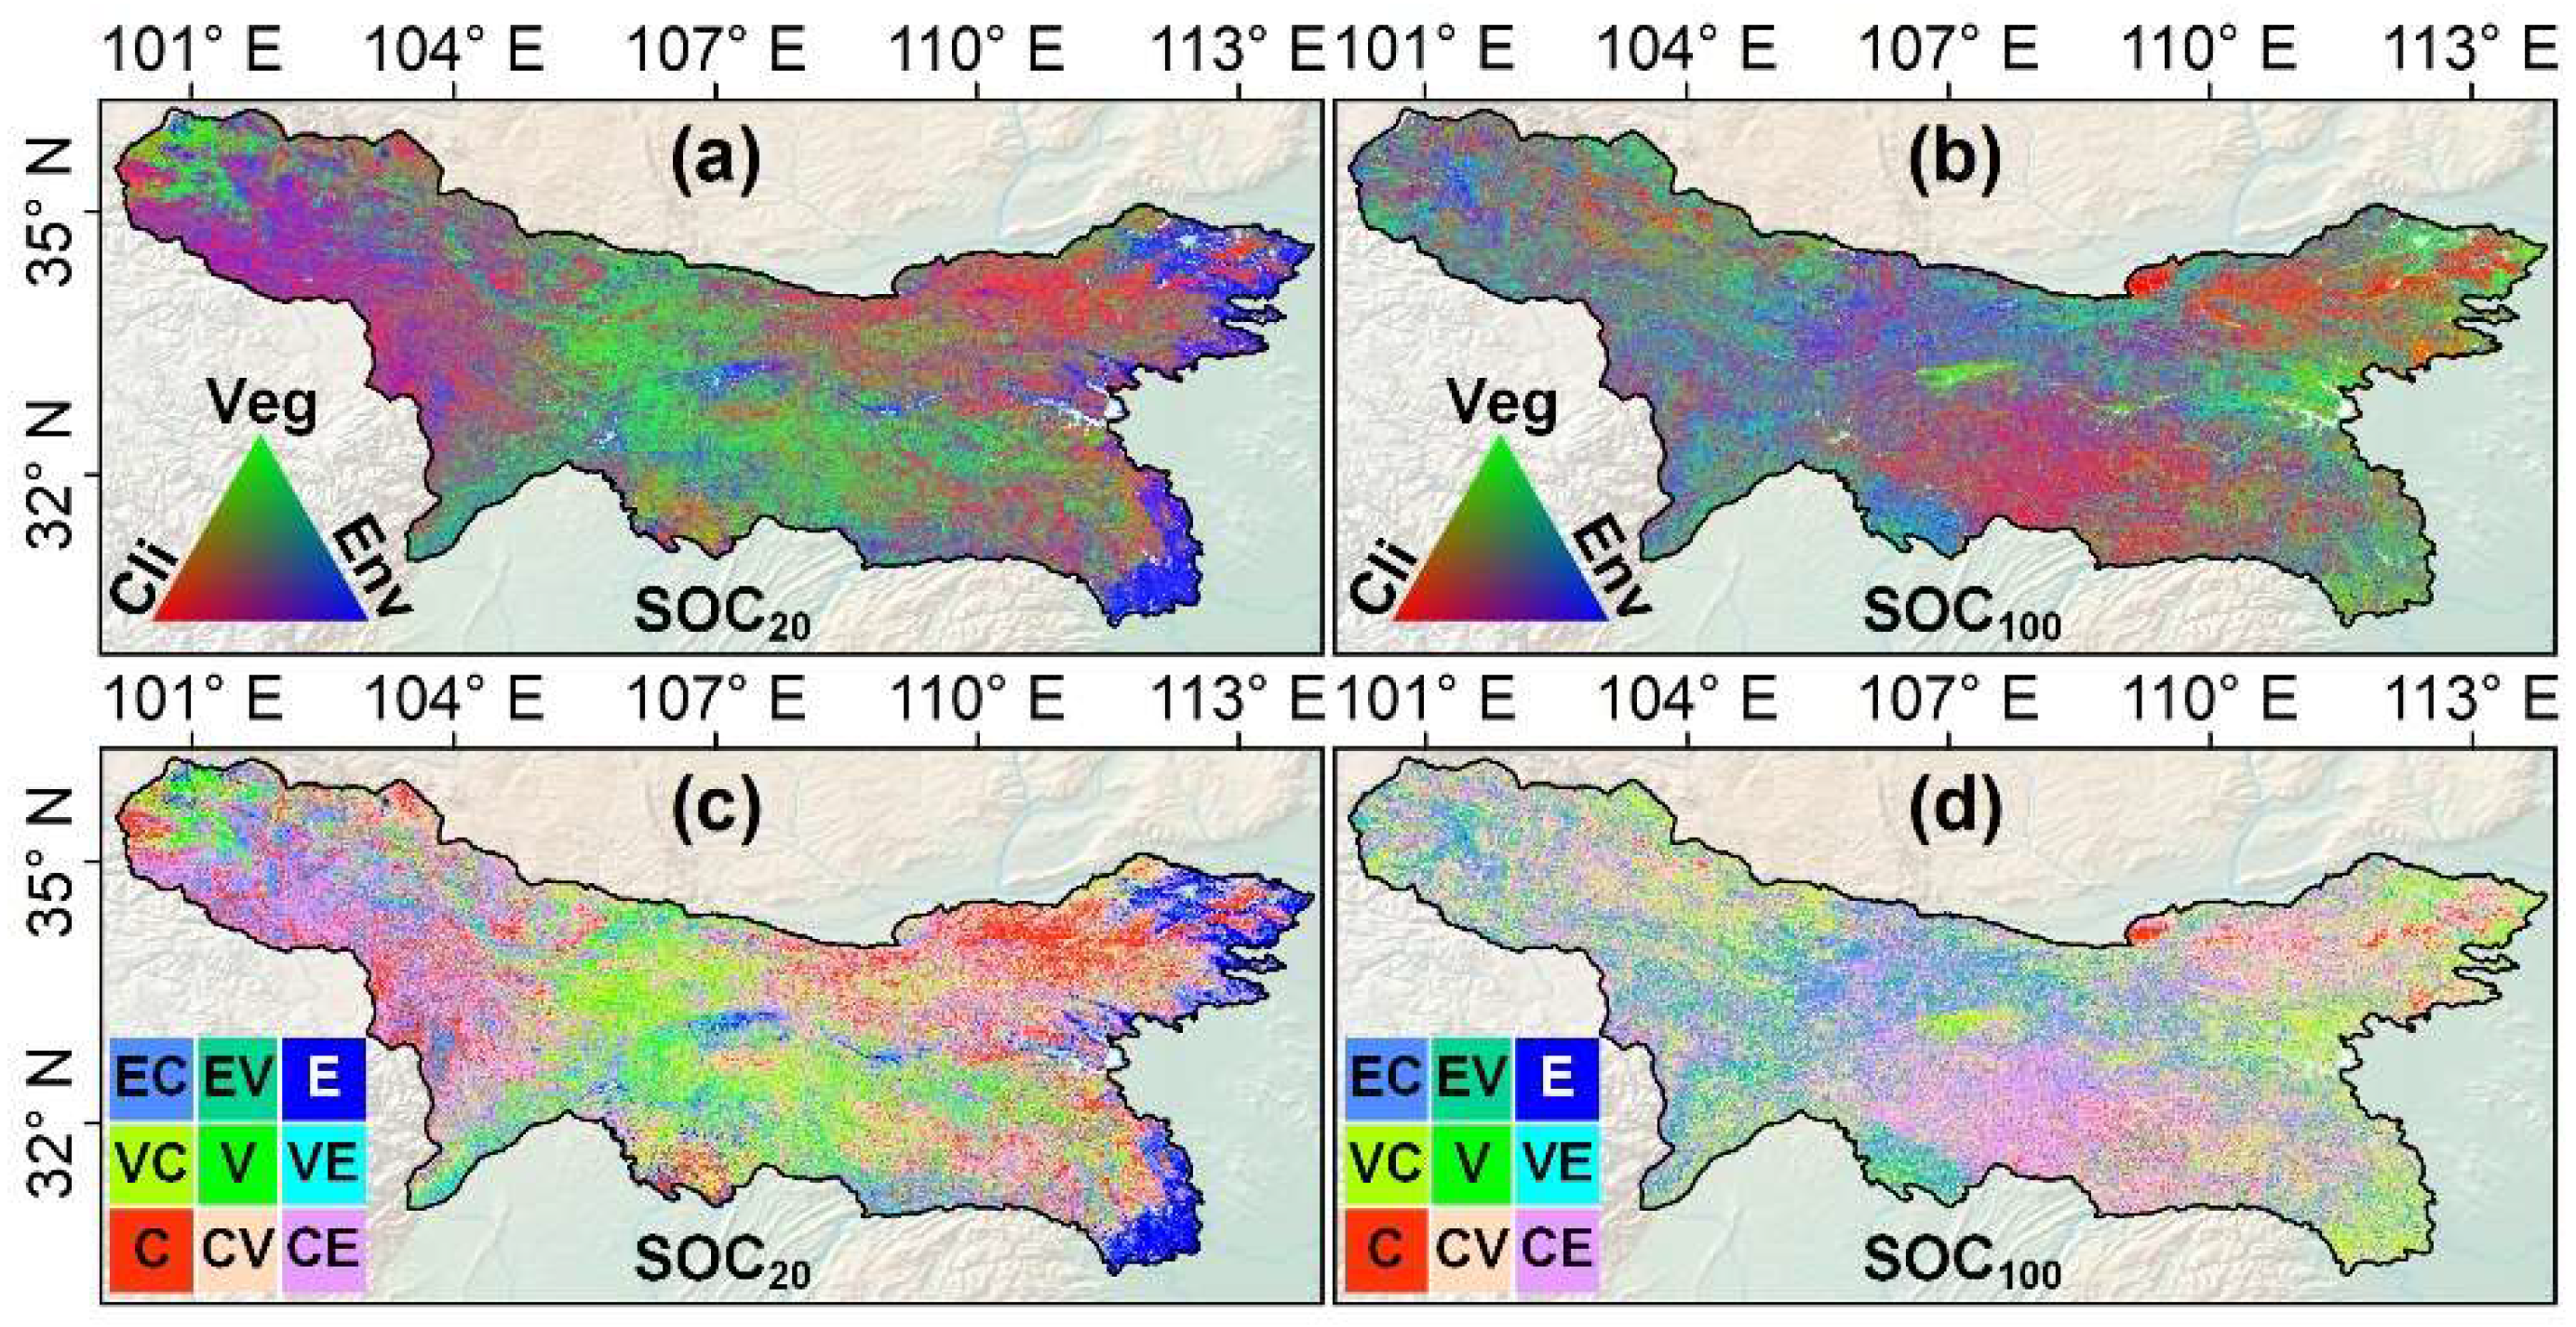
The relative contributions of climate change (Cli), vegetation growth (Veg), and environmental variation (Env) to SOC dynamics were quantified using factorial simulations (Figure 4a,b). At the regional scale, climate was the dominant driver for SOC20, with a mean relative contribution of 43.75%, followed by environment (28.92%) and vegetation (27.33%). For SOC100, the mean contributions of climate, vegetation, and environment were 37.53%, 31.22%, and 31.25%, respectively (Figure 5a). With increasing soil depth, although climate remained the primary controlling factor, its relative contribution declined, while the relative influences of vegetation and environmental factors increased and became more balanced. This pattern indicates that deep SOC dynamics are still predominantly climate-driven, but the relative importance of below-ground vegetation growth and environment conditions is enhanced compared to topsoil.
Spatially, the dominant controls on SOC dynamics exhibited pronounced spatial heterogeneity across the Qinling Mountains, with clear differences between SOC20 and SOC100 (Figure 4c,d). For SOC20 (Figure 4c), climate-dominated (C) areas were concentrated in the northern high-elevation and western mountainous zones, while vegetation–environment (VE/EV) and environment-dominated (E) controls were more prevalent in the southern low-elevation and eastern hilly regions. Coupled climate–vegetation (CV/VC) and climate–environment (CE/EC) regimes were widely distributed across the central transitional zones. Single-driver dominance was largely restricted to climate (C), which governed approximately 13% of the region, while areas dominated by individual vegetation (V) or environment (E) controls were negligible (Figure 5b). In contrast, coupled two-driver regimes prevailed across the remaining landscape: climate–vegetation interactions (CV + VC) dominated roughly 35.75% of the area, and climate–environment interactions (CE + EC) accounted for approximately 38.1%, indicating that topsoil SOC dynamics were largely regulated by climate-centric combined effects.
For SOC100 (Figure 4d), the spatial pattern of dominant drivers shifted markedly. Climate–vegetation (CV/VC) coupling became the most extensive regime, covering large swathes of the central and eastern regions, while climate–environment (CE/EC) interactions remained dominant in the central and southern areas. The influence of vegetation–environment (VE/EV) coupling increased relative to SOC20, particularly in the southern lowlands. Overall, coupled driver regimes became even more dominant, with climate–vegetation (CV + VC) and climate–environment (CE + EC) combinations governing roughly 46.58% and 39.29% of the region, respectively (Figure 5c). Single-driver control remained limited across both soil layers, reinforcing that SOC dynamics across most of the Qinling Mountains are shaped by the synergistic interactions of multiple factors rather than by any individual driver alone.

3.4. Future Climate and SOC Trajectories in the Qinling Mountains

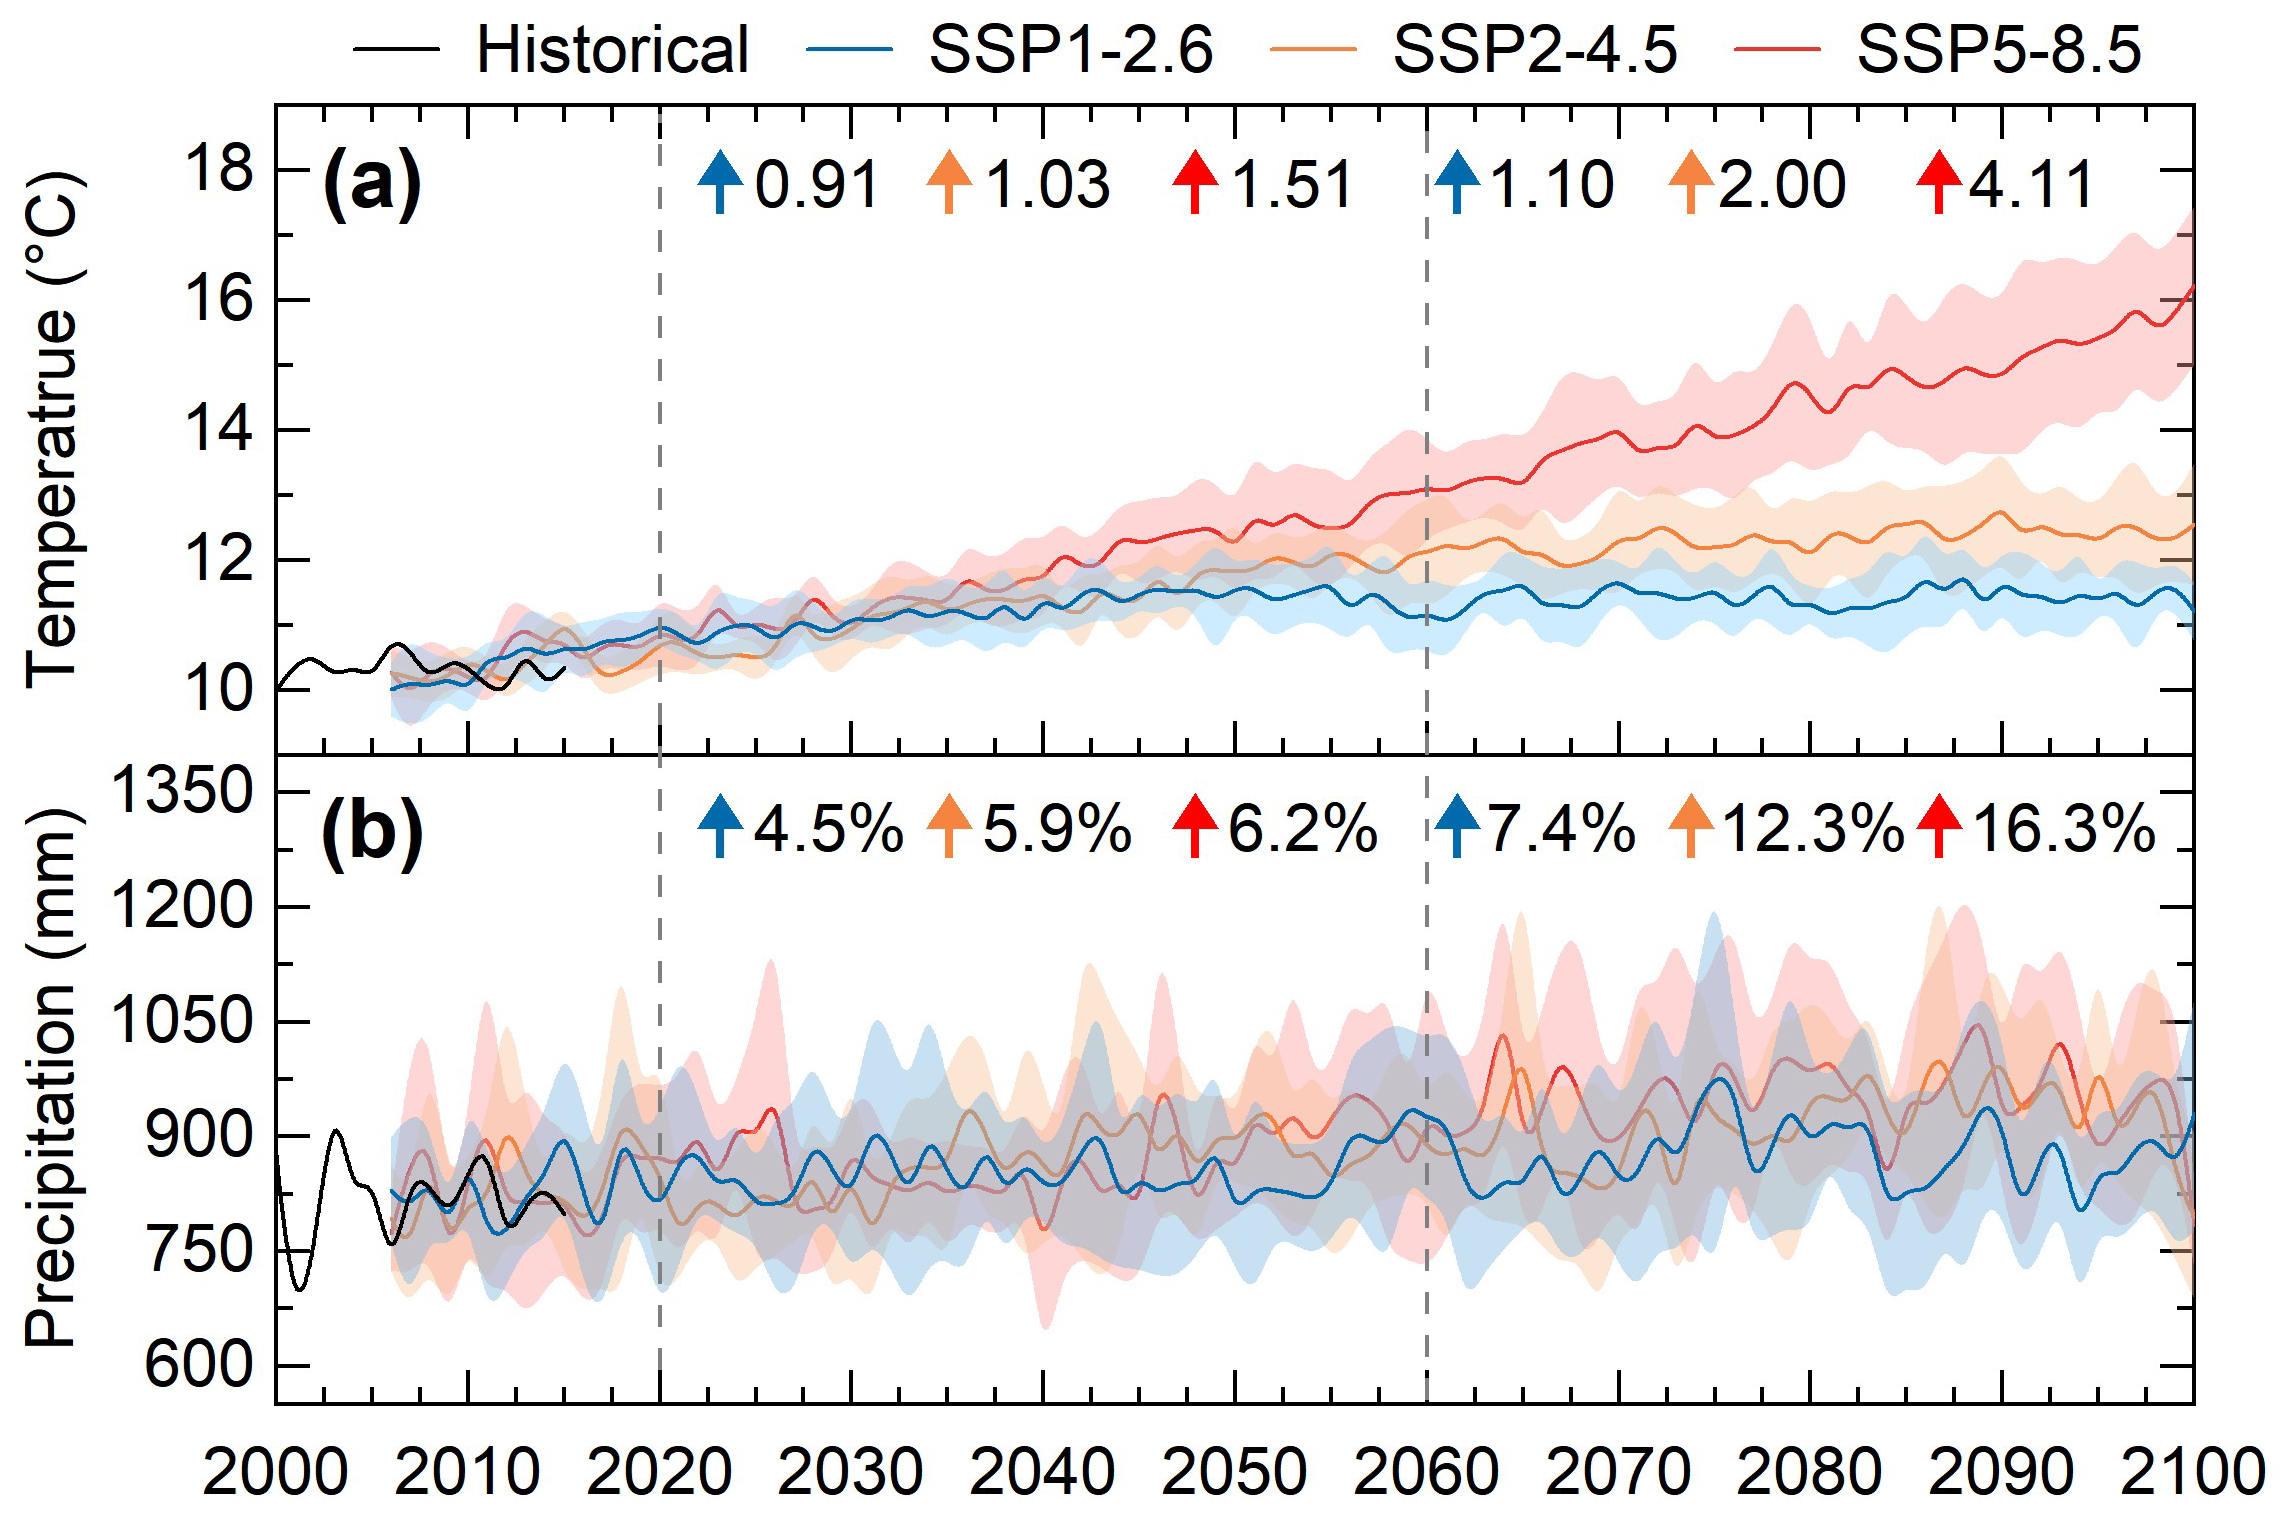
Figure 6 depicts the historical and future trajectories of annual mean temperature and precipitation over the Qinling Mountains under three Shared Socioeconomic Pathways. For temperature (Figure 6a), a continuous warming trend is projected across all scenarios throughout the 21st century. Relative to the historical baseline (2000–2015), the near-term (2020–2060) warming amounts to 0.91 °C (SSP1-2.6), 1.03 °C (SSP2-4.5), and 1.51 °C (SSP5-8.5), respectively. By the long-term (2060–2100), the warming intensifies markedly, reaching 1.10 °C (SSP1-2.6), 2.00 °C (SSP2-4.5), and 4.11 °C (SSP5-8.5), with the highest emission scenario (SSP5-8.5) exhibiting the steepest temperature rise. For precipitation (Figure 6b), all scenarios project a gradual increasing trend. In the near term, precipitation increases by 4.5% (SSP1-2.6), 5.9% (SSP2-4.5), and 6.2% (SSP5-8.5). Over the long term, these relative increments expand to 7.4% (SSP1-2.6), 12.3% (SSP2-4.5), and 16.3% (SSP5-8.5), indicating a stronger wetting signal under higher emission scenarios. The shaded areas reveal notable inter-model uncertainty, particularly for the SSP5-8.5 scenario.
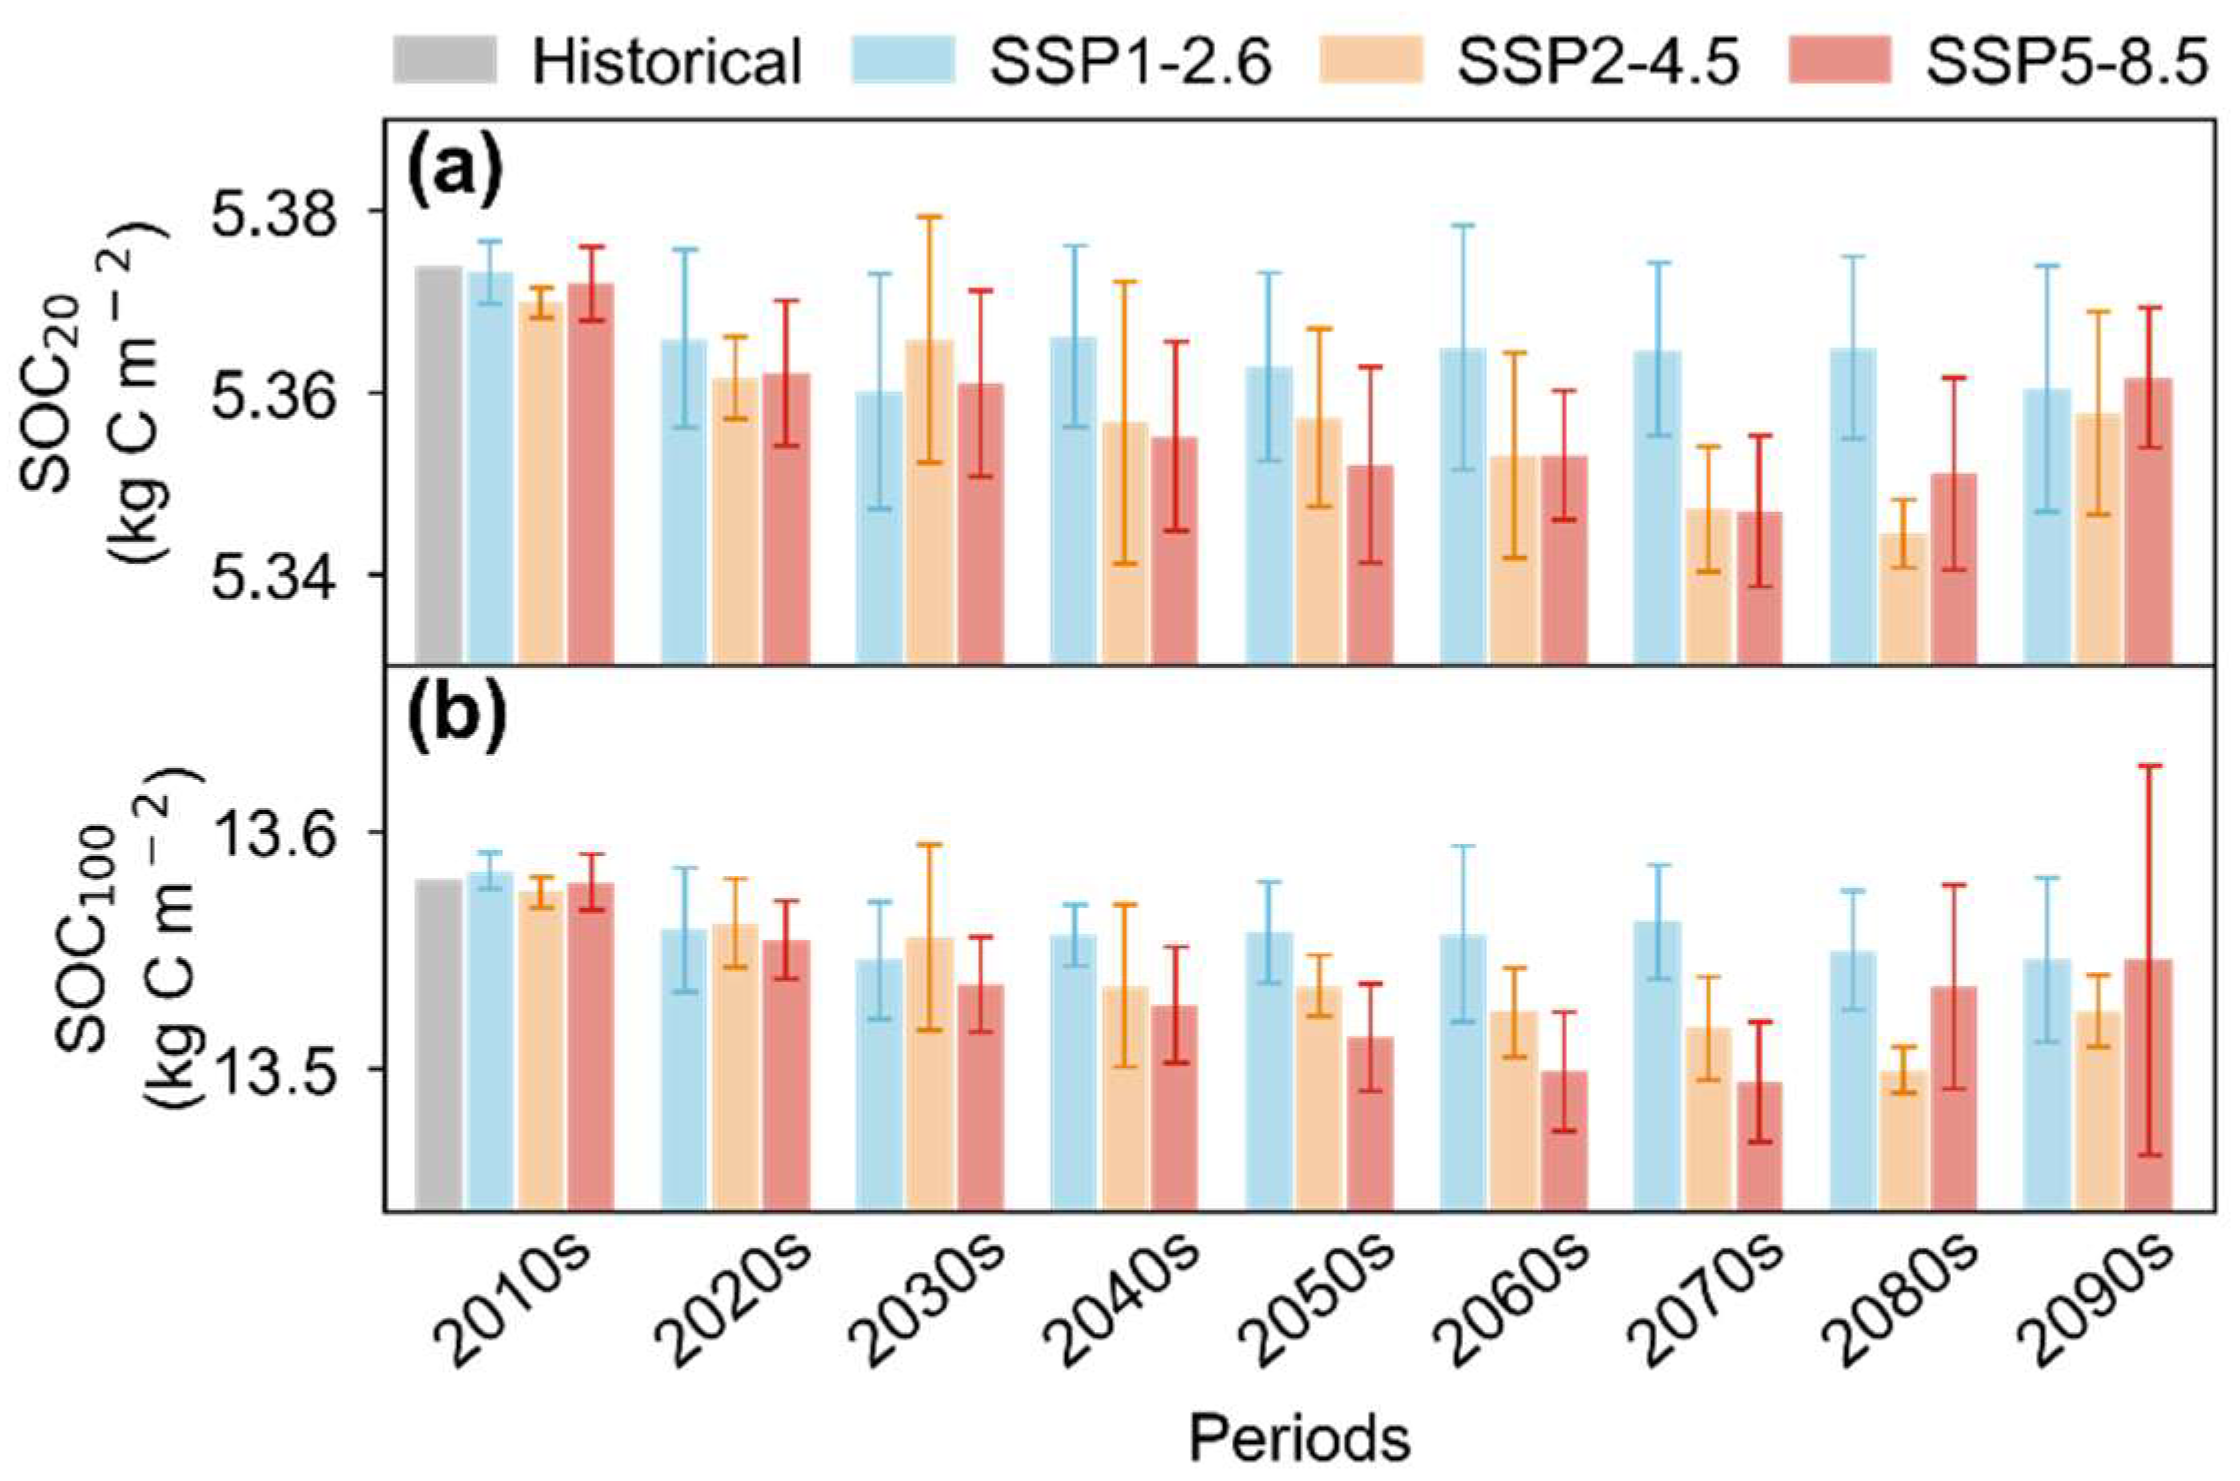
Figure 7 presents the temporal changes in SOC20 and SOC100 under historical and future climate scenarios (SSP1-2.6, SSP2-4.5, SSP5-8.5) in the Qinling Mountains. For SOC20 (Figure 7a), the regional mean SOC20 density exhibits only subtle fluctuations across all scenarios from the 2010s to the 2090s, remaining within a narrow range of approximately 5.34–5.38 kg C m−2. Similarly, SOC100 (Figure 7b) shows minimal temporal variation, staying stable at around 13.5–13.6 kg C m−2 across all scenarios and decades. Across scenarios, the SSP5-8.5 (high-emission) scenario shows slightly larger deviations from the historical baseline, while SSP1-2.6 (low-emission) maintains the closest alignment with historical SOC levels. Despite these small changes in regional mean density, the total SOC stock changes are substantial (Table 3 and Table 4). For SOC20, total losses relative to the baseline range from −1.41 to −6.59 Tg C across scenarios and periods (Table 3). For SOC100, the total losses are substantial larger, spanning −6.86 to −28.76 Tg C (Table 4), highlighting that the seemingly minor density changes translate to considerable reductions in total carbon storage at the regional scale.
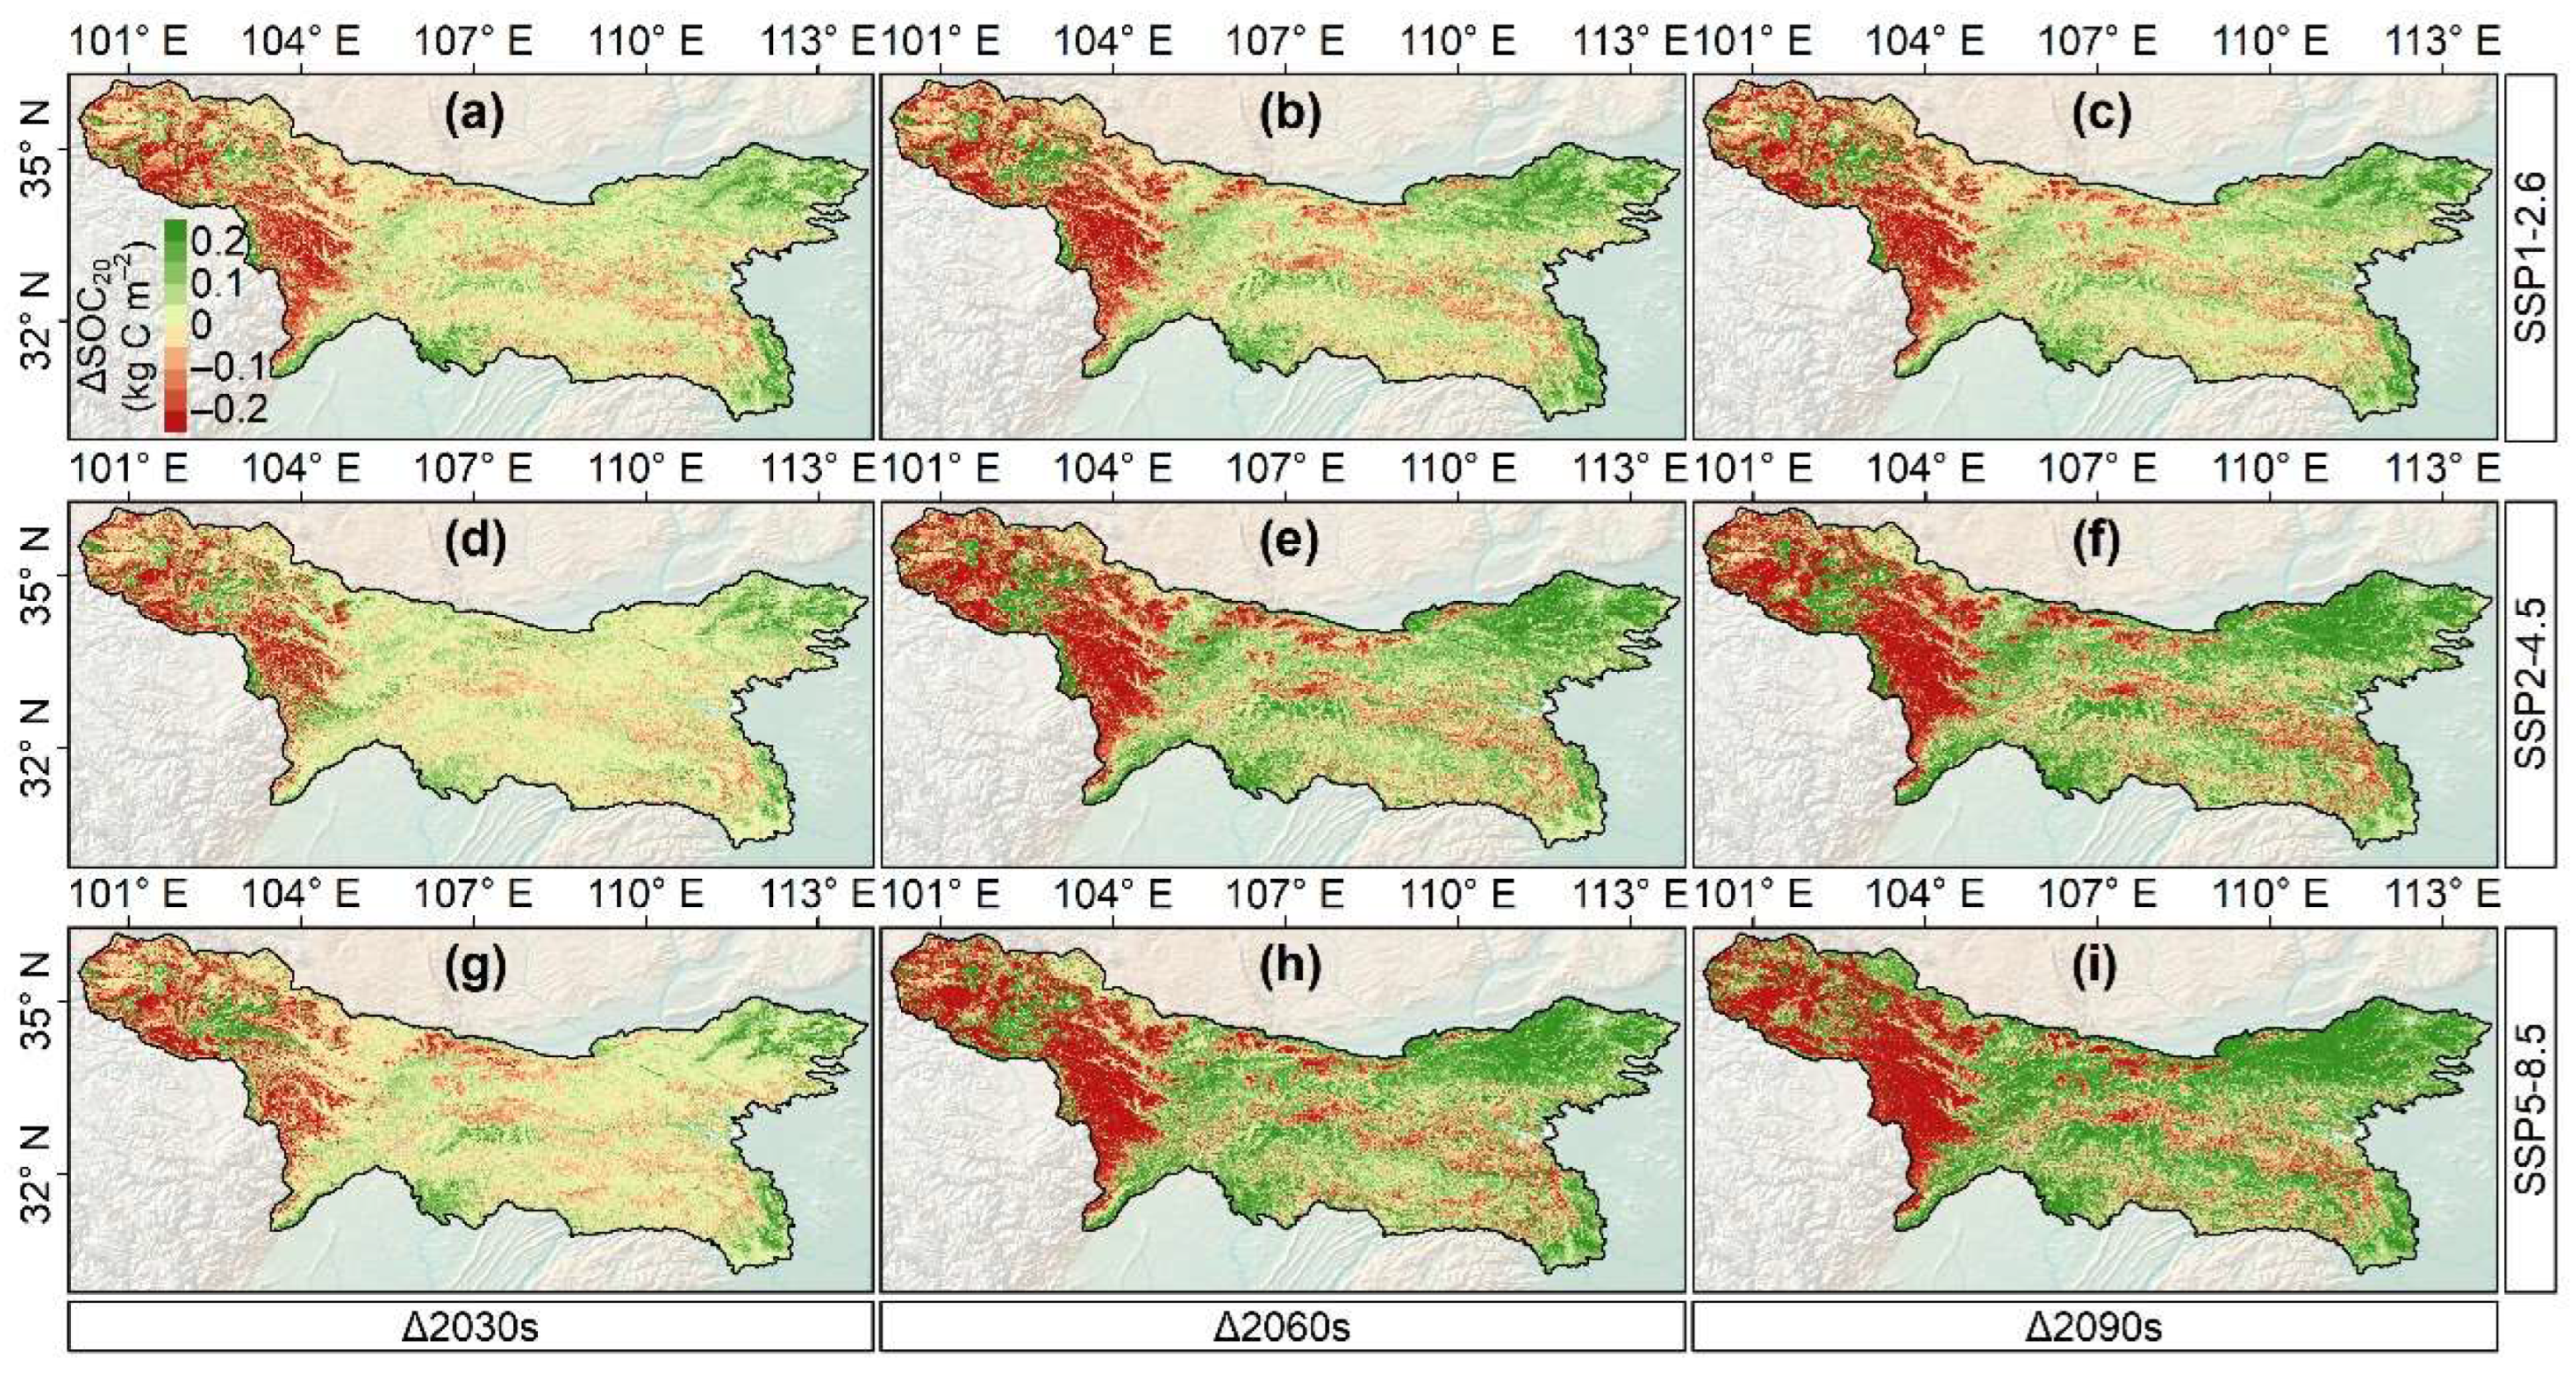
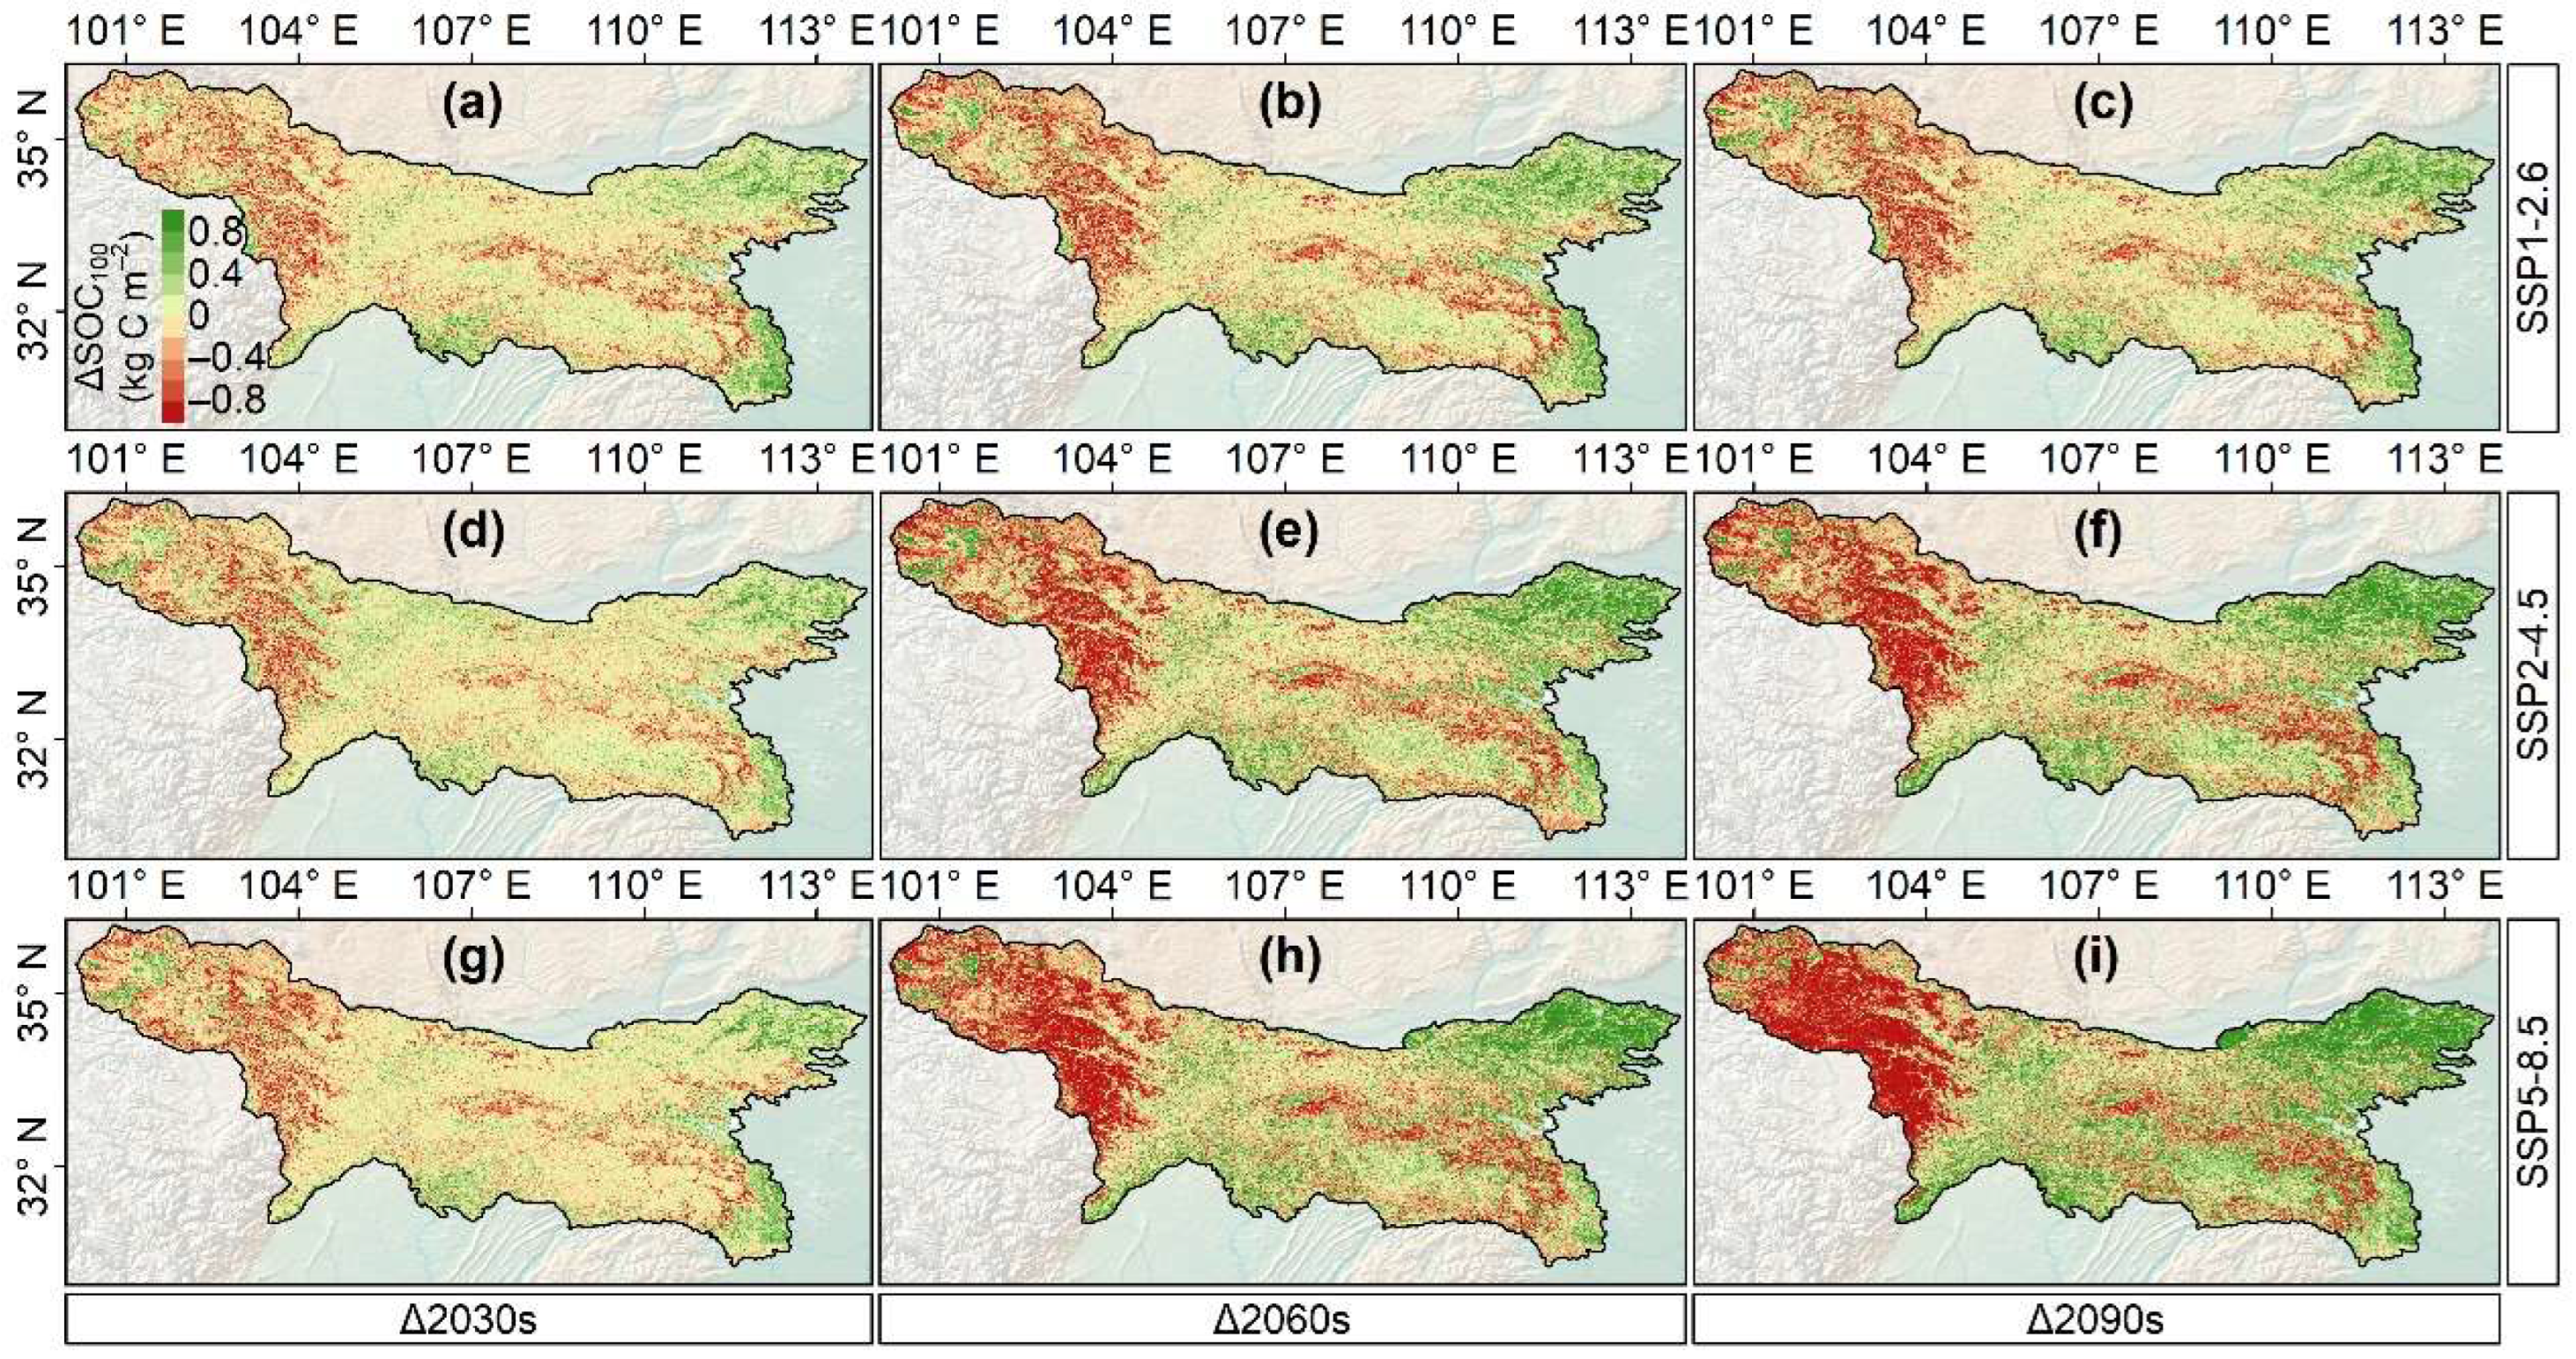
To verify whether such subtle regional changes are spatially consistent and uniform, we analyzed the spatial distribution of changes in SOC20 (ΔSOC20) and SOC100 (ΔSOC100) relative to the historical baseline (2010s) across three key future periods (2030s, 2060s, and 2090s) (Figure 8 and Figure 9). Our projections reveal that while the overall regional SOC change appears modest under future climate change, pronounced spatial heterogeneity emerges.
For ΔSOC20 (Figure 8), consistent spatial patterns were observed across all scenarios and periods. Northern and western high-elevation zones exhibit widespread SOC losses, with net reductions exceeding 0.2 kg C m−2, while southern and eastern low-elevation regions show corresponding SOC gains of up to 0.2 kg C m−2. This spatial divergence intensifies over time, particularly under the high-emission SSP5-8.5 scenario, where SOC losses in high-elevation areas become most extensive by the 2090s. Area fraction statistics (Table 5) confirm that SOC gain areas consistently outweigh loss areas for SOC20, with the proportion of gain areas increasing from 55.63%–60.93% in the 2030s to 58.74%–62.64% in the 2090s across scenarios, partially offsetting high-elevation losses at the regional scale.
For ΔSOC100 (Figure 9), the spatial pattern mirrors that of ΔSOC20 but with larger absolute changes (up to ±0.8 kg C m−2), reflecting the greater total carbon stock in deeper soils. High-elevation zones remain the primary loci of SOC loss, while low-elevation regions continue to show SOC gains. Area fraction analysis (Table 6) shows a more balanced split between loss and gain areas for SOC100, with the proportion of gain areas increasing from 46.98%–52.57% in the 2030s to 50.10%–55.33% in the 2090s, especially under the SSP5-8.5 scenario.
Across both soil layers, these results highlight that the small net change in regional mean SOC density masks a clear spatial trade-off: significant SOC losses in high-elevation areas are counterbalanced by gains in low-elevation regions, resulting in a near-neutral overall change but substantial redistribution of carbon stocks across the Qinling Mountains.

4. Discussion

4.1. Drivers of Historical SOC Dynamics in the Qinling Mountains

The robust spatiotemporal predictive performance of the Random Forest model, with R2 values of 0.81 for SOC20 and 0.73 for SOC100 across all observation periods (Figure 2), provided a solid empirical foundation for quantifying the driving mechanisms of SOC dynamics in mountainous ecosystems, using the Qinling Mountains as a representative case. Regional mean SOC density in both layers increased gradually from the 1980s to the 2010s, while SOC storage remained persistently higher in the western and central high-elevation zones than in the southern and eastern low-elevation areas (Figure 3). These patterns reflect the dominant control of topographic and hydrothermal heterogeneity over SOC distribution in complex mountain ecosystems.
At the regional scale, climate change emerged as the dominant driver governing historical SOC20 dynamics, whereas the relative contributions of climate, vegetation growth, and environmental variability became more evenly balanced in the whole 1 m soil profile (Figure 4 and Figure 5). Such vertical stratification represents a characteristic signature of soil organic carbon dynamics in complex mountain environments [11,31]. The direct regulatory influence of climatic conditions on soil carbon cycling diminishes progressively with increasing soil depth, primarily because topsoil organic matter exhibits greater thermal sensitivity to rising temperatures compared with deeper soil organic fractions [14,45]. Labile carbon compounds derived from plant detritus and surface root exudates dominate organic matter turnover in the upper soil horizon, which sustains the highest microbial abundance and diversity [46]. Correspondingly, most biologically mediated reactions occur within near-surface layers and respond rapidly to subtle climatic fluctuations [47]. By contrast, subsurface vegetation processes and the long-term cumulative impacts of environmental covariates impose stronger controls over deep soil organic carbon storage. This behavior arises mainly because root-derived inputs constitute the primary source of organic matter in deep soil layers and thereby regulate subsoil carbon dynamics [48]. Furthermore, root tissues generally decompose more slowly than surface leaf litter [49], leading to a disproportionately larger influence of vegetation activity on SOC dynamics in deeper soil horizons relative to the topsoil. This vertical dichotomy suggests that subsoil carbon dynamics are not merely governed by climatic variability, but also modulated by the long-term coupled effects of vegetation and environmental conditions. Such behavior reflects the inherently slow turnover rates and considerable carbon sequestration potential associated with deep soil carbon reservoirs [13].
Pronounced spatial heterogeneity in SOC dominant drivers and clear differences between SOC20 and SOC100 are closely associated with the spatial differentiation of hydrothermal conditions and ecosystem types across the study area, as SOC variability in mountainous regions is strongly controlled by interacting gradients of climate, vegetation, and topography [50]. High-elevation zones with low temperature and high humidity show high sensitivity to climatic variability, leading to climate-dominated SOC dynamics, as low temperatures suppress decomposition and promote SOC accumulation, making SOC stabilization in alpine environments primarily climate-controlled [50]. In contrast, warm and humid low-elevation zones support vigorous vegetation growth and enhanced biogeochemical cycling, where SOC dynamics are jointly regulated by vegetation inputs, soil properties, and environmental conditions [51]. Notably, the rarity of single-driver dominance and the prevalence of coupled controls across soil layers confirm that SOC dynamics in complex mountainous ecosystems are shaped by synergistic interactions among multiple factors, consistent with the widely accepted CLORPT framework, where climate, organisms, relief, parent material, and time jointly regulate SOC dynamics. The climate-centric coupled effects for SOC20 further highlight that climate acts as a core regulator mediating the response of topsoil carbon to vegetation and environmental changes, as temperature and moisture directly control microbial activity and organic matter turnover in surface soils [52].

4.2. Impacts of Future Climate Change and Regional Response Patterns

The Qinling Mountains show a consistent warming and wetting trend under three SSP scenarios across the 21st century, with the magnitude of change positively correlated with emission intensity (Figure 6). Though projected climatic shifts are significant, regional mean SOC density of both soil layers only fluctuates slightly (Figure 7), an observation that is incomplete without considering total SOC stock changes and spatial patterns (Figure 8 and Figure 9). Substantial declines in total SOC stock across all scenarios and periods highlight an important distinction between SOC density and stock at the regional scale. Given the large spatial extent of the study area, even modest changes in mean density can correspond to considerable losses in total stock [28]. These findings further highlight the spatial heterogeneity characteristics of SOC responses to climate change in mountainous regions, and it should be noted that the modest per-unit-area SOC density changes are accompanied by non-negligible uncertainties in simulation and projection. This finding underscores that regional SOC responses to climate change cannot be adequately evaluated using mean density alone, and that quantifying total stock dynamics is essential for capturing real-world changes in ecosystem carbon sink potential.
Pronounced spatial heterogeneity is the core cause of the small net change in regional mean SOC density, with a clear trade-off: widespread SOC losses in northern and western high-elevation zones and corresponding gains in southern and eastern low-elevation zones. This pattern derives from contrasting hydrothermal responses to warming and increased precipitation—warming-induced accelerated decomposition outweighs precipitation benefits in high-elevation zones, while moderate warming and elevated precipitation jointly boost vegetation productivity and soil carbon inputs in low-elevation zones. This pattern is consistent with the climate-induced SOC responses observed between high-elevation and low-elevation zones in the Qilian Mountains [4]. Rising proportions of SOC gain areas over time further indicate precipitation partially mitigates warming’s negative impacts, leading to a near-neutral regional carbon budget but substantial spatial redistribution of soil carbon stocks.
Larger absolute changes in ΔSOC100 than ΔSOC20 reflect that deep SOC, which accounts for a larger share of total carbon storage, has greater potential for climate-driven carbon loss and gain. This finding highlights the underrecognized importance of deep SOC in the regional carbon cycle, whose dynamic changes merit greater attention in future mountainous ecosystem carbon cycling research [14,53].

4.3. SOC Loss Risks in High-Elevation Zones and Management Implications

Consistent and pronounced SOC losses in the northern and western high-elevation Qinling Mountains across all future climate scenarios pose severe ecological and carbon sink risks to this central Chinese ecological barrier [54], with risks escalating alongside emission intensity and time. As the region’s core carbon storage areas with inherently high SOC densities, these high-elevation zones are vital to sustaining regional carbon sink function [55]. Sustained SOC loss here will directly reduce carbon sequestration capacity, disrupt soil carbon-nutrient and water cycles, impair soil fertility and ecosystem stability, and trigger secondary issues such as vegetation degradation and biodiversity loss in these fragile ecosystems [26,56].
Against global climate change and China’s carbon peaking and neutrality goals [57], targeted adaptive management strategies are urgently required to mitigate high-elevation SOC loss and preserve the Qinling Mountains’ carbon sink function [30]. First, strict ecological protection should be enforced in high-elevation core areas to eliminate human disturbances such as overgrazing and illegal logging, preserving native vegetation communities and natural carbon sequestration capacity—the most direct and effective measure to curb climate-induced SOC loss [58,59]. Second, targeted vegetation restoration should be implemented in high-elevation zones with severe SOC loss, prioritizing native cold-tolerant vegetation to boost belowground carbon inputs and offset warming-driven accelerated decomposition [60,61,62]. Third, the regional ecological monitoring network should be optimized with long-term SOC monitoring points in typical high-elevation areas, tracking real-time SOC dynamics to support adaptive management adjustment [63,64,65].
The spatial differentiation of SOC climate responses necessitates a differentiated carbon management strategy for the entire Qinling Mountains [30,66], given that the coupling strength between above- and belowground ecosystem processes and their climate responses varies markedly across environmental gradients globally [67]. In low-elevation zones with SOC gain potential, land use patterns should be optimized within ecological carrying capacity, protecting and restoring forest and grassland ecosystems to maximize carbon sequestration and offset high-elevation losses [68,69,70]. In central transitional zones governed by climate–vegetation or climate–environment coupled controls, synergistic effects of multiple factors should be harnessed to adjust vegetation structure and improve soil management, enhancing SOC storage stability [71], a strategy supported by evidence that ecosystem vertical structural complexity and soil nutrients synergistically promote ecosystem stability by optimizing water use efficiency [72]. Overall, carbon sink management for mountainous ecosystems should adopt a dual focus of mitigating high-elevation losses and enhancing low-elevation carbon sequestration, accounting for the spatial heterogeneity of SOC responses to safeguard the ecological integrity and carbon sink functions of key mountainous regions.

4.4. Limitations and Implications

This study offers valuable insights into the spatiotemporal dynamics and driving mechanisms of SOC across mountainous ecosystems, with several inherent limitations should be acknowledged. First, future SOC projections focused on temperature and precipitation, without explicitly incorporating land use change and human activities, factors that could be integrated to refine predictions. Second, climate model parameterization and scenario design uncertainties inevitably influence projections, a common challenge in regional carbon cycle studies. Third, we focused on overall SOC dynamics without distinguishing carbon pool-specific responses, which future work could address to deepen mechanistic understanding. Additionally, the adoption of a fixed SOM-to-SOC conversion coefficient across all periods may introduce minor systematic uncertainty, given natural variations in the conversion ratio with local soil and environmental conditions. Nevertheless, a unified coefficient is necessary to ensure temporal comparability owing to the lack of site- and period-specific calibrated values for historical data. Meanwhile, spatial mismatches and resolution inconsistencies between multi-source environmental grids and field measurements also bring inherent simulation uncertainty, and the relatively high accuracy of climate datasets may partly account for their dominant contribution in the model. The per-pixel changes in SOC density are generally modest and accompanied by non-negligible statistical uncertainty. In addition, scaling these small density variations to total SOC stock across the large mountainous study area inevitably introduces additional extrapolation uncertainty. Despite these limitations, the study clarifies the vertical and spatial differentiation of SOC driving mechanisms in complex mountainous ecosystems, highlights the need to integrate density, stock, and spatial heterogeneity in regional carbon assessments, and provides scientific references for ecological protection and carbon sink management under the carbon neutrality goal.
Based on the core findings and limitations of this study, we proposed some key future research directions. First, integrate multiple global change factors (e.g., land use change) into SOC simulation models to enhance the accuracy and comprehensiveness of projections. Second, combine soil carbon pool fractionation experiments with model simulations to distinguish the climate responses of different carbon pools, deepening mechanistic understanding of SOC dynamics. Third, conduct long-term in situ warming and precipitation manipulation experiments in typical high- and low-elevation zones to verify model results and reveal field-based SOC response mechanisms. Finally, adopt multi-scenario and multi-model ensemble simulations to reduce projection uncertainty, providing targeted scientific support for adaptive carbon sink management in the Qinling Mountains.

5. Conclusions

This study characterized the spatiotemporal dynamics of topsoil (0–20 cm, SOC20) and the whole 1 m soil profile (0–100 cm, SOC100) organic carbon and their responses to future climate change in the Qinling Mountains using a validated Random Forest model (R2 = 0.81 for SOC20, 0.73 for SOC100), factorial control simulations, and bias-corrected multi-model climate projections under three Shared Socioeconomic Pathway (SSP) scenarios. Results revealed spatial and depth-related differentiation of SOC driving mechanisms and key response patterns to climate change between the surface 0–20 cm layer and the integrated 0–100 cm soil profile, providing data-driven support for regional carbon sink management. Regional mean SOC density increased steadily from the 1980s to the 2010s, with SOC20 rising from 4.86 to 5.37 kg C m−2 and SOC100 from 12.97 to 13.58 kg C m−2. SOC storage was consistently higher in the western and central high-elevation zones and lower in the southern and eastern low-elevation areas, a pattern driven by inherent topographic and hydrothermal heterogeneity across the region. Climate change was the dominant driver of SOC20 dynamics, with a mean relative contribution of 43.75%, while its relative contribution decreased to 37.53% for SOC100. For SOC100, vegetation and environmental factors each accounted for approximately 31% of the variation, which reflected a weakened climatic control on SOC turnover with increasing soil depth and enhanced coupling effects of vegetation and environmental factors on deep SOC storage. Single-driver dominance of SOC dynamics was limited to just 13% of the study area and coupled two-driver regimes governed more than 70% of the region. High-elevation zones were characterized by climate-dominated SOC dynamics, whereas vegetation–environment coupling prevailed as the dominant control in low-elevation zones.
Future climate projections identified a clear warming and wetting trend in the Qinling Mountains relative to the 2000–2015 baseline, with temperature rising by 0.91–4.11 °C and precipitation by 4.5%–16.3%. Regional mean SOC density remained stable across all SSP scenarios, with SOC20 ranging from 5.34 to 5.38 kg C m−2 and SOC100 at 13.5–13.6 kg C m−2, yet substantial total SOC stock losses were detected, with SOC20 falling by −1.41 to −6.59 Tg C and SOC100 by −6.86 to −28.76 Tg C. This discrepancy stemmed from pronounced spatial heterogeneity in SOC responses. Widespread SOC losses occurred in northern and western high-elevation zones, while corresponding gains were observed in southern and eastern low-elevation zones, with SOC20 gain areas accounting for 55.63%–62.64% of the study area. Increased precipitation partially mitigated warming-induced carbon loss, resulting in a near-neutral regional carbon budget but significant spatial redistribution of soil carbon stocks. SOC100 also exhibited larger climate-driven changes than SOC20, highlighting its key role in the regional carbon cycle. Persistent SOC losses in high-elevation zones pose considerable ecological and carbon sink risks, and the spatially differentiated SOC responses require a targeted adaptive management strategy for the Qinling Mountains. Such a strategy is critical for safeguarding the ecological and carbon sink functions of mountainous ecological barriers like the Qinling Mountains under global carbon neutrality and climate goals. Our findings advance the mechanistic understanding of SOC dynamics and climatic responses across complex mountainous ecosystems worldwide and provide a scientific reference for ecological conservation and carbon sink regulation in similar mountain regions. Future research should integrate land use change and global change factors such as nitrogen deposition into simulation models, combined with in situ experiments, to further clarify SOC turnover mechanisms and reduce projection uncertainty.

Author Contributions

H.W.: Formal analysis, Investigation, Methodology, Visualization, Writing—original draft. Z.Q.: Formal analysis, Investigation, Methodology, Validation, Writing—original draft. Y.Q.: Project administration, Validation, Writing—review and editing. Y.J.: Methodology, Validation, Writing—review and editing. S.Z.: Resources, Writing—review and editing. H.L.: Conceptualization, Data curation, Funding acquisition, Methodology, Resources, Writing—original draft, Writing—review and editing. All authors have read and agreed to the published version of the manuscript.

Funding

This research was funded by the National Natural Science Foundation of China (42501375), the Natural Science Basic Research Program of Shaanxi (2025JC-YBQN-228), and the Fundamental Research Funds for the Central Universities.

Data Availability Statement

The TerraClimate dataset can be retrieved from https://www.climatologylab.org/terraclimate.html (accessed on 3 May 2025). The GLOBE dataset can be acquired at https://www.ngdc.noaa.gov/mgg/topo/globe.html (accessed on 3 May 2025). The air temperature and precipitation gridded maps are available at https://data.tpdc.ac.cn (accessed on 3 May 2025). The European Space Agency Climate Change Initiative Land Cover (ESA CCI LC) maps can be downloaded at https://www.esa-landcover-cci.org/ (accessed on 3 May 2025). The NEX-GDDP-CMIP6 dataset can be acquired at https://registry.opendata.aws/nex-gddp-cmip6 (accessed on 3 May 2025). Other primary data that support the findings of this study are available at https://doi.org/10.5061/dryad.0cfxpnw4m.

Acknowledgments

We acknowledge the providers of the open datasets used in this study for their efforts in data collection and sharing.

Conflicts of Interest

The authors declare no conflicts of interest.

References

  1. Lal, R. Soil carbon sequestration impacts on global climate change and food security. Science 2004, 304, 1623–1627. [Google Scholar] [CrossRef] [Scilit]
  2. Yu, F.; Li, C.; Yuan, Z.; Luo, Y.; Yin, Q.; Wang, Q.; Hao, Z. How do mountain ecosystem services respond to changes in vegetation and climate? An evidence from the Qinling Mountains, China. Ecol. Indic. 2023, 154, 110922. [Google Scholar] [CrossRef] [Scilit]
  3. Bangroo, S.A.; Najar, G.R.; Rasool, A. Effect of altitude and aspect on soil organic carbon and nitrogen stocks in the Himalayan Mawer Forest Range. Catena 2017, 158, 63–68. [Google Scholar] [CrossRef] [Scilit]
  4. Li, H.; Wu, Y.; Chen, J.; Zhao, F.; Wang, F.; Sun, Y.; Zhang, G.; Qiu, L. Responses of soil organic carbon to climate change in the Qilian Mountains and its future projection. J. Hydrol. 2021, 596, 126110. [Google Scholar] [CrossRef] [Scilit]
  5. Seddon, A.W.R.; Macias-Fauria, M.; Long, P.R.; Benz, D.; Willis, K.J. Sensitivity of global terrestrial ecosystems to climate variability. Nature 2016, 531, 229–232. [Google Scholar] [CrossRef] [Scilit] [PubMed]
  6. Li, C.; Yu, F.; Jiao, T.; Yan, J.; Feng, X.; Zhao, L.; Ali, A.; Li, H.; Yuan, Z. Effects of forest canopy structural complexity on productivity and its stability in the Qinling Mountains: Insights into environmental dependence. Trees For. People 2026, 24, 101197. [Google Scholar] [CrossRef] [Scilit]
  7. Zhang, L.; Xu, T.; Bai, Y.; Wiesmeier, M.; Li, H.; Huang, Y.; Liu, Y.; Xie, B.; Song, M.; Wu, J.; et al. Historical and future dynamics of soil organic carbon and driving mechanisms in mountainous soils of China. Catena 2025, 258, 109212. [Google Scholar] [CrossRef] [Scilit]
  8. Li, H.; Cao, Y.; Xiao, J.; Zhang, W.; Wu, Y.; Ali, A.; Yuan, Z. Unveiling uncertainties in soil organic carbon modeling: The critical role of climate response functions. Environ. Modell. Softw. 2025, 192, 106537. [Google Scholar] [CrossRef] [Scilit]
  9. He, S.; Hao, C. Analysis on spatial-temporal variation characteristics of climate in Qinling-Huaihe demarcation zone since 1961. Ecol. Indic. 2024, 158, 111345. [Google Scholar] [CrossRef] [Scilit]
  10. Alavi-Murillo, G.; Diels, J.; Gilles, J.; Willems, P. Soil organic carbon in Andean high-mountain ecosystems: Importance, challenges, and opportunities for carbon sequestration. Reg. Environ. Change 2022, 22, 128. [Google Scholar] [CrossRef] [Scilit]
  11. Zhang, Y.; An, C.-b.; Zhang, W.-s.; Zheng, L.-y.; Zhang, Y.-z.; Lu, C.; Liu, L.-y. Drivers of mountain soil organic carbon stock dynamics: A review. J. Soils Sediments 2023, 23, 64–76. [Google Scholar] [CrossRef] [Scilit]
  12. Crowther, T.W.; Todd-Brown, K.E.O.; Rowe, C.W.; Wieder, W.R.; Carey, J.C.; Machmuller, M.B.; Snoek, B.L.; Fang, S.; Zhou, G.; Allison, S.D.; et al. Quantifying global soil carbon losses in response to warming. Nature 2016, 540, 104–108. [Google Scholar] [CrossRef] [Scilit] [PubMed]
  13. Li, H.; Wu, Y.; Liu, S.; Xiao, J.; Zhao, W.; Chen, J.; Alexandrov, G.; Cao, Y. Decipher soil organic carbon dynamics and driving forces across China using machine learning. Glob. Change Biol. 2022, 28, 3394–3410. [Google Scholar] [CrossRef] [Scilit]
  14. Jobbágy, E.G.; Jackson, R.B. The vertical distribution of soil organic carbon and its relation to climate and vegetation. Ecol. Appl. 2000, 10, 423–436. [Google Scholar] [CrossRef]
  15. Rumpel, C.; Kögel-Knabner, I. Deep soil organic matter—A key but poorly understood component of terrestrial C cycle. Plant Soil 2011, 338, 143–158. [Google Scholar] [CrossRef] [Scilit]
  16. Wu, G.; Guo, Y.; Ren, C.; Wang, J.; Yue, M.; Fazhu, Z. Distribution of soil organic carbon content and its influencing factors in different vegetation type on the northern foot of the Qinling Mountains. Chin. J. Plant Ecol. 2025, 1. [Google Scholar] [CrossRef] [Scilit]
  17. Dorji, T.; Odeh, I.O.A.; Field, D.J.; Baillie, I.C. Digital soil mapping of soil organic carbon stocks under different land use and land cover types in montane ecosystems, Eastern Himalayas. For. Ecol. Manag. 2014, 318, 91–102. [Google Scholar] [CrossRef] [Scilit]
  18. Agaba, S.; Ferré, C.; Musetti, M.; Comolli, R. Mapping Soil Organic Carbon Stock and Uncertainties in an Alpine Valley (Northern Italy) Using Machine Learning Models. Land 2024, 13, 78. [Google Scholar] [CrossRef] [Scilit]
  19. Tajik, S.; Ayoubi, S.; Zeraatpisheh, M. Digital mapping of soil organic carbon using ensemble learning model in Mollisols of Hyrcanian forests, northern Iran. Geoderma Reg. 2020, 20, e00256. [Google Scholar] [CrossRef] [Scilit]
  20. Peplau, T.; Schroeder, J.; Gregorich, E.; Poeplau, C. Long-term geothermal warming reduced stocks of carbon but not nitrogen in a subarctic forest soil. Glob. Change Biol. 2021, 27, 5341–5355. [Google Scholar] [CrossRef] [Scilit] [PubMed]
  21. Wang, M.; Zhang, S.; Guo, X.; Xiao, L.; Yang, Y.; Luo, Y.; Mishra, U.; Luo, Z. Responses of soil organic carbon to climate extremes under warming across global biomes. Nat. Clim. Change 2024, 14, 98–105. [Google Scholar] [CrossRef] [Scilit]
  22. Védère, C.; Lebrun, M.; Honvault, N.; Aubertin, M.-L.; Girardin, C.; Garnier, P.; Dignac, M.-F.; Houben, D.; Rumpel, C. How does soil water status influence the fate of soil organic matter? A review of processes across scales. Earth-Sci. Rev. 2022, 234, 104214. [Google Scholar] [CrossRef] [Scilit]
  23. Zhao, F.; Wu, Y.; Hui, J.; Sivakumar, B.; Meng, X.; Liu, S. Projected soil organic carbon loss in response to climate warming and soil water content in a loess watershed. Carbon Balance Manag. 2021, 16, 24. [Google Scholar] [CrossRef] [Scilit]
  24. Gong, L.; Liu, G.H.; Wang, M.; Ye, X.; Wang, H.; Li, Z.S. Effects of vegetation restoration on soil organic carbon in China: A meta-analysis. Chin. Geogr. Sci. 2017, 27, 188–200. [Google Scholar] [CrossRef] [Scilit]
  25. Stockmann, U.; Adams, M.A.; Crawford, J.W.; Field, D.J.; Henakaarchchi, N.; Jenkins, M.; Minasny, B.; McBratney, A.B.; de Courcelles, V.D.; Singh, K.; et al. The knowns, known unknowns and unknowns of sequestration of soil organic carbon. Agr. Ecosyst. Environ. 2013, 164, 80–99. [Google Scholar] [CrossRef] [Scilit]
  26. Dignac, M.F.; Derrien, D.; Barre, P.; Barot, S.; Cecillon, L.; Chenu, C.; Chevallier, T.; Freschet, G.T.; Garnier, P.; Guenet, B.; et al. Increasing soil carbon storage: Mechanisms, effects of agricultural practices and proxies. A review. Agron. Sustain. Dev. 2017, 37, 14. [Google Scholar] [CrossRef] [Scilit]
  27. Jackson, R.B.; Lajtha, K.; Crow, S.E.; Hugelius, G.; Kramer, M.G.; Piñeiro, G. The Ecology of Soil Carbon: Pools, Vulnerabilities, and Biotic and Abiotic Controls. Annu. Rev. Ecol. Evol. Syst. 2017, 48, 419–445. [Google Scholar] [CrossRef] [Scilit]
  28. Li, H.; Cao, Y.; Wu, Y.; Liu, S.; Zhao, W.; Zhou, G.; Xiao, J.; Alexandrov, G.; Qiu, L. Data-driven modeling indicates projected increase in plant production confines warming-induced topsoil organic carbon change in China within a small range in the 21st Century. Sustain. Horiz. 2025, 15, 100138. [Google Scholar] [CrossRef] [Scilit]
  29. Yao, Y.; Cui, L. Vegetation Dynamics in the Qinling-Daba Mountains through Climate Warming with Land-Use Policy. Forests 2022, 13, 1361. [Google Scholar] [CrossRef] [Scilit]
  30. Yang, J.; Ma, H.; Yu, Q.; Song, T.; Ji, W.; Feng, C. Analysis of Land Use and Carbon Storage Dynamics Change in the Qinling-Daba Mountains. Land 2026, 15, 487. [Google Scholar] [CrossRef] [Scilit]
  31. Li, C.; Xiao, C.; Li, M.; Xu, L.; He, N. A global synthesis of patterns in soil organic matter and temperature sensitivity along the altitudinal gradient. Front. Environ. Sci. 2022, 10, 959292. [Google Scholar] [CrossRef] [Scilit]
  32. National Soil Survey Office. China Soil Series, Volume I; China Agricultural Press: Beijing, China, 1993.
  33. National Soil Survey Office. China Soil Series, Volumes II–III; China Agricultural Press: Beijing, China, 1994.
  34. National Soil Survey Office. China Soil Series, Volume IV–V; China Agricultural Press: Beijing, China, 1995.
  35. National Soil Survey Office. China Soil Series, Volume VI; China Agricultural Press: Beijing, China, 1996.
  36. Xu, L.; Yu, G.; He, N.; Wang, Q.; Gao, Y.; Wen, D.; Li, S.; Niu, S.; Ge, J. Carbon storage in China’s terrestrial ecosystems: A synthesis. Sci. Rep. 2018, 8, 2806. [Google Scholar] [CrossRef] [Scilit] [PubMed]
  37. Chen, Z.; Chen, L.; Lu, R.; Lou, Z.; Zhou, F.; Jin, Y.; Xue, J.; Guo, H.; Wang, Z.; Wang, Y.; et al. A national soil organic carbon density dataset (2010–2024) in China. Sci. Data 2025, 12, 1480. [Google Scholar] [CrossRef] [Scilit]
  38. Hastings, D. The Global Land One-km Base Elevation (GLOBE) digital elevation model, version 1.0. NOAA, National Geophysical Data Center, digital media. IGBP Newsl. 1996, 11–12. Available online: http://www.ngdc.noaa.gov/mgg/topo/globe.html (accessed on 3 May 2025).
  39. Hengl, T.; de Jesus, J.M.; Heuvelink, G.B.M.; Gonzalez, M.R.; Kilibarda, M.; Blagotic, A.; Shangguan, W.; Wright, M.N.; Geng, X.Y.; Bauer-Marschallinger, B.; et al. SoilGrids250m: Global gridded soil information based on machine learning. PLoS ONE 2017, 12, e0169748. [Google Scholar] [CrossRef] [Scilit]
  40. Peng, S.; Ding, Y.; Liu, W.; Li, Z. 1 km monthly temperature and precipitation dataset for China from 1901 to 2017. Earth Syst. Sci. Data 2019, 11, 1931–1946. [Google Scholar] [CrossRef] [Scilit]
  41. Abatzoglou, J.T.; Dobrowski, S.Z.; Parks, S.A.; Hegewisch, K.C. Data Descriptor: TerraClimate, a high-resolution global dataset of monthly climate and climatic water balance from 1958–2015. Sci. Data 2018, 5, 170191. [Google Scholar] [CrossRef] [Scilit]
  42. Running, S.; Zhao, M. MODIS/Terra Net Primary Production Gap-Filled Yearly L4 Global 500m SIN Grid V061 [Data Set]; NASA Land Processes Distributed Active Archive Center: Sioux Falls, SD, USA, 2021. [CrossRef]
  43. Li, H.; Wu, Y.; Liu, S.; Xiao, J. Regional contributions to interannual variability of net primary production and climatic attributions. Agr. For. Meteorol. 2021, 303, 108384. [Google Scholar] [CrossRef] [Scilit]
  44. Fick, S.E.; Hijmans, R.J. WorldClim 2: New 1-km spatial resolution climate surfaces for global land areas. Int. J. Climatol. 2017, 37, 4302–4315. [Google Scholar] [CrossRef] [Scilit]
  45. Walz, J.; Knoblauch, C.; Bohme, L.; Pfeiffer, E.M. Regulation of soil organic matter decomposition in permafrost-affected Siberian tundra soils—Impact of oxygen availability, freezing and thawing, temperature, and labile organic matter. Soil. Biol. Biochem. 2017, 110, 34–43. [Google Scholar] [CrossRef] [Scilit]
  46. Liebner, S.; Harder, J.; Wagner, D. Bacterial diversity and community structure in polygonal tundra soils from Samoylov Island, Lena Delta, Siberia. Int. Microbiol. 2008, 11, 195–202. [Google Scholar] [CrossRef] [Scilit]
  47. Knapp, A.K.; Beier, C.; Briske, D.D.; Classen, A.T.; Luo, Y.; Reichstein, M.; Smith, M.D.; Smith, S.D.; Bell, J.E.; Fay, P.A.; et al. Consequences of More Extreme Precipitation Regimes for Terrestrial Ecosystems. Bioscience 2008, 58, 811–821. [Google Scholar] [CrossRef] [Scilit]
  48. Nepstad, D.C.; Decarvalho, C.R.; Davidson, E.A.; Jipp, P.H.; Lefebvre, P.A.; Negreiros, G.H.; Dasilva, E.D.; Stone, T.A.; Trumbore, S.E.; Vieira, S. The Role of Deep Roots in the Hydrological and Carbon Cycles of Amazonian Forests and Pastures. Nature 1994, 372, 666–669. [Google Scholar] [CrossRef] [Scilit]
  49. Rasse, D.P.; Rumpel, C.; Dignac, M.F. Is soil carbon mostly root carbon? Mechanisms for a specific stabilisation. Plant Soil 2005, 269, 341–356. [Google Scholar] [CrossRef] [Scilit]
  50. Bonfanti, N.; Choler, P.; Khedim, N.; Clément, J.-C.; Barré, P.; Goury, R.; Baudin, F.; Cécillon, L.; Saillard, A.; Thuiller, W.; et al. Drivers of soil organic carbon stocks and stability along elevation gradients. Geoderma 2025, 461, 117452. [Google Scholar] [CrossRef] [Scilit]
  51. Devi, A.S. Influence of trees and associated variables on soil organic carbon: A review. J. Ecol. Environ. 2021, 45, 5. [Google Scholar] [CrossRef] [Scilit]
  52. Li, Y.; Wang, X.; Zhang, Y.; Zhao, Y.; Zhu, H.; Duan, W.; Li, L.; Qian, L.; Niu, Z. Depth-dependent drivers of soil organic carbon thermal stability across Tibetan alpine grasslands. Catena 2025, 260, 109458. [Google Scholar] [CrossRef] [Scilit]
  53. Hicks Pries, C.E.; Ryals, R.; Zhu, B.; Min, K.; Cooper, A.; Goldsmith, S.; Pett-Ridge, J.; Torn, M.; Berhe, A.A. The Deep Soil Organic Carbon Response to Global Change. Annu. Rev. Ecol. Evol. Syst. 2023, 54, 375–401. [Google Scholar] [CrossRef] [Scilit]
  54. Liu, Y.; Yu, H. Climate Change-Driven Spatiotemporal Dynamics of Landscape Ecological in the Qinling Mountains (1980–2023). Land 2025, 14, 1008. [Google Scholar] [CrossRef] [Scilit]
  55. Lian, Y.; He, Y.; Wang, L.; Wu, Y.; Wang, Y.; Xu, Z.; Xu, X.; Wang, L. Spatiotemporal Dynamics of Forest Carbon Sinks in China’s Qinba Mountains: Insights from Sun-Induced Chlorophyll Fluorescence Remote Sensing. Remote Sens. 2025, 17, 1418. [Google Scholar] [CrossRef] [Scilit]
  56. Ramesh, T.; Bolan, N.S.; Kirkham, M.B.; Wijesekara, H.; Kanchikerimath, M.; Rao, C.S.; Sandeep, S.; Rinklebe, J.; Ok, Y.S.; Choudhury, B.U.; et al. Soil organic carbon dynamics: Impact of land use changes and management practices: A review. Adv. Agron. 2019, 156, 1–107. [Google Scholar] [CrossRef] [Scilit]
  57. Wang, F.; Harindintwali, J.D.; Yuan, Z.; Wang, M.; Wang, F.; Li, S.; Yin, Z.; Huang, L.; Fu, Y.; Li, L.; et al. Technologies and perspectives for achieving carbon neutrality. Innovation 2021, 2, 100180. [Google Scholar] [CrossRef] [Scilit]
  58. Yang, Y.-s.; Zhang, F.-w.; Xie, X.-r.; Wang, J.-b.; Li, Y.-n.; Huang, X.-t.; Li, H.-t.; Zhou, H.-k. Effects of long-term grazing exclusion on vegetation structure, soil water holding capacity, carbon and nitrogen sequestration capacity in an alpine meadow on the Tibetan Plateau. J. Mt. Sci. 2023, 20, 779–791. [Google Scholar] [CrossRef] [Scilit]
  59. Dai, L.; Fu, R.; Guo, X.; Du, Y.; Lin, L.; Zhang, F.; Li, Y.; Cao, G. Long-term grazing exclusion greatly improve carbon and nitrogen store in an alpine meadow on the northern Qinghai-Tibet Plateau. Catena 2021, 197, 104955. [Google Scholar] [CrossRef] [Scilit]
  60. Bai, Y.; Ma, L.; Degen, A.A.; Rafiq, M.K.; Kuzyakov, Y.; Zhao, J.; Zhang, R.; Zhang, T.; Wang, W.; Li, X.; et al. Long-term active restoration of extremely degraded alpine grassland accelerated turnover and increased stability of soil carbon. Glob. Change Biol. 2020, 26, 7217–7228. [Google Scholar] [CrossRef] [Scilit]
  61. Zhou, X.; Chen, X.; Yang, K.; Guo, X.; Liu, G.; Zhuang, G.; Zheng, G.; Fortin, D.; Ma, A. Vegetation restoration in an alpine meadow: Insights from soil microbial communities and resource limitation across soil depth. J. Environ. Manag. 2024, 360, 121129. [Google Scholar] [CrossRef] [Scilit]
  62. Hu, P.-L.; Liu, S.-J.; Ye, Y.-Y.; Zhang, W.; Wang, K.-L.; Su, Y.-R. Effects of environmental factors on soil organic carbon under natural or managed vegetation restoration. Land Degrad. Dev. 2018, 29, 387–397. [Google Scholar] [CrossRef] [Scilit]
  63. Nerger, R.; Klüver, K.; Cordsen, E.; Fohrer, N. Intensive long-term monitoring of soil organic carbon and nutrients in Northern Germany. Nutr. Cycl. Agroecosyst. 2020, 116, 57–69. [Google Scholar] [CrossRef] [Scilit]
  64. Lepistö, A.; Futter, M.N.; Kortelainen, P. Almost 50 years of monitoring shows that climate, not forestry, controls long-term organic carbon fluxes in a large boreal watershed. Glob. Change Biol. 2014, 20, 1225–1237. [Google Scholar] [CrossRef] [Scilit] [PubMed]
  65. Broeg, T.; Don, A.; Wiesmeier, M.; Scholten, T.; Erasmi, S. Spatiotemporal Monitoring of Cropland Soil Organic Carbon Changes From Space. Glob. Change Biol. 2024, 30, e17608. [Google Scholar] [CrossRef] [Scilit]
  66. Xu, X.; Lin, D.; Yang, Y.; Liu, J.; Zou, C.; Lin, N.; Jiao, F.; Wu, Q.; Qiu, J.; Zhang, K. Identification of degradation risk areas and delineation of key ecological function areas in Qinling region. Sci. Rep. 2025, 15, 4374. [Google Scholar] [CrossRef] [Scilit]
  67. Meng, Z.; Li, H.; Wu, Y.; Reich, P.B.; Eisenhauer, N.; Abalos, D.; Revillini, D.; Liu, S.; Yan, W.; Chen, J.; et al. Coupled Above- and Belowground Ecosystem Stability Worldwide. Adv. Sci. 2026, e17411. [Google Scholar] [CrossRef] [Scilit] [PubMed]
  68. Ding, E.; Shen, F.; Du, T.; Ren, X.; Wang, S.; Zhao, L.; Hu, L.; Yang, J.; Hu, Y.; Shen, W. Critical role of mid-elevation in microbial regulation of soil carbon dynamics on the southern foothills of the Qinling Mountains. Catena 2025, 260, 109429. [Google Scholar] [CrossRef] [Scilit]
  69. Luo, L.; Yin, C.; Liu, X. Study on the ecological restoration zoning and strategy of the West Qinling Mountains. Sci. Rep. 2025, 16, 508. [Google Scholar] [CrossRef] [Scilit]
  70. Luo, L.; Yin, C.; Liu, X. Habitat Quality and Degradation in the West Qinling Mountains, China: From Spatiotemporal Assessment to Sustainable Management (1990–2020). Sustainability 2025, 17, 9700. [Google Scholar] [CrossRef] [Scilit]
  71. Li, Z.; Lu, Y.; Wang, Y.; Liu, J. The Spatio-Temporal Evolution of the Soil Conservation Function of Ecosystems in the North–South Transition Zone in China: A Case Study of the Qinling-Daba Mountains. Sustainability 2022, 14, 5829. [Google Scholar] [CrossRef] [Scilit]
  72. Cao, Y.; Hao, X.; Yu, F.; Wang, R.; Li, H. Ecosystem vertical structural complexity and soil nutrition synergistically enhance extreme drought resistance via water use efficiency in the Yangtze River Basin. J. Environ. Manag. 2026, 404, 129444. [Google Scholar] [CrossRef] [Scilit]
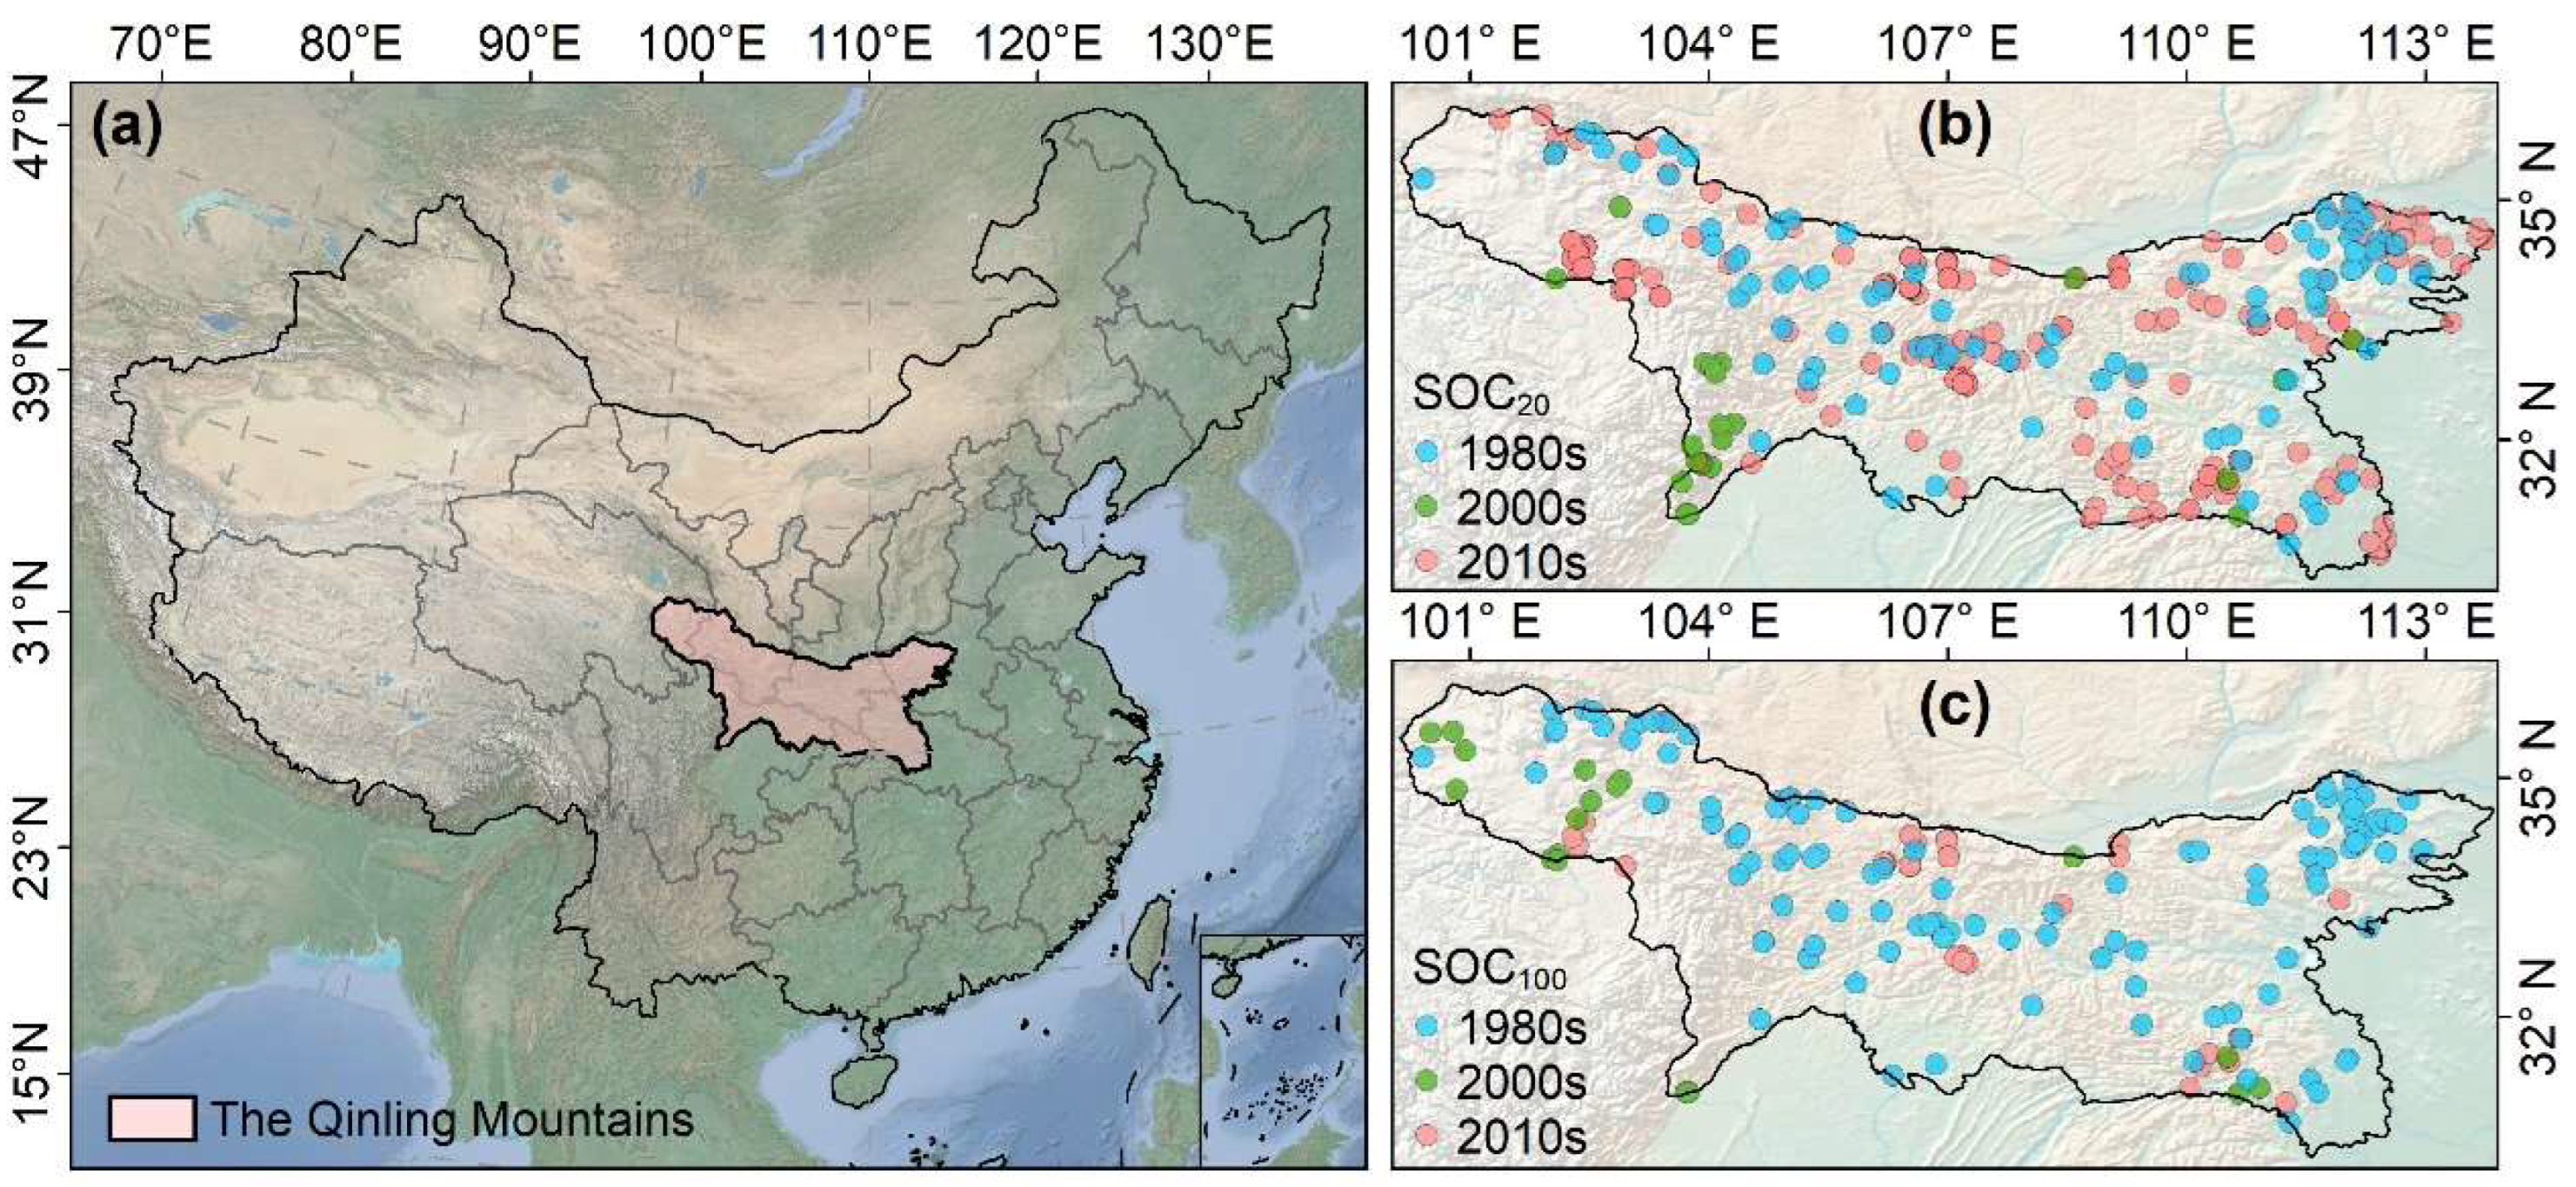
Figure 1. Location of the study area and spatial distribution of soil organic carbon (SOC) observations in the Qinling Mountains. (a) The location of the Qinling Mountains within China; (b) Spatial distribution of SOC observations at 0–20 cm depth (SOC20) across the Qinling Mountains, with sampling points categorized by the 1980s, 2000s, and 2010s; (c) Spatial distribution of SOC observations at 0–100 cm depth (SOC100) across the Qinling Mountains, with sampling points categorized by the 1980s, 2000s, and 2010s.
Forests 17 00581 g001
Figure 2. Validation of simulated soil organic carbon (SOC) against in situ measurements in the Qinling Mountains. (a) Comparison between estimated and measured SOC at 0–20 cm depth (SOC20) for the 1980s, 2000s, 2010s, and all periods; (b) Comparison between estimated and measured SOC at 0–100 cm depth (SOC100) for the 1980s, 2000s, 2010s, and all periods. The coefficients of determination (R2) are shown for each individual period (1980s, 2000s, and 2010s) and for all combined data (R2all) to illustrate model performance. Full statistical metrics, including R2, RMSE, and PB, are provided in Table 2.
Forests 17 00581 g002
Figure 3. Spatial distribution of simulated soil organic carbon (SOC) in the Qinling Mountains across different periods. (ac) Spatial patterns of SOC at 0–20 cm depth (SOC20) in the 1980s, 2000s, and 2010s, respectively; (df) Spatial patterns of SOC at 0–100 cm depth (SOC100) in the 1980s, 2000s, and 2010s, respectively.
Forests 17 00581 g003
Figure 4. Spatial patterns of relative contributions and dominant drivers of soil organic carbon (SOC) dynamics across two soil layers in the Qinling Mountains. (a,b) Relative contributions of climate change (Cli), vegetation growth (Veg), and environmental variation (Env) to SOC dynamics at 0–20 cm (SOC20) and 0–100 cm (SOC100) depths; (c,d) Spatial distribution of dominant drivers and their coupled effects on SOC20 and SOC100 dynamics, where C, V, and E denote climate, vegetation, and environmental drivers, respectively, and their combinations represent coupled dominant impacts with the leading driver listed first.
Forests 17 00581 g004
Figure 5. Mean relative contributions and dominant driver area fractions for soil organic carbon (SOC) dynamics across two soil layers in the Qinling Mountains. (a) Mean relative contributions (%) of climate, vegetation, and environmental drivers to SOC dynamics at 0–20 cm (SOC20) and 0–100 cm (SOC100) depths, with error bars representing the standard deviation across the entire study area. (b,c) Dominant factor area ratios (%) of single and coupled drivers for SOC20 (b) and SOC100 (c) dynamics. Here, C, V, and E denote climate, vegetation, and environmental drivers, respectively. Combinations of these letters (e.g., CV, CE, VC) represent coupled dominant impacts, where the first letter indicates the driver with the larger relative contribution within the pair (e.g., CV signifies climate–vegetation coupling with climate as the leading driver).
Forests 17 00581 g005
Figure 6. Historical and projected changes in temperature and precipitation over the Qinling Mountains under three Shared Socioeconomic Pathways (SSP) scenarios. (a) Time series of annual mean temperature under three SSP scenarios: SSP1-2.6, SSP2-4.5, and SSP5-8.5. The black line denotes the historical baseline period (2000–2015), while colored lines represent future projections. Shaded areas indicate the inter-model standard deviation across Global Circulation Models (GCMs). Upward arrows show absolute temperature changes (°C) relative to the baseline for the near-term (2020–2060) and long-term (2060–2100) periods. (b) As in (a), but for annual mean precipitation, with changes expressed as relative percentage (%) relative to the historical baseline.
Forests 17 00581 g006
Figure 7. Temporal changes in soil organic carbon (SOC) density under historical and future climate scenarios across two soil layers in the Qinling Mountains. (a) Time series of SOC density at 0–20 cm depth (SOC20) from the 2010s to the 2090s. The gray bar represents the historical period (2010s), while colored bars denote future projections under three Shared Socioeconomic Pathways (SSP) climate scenarios. Error bars denote the standard deviation across simulations driven by multiple GCM inputs. (b) As in (a), but for SOC density at 0–100 cm depth (SOC100).
Forests 17 00581 g007
Figure 8. Spatial patterns of changes in 0–20 cm soil organic carbon (ΔSOC20) under three Shared Socioeconomic Pathways (SSP) scenarios for future key periods (2030s, 2060s, and 2090s) relative to the historical baseline (2010s). (ac) ΔSOC20 under SSP1-2.6 in the 2030s, 2060s, and 2090s, respectively; (df) ΔSOC20 under SSP2-4.5 in the 2030s, 2060s, and 2090s, respectively; (gi) ΔSOC20 under SSP5-8.5 in the 2030s, 2060s, and 2090s, respectively.
Forests 17 00581 g008
Figure 9. Spatial patterns of changes in 0–100 cm soil organic carbon (ΔSOC100) under three Shared Socioeconomic Pathways (SSP) scenarios for future key periods (2030s, 2060s, and 2090s) relative to the historical baseline (2010s). (ac) ΔSOC100 under SSP1-2.6 in the 2030s, 2060s, and 2090s, respectively; (df) ΔSOC100 under SSP2-4.5 in the 2030s, 2060s, and 2090s, respectively; (gi) ΔSOC100 under SSP5-8.5 in the 2030s, 2060s, and 2090s, respectively.
Forests 17 00581 g009
Table 1. Detailed information on driving variables for SOC simulation.
CategoriesFeaturesResolutionsResources #
SoilClay content250 mSoilGrids [39]
Silt content
Sand content
Soil type1:1 millionREDCP (www.resdc.cn)
TerrainElevation1 kmGLOBE [38]
Slope
Aspect
ClimateAir temperature1/120°[40] (https://data.tpdc.ac.cn)
Precipitation
Solar radiation4 kmTerraClimate [41]
Humidity index4 km[40] (https://data.tpdc.ac.cn)
& TerraClimate [41]
VegetationNet primary production1 kmMOD17 [42] & CASA [43]
Land use and land cover300 mESA CCI (https://www.esa-landcover-cci.org/)
EnvironmentFertilizer (Nitrogen)0.5°SEDAC & National statistical investigation (https://data.cnki.net/)
CO2/Observations in Mauna Loa (https://gml.noaa.gov/)
Nitrogen deposition0.5°North American Carbon Program
# REDCP is the Resource and Environment Data Cloud Platform; GLOBE is the Global Land One-km Base Elevation Project; MOD17 is the Moderate Resolution Imaging Spectroradiometer MOD17A3HGF Version 6.1 product; CASA is the Carnegie-Ames-Stanford Approach (CASA) model; ESA is the European Space Agency Climate Change Initiative (ESA CCI) Land Cover dataset; SEDAC is the Socioeconomic Data and Applications Center.
Table 2. Statistical comparison between simulated and measured soil organic carbon (SOC) for two soil layers across different periods.
SOC in 0–20 cm (SOC20)SOC in 0–100 cm (SOC100)
R2RMSE
(kg C m−2)
PB (%)R2RMSE
(kg C m−2)
PB (%)
1980s0.781.1625.13%0.734.02−4.83%
2000s0.801.7611.40%0.774.5516.75%
2010s0.811.5512.53%0.793.8519.50%
All0.811.4814.56%0.734.016.86%
Table 3. Total change in SOC20 stock (Tg C) under three Shared Socioeconomic Pathways (SSP) scenarios for future key periods relative to the historical baseline (2010s).
Total Change in SOC20 (Tg C)
SSP1-2.6SSP2-4.5SSP5-8.5
2030s−4.54−1.41−3.84
2060s−2.87−5.87−6.59
2090s−4.47−4.25−3.60
Table 4. Total change in SOC100 stock (Tg C) under three Shared Socioeconomic Pathways (SSP) scenarios for future key periods relative to the historical baseline (2010s).
Total change in SOC100 (Tg C)
SSP1-2.6SSP2-4.5SSP5-8.5
2030s−13.58−6.86−15.60
2060s−9.52−18.25−28.76
2090s−13.53−18.09−11.89
Table 5. Percentage of area with SOC20 loss and gain under three Shared Socioeconomic Pathways (SSP) scenarios for future key periods relative to the historical baseline (2010s).
SSP1-2.6SSP2-4.5SSP5-8.5
SOC20 Decrease Area (%)SOC20 Increase Area (%)SOC20 Decrease Area (%)SOC20 Increase Area (%)SOC20 Decrease Area (%)SOC20 Increase Area (%)
2030s44.33%55.63%39.02%60.93%43.14%56.81%
2060s41.93%58.02%40.17%59.78%39.58%60.37%
2090s41.21%58.74%39.12%60.83%37.32%62.64%
Table 6. Percentage of area with SOC100 loss and gain under three Shared Socioeconomic Pathways (SSP) scenarios for future key periods relative to the historical baseline (2010s).
SSP1-2.6SSP2-4.5SSP5-8.5
SOC100 Decrease Area (%)SOC100 Increase Area (%)SOC100 Decrease Area (%)SOC100 Increase Area (%)SOC100 Decrease Area (%)SOC100 Increase Area (%)
2030s50.52%49.48%47.43%52.57%53.01%46.98%
2060s49.35%50.65%48.84%51.16%50.34%49.66%
2090s49.90%50.10%47.89%52.11%44.6755.33%
Disclaimer/Publisher’s Note: The statements, opinions and data contained in all publications are solely those of the individual author(s) and contributor(s) and not of MDPI and/or the editor(s). MDPI and/or the editor(s) disclaim responsibility for any injury to people or property resulting from any ideas, methods, instructions or products referred to in the content.